Abstract
In the frame of the H2020 MORE&LESS project co-funded by European Commission, a test campaign for a hypersonic vehicle demonstrator took place at the INCAS Trisonic Facility. CFD analysis was used to quantify the effects of the wind tunnel model support, the closed engine nacelle, and to perform the Reynolds number extrapolation. Three sets of simulations were used in order to generate the corrections. The wind tunnel configuration with sting, sting cavity, and closed nacelle was used as the baseline, with the aim of matching the experimental results as precisely as possible. A configuration with a flow-through nacelle and the shock cone in the appropriate position for each Mach number and no sting or cavity was used to determine the effect of the sting and the closed nacelle. For the Reynolds extrapolation, a 1:1 model was used, with the boundary conditions deriving from the theoretical trajectory of the vehicle. The CFD results for the wind tunnel configuration closely align with the experimental data. Significant differences between the three configurations can be observed just for the pitching moment, and those are caused by the presence of the sting and the open nacelle. The difference in Reynolds number does not seem to have a significant effect on the aerodynamic coefficients.
1. Introduction
Wind tunnel testing remains a vital component in delivering high-quality data regarding aerodynamic forces and moments, despite important steps forward made in the field of computational fluid dynamics (CFD). Experimental measurements are affected by a number of factors, including a different Reynolds number, model support, wind tunnel walls, and possible alterations made to the model in order to facilitate testing. The last factor may include changes in part thickness, nacelle internal flow path, leading or trailing edge radius, and/or thickness for technological reasons, etc. Because data is needed for the flight configuration of the vehicle, experimental results require a number of corrections.
The aim of the present work is to study the aerodynamic interference effects caused by a single wind tunnel model support and a closed engine nacelle and to perform the Reynolds number extrapolation. During wind tunnel tests, the model is held in the test section by a support system (sting). When designing the sting, two opposing criteria must be considered: It must withstand the loads that will be generated during the runs and also be as small and discreet as possible in order to keep the aerodynamic interference at a minimum. Additionally, the sting must provide enough internal space for the balance wiring and possible pressure taps tubes. The size and shape of the sting can have a strong effect on the flow properties around the model [1,2] and can lead to significant changes in forces and moments. Sting interference can be split into two categories: Near-field and far-field effects [3,4]. Far-field effects are attributed to the permanent support structure (strut) in the wind tunnel on which the sting is mounted. Near-field effects are caused by the presence of the sting close to the model. The cavity needed for the sting mounting contributes to such near-field interference. There is a significant body of literature focused on error sources and corrections for wind tunnel walls and support systems [1,5]. It is possible to account for the influence of the model support by using a dummy sting [3,6]. The model is held by a different support, and measurements are made with and without the dummy sting. The difference between the two cases represents the sting influence. This experimental approach requires a second support system for the wind tunnel model, added complexity to the model, and a greater number of runs. Several initiatives [7,8,9] focused on the possibility of using high-fidelity numerical simulations to better understand and predict the aerodynamic interference caused by the presence of the sting. More recent studies include Waldmann et al. [10], Wubben et al. (including wall effects) [3], Russo et al. [11].
If a configuration to be tested in the wind tunnel has an engine nacelle, it is common practice to design it as a flow-through nacelle in order to reduce the unwanted aerodynamic effects. Due to design and manufacturing constraints, it may not be possible to ensure an internal flow path, so a closed, streamlined nacelle is chosen.
The main goal of the wind tunnel testing and support CFD activities is to predict the aerodynamic characteristics of the aircraft in free flight conditions. It is, however, a challenging task because most of the testing is usually performed in sub-scale conditions. An investigation of the Reynolds number effects can be done in the wind tunnel, but the cost increase is substantial [5]. CFD can be used to generate an aerodynamic database at flight and wind tunnel Reynolds numbers, from which corrections can be generated and applied to the aerodynamic coefficients.
2. Problem Description
A test campaign for a hypersonic concept vehicle has been carried out in the INCAS Trisonic Facility, within the H2020 MORE&LESS project. The vehicle is equipped with a low-mounted delta wing, canards, and V-tail. A rocket engine is housed inside the rear fuselage, and an experimental air-breathing engine is situated in the nacelle mounted on the upper fuselage. The wind tunnel model was equipped with an internal strain gauge balance, which measures the three forces and the three moments, and was mounted on a sting. A bent sting was used for the runs that include a sideslip angle (AoS) of 10° (Figure 1).
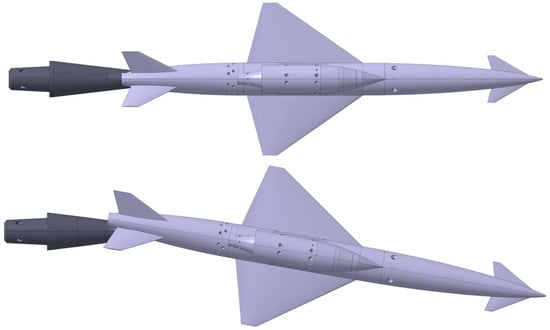
Figure 1.
Straight (top) and bent (bottom) sting for the wind tunnel model.
The experimental data were obtained at Reynolds numbers ranging from 11 to 33 million (based on wind tunnel model length), while the reference trajectory of the vehicle specifies flight Reynolds numbers from 170 to 410 million. The initial design of the model included a flow-through nacelle (Figure 2), but further CFD investigations revealed a strong possibility of chocked flow caused by the support structure of the shock cone (i.e., the inlet spike) and the exhaust components.
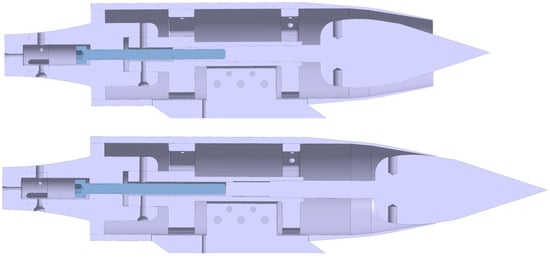
Figure 2.
Internal structure of the model nacelle in the flow-through configuration (top) and closed configuration (bottom).
A decision was made to close the nacelle by moving the shock cone to the most forward position (Figure 2). This nacelle configuration was used at all Mach numbers. CFD was employed to account for the aerodynamic interference caused by the sting and the sting cavity, the closed nacelle, and to perform the Reynolds number extrapolation.
3. Experimental Setup
3.1. Wind Tunnel Description
The Trisonic Wind Tunnel (Figure 3) represents the most advanced experimental capability that INCAS possesses [12]. It has been operational since 1978, and in more than 40 years of service, around 150 projects have been developed using the wind tunnel. Apart from the measurement of forces, moments, and pressure distributions, during its lifetime, the tunnel was used for a number of special projects involving base bleed tests, half models, intake tests with flow control, parachute deployment tests, and many others.
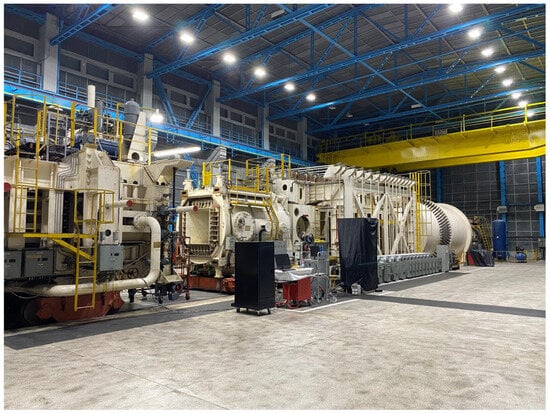
Figure 3.
The Trisonic Wind Tunnel at INCAS.
The wind tunnel is of the blowdown type with a 1.2 m × 1.2 m test section and a speed range varying from low subsonic (M = 0.1) to a maximum supersonic Mach number of 3.5 (Figure 4). The transonic Mach numbers included in this range are obtained through the use of a transonic test section with perforated walls that is incorporated into the circuit when required. During a run, the stagnation temperature remains at approximately 20 °C and the control valve is operated to maintain a constant stagnation pressure.
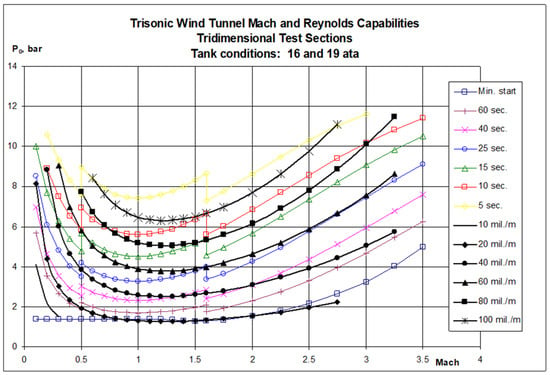
Figure 4.
The Trisonic Wind Tunnel stagnation pressure vs. Mach capability.
The wind tunnel is supplied by the compressor plant with 400 m3/min of filtered and dried air at a maximum pressure of 20 bar and at a temperature of 20 °C. At the beginning of a run, the air from the storage tanks flows into the settling chamber. The control valve regulates the flow in order to maintain the target total pressure in the settling chamber. The turbulence levels are reduced to acceptably low [12] levels by the use of baffles and screens. Then the air is accelerated in the nozzle and reaches the desired test section Mach number. After the test section, the air is slowed down in the variable and fixed diffusers, then is finally discharged through the exhaust silencer into the atmosphere.
3.2. Wind Tunnel Model
The scale of the wind tunnel model, 1:28 (Table 1), was determined by complying with the available strain gauge balances in terms of capacity and overall dimensions in order to ensure enough room within the model with a reasonable wall thickness to allow a safe lock and robustness.

Table 1.
Geometrical characteristics for the full-size vehicle and the wind tunnel model.
As depicted in Figure 5, a fine layer of carborundum grit (60 μm) was added as a tripping device located on the lower/upper surfaces of the wing (5% wing chord), V-tail (5% of tail chord), and fuselage nose (half the distance between nose and canard root).
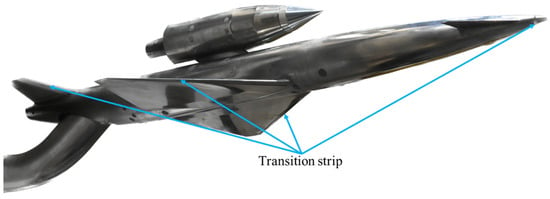
Figure 5.
CS-2 wind tunnel model with transition strips.
3.3. Wind Tunnel Testing
The wind tunnel test matrix for AoS = 0° is depicted in Table 2. 21 runs covered the experimental program, including runs for repeatability and flow angularity. Schlieren visualization was used for Mach numbers 1.6 and up. The average duration of a test run was 25 s. Initially, the model was positioned at AoA = 0° until the flow was stabilized, then it was moved to the AoA = −5° position to start the “useful” part of the run. With an angular velocity of 2°/s, the model moved to the AoA = 20° position to complete the entire AoA range. Then, the model was brought back to its initial position, and the test run was ended.

Table 2.
Experimental test matrix for AoS = 0°.
3.4. Wind Tunnel Results
Experimental results for lift, drag, and pitching moment are shown in the figure below (Figure 6) at the Mach numbers for which CFD simulations have also been performed. While a more detailed view is offered in Section 4, some observations can be made at this point.

Figure 6.
Experimental results for the AoS = 0° cases: (a) drag coefficient vs. AoA; (b) lift coefficient vs. AoA; (c) pitching moment coefficient vs. AoA.
Large drag coefficients can be observed at transonic Mach numbers, as expected, with values dropping in the supersonic region as the Mach number is increased. An interesting detail is the drag behavior at Mach 1.05 and 1.2. The two curves intersect at approximately AoA = 9°. Below this value, the higher can be found at M = 1.2, while above it at M = 1.05. This behavior is also present in the CFD results, although the number of points is just 4 (Figure 7). At AoA = −5° and 0°, the higher values are found for M = 1.2, while at AoA = 10° and 20°, they are found at M = 1.05.
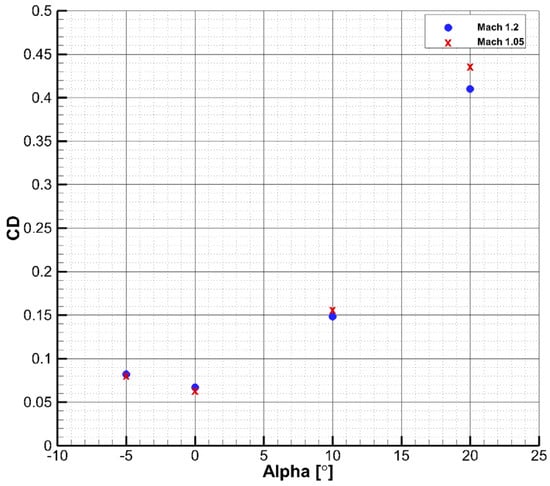
Figure 7.
CFD results for drag vs. AoA at M = 1.05 and M = 1.2 (wind tunnel configuration).
values for all three subsonic Mach numbers are very close, then increase in the transonic region and start decreasing for Mach = 2 and Mach = 3.5. decreases as the Mach number rises from 1.05 to 3.5.
The pitching moment coefficient for the subsonic Mach number has a positive slope after the AoA of 2°–3°, and for the supersonic region, a kink is present at different points for each Mach number.
For the uncertainty propagation, random uncertainty using statistical processing of the measured data was considered. Two sets of measurements (repeatability runs) in the same conditions were used. Figure 8 below shows the uncertainty estimation for Mach 1.2.

Figure 8.
Example of uncertainties for the experimental data at M = 1.05: (a) drag coefficient vs. AoA; (b) lift coefficient vs. AoA; (c) pitching moment coefficient vs. AoA.
4. Numerical Simulation Approach
To quantify the aerodynamic effects given by the sting, closed engine nacelle and to perform the Reynolds number extrapolation, three sets of CFD simulations have been used.
The first configuration was meant to replicate the experimental data as close as possible to serve as a baseline. It used the 1:28 scale CAD of the wind tunnel model featuring the sting, sting cavity, and closed engine nacelle (Figure 9). The sting length corresponds to the actual support up to the wind tunnel strut (the mechanism that rotates the test model). The strut and the wind tunnel walls were not modeled. Including the strut and walls would add to the complexity of the CFD model. It was shown [13] that the influence of the strut in transonic conditions is negligible. Although in this particular case the test matrix includes subsonic and supersonic regimes, it was decided to remove the strut, assuming its influence to be insignificant. Gains from the inclusion of the wind tunnel walls were not justified by the additional computational effort. Perforated walls are used in transonic conditions, and modeling such surfaces would be extremely costly. Considering these factors, it was decided to use a simpler approach and remove the walls from the simulations. A pressure far-field condition is used with values for temperature, Mach number, and pressure derived from the wind tunnel test matrix. It is expected that during experimental runs, the model will deform to some extent. Model deformation was not measured during tests, so aeroelastic effects are not included in the CFD simulations. The cavity can be affected by the relative movement between the model and the sting. This movement can influence the near-field interference, depending on the angle of attack. Such effects are not present in simulations.

Figure 9.
CFD model of the wind tunnel configuration.
A second model was generated, keeping the 1:28 scale, but with a flow-through nacelle and no sting or cavity (Figure 10). Pressure outlet and pressure inlet boundary conditions were applied at the nacelle inlet and outlet, respectively, with values for total pressure, static pressure, total temperature, and static temperature corresponding to the far-field conditions taken from the experimental test matrix. No exhaust jet effect was considered for these computations. The far-field parameters are kept identical to the previous configuration. The position of the shock cone was changed for each Mach number. This second model was used to account for the sting and closed nacelle effects. CFD has the advantage of being able to include both the effects of the closed nacelle and the presence of the sting, eliminating the need for the superposition of different corrections [7].

Figure 10.
CFD model for the configuration with a flow-through nacelle and no sting or cavity.
The 3rd configuration was a full-scale model of the CS-2 vehicle (same in appearance as in Figure 10, but at a 1:1 scale) with a flow-through nacelle and boundary conditions derived from the flight trajectory (Table 3). It was used for the Reynolds number extrapolation, from 11–33 million in wind tunnel testing to 170–410 million in free flight conditions. Three Mach numbers for the full-scale configuration (subsonic, transonic, and supersonic) were deemed to be sufficient to characterize the entire flight envelope.

Table 3.
Reference trajectory of the vehicle.
4.1. Flow Solver
The Reynolds-averaged Navier–Stokes (RANS) equations are solved using the commercial CFD code ANSYS Fluent [14]. An implicit, upwind, second-order accurate density-based solver is employed [15]. Because tripping strips have been used during the wind tunnel experiments, all CFD runs could be considered fully turbulent. The two-equations k-ω SST turbulence model was used for all cases, integrating down to the wall, without using wall functions. It was selected because it is typically better at predicting adverse pressure gradient boundary layer flows and separation. Given the low turbulence level of the wind tunnel [12], values of 1% for the turbulent intensity and 1 for the turbulent viscosity ratio were used for all cases [15]. ANSYS Fluent’s Solution Steering feature was used in order to achieve a steady-state solution in an efficient manner. It consists of two stages. The purpose of the first stage is to ensure maximum stability by gradually advancing the solution from first-order accuracy to second-order accuracy at a constant CFL value. In the second stage, the solution is driven towards convergence by regular adjustments of the CFL value to ensure fast convergence as well as to prevent possible divergence. The residual history is monitored and analyzed at regular intervals to determine if an increase or decrease in CFL value is needed to obtain convergence or to prevent divergence. A symmetry boundary condition is used because no simulation with sideslip angles was performed. In order to assess the convergence of the CFD analysis, a number of key aspects were monitored. Firstly, the residual history is followed, with the target being a plateau that spans a number of iterations.
Secondly, the values for the axial force, normal force, and pitching moment are tracked until a constant value is achieved. Because of some unsteady characteristics of these cases, especially at high angles of attack, there was a need to average the values for the quantities of interest. The fluctuations around the mean values were relatively small, even for the most difficult cases at high AoA. An example of the aerodynamic forces and moment fluctuations for M = 1.2 at AoA = 20° is depicted in Figure 11 below.
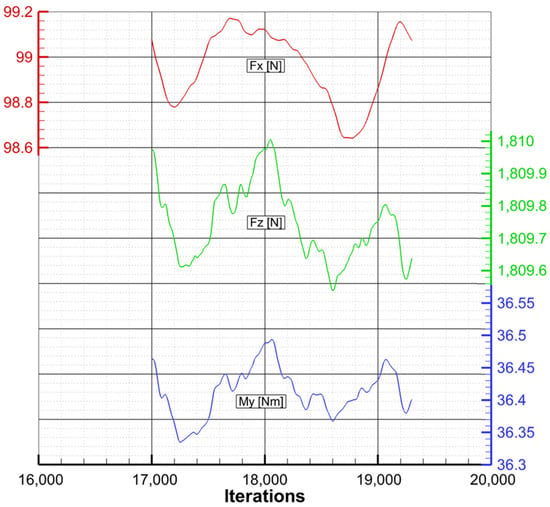
Figure 11.
Fluctuations of the aerodynamic forces and moment at M = 1.2 and AoA = 20°.
Solution convergence was reached after a different number of iterations for each configuration, with an average of 20,000 iterations needed per case. Mach number and angle of attack play an important role in the convergence speed, with cases at lower Mach numbers and AoAs needing less time.
The use of transient simulations at high AoA could lead to more accurate results, but it was deemed impractical in this particular case for a number of reasons. The most important constraint was time, so a degree of “economical convergence” was applied by performing only steady simulations. When comparing experimental data and CFD results for the wind tunnel configuration, it is evident that the error does not increase at an alarming rate with AoA. Figure 12 shows the difference in lift coefficient between the wind tunnel data and CFD simulations. The error magnitude is similar at AoA −5°, 10°, and 20°, while AoA 0° stands out for the more accurate results, as expected. A similar behavior was observed for both drag and pitching moment coefficients.
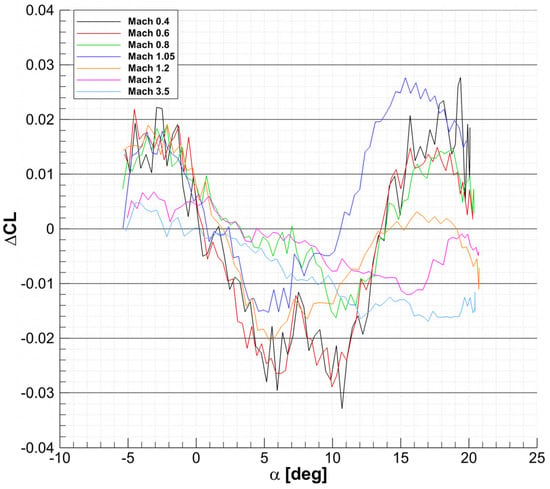
Figure 12.
Difference in lift coefficient between experimental data and CFD results for the wind tunnel configuration.
Thirdly, several qualitative aspects, including pressure, temperature, and distribution on the surface of the model and the Mach number distribution in specific planes, were analyzed.
4.2. Grid Generation
ANSYS Meshing [15] is used to generate the unstructured computational grid (Figure 13). It consists of a number of prism layers near the wall regions and tetrahedral elements for the outer volume. A large number of surface elements were needed in some key areas of the model in order to properly replicate it.
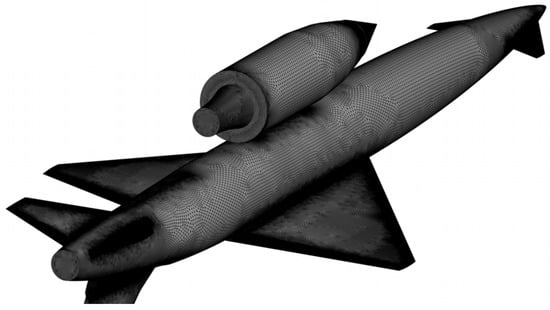
Figure 13.
Surface grid details on the wind tunnel CFD model.
The wings, canards, V-tail, and nacelle lip have very small radii at the leading edges that must be modeled accordingly, and the sting cavity is challenging because of its geometry and proximity to the sting.
The CFD work for the wind tunnel configuration commenced before the start of the experimental campaign, so the grid independence study was very important in ensuring good quality results. Three regimes were chosen: Subsonic (M = 0.6), transonic (M = 1.05), and supersonic (M = 2), all at AoA = 20°. Three grids were generated (coarse, medium, and fine) with the properties presented in Table 4.

Table 4.
Characteristics of the coarse, medium, and fine grids for the wind tunnel configuration.
Table 5 shows the results of the grid independence study for the wind tunnel configuration. The most important differences are found in the pitching moment coefficient, as expected.

Table 5.
Grid independence study results for the wind tunnel configuration.
For the next two configurations, a common study was performed. The only important difference between the wind tunnel model and the open nacelle model (both at 1:28 scale) is the open nacelle and the spike. Grid sizing can be reused for the entire model, apart from the spike and the nacelle interior surface. The most efficient solution was to study the full-size model with scaled up surface grid sizing and variable sizing for the spike and nacelle interior. After a grid-independent solution is found, the nacelle and spike sizing are scaled down and used in the 1:28 open nacelle model. For this study, M = 1.05 was the only regime used because it was deemed to be the most challenging. Grid properties and CFD results are presented in Table 6 and Table 7, respectively.

Table 6.
Characteristics of the coarse, medium, and fine grids for full-size configuration.

Table 7.
Grid independence study results for the full-size configuration.
Results in Table 7 show that the difference in aerodynamic coefficients is small between the three grids. Only is showing a slight change between the coarse and medium grids. The good performance of the coarse grid is explained by the fact that small curvatures (wing, canard, and V-tail leading edges) were discretized using a significant number of elements from the beginning. Following refinements did not bring any significant advantages, apart from some small gains in the prediction.
The medium grid was chosen for all three configurations. It was considered a safe choice because it was going to be used for all Mach numbers, not only the ones used in the grid independence study. A good distribution of was ensured, with values below 1 for most of the surface and peaks below 5, mostly at the leading edges of the canard, wing, tail, and nacelle. Figure 14, Figure 15 and Figure 16 show the distribution for the three configurations at three Mach numbers (0.6, 1.05, and 3.5) and AoA = 20°.

Figure 14.
distribution on the CFD wind tunnel model at Mach 0.6 (a), Mach 1.05 (b), and Mach 3.5 (c).

Figure 15.
distribution on the CFD wind tunnel model w/o sting and w/flow-through nacelle at Mach 0.6 (a), Mach 1.05 (b), and Mach 3.5 (c).

Figure 16.
distribution on the CFD model for the flight conditions at Mach 0.6 (a), Mach 1.05 (b), and Mach 3.5 (c).
Characteristics for the three grids used in this study are found in Table 8.

Table 8.
Grid characteristics for the three simulation cases.
4.3. Numerical Results
There is a very good agreement between the CFD results for the wind tunnel configuration and the experimental data, as shown in Figure 17, Figure 18, Figure 19 and Figure 20. Lift and drag are closely aligned, while the pitching moment exhibits a slight offset from the experimental results in most cases. Nevertheless, the pitching moment slope () is well captured, even in some especially nonlinear areas (Figure 20).
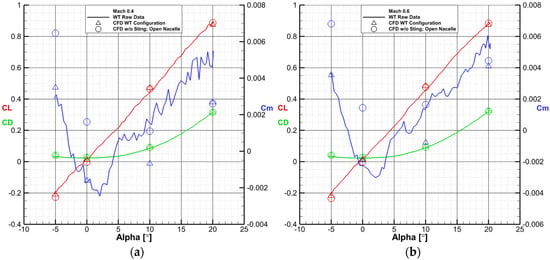
Figure 17.
Comparison between wind tunnel raw data, CFD simulations of the wind tunnel configuration, CFD simulations of the flow-through nacelle and no sting configuration at Mach 0.4 (a) and Mach 0.6 (b).
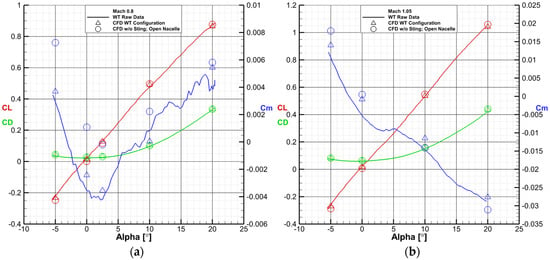
Figure 18.
Comparison between wind tunnel raw data, CFD simulations of the wind tunnel configuration, CFD simulations of the flow-through nacelle and no sting configuration at Mach 0.8 (a) and Mach 1.05 (b).
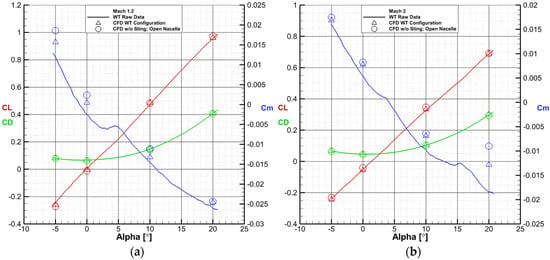
Figure 19.
Comparison between wind tunnel raw data, CFD simulations of the wind tunnel configuration, CFD simulations of the flow-through nacelle and no sting configuration at Mach 1.2 (a) and Mach 2 (b).
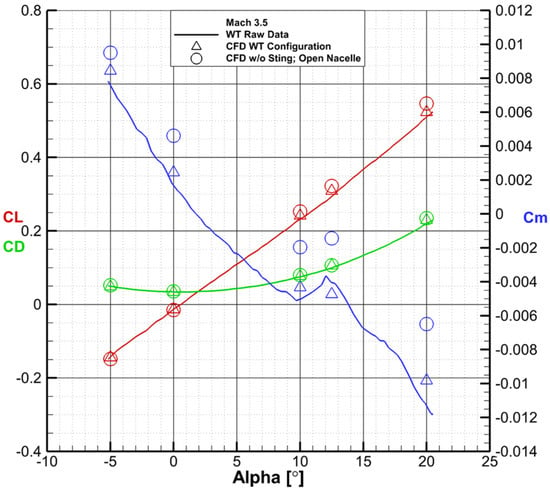
Figure 20.
Comparison between wind tunnel raw data, CFD simulations of the wind tunnel configuration, CFD simulations of the flow-through nacelle and no sting configuration at Mach 3.5.
The maximum difference for lift, drag, and pitching moment coefficients between experimental data and CFD simulations for the wind tunnel configuration is as shown in Table 9 (1 drag count = 0.0001, 1 lift count = 0.001, 1 pitching moment count = 0.0001).

Table 9.
Maximum errors between experimental data and CFD.
The influence of the open nacelle and sting is summarized in Table 10, while the Reynolds number effect is shown in Table 11.

Table 10.
Maximum differences on lift, drag, and pitching moment caused by the open nacelle and sting.

Table 11.
Maximum differences on lift, drag, and pitching moment caused by the Reynolds number.
Drag is influenced by the Reynolds number difference more than the open nacelle and sting. Lift does not change in any significant way between the three configurations, and the maximum difference of 26 counts is caused by the Reynolds number extrapolations. The pitching moment coefficient is more interesting. The Reynolds number difference has an insignificant impact of 9 counts at Mach 3.5 and AoA 12.5° (in the kink area of the vs. AoA plot—Figure 25). The open nacelle and sting have a more visible impact of 39 counts. Figure 21 and Figure 22 show the obtained by substracting CFD with sting and a closed nacelle from CFD without sting and a flow-through nacelle.

Figure 21.
Contours of pressure distribution differences on the model surface obtained by subtracting CFD with sting and closed nacelle from CFD without sting and flow-through nacelle.
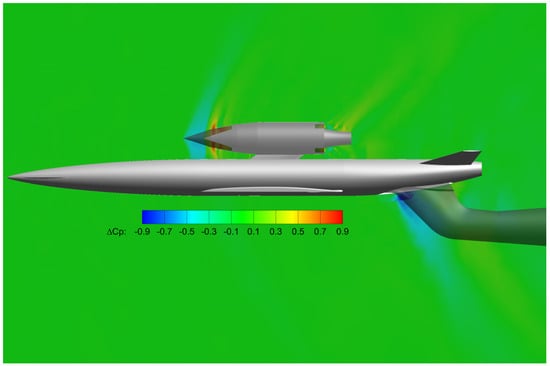
Figure 22.
Contours of pressure distribution differences on the symmetry place obtained by subtracting CFD with sting and closed nacelle from CFD without sting and flow-through nacelle.
The change of nacelles moves the position of the shock wave on the fuselage and wing (Figure 21). The sting influence can be seen on the aft part of the fuselage and on the V-tail. Although it is not as considerable as the effect of the nacelle, the longer distance between the end of the fuselage and the pitching moment reference point (50% model length) gives the sting an important influence on .
The Reynolds number effect on lift, drag, and pitching moment is shown in Figure 23, Figure 24 and Figure 25.
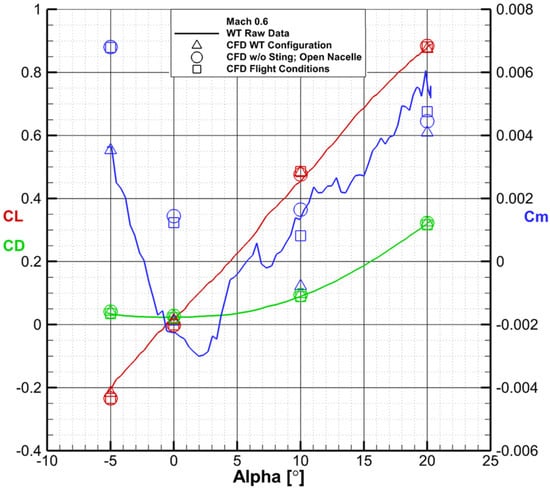
Figure 23.
Comparison between wind tunnel raw data, CFD simulations of the wind tunnel configuration, CFD simulations of the flow-through nacelle and no sting configuration and CFD simulations of the 1:1 scale configuration at Mach 0.6.
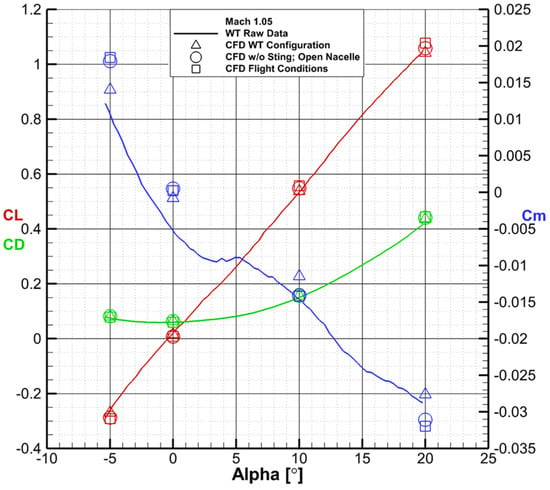
Figure 24.
Comparison between wind tunnel raw data, CFD simulations of the wind tunnel configuration, CFD simulations of the flow-through nacelle and no sting configuration and CFD simulations of the 1:1 scale configuration at Mach 1.05.
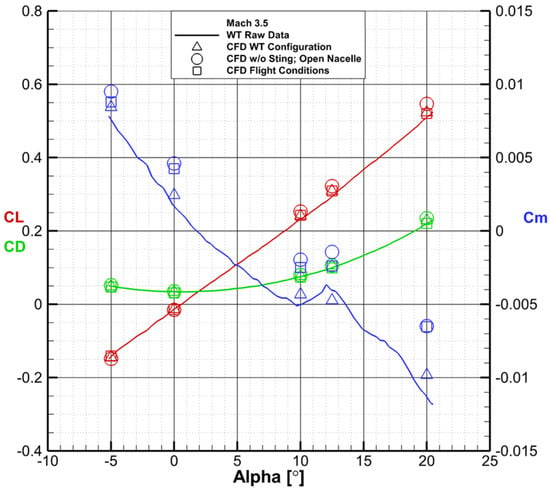
Figure 25.
Comparison between wind tunnel raw data, CFD simulations of the wind tunnel configuration, CFD simulations of the flow-through nacelle and no sting configuration and CFD simulations of the 1:1 scale configuration at Mach 3.5.
5. Corrections
Three sets of data were applied in the post-processing of the experimental results:
- CS2 with sting (closed nacelle)—wind tunnel regime
- CS2 without sting (open nacelle)—wind tunnel regime
- CS2 without sting (open nacelle)—flight regime
The correction applied to the experimental data represents a database generated by linear interpolation of the CFD results that was applied sequentially to the raw data.
The first step was to apply the correction function of sting/nacelle effect (Figure 26)—a piecewise linear function—computed as the difference between the no sting/open nacelle case and the sting/closed nacelle case offset to the data acquired by the wind tunnel system.
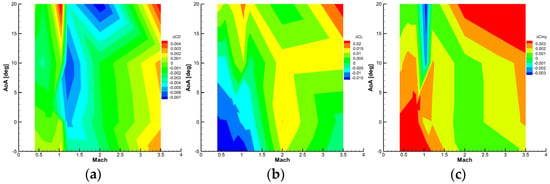
Figure 26.
Sting and open nacelle effect on drag (a), lift (b), pitching moment, (c)—CFD results.
Because each aerodynamic coefficient can vary differently (linear, polynomial) with respect to the independent variables (angle of attack, angle of sideslip, Mach number), the linear interpolation is the appropriate method to be used in this case, as this would introduce the least number of deviations attributed to the interpolation method.
The second step was to compute the correction function of the Reynolds effect (Figure 27) in the same manner as for the sting/nacelle effect.
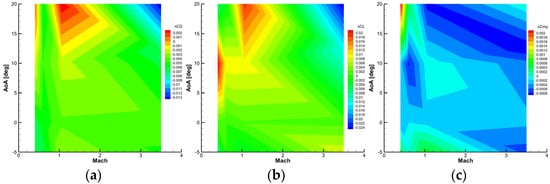
Figure 27.
Reynolds effect on drag (a), lift (b), pitching moment, (c)—CFD results.
A reason for constructing two correction functions is to allow the possibility of comparing the experimental datasets from different test campaigns and also to have an aerodynamic database suitable for validation against flight trajectory.
Because the simulations were performed only at AoS = 0°, the rolling moment, yawing moment, and side force coefficients do not contain any correction with respect to the sting-nacelle and Reynolds effects.
6. Conclusions
The aim of this study was to use high-fidelity CFD in order to investigate the aerodynamic interference caused by the wind tunnel mounting system, the closed nacelle, and to perform a Reynolds number extrapolation on a hypersonic vehicle configuration, part of the MORE&LESS program. The test campaign took place at the INCAS Trisonic Facility and covered regimes from Mach 0.4 to Mach 3.5, with sideslip angles of 0° and 10°.
Three CFD models have been used to determine the influence of the sting and for the Reynolds number extrapolation, all at a 0° angle of sideslip because of the time advantage offered by the use of a symmetry boundary condition.
The first computational model was built to replicate the wind tunnel experimental configuration, with a 1:28 scale, sting cavity, and closed nacelle at testing regimes. The results thus obtained served as a baseline, and the aim was to be as close as possible to the experimental data. A very good agreement was shown between the wind tunnel data and the CFD results. Lift and drag are very well predicted at all Mach numbers and angles of attack, while the pitching moment exhibits a slight offset at all regimes. For the lower Mach number, where the aerodynamic loads are lower on the balance, the pitching moment results are particularly noise, and the CFD data are furthest away from the experimental results.
The second model was built to account for the influence of the sting, the sting cavity, and the open nacelle. The 1:28 scale was kept along with the boundary conditions derived from the testing regimes, while the sting and sting cavity were removed and the nacelle was modeled as flow-through by the use of pressure outlet and pressure inlet boundary conditions. Significant differences introduced by the open nacelle and the sting removal can be seen just in the pitching moment coefficient.
The third model was identical to the second one, the only difference being the 1:1 scale and the boundary conditions derived from the reference trajectory. A database was generated by linear interpolation of the CFD results, and it was applied sequentially to the raw wind tunnel data. The closed nacelle and sting had an effect on the pitching moment coefficient because of the different position of the shock wave generated by the inlet spike and the changed pressure distribution on the aft fuselage in the presence of the sting. The Reynolds number extrapolation revealed an influence on the drag coefficient, while the lift suffered minor changes in the correction process.
CFD proved to be a very useful tool in quantifying the aerodynamic effects of the sting presence and the closed engine nacelle, especially considering the unusual configuration that could introduce unexpected behaviors or effects.
Author Contributions
Conceptualization, M.C., M.M. and N.V.; methodology, I.-L.P., D.P. and G.S.; software, D.P.; validation, M.M.; formal analysis, D.P. and G.S.; writing—original draft preparation, I.-L.P. and D.P.; writing—review and editing, I.-L.P., D.P., G.S. and M.M.; visualization, D.P.; supervision, M.M. and D.P.; project administration, M.M.; funding acquisition, N.V. All authors have read and agreed to the published version of the manuscript.
Funding
This research has been carried out in the framework of the “MDO and Regulations for Low Boom and Environmentally Sustainable Supersonic Aviation” MORE&LESS project. This project received funding from the European Union’s Horizon 2020 research and innovation program under Grant Agreement 101006856.
Data Availability Statement
Data are contained within the article.
Conflicts of Interest
Author Matthew Clay was employed by the company Reaction Engines Ltd. The remaining authors declare that the research was conducted in the absence of any commercial or financial relationships that could be construed as a potential conflict of interest.
References
- Lynch, F.T.; Crites, R.C.; Spaid, F.W. The crucial Role of Wall Interference, Support Interference, and Flow Field Measurements in the Development of Advanced Aircraft Configurations. In Wall Interference, Support Interference and Flow Field Measurements; AGARD CP-535; NATO: Brussels, Belgium, 1993. [Google Scholar]
- Elsenaar, A.; Han, S.O.T.H. A Break-Down of Sting Interference Effects. NLR TP 91220 U. In Proceedings of the Model Support Corrections in Wind Tunnels Symposium, Marknesse, The Netherlands, 16–17 May 1991. [Google Scholar]
- Wubben, F.; Maseland, H. Verification of Wind Tunnel Model Support and Interference Assessments in DNW-HST by CFD Simulations; NATO: Brussels, Belgium, 2018.
- Stojanowski, M.; Germain, E. The FALCON 7x: From ETW to flight. In Proceedings of the 46th AIAA Aerospace Sciences Meeting and Exhibit RENO, Reno, NV, USA, 7–10 January 2008. [Google Scholar]
- AGARD-336 Wind Tunnel Wall Correction; NATO: Brussels, Belgium, 1998.
- Schimanski, D.; Quest, J. Tools and Techniques for High Reynolds Number Testing Status and Recent Improvements at ETW. In Proceedings of the 41st Aerospace Sciences Meeting and Exhibit, Reno, NV, USA, 6–9 January 2003. [Google Scholar]
- Heidebrecht, A. A Numeric Far Field model for Support Interference Studies in a Slotted Wall Wind Tunnel (European Transonic Wind Tunnel). Proc. Inst. Mech. Eng. Part G J. Aerosp. Eng. 2006, 220, 581–587. [Google Scholar] [CrossRef]
- Muton, S. Numerical Investigations of Model Support Interference in a Transonic Wind Tunnel. In Proceedings of the 8th ONERA-DLR Symposium ODAS, Göttingen, Germany, 17–19 October 2007. [Google Scholar]
- Kohzai, M.; Ueno, M.; Koga, S.; Sudani, N. Wall and Support Interference Corrections of NASA Common Research Model Wind Tunnel Tests in JAXA. In Proceedings of the 51st AIAA Aerospace Sciences Meeting Including the New Horizons Forum and Aerospace Exposition, Grapevine, TX, USA, 7–10 January 2013. [Google Scholar]
- Waldmann, A.; Lutz, T.; Krämer, W. Wind Tunnel Support System Influence on NASA Common Research Model Low Speed Conditions. In Proceedings of the 32nd AIAA Aerodynamic Measurements Technology and Ground Testing Conference, San Diego, CA, USA, 4–8 January 2016. [Google Scholar]
- Russo, S.; Müller, J.; Palletta, N.; Adden, S.; Ruiz-Calavera, L.P. Numerical Prediction of the Strut Interference on a Regional Aircraft Wind-Tunnel Model. In Proceedings of the 6th European Conference on Computational Mechanics (ECCM6), Glasgow, UK, 11–15 June 2018. [Google Scholar]
- Munteanu, F. INCAS Trisonic Wind Tunnel, INCAS-BULLETIN No 1. 2009. Available online: https://bulletin.incas.ro/files/florin_munteabu_v1no1_1_full.pdf (accessed on 7 June 2024).
- Rivers, M.; Hunter, C.A.; Campbell, R.L. Further Investigation of the Support System Effects and Wing Twist on the NASA Common Research Model. In Proceedings of the 30th AIAA Applied Aerodynamics Conference, New Orleans, LA, USA, 25–28 June 2012. [Google Scholar]
- ANSYS Fluent, Release 23.1 Theory Guide; ANSYS, Inc.: Canonsburg, PA, USA, 2021.
- ANSYS Fluent, Release 23.1 User Guide; ANSYS, Inc.: Canonsburg, PA, USA, 2021.
Disclaimer/Publisher’s Note: The statements, opinions and data contained in all publications are solely those of the individual author(s) and contributor(s) and not of MDPI and/or the editor(s). MDPI and/or the editor(s) disclaim responsibility for any injury to people or property resulting from any ideas, methods, instructions or products referred to in the content. |
© 2024 by the authors. Licensee MDPI, Basel, Switzerland. This article is an open access article distributed under the terms and conditions of the Creative Commons Attribution (CC BY) license (https://creativecommons.org/licenses/by/4.0/).