1. Introduction
Icing is one of the most serious hazards for aircraft that severely threatens flight safety. Icing comes from the freezing of cloud droplets, or supercooled droplets which remain in a liquid state even at temperatures far below freezing, when they are struck by aircraft components during flight. Type Certification of large (transport) fixed-wing aircraft is accomplished under 14 CFR 25.1419 by FAA [
1] or under CS 25.1419 by EASA [
2]. These requirements affirm that an aircraft should be able to “operate safely” when the stated definition of icing conditions exists.
On 31 October 1994, near Roselawn, Indiana-USA, a fatal accident involving an Avions de Transport Régional ATR-72 regional transport aircraft occurred in icing conditions believed to include freezing drizzle droplets. The atmospheric condition (freezing drizzle) that may have contributed to the accident is outside the existing Appendix C of 14 CFR Part-25 icing envelope that has been used for certification of large airplanes since 1964 [
1]. Another atmospheric icing condition that airplanes may experience that is outside of the Appendix C icing envelope is freezing rain [
1]. These kinds of icing conditions constitute an icing environment known as Supercooled Large Droplets (SLD) [
3]. Eventually, it was proposed to amend Appendix C of 14 CFR Part-25 [
1] and also CS-25 [
2] to better protect large airplanes certified for flight in icing conditions. The new icing environment would include Supercooled Large Droplets, which resulted in Appendix O. Appendix O includes a description of supercooled large droplet icing conditions consisting of freezing drizzle and freezing rain occurring in and/or below stratiform clouds. While freezing drizzle is associated with maximum droplet diameters from 100
to 500
, freezing rain is associated with maximum droplet diameters greater than 500
[
1,
2].
It has to be noted that in a cloud with a given droplet size distribution, there will be droplets in the Appendix C range, i.e., droplet diameters between 15–50 microns, but there will also be droplets that are outside the Appendix C range. Droplets that are larger than 100 microns need to be treated as supercooled large droplets although the median volumetric diameter (MVD) of the cloud may be much less. Therefore, together with the median volumetric diameter, droplet size distribution is an additional feature that characterizes an icing cloud.
However, SLD cloud conditions are not very common in the atmosphere. According to Jeck [
4], only 4% of exposures involve droplets with median volume diameters of 40
or greater and even then the exposure does not typically last more than 10 nautical miles. Overall average droplet size for stratiform clouds is about 15
and this droplet size represents an equilibrium or preferred condition for cloud droplets in stratiform clouds. Deviations from 15
are an unstable state, unsustainable both in time and distance.
Therefore, flight testing in actual SLD cloud conditions is not routine due to the rarity of such conditions. Also, existing icing wind tunnels may not faithfully replicate larger droplet sizes and their distributions. Consequently, numerical simulations emerge as a viable option for understanding the physics of SLD cloud conditions and showing compliance with certification requirements, necessitating computational modeling of large droplet phenomena.
A brief summary of the literature relevant to the topic is presented in the following.
Potapczuk [
5] examines mass accumulation on an airfoil during exposure to icing conditions in the NASA Glenn Icing Research Tunnel (IRT). The icing cloud conditions cover a range of median volumetric diameters, liquid water contents and temperatures. Comparisons of measured ice mass values to predicted ice mass accumulation suggest that the splashing mechanism may be important, especially when droplet size increases.
Wright and Potapczuk [
6] present a semi-empirical computational model, which incorporates the physical effects of large droplet phenomena into LEWICE software (version 2.2.2). Comparisons with experimental SLD data are also made. Results are presented for collection efficiency, ice shape and ice mass. In their study, droplet splashing is identified as the sole first-order effect, while droplet non-sphericity, droplet interaction, droplet breakup and ice mass density variation with droplet size are identified as second-order effects. Gravitational effects, drag history of the droplet, droplet lift force and flowfield turbulence are suggested to have negligible effects.
Wright [
7] reports the efforts to extend the capabilities of the LEWICE software (version 3.0) including the empirical model for the SLD regime. An extensive comparison of the results against the database of ice shapes and collection efficiencies that have been generated in the NASA Glenn Icing Research Tunnel (IRT) is also performed. The results reveal that the predicted results are within the accuracy limits of the experimental data for the majority of the cases.
Papadakis et al. [
8] present experimental methods for investigating large droplet impingement dynamics and obtaining small and large water droplet impingement data. The experiments were conducted at the Goodrich Icing Wind Tunnel and NASA Glenn Icing Wind Tunnel (IRT). Cloud median volumetric diameters were in the range of 11 to 270
. Droplet impingement visualization experiments demonstrate considerable droplet splashing during impingement.
Trontin et al. [
9] propose an empirical mass loss model for SLD based on the experimental data from Papadakis et al. [
8,
10,
11,
12], where a wealth of numerical and experimental data are included together with validation efforts for various airfoil geometries and SLD droplet sizes. The model separates the influence of the kinetic energy, which is the dominating effect close to the leading edge, from the influence of the angle of incidence, which is the most influential parameter close to the impingement limits. The authors suggest that the model can be used for both supercooled large droplets and small droplets.
Özgen and Canıbek [
13] present the efforts to improve a computational icing prediction tool together with the obtained results. SLD effects are accounted for through modeling of non-spherical droplets, droplet breakup and droplet splash. Their results indicate that droplet splash can constitute a significant effect especially when the flow velocity and droplet sizes are large, while droplet breakup seems to have a secondary effect compared to droplet splash.
Icing simulations were performed by Takahashi et al. [
14] involving SLD on a NACA0012 airfoil and a commercial axial fan considering splash-bounce, droplet deformation and breakup effects. The results indicate that splash-bounce phenomena considerably influence the icing process, while the effects of deformation and breakup are negligibly small.
In a recent study, Prince Raj et al. [
15] investigated ice accretion and aerodynamic effects on a multi-element airfoil under the Appendix O icing envelope. In non-SLD conditions, the leading edge (horn-shaped) ice that forms on the suction side of the main element significantly reduces the performance of the main element. In contrast, no leading edge ice forms on the suction side for the SLD condition, leading to a significant reduction in performance loss. It is also shown that ice accumulation on the flap is much higher in the SLD conditions and, as a result, the gap between the main element and the flap is almost filled with the ice that accumulates on the flap.
Three methods are established by Shen et al. [
16] in order to calculate the local collection efficiency based on the Lagrangian approach for calculating the droplet trajectories, which are the traditional flow tube method, local flow tube method and a statistical method. Through numerical simulations around an NACA0012 airfoil, the accuracies of the three methods in regard to collection efficiency are verified. The three methods are also applied to an S-shaped duct, a 2D engine cone section and an icing wind tunnel.
Cao et al. [
17] present a comprehensive review of the past research on aircraft icing, including an introduction to supercooled large droplet (SLD) icing with an intent to raise consciousness on the effects of icing on aircraft flight safety. It is also argued that some measures are necessary to deal with problems of aircraft flight safety in icing conditions, especially in SLD icing conditions.
In another review article, Yamazaki et al. [
18] summarize current research on icing in two related fundamental topics, i.e., icing physics and icing mitigation techniques. Icing physics focuses on fixed wings, rotors and engines, while icing mitigation techniques based on active, passive and hybrid methods are reviewed. Active mitigation techniques reviewed include those that are based on thermal and mechanical methods, whereas the passive techniques discussed are based on chemical coatings. A hybrid mitigation technique is also reviewed, which is a combination of the thermal method and chemical coating aimed at lowering energy consumption.
On the experimental side, a rather interesting study is reported by Hassler et al. [
19]. Whether the temperature of the water droplets generated by the spray system converges to the static air temperature when the droplets impinge on the test object is addressed, which is a significant question in icing wind tunnel experiments. This is even more relevant for supercooled large droplets since the cooling rate of droplets decreases sharply with increasing diameter. In the study, realistic droplet temperature distributions in the measurement section of Rail Tec Arsenal Icing Wind Tunnel are computed with a numerical code that tracks the paths of the droplets from the spraying nozzle to the measurement section and calculates their cooling rates. Also, numerical icing simulations are performed to investigate to what extent the deviation of the droplet temperature from static air temperature influences icing and thermal anti-icing processes.
In another experimental study, Han et al. [
20] compared and analyzed the similarities and differences between normal droplet icing shapes and supercooled large droplet icing shapes. One of the most significant outcomes of the tests was that the ice horn height of supercooled large droplets decreased with increasing droplet size, compared to normal droplets.
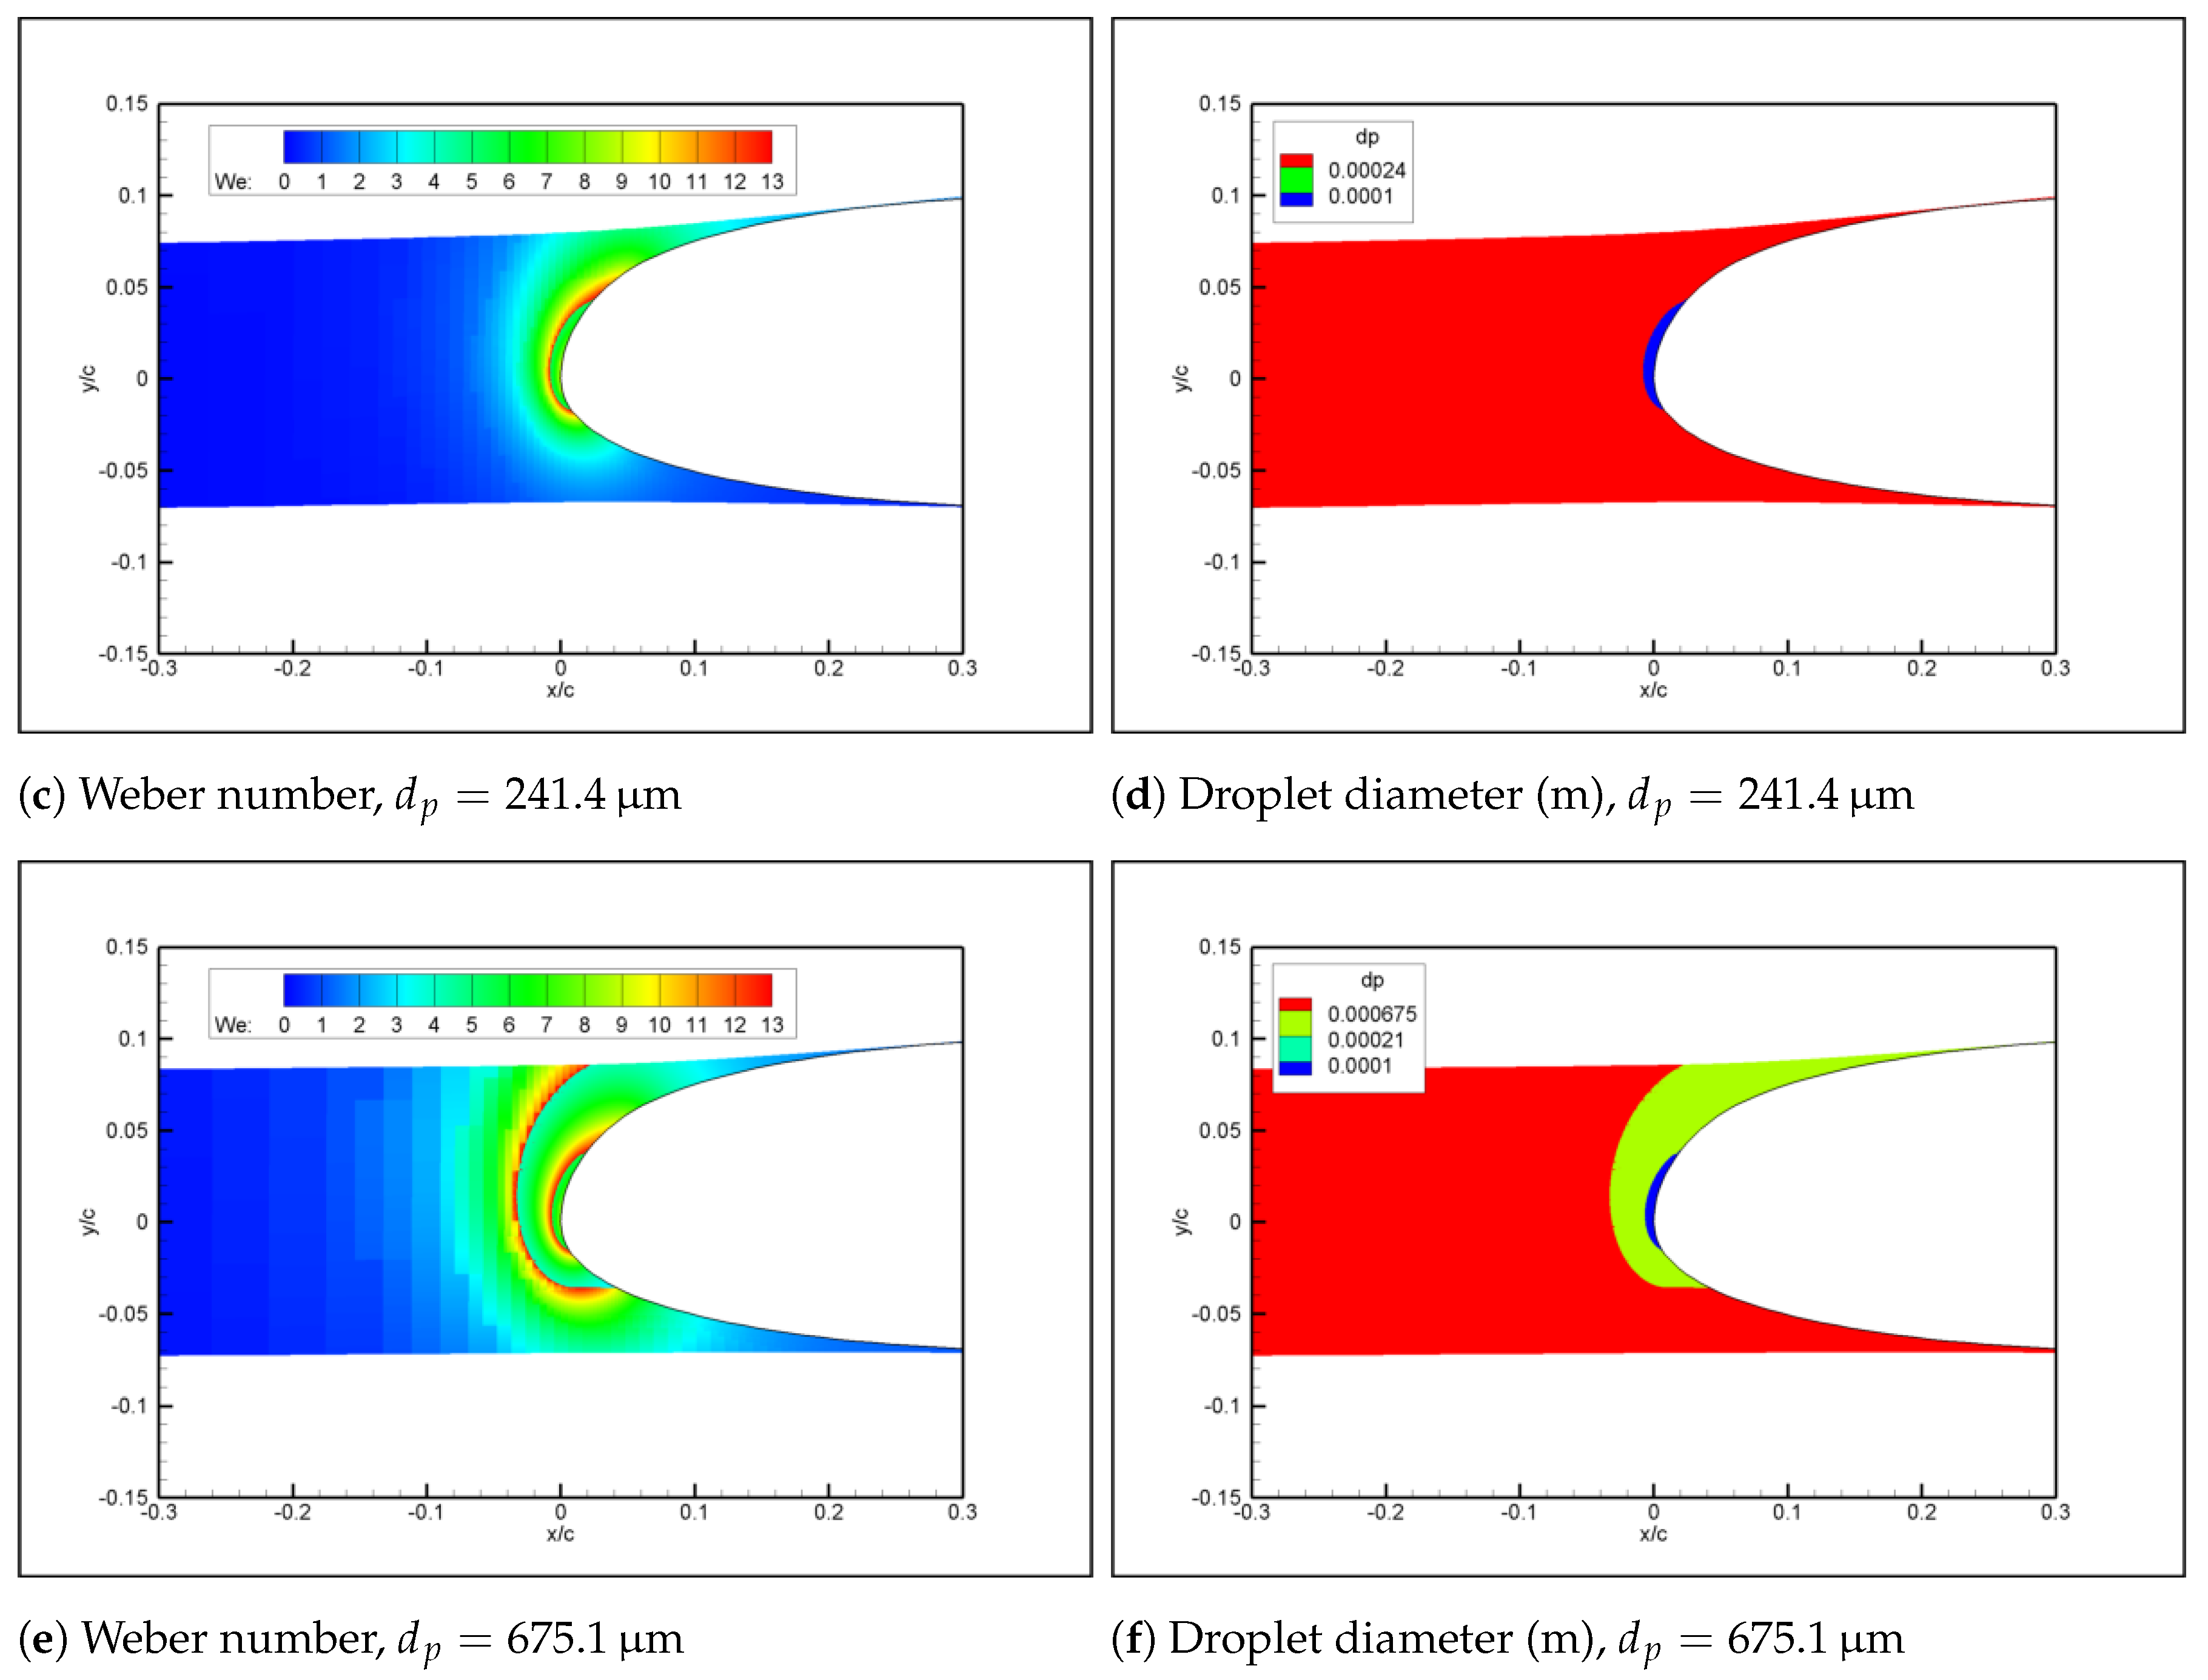
This paper aims to numerically investigate phenomena that are related to SLD cloud conditions, namely gravity, non-sphericity of droplets due to deformation, droplet breakup and droplet splashing. Empirical models that represent these phenomena are implemented in an in-house two-dimensional ice accretion simulation software. The effect of each phenomenon is brought out in terms of droplet collection efficiency and ice accretion. The novel aspects of the study can be summarized as:
- (i)
The results point to multiple droplet breakup, which, to the authors’ best knowledge has not been reported elsewhere. Also, droplet breakup emerges as a more significant effect than previously reported.
- (ii)
The multifaceted effect of droplet splash is reported and discussed systematically covering a gap in the previous literature.
- (iii)
The Extended Messinger Model for icing, which represents physical phenomena more faithfully than the Messinger Model, is implemented and enhanced to include SLD effects. The original Messinger Model dominates numerical icing simulation tools, and improvement of the Extended Messinger Model with SLD effects is considered to be significant progress.
The outline of the paper is as follows. The second section of the study is devoted to the mathematical models and solution methods used for the four modules of the computational tool, i.e., the modules for flow-field solution, droplet trajectory calculation, thermodynamical analysis and ice growth rate computation. The third section presents the obtained results. The first part of the section summarizes the modeling of SLD-related phenomena, and the effects of these are presented in terms of droplet collection efficiency distributions on the MS317 airfoil. In the second part of the section, the ice shape calculation results and validation studies with experimental and numerical literature data for the NACA0012 airfoil are presented. In the final section, the important conclusions of the study are summarized.
2. Formulation and Numerical Methods
There are four main modules in the current in-house icing simulation computational tool:
- (i)
Flow field calculation,
- (ii)
Determination of droplet trajectories and local collection efficiency distributions,
- (iii)
Thermodynamic analysis,
- (iv)
Calculation of ice growth rates and integration over time to yield the final ice shape.
The computational procedure is an iterative process with a time-stepping procedure, where successive thin ice layers are formed on the surface, followed by flow field and droplet impingement recalculations. The developed computational tool is self-contained and does not require any external tool for the analyses except for visualizing the computed data. In the following sections, the four main steps are explained in detail.
2.1. Flow Field Calculation
The flow field solution is needed to determine:
The velocity and pressure distributions on the geometry surface for subsequent boundary-layer calculations and determination of aerodynamic performance. The velocity distribution on the surface is denoted by , where s is the streamwise distance on the airfoil, traversing the airfoil in a clockwise location starting at the trailing edge, traversing the bottom surface, then the leading edge, the upper surface and reaching the trailing edge. However, is set at the leading edge so that corresponds to the pressure side and corresponds to the suction side of the airfoil in the subsequent figures showing collection efficiency distributions.
Off-body velocities, or to be used for droplet trajectory calculations.
For this purpose, numerical solutions with varying accuracy levels can be used. For example, the Panel Method coupled with a boundary-layer solver is fast, computationally less demanding, and does not require a computational mesh. However, it is less accurate compared to other numerical methods. The Euler Method is more accurate but requires a computational mesh, which necessitates interpolation of velocities for droplet trajectory computations. If the Euler approach is used for droplet trajectories, the same numerical method can be used for both the flowfield and droplet trajectory computations [
21].
In many ice accretion prediction software, the Panel Method has been used and found to yield results that are sufficiently accurate. In the method outlined in the following, the computations and results based on the Panel Method are presented. In the Panel Method, the geometry is divided into straight panels each associated with a source singularity element together with a vortex singularity that is constant for all panels. The strengths of the singularities are constants and unknowns of the problem. The computational tool that is developed uses N straight panels to solve singularity strengths using the flow tangency boundary condition at the collocation points of the panels. An additional equation is introduced for the Kutta condition. The collocation points are the centroids of each panel. Once the singularity strengths are calculated, one can construct a velocity potential and hence calculate the airflow velocity components at any location in the flow field including the boundaries of the geometry. The velocity components at a given point are the x- and y-derivatives of the velocity potential constructed at that point. This is a major advantage because the velocity components can be calculated at the exact droplet location during droplet trajectory calculations.
The discretization is conducted such that different airfoil geometries all have 200 panels and panels are clustered around the leading and the trailing edge according to the cosine distribution. This eliminates the dependency of the results on geometry resolution.
2.2. Droplet Trajectories and Collection Efficiencies
For droplet trajectories, the Lagrangian approach is used. In the Lagrangian approach, the liquid phase is treated as a discrete medium and trajectories of individual droplets are calculated separately. In this approach, a high number of droplet trajectories need to be computed so that a smooth impingement pattern, hence collection efficiency distribution, is obtained. The exact number of droplet trajectories that need to be calculated depends on the airspeed, angle of attack, size of the airfoil and droplet size, but it is more than 200 for a computation with one droplet size. The number of trajectories to be calculated increases proportionately with the number of droplet sizes in a bin.
In the current study, it is assumed that there is one-way interaction between the flow field and the droplets, i.e., the flow field is not affected by the presence of the droplets. It is also assumed that gravity, buoyancy and aerodynamic drag are the only forces acting on the droplets. It is further assumed that the droplet temperatures are equal to the air temperature. However, a recent study by Hassler et al. [
19] reveals that the the temperature of the water droplets generated by the spray system in a wind tunnel may not converge to the static air temperature when the droplets impinge on the test object. This may have a significant effect on the energy balance and the resulting ice accretion rate.
The equations of motion that follow are integrated in time using an appropriate law that gives the droplet drag force coefficient as a function of the droplet Reynolds number [
22]:
where
Definitions of the variables in the above equations are as follows:
: droplet drag coefficient.
: and components of the flowfield velocity vector at the droplet location.
: and components of the droplet velocity vector.
: and components of the droplet acceleration.
: atmospheric density.
: droplet cross-sectional area.
: Magnitude of the relative velocity of the droplet with respect to the airflow.
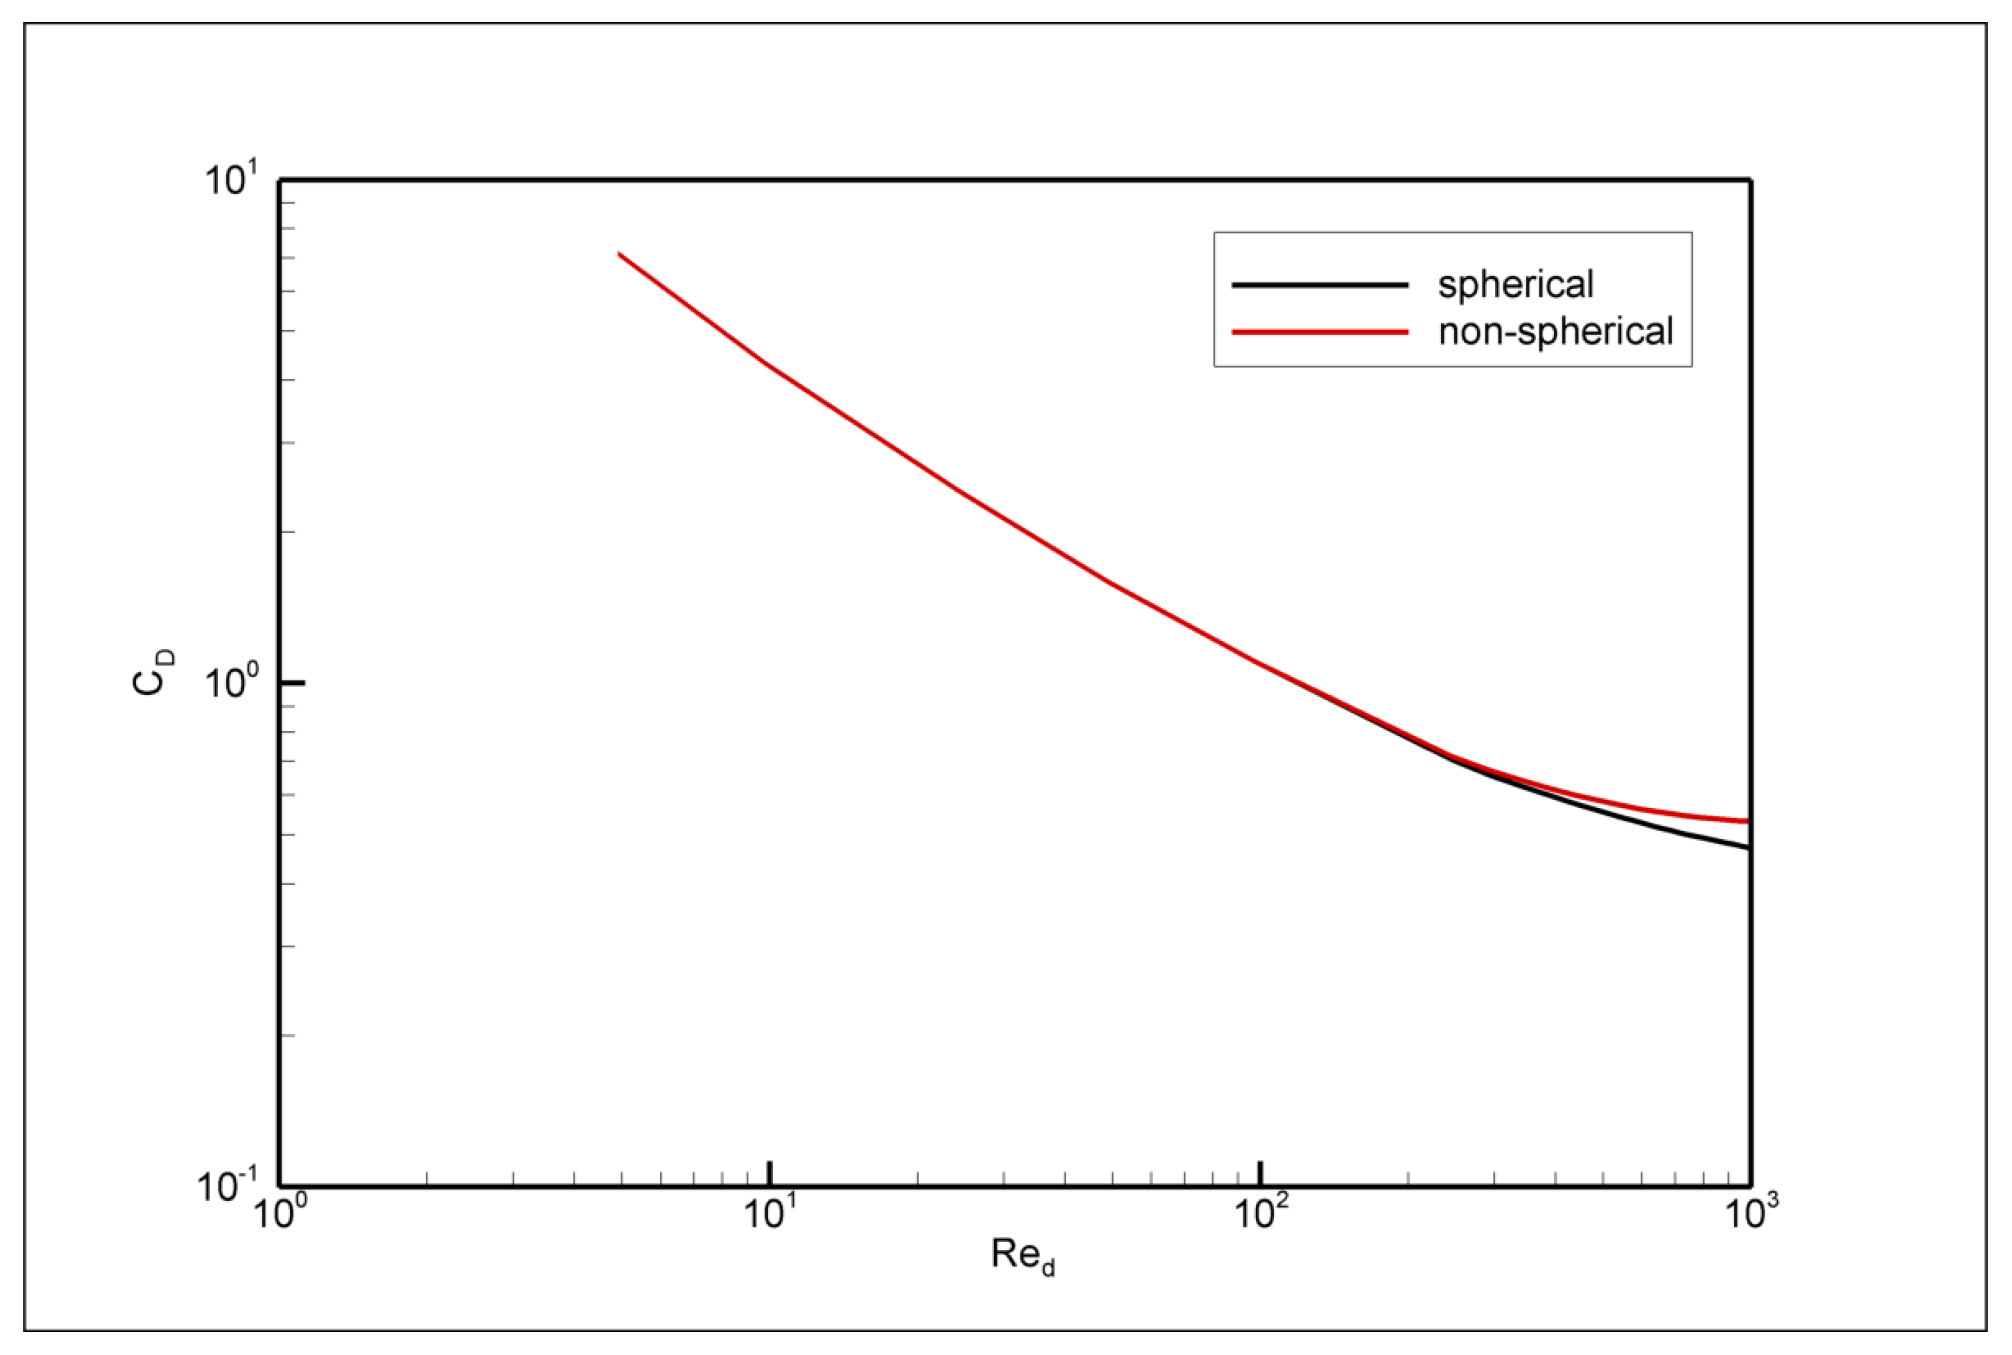
Drag coefficient of the droplet is calculated as a function of the droplet Reynolds number. Refer to
Section 3.2 below for a drag law suitable for SLD.
Trajectory calculations start from an upstream location far away from the airfoil leading edge (∼10 chord lengths) so that air flow velocity components are sufficiently close to their freestream values and proceed by integrating Equations (1) and (2) numerically. The initial droplet velocity is taken to be the terminal velocity:
The calculations continue until either the droplet impinges on the surface or moves past the airfoil trailing edge. Calculations are conducted for a large number of droplets in order to obtain an impingement distribution with sufficient resolution and accuracy on the surface so that the resulting collection efficiency distribution is also smooth and accurate.
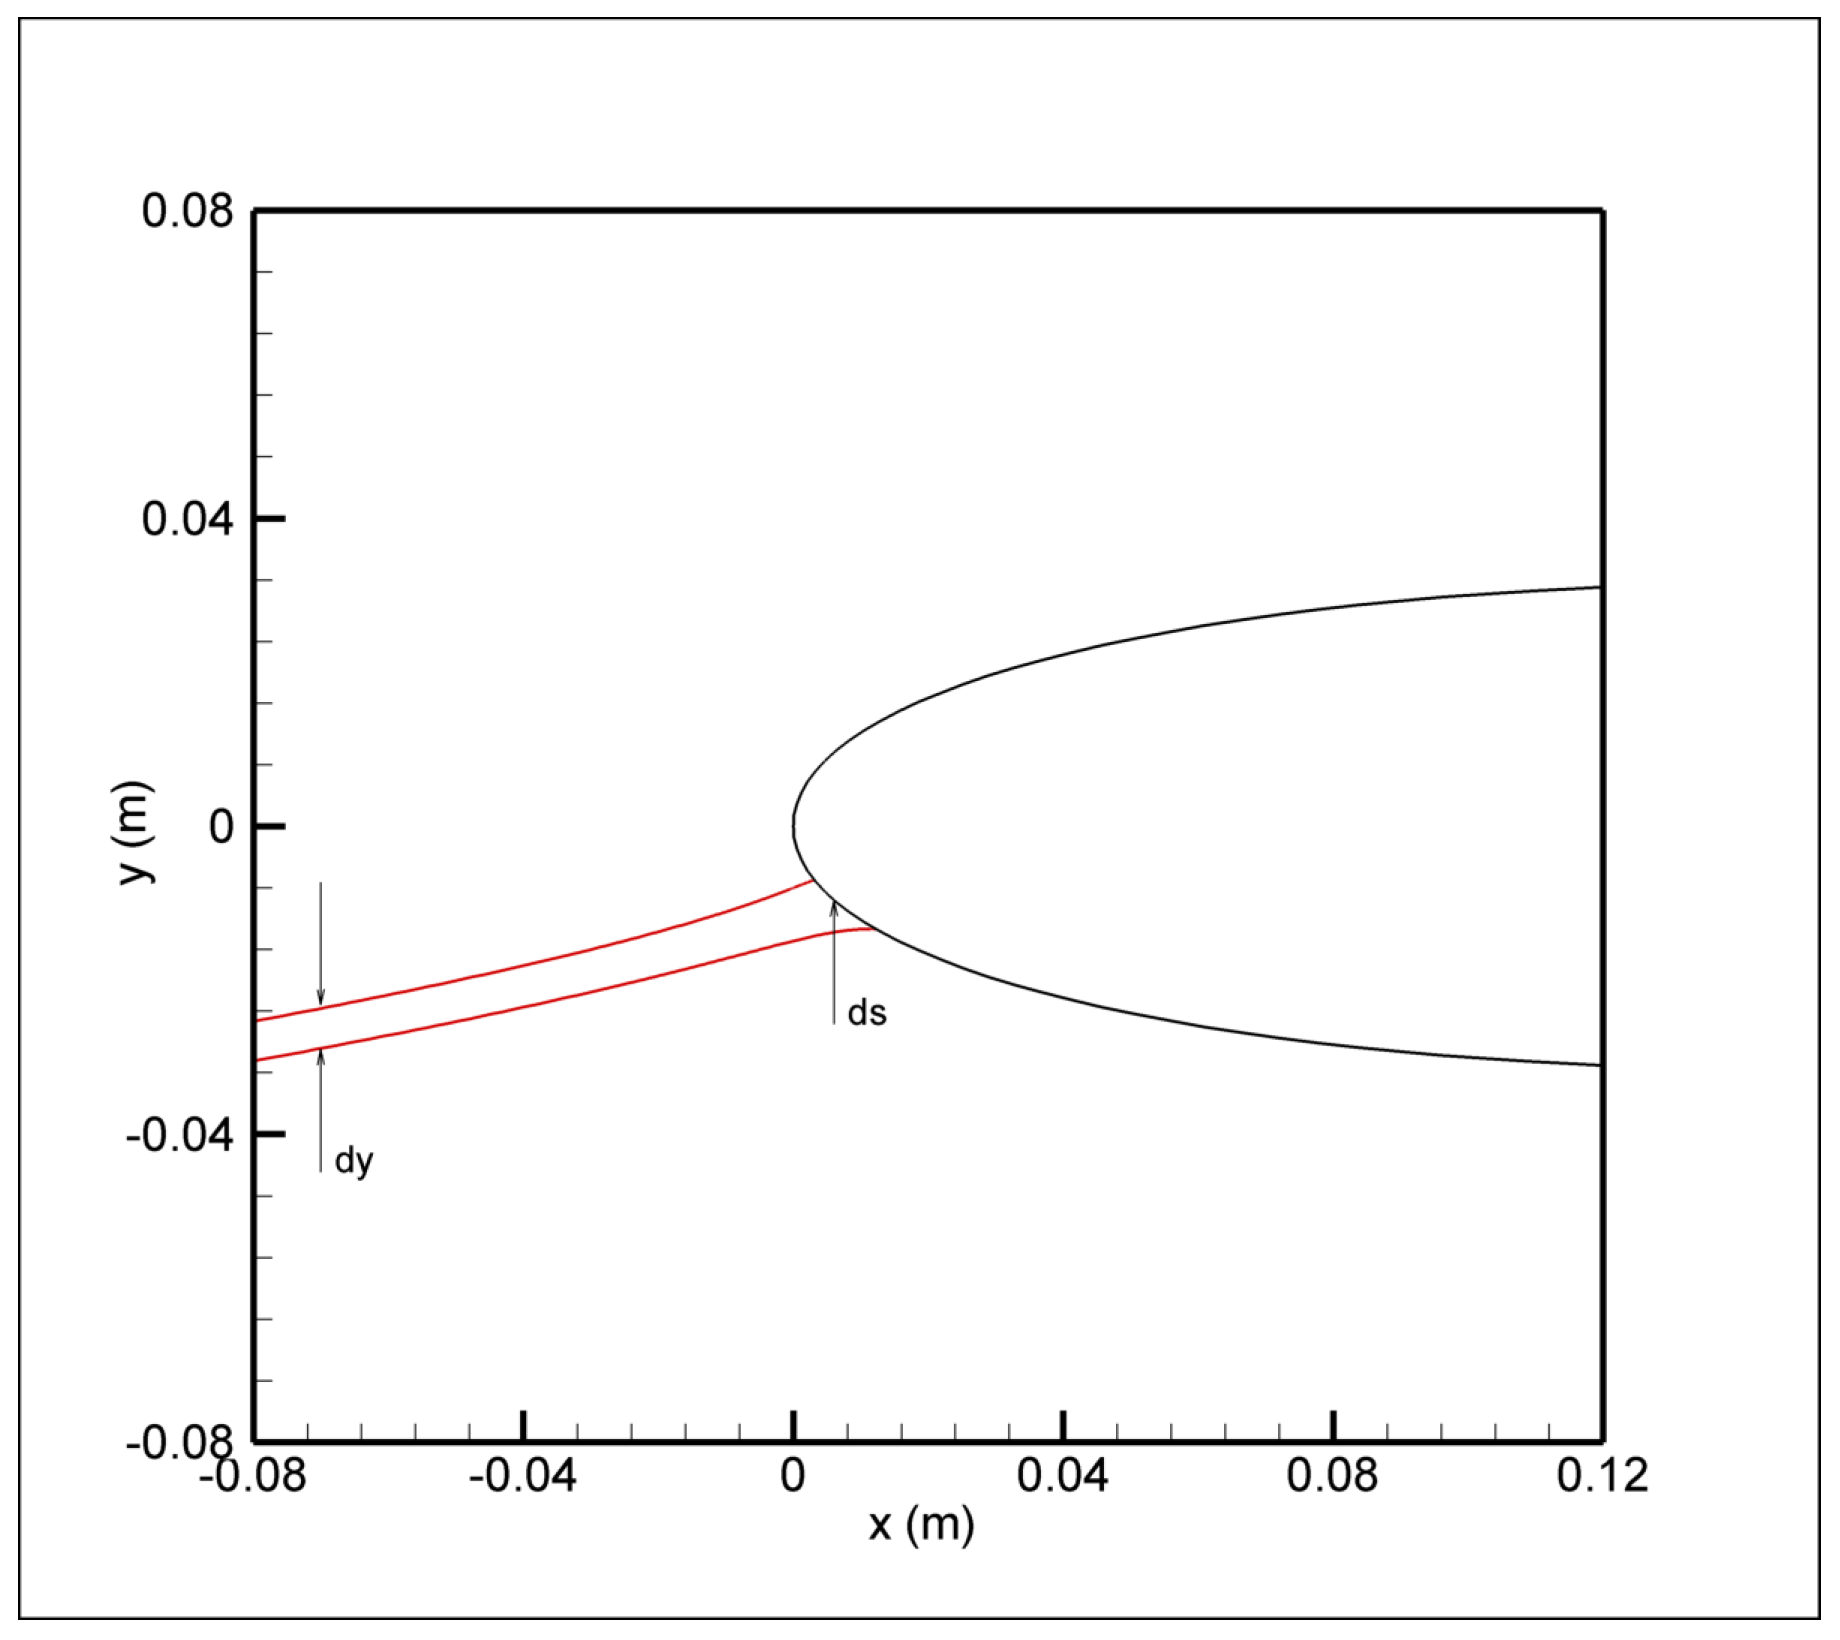
Collection efficiency is the ratio of the mass of droplets impinging on an obstacle, such as a wing or airfoil, in unit time to the mass of droplets that would impinge if the droplets were following straight-line trajectories. If the two trajectories are those of two adjacent droplets as shown in
Figure 1, then the local collection efficiency is obtained. If the distance between two adjacent droplets in the release plane is
and the distance between the same droplets in the impingement plane is
, then the droplet collection efficiency,
is defined as follows:
The region that remains within the limit trajectories is called the impingement zone. The impingement zone is the region that is wetted by the impinging droplets and, therefore, is the region where icing is expected to occur.
2.3. Convective Heat Transfer Coefficients
The integral boundary layer method is used for the calculation of the convective heat transfer coefficients. With this method, the details of the laminar and turbulent boundary layers are calculated with sufficient accuracy. Transition is fixed at the streamwise location where
according to the Von Doenhoff criterion. The roughness Reynolds number
is defined as follows:
where
is the roughness height, calculated from the sand grain roughness model [
23]:
where:
Notice that the above roughness model predicts a constant roughness value for the entire surface. For laminar flow,
, the equation of Smith and Spaulding is adopted to calculate the convective heat transfer coefficient [
24]:
where
s is the streamwise distance along the airfoil surface starting at the stagnation point,
k the thermal conductivity of air and
the dynamic viscosity of air. Conductivity of air,
k is calculated by using viscosity computed from Sutherland’s viscosity law, assuming constant Prandtl number and specific heat. Note, that Equation (11) is not dependent on roughness. Laminar momentum thickness is calculated using Thwaites’ formulation [
25]:
For turbulent flow
, the method of Kays and Crawford is employed. The turbulent convective heat transfer coefficient is evaluated from [
24]:
where
is the specific heat of air. The Stanton number,
can be calculated from [
24]:
is the turbulent Prantl number, while the roughness Stanton number,
is [
24]:
where
is the laminar Prandtl number. The boundary Reynolds number,
is defined as follows:
where
is the friction velocity, defined by:
The skin friction
is calculated using the Makkonen relation [
24]:
Finally, turbulent momentum thickness,
is computed using [
24]:
where
is the laminar momentum thickness at transition location, i.e.,
, calculated using Equation (12).
The boundary-layer calculations start at the leading edge and proceed downstream using the marching technique for the pressure and suction sides of the airfoil.
Utilization of the panel method combined with the integral boundary-layer method used in the current study introduces certain limitations. The most important of these, which has a potential effect on the accuracy of the calculations is that separated flow regions downstream of irregular ice shapes (like horns, etc.) cannot be fully modeled with the current approach. This will potentially result in inaccuracies in the droplet trajectory and convective heat transfer coefficient calculations. However, the accuracy loss due to this may not be as critical as feared for most icing situations because:
- (i)
The droplet trajectories end when they impact the windward side of the ice formation. However, flow separation will occur on the leeward side, where ice formation is not expected to occur. Therefore, the separated flow regions, where inaccuracies in the computations occur, will not be so critical for the droplet trajectories.
- (ii)
Likewise, the inaccuracies in the convective heat transfer calculations will not be so critical because the flow will separate at the leeward side of ice formation, where ice will not grow due to no droplet impact.
2.4. Ice Growth Rates: Extended Messinger Model
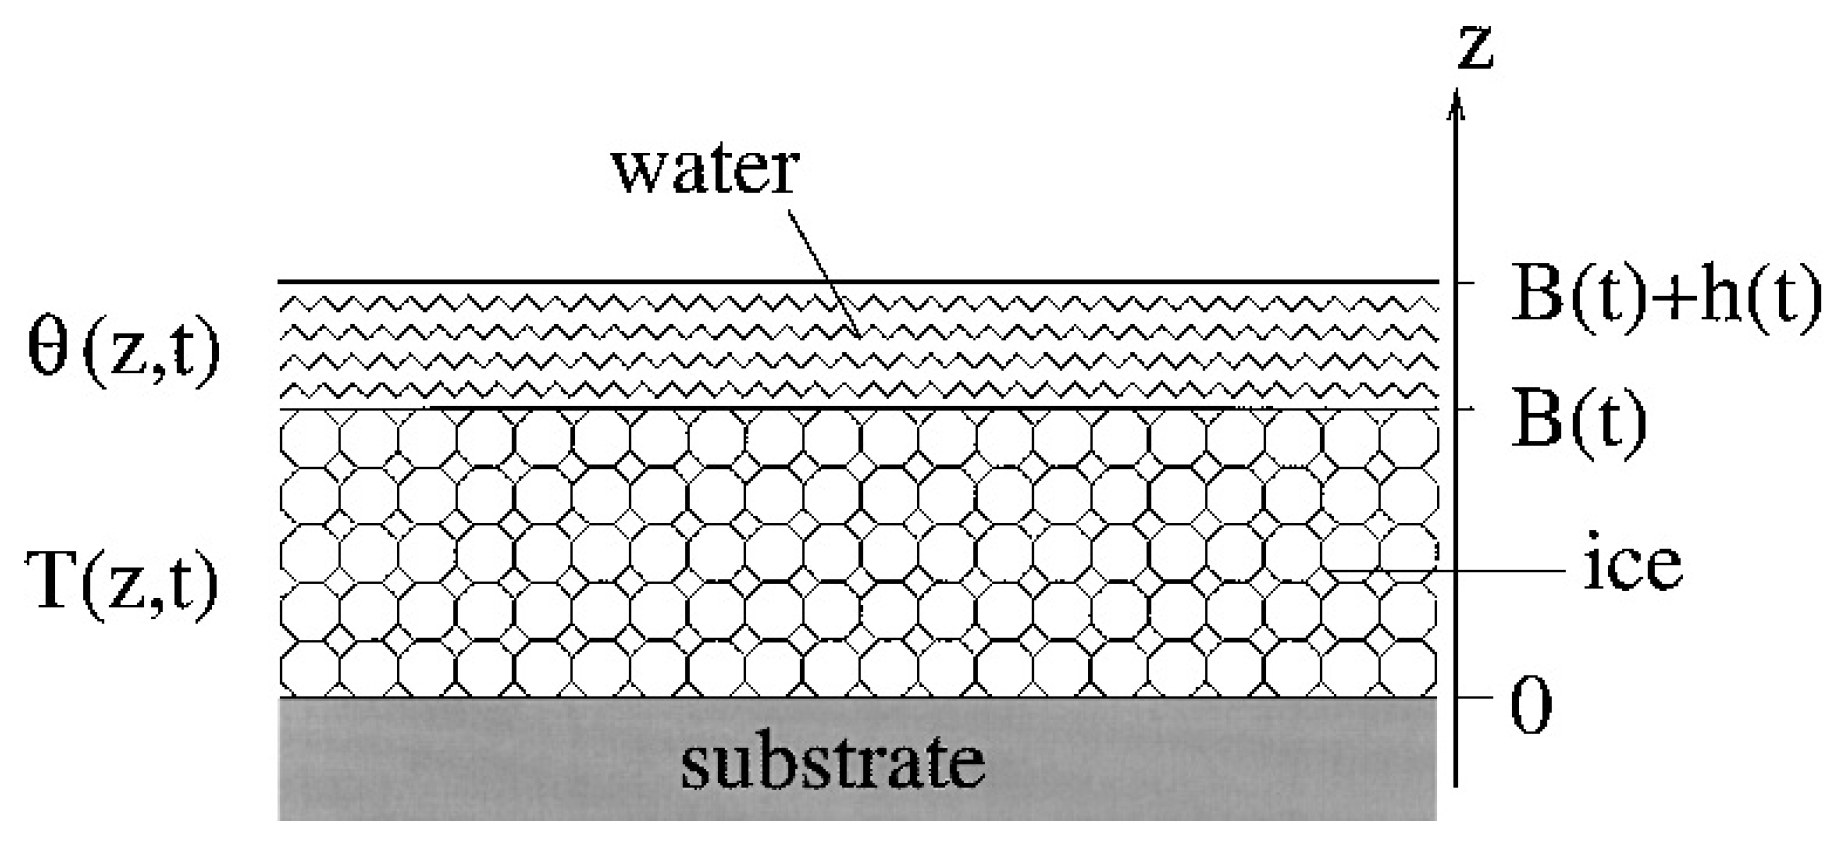
The ice shape prediction is based on the standard method of phase change or the Stefan problem. Consider the situation shown in
Figure 2. An ice layer of thickness
rests on top of a solid substrate. In the case of glaze ice, a water layer of thickness
will cover the ice. The temperatures of the ice water layers are denoted by
and
, respectively.
In this section, the Extended Messinger Model [
26], which is an improvement over the original Messinger Model is explained. To simplify the problem, a number of assumptions are associated with the model:
- (i)
The physical properties of ice and water do not vary with temperature. However, ice density is allowed to take two distinct values, or depending on whether rime or glaze ice forms. The transition between these two values is assumed to occur instantaneously.
- (ii)
The substrate temperature is fixed and known. This requires the substrate to have high conductivity and thermal mass much greater than that of ice formation.
- (iii)
The droplet temperature, air temperature and substrate temperature are taken as equal. However, this limitation can be easily relaxed such that the substrate temperature is taken as the adiabatic recovery temperature, the wet bulb temperature, or any other fixed temperature. Also, droplet temperatures may be taken as different from the air temperature allowing heat transfer to take place.
- (iv)
Phase change occurs at a single temperature, the freezing temperature of water, .
- (v)
The evaporation function is approximated by a linear curve (see below).
The phase change problem is governed by four equations: energy equations in the ice and water layers, mass conservation equation and a phase change condition at the ice/water interface [
26]:
In the above equations,
and
T are the temperatures,
and
are the thermal conductivities,
and
are the specific heats and
h and
B are the thicknesses of water and ice layers, respectively. In Equation (22),
,
and
are impinging, runback and evaporating (or sublimating) mass flow rates for a control volume (panel) respectively. In Equation (22),
, is called the impingement rate or the water catch rate. In Equation (23),
and
are the liquid water content and latent heat of solidification, respectively. The coordinate
z is normal to the surface.
The Stefan problem may be interpreted as the propagation velocity of the phase change boundary, i.e., ice growth rate, is proportional to the difference of the temperature gradients across the boundary, according to Equation (23).
The boundary conditions associated with Equations (20)–(23) are as follows [
26]:
- (i)
Ice is in perfect thermal contact with the substrate:
where
is the substrate temperature, which is taken as the adiabatic recovery temperature in this study, given as [
24]:
where
r is the adiabatic recovery factor (
for laminar flow and
for turbulent flow) and
is the local Mach number given as:
and
is the local temperature:
- (ii)
The temperature is continuous at the phase change boundary, and is equal to the freezing temperature:
This condition is not imposed for rime ice.
- (iii)
At the air/water interface (glaze ice), the heat flux at the interface is determined by convection
, cooling by incoming droplets
, evaporation
, kinetic energy of incoming droplets
, aerodynamic heating
and energy brought in by incoming runback water
:
At the air/ice interface (rime ice), the heat flux at the interface is determined by convection
, cooling by incoming droplets
, sublimation
, kinetic energy of incoming droplets
, aerodynamic heating
, energy brought in by incoming runback water
and latent heat released during solidification
:
- (iv)
The substrate is initially clean:
In the current approach, each panel constituting the airfoil is also a control volume. The above equations are written for each panel and ice is assumed to grow perpendicularly to a panel.
It needs to be pointed out that the Extended Messinger Model presented in [
26], which is essentially a one-dimensional model, is further extended to a two-dimensional model in this study. This is accomplished by taking mass and energy terms due to runback water flow in the conservation equations and interface conditions into account as in Equations (22), (29) and (30). Also, adiabatic recovery temperature computed from Equation (25) can be specified as a boundary condition, allowing Mach number effects to be taken into account. Finally, mass loss due to evaporation or sublimation is accounted for in the mass conservation equation, Equation (22).
2.4.1. Rime Ice Growth and Temperature Distribution
Rime ice thickness can be obtained directly from the mass conservation equation, i.e., by setting
in Equation (22) and integrating:
The temperature profile may be obtained by considering an asymptotic expansion of Equation (20), where the leading order term is (see [
26] for further details):
Integrating twice yields:
In order to find the integration constant
, Equation (24) is utilized:
In order to find the integration constant
, Equation (30) is employed:
Expressing the heat terms in terms of temperatures and physical characteristics:
Substituting the energy terms into Equation (36) and evaluating Equation (34) at
yields:
Using this,
is obtained as:
Hence, the temperature distribution in the rime ice layer is obtained as:
2.4.2. Glaze Ice Growth and Temperature Distribution
The temperature profile in the ice layer may be obtained by considering an asymptotic expansion of Equation (20), where the leading order term is (see [
26] for further details):
Integrating twice yields:
In order to find the integration constant
, Equation (24) is utilized:
In order to find the integration constant
, Equation (28) is utilized:
Therefore, the temperature distribution in the ice layer becomes:
The temperature profile in the water layer may be obtained by considering an asymptotic expansion of Equation (21), where the leading order term is as follows (see [
26] for further details):
Integrating twice yields:
In order to find the integration constant
, Equation (28) is utilized:
In order to find the integration constant
, Equation (29) is used:
Expressing the heat terms in terms of temperatures and physical characteristics:
Convective heat transfer,
:
Cooling by incoming droplets,
:
Evaporation heat loss,
:
where
is defined in Equation (40) and
is taken for 100% relative humidity.
is the evaporation coefficient defined as [
26]:
where
is the latent heat of evaporation.
Energy brought in by runback water,
:
where
is the mass flow rate of runback water into the control volume.
Aerodynamic heating and kinetic energy of impinging droplets terms are defined in Equations (45) and (46).
Substituting the energy terms into Equation (60) and evaluating Equation (58) at
yields:
Using this,
is obtained as:
Hence, the temperature distribution in the glaze ice layer is obtained as:
Mass conservation equation, Equation (22) is integrated to obtain the expression for water height,
h:
where
and
are the ice thickness and the corresponding time at which glaze ice first appears, respectively.
When Equations (56) and (68) are substituted into the phase change equation, Equation (23), a first-order ordinary differential equation for the ice thickness is obtained:
In Equation (71), the term
represents conduction in the water layer. In a typical aircraft icing situation, water will flow and it will typically achieve heights only
mm. In this case, conduction in the water layer may be neglected and it may be assumed that the water layer remains at an approximately constant temperature. Because
at
, then
for
.
Also, notice that Equation (71) has two terms on the right-hand side of the equality. The first of these terms that is proportional to
, represents heat conduction through the ice layer. For small ice thicknesses, such as the onset of accretion or in regions of low catch efficiency
, this term is likely going to be the dominant term in the energy balance. The second term that is proportional to
represents conduction through the water layer. As the water film height
h increases, it will behave like an insulating layer reducing the ice growth rate. The role of the water film is better understood if Equation (71) is rewritten as follows (after the assumption
is used in equations Equations (61)–(63)):
If cooling effects dominate, so that
, then the ice growth rate specified by Equation (72) decreases as the water layer thickness
h increases, i.e., the water layer insulates the ice from cold ambient conditions. On the other hand, if heating effects dominate, so that
, then the ice growth rate specified by Equation (72) increases as the water layer thickness
h increases, because the second term on the right-hand side of Equation (72) becomes negative, getting smaller as
h increases.
During the transition from rime ice to glaze ice, the ice growth rate is continuous:
Using Equations (32) and (71) in Equation (73) yields (bear in mind that
at
:
An important feature of this equation is that it allows positive, negative and even infinite values of
. These may be interpreted as follows:
- (i)
If , then Equation (74) indicates the ice thickness at which glaze ice first appears.
- (ii)
If or glaze ice will never appear. This could occur either because the numerator , the substrate is warmer than the freezing temperature of water, or the denominator of Equation (74) is less than or equal to zero, in which case there is not enough energy in the system to produce water and the ice accretion is pure rime, throughout the entire icing exposure.
The time at which glaze ice first occurs is obtained from Equation (74) using Equation (32):
In order to calculate the glaze ice thickness as a function of time, Equation (71) is integrated numerically, using a Runge–Kutta–Fehlberg method [
22].
Notice that the glaze ice problem is coupled. The temperatures for ice and water layers specified by Equations (56) and (68) depend on ice thickness B and water layer thickness h, which in turn, depend on the temperature through Equation (23).
The method for solving an ice accretion problem under known ambient conditions for a control volume (panel) proceeds as follows:
- (i)
Calculate all the necessary parameter values like the collection efficiency and determine the ice thickness and time at which glaze ice first appears, and using Equations (74) and (75).
- (ii)
If , this indicates that glaze ice never forms. Alternatively, if there will not be sufficient time for glaze ice to occur. In either case, ice thickness is calculated from Equation (32) and temperature distribution from Equation (51). Calculations terminate when .
- (iii)
If and , then glaze ice will form during the icing exposure. The ice thickness is determined by numerical integration of Equation (71) starting at . Once is known, the water layer thickness h, ice layer temperature distribution and water layer temperature distribution are calculated from Equations (56), (68) and (70), respectively.
2.4.3. Freezing Fractions and Runback Water
Freezing fraction for a given control volume (which is a panel in this case) is the ratio of the mass of water that solidifies to the sum of masses of water that impinges on the control volume and the runback water that enters the control volume:
Therefore, runback water that flows out of the control volume can be calculated from:
Obviously, Equation (78) will be
only for glaze ice. Equation (78) becomes
for the neighboring downstream panel. Runback water is handled differently depending on whether the model is mounted horizontally or vertically in the wind tunnel:
2.4.4. Evaporating and Sublimating Mass
Evaporating and sublimating mass can be computed from [
28]:
where
is the local pressure. Also,
and
are the vapor pressures at the ice surface (rime ice) or water surface (glaze ice) and the ambient air, respectively. These are computed from [
28]:
where
,
T in Kelvin.
2.4.5. Single Versus Multi-Step Computational Approaches
Computing the ice shapes in a single cycle or computational step for the entire icing exposure may yield incorrect ice shapes. This is particularly true for:
Glaze ice conditions where the runback water effect is prominent.
Exposures where the icing conditions are varying, like climbing or descending flight.
Long exposures.
In the current solution method, the unsteady problem is solved by a quasi-steady approach. Therefore, a continuous flow of water, impingement, ice and water accumulation has to be analyzed in as small as possible intervals to represent these faithfully, but this increases computational time. With a multi-step approach, the effect of ice formation on the flow field, droplet trajectories, ice formation and runback water are taken into account to some degree. At each computational step, the flow field solution, droplet trajectories, collection efficiencies, energy terms and the ice formation routines are repeated.
The number of time steps required may be estimated based on the accumulation parameter [
29]:
where
c is the chord length of the airfoil. The above equation implies that whenever the ice thickness exceeds 1% of the chord length, a new computational step needs to be started. The authors’ own experience shows that
seconds is a good compromise between computational time and accuracy. The two approaches give very similar values of
for most cases.
5. Conclusions
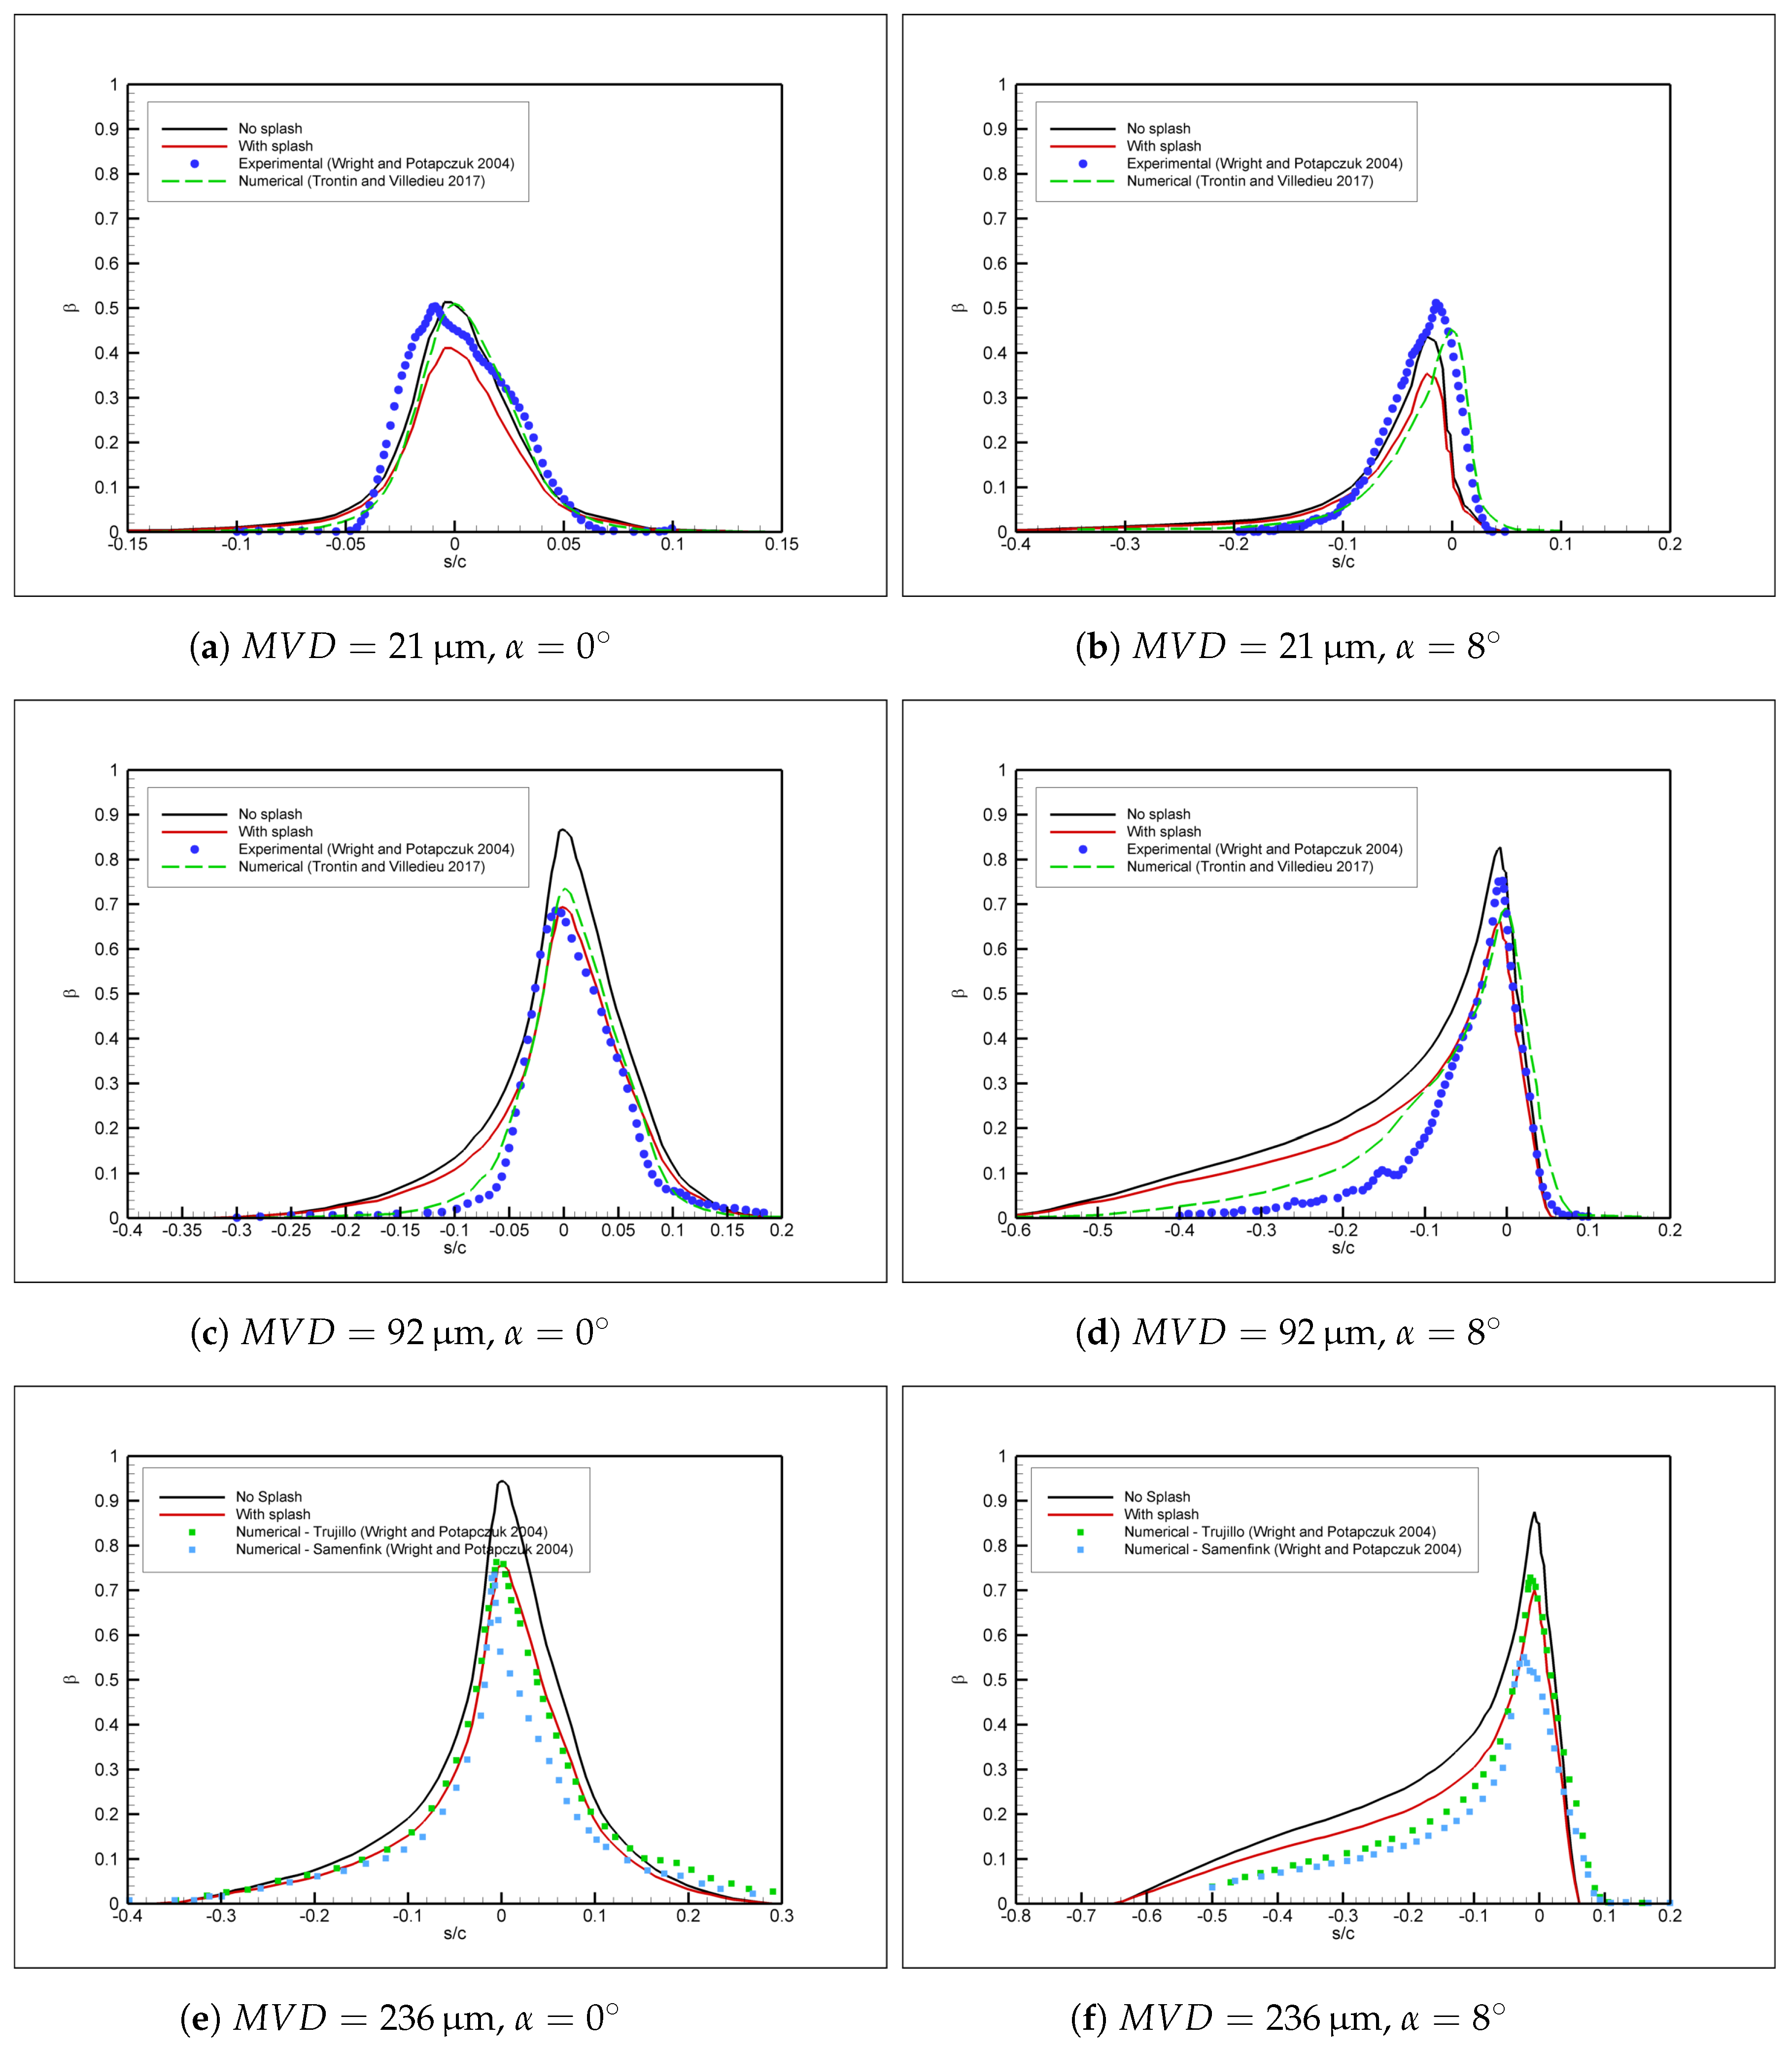
Numerical models related to SLD physics, namely those related to gravity, droplet deformation, droplet breakup and droplet splash have been studied extensively using an in-house computational tool for ice accretion prediction. The in-house computational tool comprises four modules for the computation of the flow field (with panel method), droplet trajectories (with Lagrangian method), convective heat transfer coefficients (with integral boundary-layer method) and ice growth rates (with Extended Messinger Method). SLD-related phenomena have been introduced into the computational tool using empirical models and an extensive study of the basic physics of these phenomena has been accomplished. The results obtained in the study have been compared with known experimental and numerical data in the literature resulting in fair to good agreement.
The results indicate that gravity and droplet deformation have indeed less significant effects compared to droplet splash, in agreement with what has been reported in previous literature. Droplet breakup is generally also less significant than droplet splash; however, for very large drops, it was observed that secondary breakup may occur and this may result in more significant mass loss than previously reported in the literature.
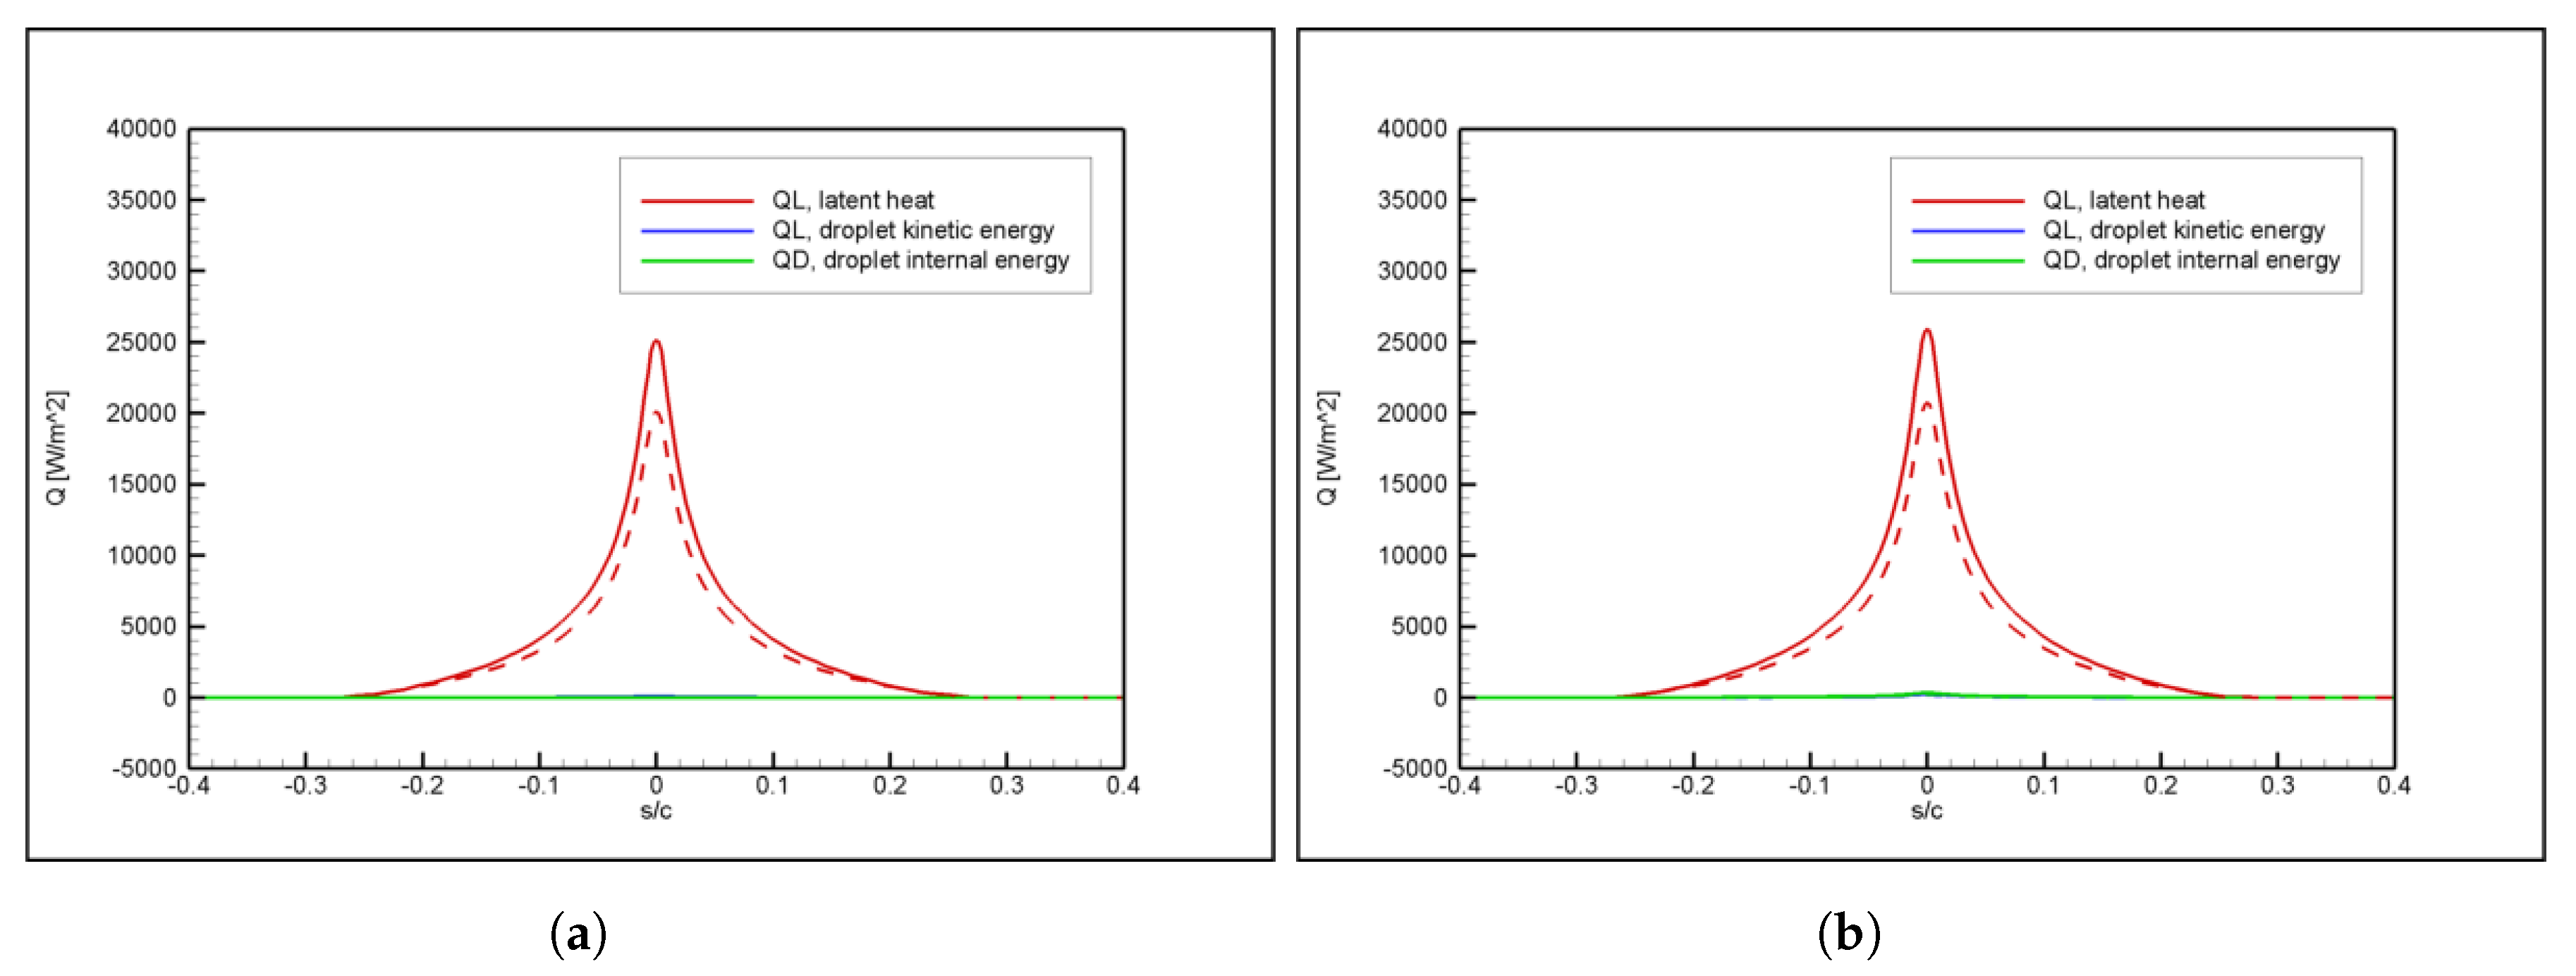
Droplet splash is still observed to be the most significant large droplet effect, again in agreement with previous literature on the topic. In addition to its known effect on mass balance, droplet splash has been shown to have a significant effect on energy balance as well and this may have an important effect on the validity of the results obtained in similar conditions. This effect and secondary breakup are the most important and novel findings of the current study.
The question of whether the temperature of the water droplets generated by the spray system converges with the static air temperature when the droplets impinge on the test object in a wind tunnel is a valid and important one. Part of the discrepancies above may be attributed to this effect, which may be particularly significant for large drops. Investigation of this phenomenon and its effects on overall thermal balance, impingement characteristics, and resulting ice shapes are targeted as a future endeavor.
In order to improve their capabilities and accuracies, these and similar computational tools need to be continuously validated with new wind tunnel data whenever they become available. This will also eventually result in models that will represent the physics more faithfully. Through this, computational tools developed worldwide will make significant contributions to airworthiness certification efforts of new aircraft and enhanced safety levels. This will eventually serve to achieve the goal of safer, greener, cheaper and more efficient air transportation and aviation in general, worldwide.
