Abstract
This paper presents a comprehensive comparative study of the resilience of leading edge anti-icing systems on business jets when exposed to severe hailstorm conditions. Using advanced simulation models correlated with experimental data, the study aims to determine the overall effectiveness of these systems when exposed to the adverse effects of hail impact. Key aspects of the study include the examination of system structural response to varying sizes and densities of hailstones, and the impact on the leading edge structural integrity and on the overall aircraft safety. The simulations are designed to replicate realistic hailstorm scenarios, considering factors such as hailstone velocity, size, and impact angle. Results from the study reveal significant differences in the performance of piccolo-tube anti-icing system under hailstorm conditions. The study assesses the operational limitations and the energy absorption of a business jet anti icing system, providing valuable insights for anti-icing robust design in this category.
1. Introduction
In the rapidly evolving aviation industry, ensuring the operational safety and efficiency of aircraft under adverse weather conditions is paramount [1,2,3,4,5,6,7]. Among the diverse challenges faced by the sector, ice formation on critical components such as the leading edges of wings and empennages during flight presents a significant risk. Anti-icing systems to be certified require intrinsic robustness that permit maintenance of the minimal functionality of the anti-ice capability, also after small structural damages caused by soft body impact such as hailstones or birds (a catastrophic impact has been depicted in time sequence in Figure 1).
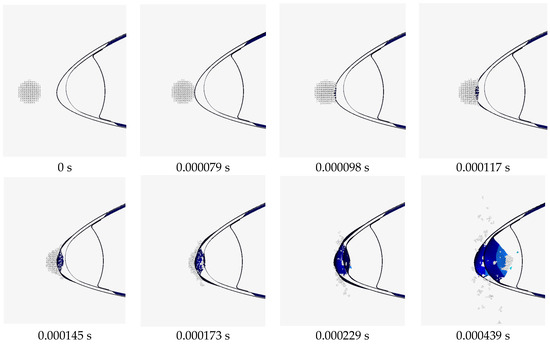
Figure 1.
Impact sequence (hailstone diameter 25 mm).
The risk discussed in the present study pertains to the damage caused by hailstorms, particularly to airfoil leading edge anti-icing. Hailstones, while not causing ice accretion directly, lead to erosion and even plastic deformation and perforation on the anti-icing systems and on other parts of the aircraft. This effect compromises the integrity of these systems, potentially reducing or ending their functionalities.
The aim of this work is to answer the question of what specific damages are associated with different types of hailstorms and the subsequent effects on aircraft systems operativity, considering the compromised state of the anti-icing system due to erosion. Business jets and medium liners typically avoid hailstorms or perform unplanned landings when faced with such conditions.
Recent advancements in anti-icing technology have led to the development of various systems designed to counteract the ice accumulation, which can severely impair aerodynamic performance and compromise safety. The diversity in technology approaches—ranging from thermal systems that use heat to prevent ice formation to innovative coatings that reduce adhesion of ice on surfaces—illustrates the industry’s commitment to improving resilience against harsh environmental factors.
Diffused literature has reported damage assessment over structural panels [8,9,10,11,12,13,14] but no evidence has been obtained in the application of similar techniques to anti-icing systems operativity post hailstorm impact [15].
While several studies have examined the impact of hail on the aircraft wing system [16,17,18,19,20], these investigations have primarily concentrated on the immediate structural damage and performance degradation of the structural panel themselves. However, there has been a noticeable gap in research regarding the effects on the back-standing systems, which include crucial components such as the anti-icing system with a piccolo tube. Our study addresses this oversight by providing a comprehensive analysis of how hail impacts these back-standing systems, thereby offering a more holistic understanding of the overall damage and risks to aircraft during hail events.
This paper presents an in-depth analysis of leading edge thermal anti-icing systems (piccolo tube-like) employed in the business jet sector, evaluating its structural performance and resilience when subjected to severe hailstorm conditions. Utilizing advanced validated models [21] and correlating hailstorm parameters with experimental data, this study assesses the capability of piccolo tube anti-icing technologies to maintain structural integrity during hail impacts. This study focuses on understanding the damage caused by hailstorms to aircraft components, particularly the anti-icing system, with a specific emphasis on the impact on system effectiveness.
By investigating the types of damage sustained from various hailstorm conditions, the authors aim to provide valuable insights that can enhance aircraft safety and performance. To achieve this, a reference wing section of the Piaggio P180 [22] business aircraft was subjected to different types of hailstorm scenarios to assess the extent and nature of the damage. This research is intended as a starting step to improve data-driven decision-making processes regarding storm circumnavigation and safe flight operations, ultimately contributing to the development of more resilient anti-icing systems and better-informed pilot protocols.
2. Materials and Methods
In the following sections, the setup of the model and the design of experiment (DOE) [23] will be detailed to furnish the reader with a clear framework of the analysis presented in this study.
2.1. Model Description and Setup
The foundational aspect of this investigation centers on a meticulously defined geometric model representing an industrial-level segment of a business jet wing [22]. This model is integral to studying two critical components:
- The leading edge;
- The anti-icing system.
Constructed from three layers—each 1 mm thick—the model features an external layer forming the leading edge and two internal layers composing the anti-icing system’s conduit. The anti-icing system is permanently affixed to the external layer via a welding and riveting process. Notably, this system incorporates a series of equidistant holes, similar in principle to the well-known piccolo tube, facilitating the circulation of heated air, a preventive measure against ice accumulation on the leading edge [24]. An isometrical view of the anti-icing system is reported in Figure 2.

Figure 2.
Anti-icing system: (a) System overview [25], (b) FEM model.
In the configuration of the finite element analysis, Altair Hypermesh 2023 [26] software was selected for model development due to its recognized capabilities. The initial phase focused on material definition. Ergal 7075 [27] was employed for the wing section, modeled according to the Plastic-Johnson constitutive law. The material parameters are detailed in Table 1.

Table 1.
T6 standard values.
The parameters a, b, and n, essential for delineating the material’s plastic response, were determined based on the manufacturer’s specifications, given the known values of σyield, σuts, and εuts. The governing equation for these parameters is expressed as:
Engineering stress and strain were derived from actual values using the relations:
Utilizing these fundamental parameters, calculations for a, b, and n were conducted as follows:
For the analysis of hail impact, the Plastic-Johnson model adapted for hydrodynamic applications was chosen [28]. Evaluating the mechanical properties of hail poses substantial challenges due to its complex formation and the replicability issues in obtaining reliable laboratory samples. The most robust data available were sourced from a 2008 EASA report [29], depicted in Figure 3. Conservatively, the stress–strain curves from hail samples, indicative of the severest mechanical properties under high-velocity impacts, were incorporated into our analysis.
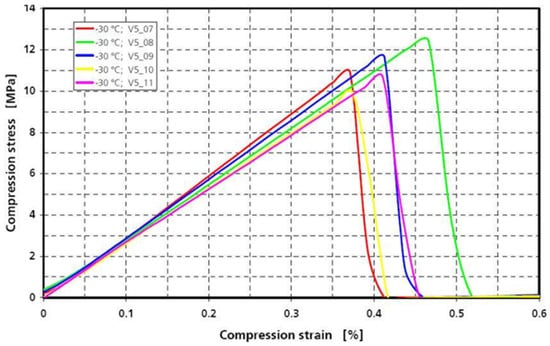
Figure 3.
Compression test as obtained from [29].
The values of interest were reported by EASA as average values and are 2.757 GPa for the Young modulus, 11.104 MPa for the maximum stress, and 0.434 for the maximum compression strain at rupture.
In light of these considerations, it became imperative to assess the performance of smooth particle hydrodynamics (SPH) elements [30,31], specifically applied to model hail, based on parameters provided by EASA. Afterward, a detailed reconstruction of EASA’s actual hail specimen was implemented within the authors’ simulation framework to execute an equivalent virtual compression test, whose models are reported in Figure 4.
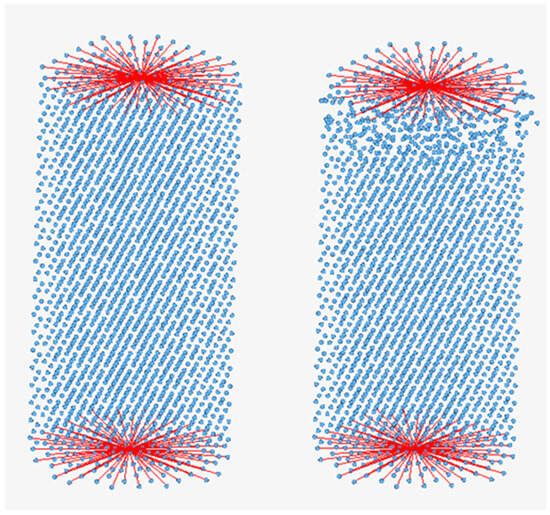
Figure 4.
Virtual specimen test, red line are rigid connections.
The outcomes after the fine tuning displayed a stress–strain curve that, while closely following the expected brittle behavior (observable through visual analysis), exhibited minor deviations from EASA’s reported values, as illustrated in Figure 5. Negligible post-failure discrepancy led to the initiation of an iterative optimization process, where model parameters were systematically varied to achieve alignment with empirical data. The procedure aimed to refine the simulation accuracy, resulting in the optimized parameters detailed subsequently.
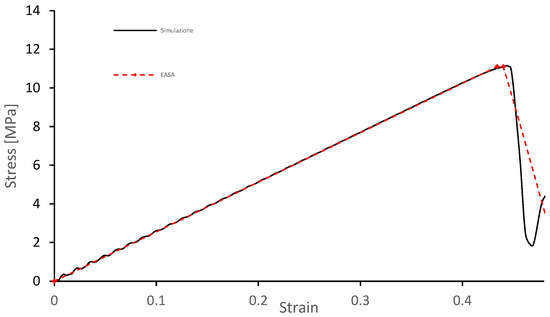
Figure 5.
Stress–strain comparison between virtual compression and experimental data from EASA.
The configuration that resulted in Table 2 was established as the standard for ongoing studies.

Table 2.
Hail parameter @ −30 °C.
Following this, mesh development was prioritized. Given the wing’s surface layers’ thinness relative to its overall scale (s/L < 1/10), a 2D spatial discretization approach was adopted, facilitating a reduction in both mesh complexity and computational time. A higher resolution discretization was implemented in the central region of the leading edge and internal anti-icing system, while a coarser mesh was applied to the outer regions to economize on computational resources.
To accurately simulate the mechanical connections, such as welding points between different components, a nodal connection system was employed, highlighted by yellow lines in Figure 6.
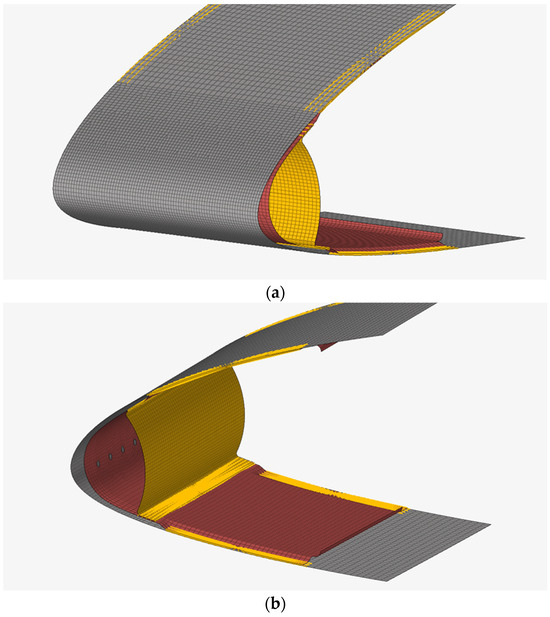
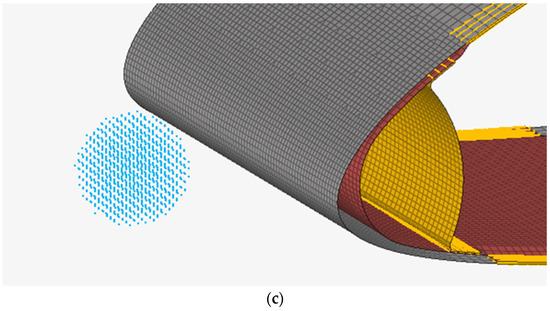
Figure 6.
Model mesh: (a) Front view, (b) rear view, and (c) hail SPH mesh. Different color are related to different components according to FEM model description.
Additionally, to capture the dynamic and complex physical behaviors of hail impacts, smooth particle hydrodynamics (SPH) techniques were utilized. These 3D elements are adept at modeling complex interactions inherent in hail impacts. Upon finalizing this stage, properties for both solid and SPH elements have been specified and are reported in Table 3 and Table 4.

Table 3.
Anti-ice and leading edge properties.

Table 4.
Hail properties.
To ensure a similar responsivity of the leading edge system under impact, constraints were enforced at the extreme right and left nodes of the model, immobilizing all six available degrees of freedom. Details of these constraints are illustrated in the accompanying Figure 7.
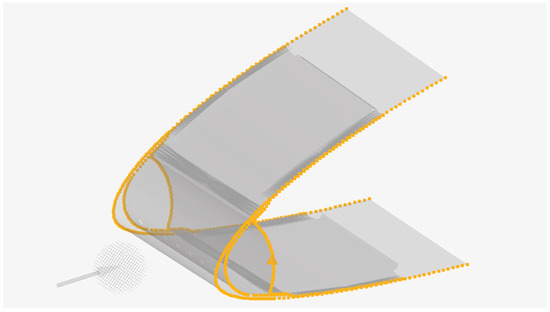
Figure 7.
Constraint applied. Orange color depicts the constraint location points.
The final component of the impact simulation setup involved specifying the initial impact velocities for hail. This was conducted with velocities assigned as vector triplets. Figure 8 depicts graphically the impact angle of the hail. Numerical results applied are reported in Table 5. The velocities were distributed among the Cartesian components, depicted in Figure 9 and based on the design of experiment (DOE), particularly considering different angles of inclination. For instance, the setup scenarios include intermediate velocities for angles of −5°, 0°, and 5°, demonstrating the methodological approach to modeling various impact conditions.
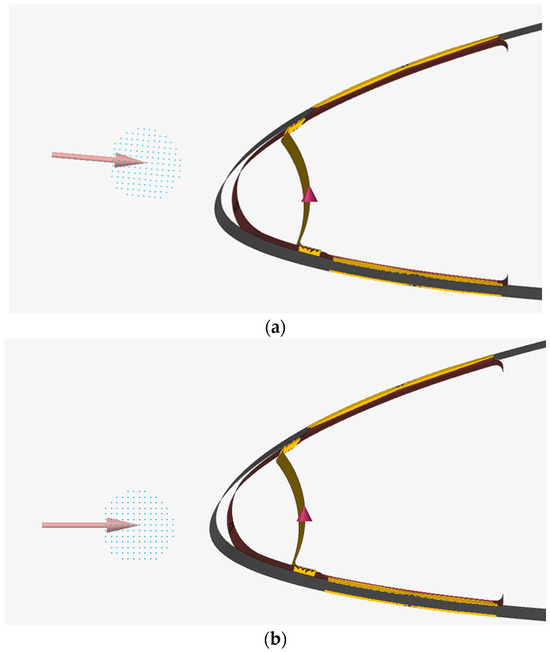
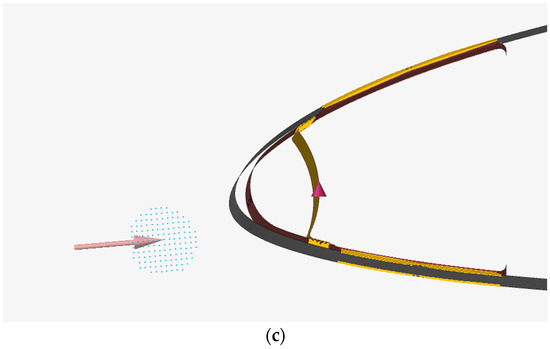
Figure 8.
Impact of hail at different angles: (a) −5° deg, (b) 0° deg, and (c) +5° deg. Different color evidences in the leading edge different sub components.

Table 5.
Speeds for a cruise at 128 m/s (≈460 km/h).
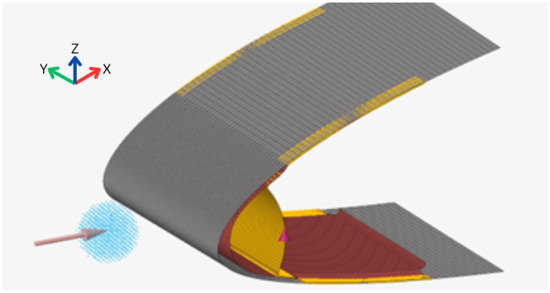
Figure 9.
Complete setup. Different color evidences different components of the leading edge anti ice panel.
In the simulation configurations, the runtime was strategically selected based on the impact velocity to optimize the visualization of impact dynamics and subsequent analysis. The frequency for capturing animation frames and key physical parameters was calibrated to one percent of the total runtime, ensuring detailed temporal resolution for accurate dynamic representation. An image summarizing the complete setup is shown in Figure 9.
2.2. DOE Setup Description
In order to assess the behavior of the anti-ice leading edge panel under a hailstorm, a large displacement simulation setup has been set up in order to simulate hail impact and evaluate the damage affected. Concerning outputs, focus was placed on three key variables: hail diameter, hailstone flight velocity, and the impact angle, due to their substantial influence on the extent of structural damage on the anti-ice system. A design of experiment (DOE) approach was adopted, encompassing 27 different scenarios [23,32,33].
Hail diameters were selected at 10 mm, 25 mm, and 40 mm to simulate varying sizes commonly encountered during hailstorms. It was assumed that hailstones could be modeled as perfect spheres, simplifying the computational geometry while focusing on diameter as a crucial determinant of impact severity.
The cruise speed of the aircraft is another critical parameter, and it has been set at three distinct speeds: 108.6 m/s (391 km/h), 128.6 m/s (462 km/h), and 197.5 m/s (711 km/h) [22], corresponding to low-speed cruise, normal speed for climbing phase and descent, and lastly, maximum speed for cruise. Values have been selected considering the ranges of the business jet aircraft. This last parameter is essential as the kinetic energy of hail, which impacts the energy transferred to the aircraft structure during a collision, increases quadratically with velocity, according to Galilean analogy.
The impact angle was the third variable, chosen to reflect the angle of attack of the aircraft’s leading edge in respect to the airstream. Angles of −5°, 0°, and +5° were studied to understand how different impact trajectories could affect the distribution and severity of damage, particularly on different flight conditions, i.e., descent, cruise, and ascent. The global schematic view of the DOE described above is depicted in Figure 10.
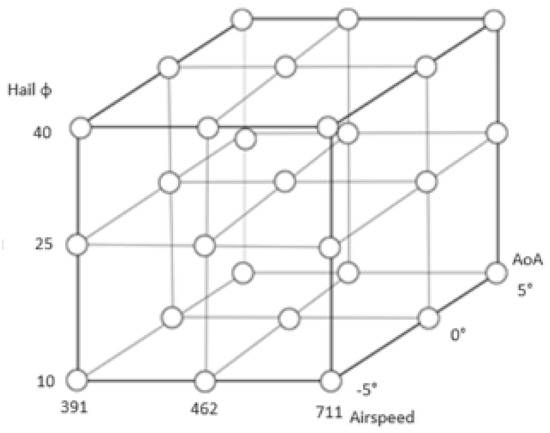
Figure 10.
Design of experiment setup schematic.
3. Results
The results were evaluated after completing all 27 design of experiment (DOE) simulations. Initial qualitative analysis of the images confirmed adherence to anticipated physical behaviors. Observed phases, including impact, creation of the stagnation point, fragmentation, and structural damage, were consistent and validated with previous literature. Following this preliminary scrutiny, numerical output files were analyzed to associate useful metrics with various impact scenarios. It was observed that increases in hailstone size and impact velocity correlated with increased damage to the structure. To elucidate the relationship between the damage and DOE parameters, numerical output data pertaining to energy metrics were utilized. The objective is to construct a risk map, enabling pilots to assess flight safety based on their flight conditions when traversing the disturbance.
3.1. Risk Map
In this paragraph, a comprehensive risk assessment [34] analysis was employed to scrutinize the system resistance of a leading edge anti-icing system using finite element method (FEM) simulations. Specifically, the analysis aimed to assess the damage inflicted by hailstone impacts on the system’s performance. The anti-icing system under investigation comprises a tri-layered metallic structure, where each metal sheet is integral both in maintaining its geometric form and in preserving interlayer connections essential for the system’s overall functionality. The schematic picture is shown in Figure 11.
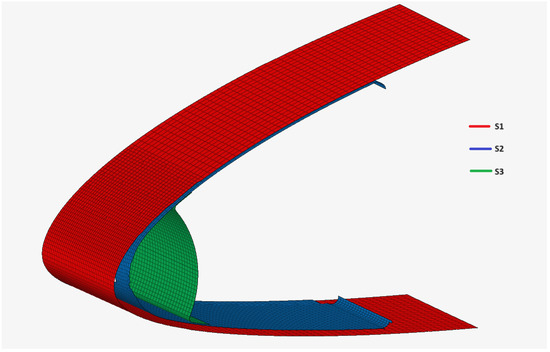
Figure 11.
Schematic of leading edge airfoil with sheet identification.
Post impact, a meticulous damage assessment was conducted to evaluate the extent and nature of the damage incurred. This assessment differentiated between three types of damage: elastic, wherein the impact energy is completely absorbed, allowing the material to return to its original state without undergoing plastic deformation; plastic, where the impact results in permanent plastic strain without causing perforation; and rupture, characterized by a breach in skin integrity that compromises the system capability to perform anti-icing functions and maintaining structural integrity. Visual examples of S1 impact damage assessment are shown in Figure 12.
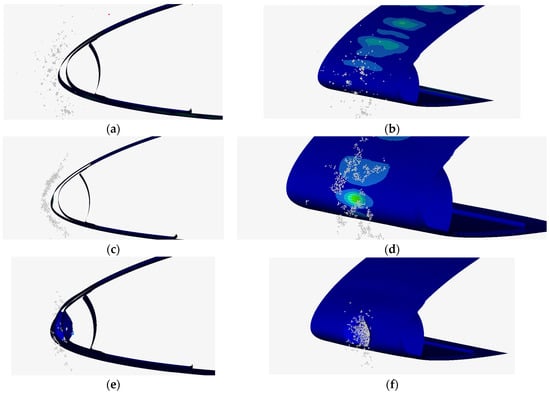
Figure 12.
Impact damage assessment: (a) S1 elastic deformation, section view, (b) S1 elastic deformation, isometrical view, (c) S1 plastic deformation, section view, (d) S1 plastic deformation, isometrical view, (e) S1 perforation, section view, and (f) S1 perforation, isometrical view.
To quantify the severity of damage across the different metallic skins, differential weighting was applied, though the cumulative damage across all layers was normalized to a sum of 100. The specific weightings assigned to the same type of damage on different skins were calibrated to reflect their varying impacts on system functionality. These values are detailed in the accompanying Table 6, which presents a systematic breakdown of the weighted damage assessments and their implications for the structural integrity. Elastic damage is multiplied by a constant value of 5 imposed to consider multiple damaging in future studies. Plastic damage instead is imposed with a double value of 10, and increased to 15 in the S2 part due to the loss of air duct permeability and thus the complete loss of anti-icing function. Rupture similarly represents a constant weight of 15 increased up to 20 for S2 for the same reason.

Table 6.
Damage weights imposed.
The Boolean outcome of the damage assessment is reported in Table 7 where means no damage occurred and 1 means damage was assessed.

Table 7.
Damage assessment Boolean table.
The results of the risk computation are succinctly depicted in Table 8, which provides a detailed visualization of the risk outputs, offering clear insights into the vulnerability of the anti-icing system under various impact conditions.

Table 8.
Risk evaluated outcome.
The same evidence obtained in Table 8 are also depicted in Figure 13. A clear trend indicates a heightened risk correlated with increased cruise speeds and larger hailstone diameters, resulting in damage up to and including complete leading edge perforation (100%). The angle of attack demonstrates a local optimum in the damage pattern, with maximum damage observed at a 0° angle and symmetrically reduced damage at ±5° angles.
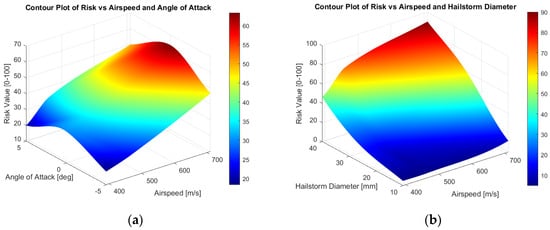
Figure 13.
Risk contour plot: (a) Risk vs. airspeed and angle of attack and (b) risk vs. airspeed and hailstorm diameter.
The transfer of kinetic energy, as illustrated by the damage depicted in Figure 13, is critically dependent on both the mass (hailstone diameter) and velocity. This relationship underscores the significance of these parameters in assessing and mitigating the risk of damage in high-speed flight conditions.
3.2. DOE Results
For what concerns the numerical results extracted from the analysis of the design of experiment (DOE), Table 9 summarizes the types of quantitative data extracted. These include the kinetic energy involved in the impact, the internal energy at the end of the impact, and the conversion rate of the former into the latter, which serves as an indicator of the deformation imparted to the structures. This comprehensive summary of quantitative metrics not only facilitates a deeper understanding of the dynamic interactions during impact but also enhances the ability to predict structural responses under various impact conditions.

Table 9.
DOE energy results.
The analysis of the main effects (shown in Figure 14) from the design of experiment (DOE) elucidated the relationships between various parameters and the resulting damage levels and energy transformations. It can be observed that the damage level is linearly dependent on the hailstone mass (function of the diameter, a design variable), aligning with expectations due to the direct impact of mass on kinetic energy. Interestingly, damage also exhibited a quadratic relationship with airspeed, a result anticipated given that kinetic energy is proportional to the square of the velocity. Additionally, the angle of attack demonstrated a specific pattern where maximum damage occurs at 0 degrees, with a slight reduction in damage observed at both −5 and +5 degrees, as depicted also in Figure 13a.
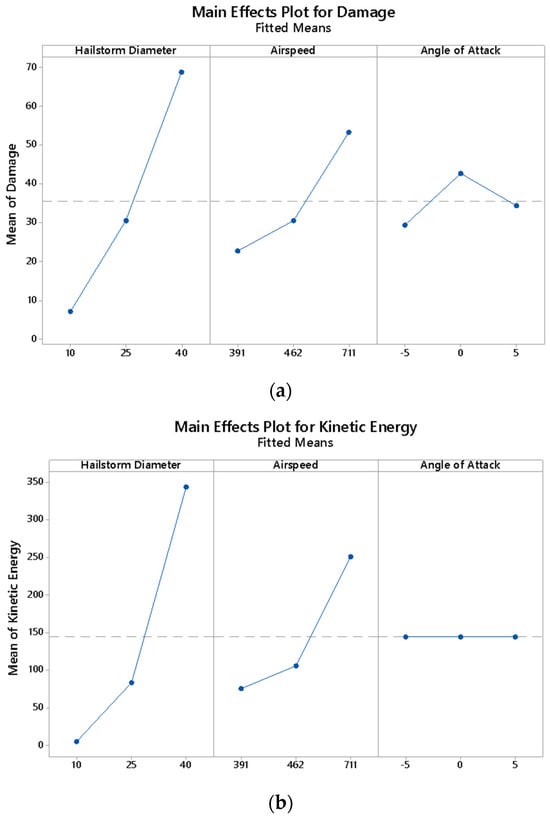
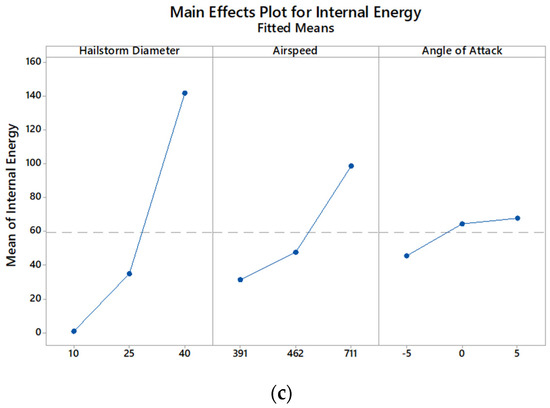
Figure 14.
Main effects plot: (a) Damage, (b) kinetic energy, and (c) internal energy.
A plausible hypothesis for the observed damage pattern is the reduced rigidity of the structure under horizontal impact. This hypothesis is supported by the fact that at zero degrees, the head-on impact results in a total transfer of kinetic energy to the material, leading to more significant damage. Conversely, at angles of attack of −5° and +5°, the impact involves a more grazing effect, which is more likely to cause erosion of the material. Additionally, at these angles, the structure benefits from the increased stiffening provided by the secondary (S2) and tertiary (S3) support structures, contributing to a different damage pattern.
Regarding kinetic energy, both hailstone diameter and airspeed were found to positively influence the kinetic energy involved in impacts, with airspeed showing a statistically zero effect on the kinetic energy, which aligns with common physical principles.
Contrastingly, the internal energy displayed an inverse quadratic dependence on the angle of attack, indicating that a positive angle of attack leads to a more pronounced exchange between kinetic and internal energy. This exchange results in slightly more deformation of the structure, although this does not directly correlate to increased damage. This nuanced finding suggests that while internal energy conversion increases with a positive angle, it does not necessarily translate into more serious structural damage, highlighting the complex dynamics between impact geometry and energy transformation. This output is valid and appreciable with this design of the leading edge with all components made with the same material. Different results would occur if the system was assembled of diverse materials.
Other results such as interaction plot and contour plot are not reported for the sake of brevity but are depicted in Appendix A (Figure A1) and Appendix B (Figure A2).
3.3. Risk Maps
A scatter plot depicted in Figure 15 has been employed to analyze the relationship between hailstone impact parameters and the resulting damages to structural surfaces. The conversion rate previously discussed was plotted along the x-axis, while the computed damages were depicted on the y-axis. The plot utilizes color coding to represent hailstone diameters, and point sizes indicate the impact velocity—with larger points corresponding to higher velocities. Notably, the graph reveals regions devoid of data points, suggesting areas where certain combinations of impact parameters do not occur. When interpreting this graph, it should be taken into account that the information provided is strongly related to the wing type and material and the same outcome could differ by replacing the structure with another shape or another constituent material with different mechanical properties.
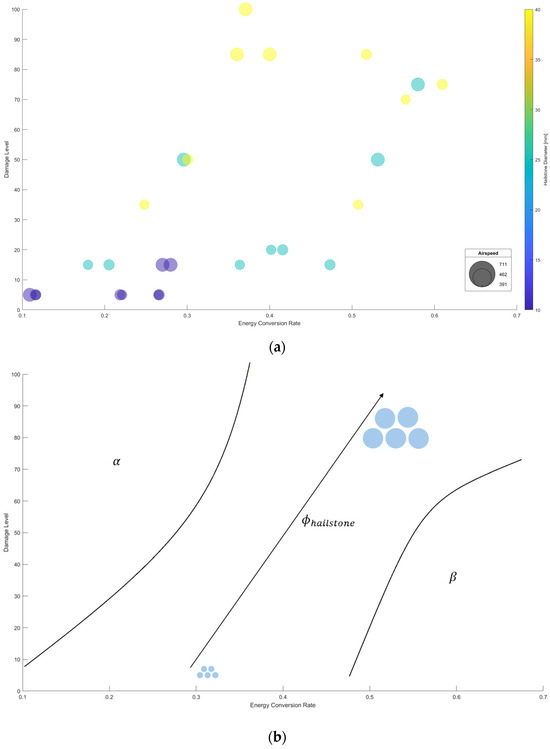
Figure 15.
Risk map: (a) Scatter plot of risk map vs. hailstone diameter and (b) zone interpolation of the risk map.
A significant observation from the graph is the existence of an extensive empty area on the left, identified as area α which would theoretically represent scenarios with low conversion rates and high damages. This absence of data points is logically plausible since substantial damages are unlikely with low internal energy, which correlates with a low damage rate. The plot distinctly illustrates a parabolic asymptote, acting as a demarcation line between this empty zone and the more populated central region of the graph. Similarly, the bottom right shows another sparse region, identified as area β, where minimal damages occur with practically complete kinetic energy conversion, which is not feasible in realistic impact scenarios.
The densely populated central zone, filled with data from the design of experiment (DOE) cases, provides critical insights. It is demonstrated that for a given hailstone diameter, varying other impact parameters position the data within specific segments of the plot, thus constraining potential damage ranges. For instance, a 10 mm diameter hailstone corresponds to a damage range of 5 to 15, whereas a 40 mm diameter correlates with a range of 35 to 100. This correlation suggests that the approximate diameter of the hailstone allows for predicting the likely area on the graph where impacts will cluster.
Furthermore, an analysis of impact velocity reveals that within the specified segments corresponding to a certain diameter, cases with lower velocities appear in the lower range, while those with higher velocities occupy the upper spectrum. This finding aligns with physical principles, as higher velocities, at a constant diameter, imply greater available kinetic energy, thereby increasing the potential for more significant damage. Thus, by integrating both the diameter and the velocity of hailstones, damage estimations can be further refined, providing a more precise forecast of the structural damage that may result from varying hailstone impacts. By integrating modern meteorological forecasting technology, which could statistically predict minimum and maximum hail diameter, with an on-board autonomous decision-making process based on these forecast models (also integrated with weather radar installed on board), the system can dynamically adjust the flight path in real-time to mitigate potential damage.
The effect of the inclination angle is also observable in Figure 16. The trend observed indicates that cases with a non-zero angle are almost always positioned to the left or right of the x-axis (conversion factor). Specifically, for this type of geometry, impacts at an angle of −5° result in the least conversion, hence less deformation, while those at +5° exhibit the highest internal energy contribution. This observation enables further narrowing of the potential impact zone based on the velocity and diameter of the hailstone, depending on the specific case being addressed.
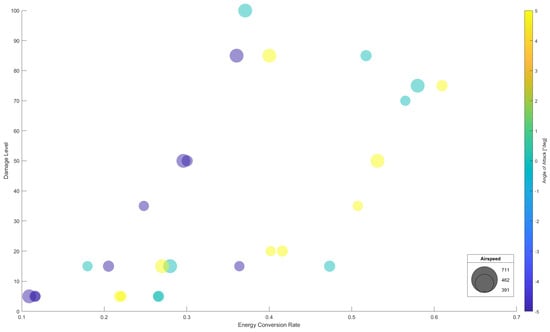
Figure 16.
Risk map: Scatter plot of risk map vs. angle of attack.
4. Conclusions
In this article, the structural response of an anti-icing system to hail impact was analyzed. The design of experiment (DOE) methodology was employed to explore how various factors influenced the dynamics of impact, identifying three parameters of interest: hailstone size (10, 25, 40 mm), impact velocity (391, 462, 711 km/h), and impact angle (−5°, 0°, +5°). Using a commercial finite element code, a physically accurate model of hail was reconstructed, 27 impact cases (3 × 3 × 3) were simulated, and the graphical numerical outputs were analyzed. The results regarding energy were tabulated and related to the corresponding observed damages on the structure. As expected, an increase in size and velocity was associated with increased damage. The angle of inclination revealed that frontal impacts on the leading edge, with other parameters being equal, resulted in the worst damage. The curvature of the structure relative to the direction of impact allowed for a less violent and more distributed absorption of energy, which was elastically and plastically discharged over larger portions, thus resulting in less severe damage. Consequently, the rate of conversion of kinetic energy (from the hail) into internal deformation energy (of the structure) was analyzed. Through this parameter and the associated damage, a risk map was created to identify damage trends as DOE parameters varied.
The purpose of the study was to provide a method for constructing a risk map with which to assess the safety of potentially traversing through a hail disturbance. Known flight conditions allow a pilot to determine their position within the map and decide whether it is safe to continue on the established route.
Author Contributions
Conceptualization, C.G.F. and A.C.; methodology, C.G.F.; software, A.C.; validation, C.G.F. and A.C.; formal analysis, C.G.F. and A.C.; investigation, C.G.F. and A.C.; resources, C.G.F.; data curation, C.G.F. and A.C.; writing—original draft preparation, C.G.F. and A.C.; writing—review and editing, C.G.F.; visualization, C.G.F.; supervision, P.M.; project administration, P.M. and C.G.F.; funding acquisition, P.M. and C.G.F. All authors have read and agreed to the published version of the manuscript.
Funding
This research received no external funding.
Data Availability Statement
Data are contained within the article.
Acknowledgments
The authors wish to extend their sincere gratitude to the technical personnel of the DIMEAS Laboratory for their invaluable support throughout the course of this research. Special thanks are due to the laboratory technicians for their meticulous attention to detail and unwavering commitment to maintaining the highest standards of accuracy and safety in all laboratory operations. Their contributions have not only facilitated this research but have also significantly enhanced its quality and impact. We are deeply appreciative of their efforts and proud to collaborate with such a capable and professional team.
Conflicts of Interest
The authors declare no conflicts of interest.
Appendix A
This Appendix reports the interaction plot obtained from the DOE analysis. An interaction plot in statistical process analysis, particularly in the context of the design of experiment (DOE), visually represents how the effect of one factor (independent variable) on the response variable changes at different levels of another factor. It also helps in understanding complex relationships and optimizing processes by highlighting how factors work together rather than in isolation.
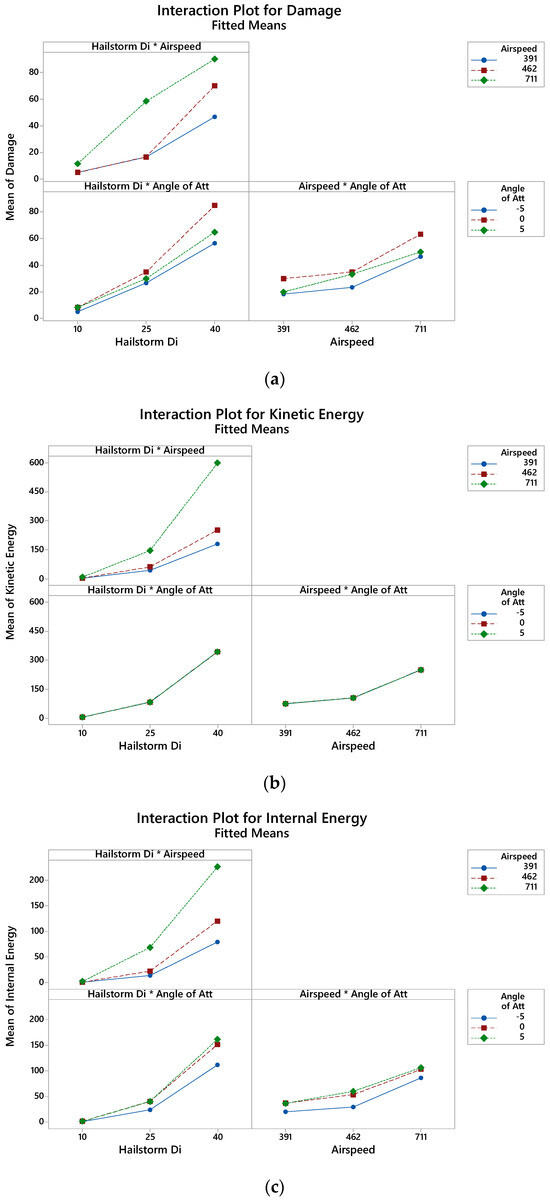
Figure A1.
Interaction plot: (a) Damage, (b) kinetic energy, and (c) internal energy.
Appendix B
This appendix reports the contour plot obtained from the DOE analysis.
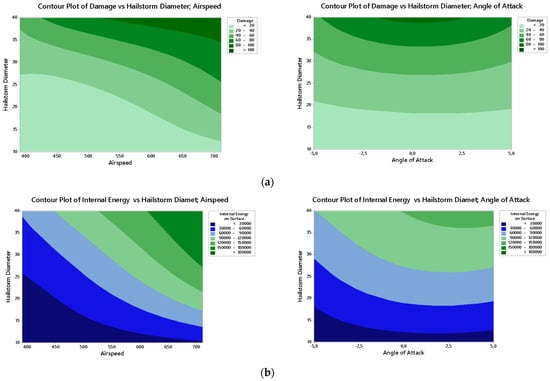
Figure A2.
Contour plot: (a) Damage, (b) kinetic energy.
References
- Laird, H.B. Aircraft Encounters with Severe Hailstorms. Weatherwise 1954, 7, 27–41. [Google Scholar] [CrossRef]
- Saha, S.L.K.R. Hailstones and their effects on aircraft. MAUSAM 1961, 12, 419–430. [Google Scholar] [CrossRef]
- Baltaci, H.; Akkoyunlu, B.O.; Tayanc, M. An Extreme Hailstorm on 27 July 2017 in Istanbul, Turkey: Synoptic Scale Circulation and Thermodynamic Evaluation. Pure Appl. Geophys. 2018, 175, 3727–3740. [Google Scholar] [CrossRef]
- Jennings, G. Australia Assesses Damage to P-8A MMA Aircraft Caused by Hailstorm. IHS Jane’s Defence Weekly, 13 January 2022; Volume 59. [Google Scholar]
- Aircraft damage during a severe hailstorm west of Helsinki, Finland, 21 July 2001. J. Meteorol. 2003, 28.
- Gensini, A.V. Severe convective storms in a changing climate. In Climate Change and Extreme Events; Elsevier: Amsterdam, The Netherlands, 2021. [Google Scholar] [CrossRef]
- Webb, J.; Elsom, D.; Meaden, G. Severe hailstorms in Britain and Ireland, a climatological survey and hazard assessment. Atmos. Res. 2008, 93, 587–606. [Google Scholar] [CrossRef]
- Zhang, Y.; Wang, B.; Bai, C.; Liu, X.; Guo, J. Anti-impact characteristics and contrastive study of typical aircraft structures against hail and simulated bird projectile. Zhendong Yu Chongji/J. Vib. Shock. 2021, 40, 27–40. [Google Scholar] [CrossRef]
- Zhang, C.; Fang, X.; Liu, J.; Mao, C. Hail ice impact simulation and damage response analysis in composite laminates. Mech. Adv. Mater. Struct. 2023, 30, 498–509. [Google Scholar] [CrossRef]
- Lavoie, M.-A.; Ensan, M.N.; Gakwaya, A. Development of an efficient numerical model for hail impact simulation based on experimental data obtained from pressure sensitive film. Mech. Res. Commun. 2011, 38, 72–76. [Google Scholar] [CrossRef]
- Zhou, J.; Zhao, Z.; Shi, Y.; Wang, X.; Chen, X.; Shan, C. Hail impact responses and residual tensile properties of CFRP T-joints. Chin. J. Aeronaut. 2023, 36, 430–443. [Google Scholar] [CrossRef]
- Zhang, C.; Fang, X.; Curiel-Sosa, J.L.; Bui, T.Q.; Mao, C. Damage in hybrid corrugated core sandwich structures under high velocity hail ice impact: A numerical study. Def. Technol. 2023, 27, 217–236. [Google Scholar] [CrossRef]
- SNeidigk, O.; Roach, D.P.; Duvall, R.L.; Rice, T.M. Detection and Characterization of Hail Impact Damage in Carbon Fiber Aircraft Structure; Federal Aviation Administration: Washington, DC, USA, 2017. [Google Scholar]
- Anghileri, M.; Castelletti, L.M.L.; Invernizzi, F.; Mascheroni, M. A numerical model for hail impact analysis. In Proceedings of the 30th European Rotorcraft Forum, Florence, Italy, 13–15 September 2005. [Google Scholar]
- Goraj, Z. An overview of the deicing and anti-icing technologies with prospects for the future. In Proceedings of the 24th International Congress of the Aeronautical Sciences, Yokohama, Japan, 29 August–3 September 2004. [Google Scholar]
- Zhang, Y.; Shi, Y.; Xu, J. Hail impact on composite structures of civil aircrafts. In Proceedings of the ICCM International Conferences on Composite Materials, International Committee on Composite Materials, Xi’an, China, 20–25 August 2017. [Google Scholar]
- Souter, R.K.; Emerson, J.B. Summary of Available Hail Literature and the Effect of Hail on Aircraft in Flight; NACA Technical Note 2734; National Advisory Committee for Aeronautics: Washington, DC, USA, 1952; pp. 1–33. [Google Scholar]
- Gultepe, I.; Sharman, R.; Williams, P.D.; Zhou, B.; Ellrod, G.; Minnis, P.; Trier, S.; Griffin, S.; Yum, S.S.; Gharabaghi, B.; et al. A Review of High Impact Weather for Aviation Meteorology. Pure Appl. Geophys. 2019, 176, 1869–1921. [Google Scholar] [CrossRef]
- Matos, N.; Gomes, M.; Infante, V. Numerical modelling of soft body impacts: A review. Eng. Fail. Anal. 2023, 153, 107595. [Google Scholar] [CrossRef]
- Goraj, Z.J.; Kustron, K. Review of current research trends in bird strike and hail impact simulations on wing leading edge. Aircr. Eng. Aerosp. Technol. 2018, 90, 602–612. [Google Scholar] [CrossRef]
- Zhu, S.; Peng, W.; Shao, Y.; Li, S. Experimental and numerical study on the high-velocity hail impact performance of carbon fiber aluminum alloy laminates. Int. J. Impact Eng. 2023, 179, 104664. [Google Scholar] [CrossRef]
- Vacca, A. P180 main wing anti-ice system: Analysis and improvements. 2013. [Google Scholar]
- Durakovic, B. Design of experiments application, concepts, examples: State of the art. Period. Eng. Nat. Sci. 2017, 5. [Google Scholar] [CrossRef]
- Johnson, C.J. Anti Icing Duct. U.S. Patent 2320870, 1 June 1943. [Google Scholar]
- Bici, M.; Brischetto, S.; Campana, F.; Ferro, C.G.; Seclì, C.; Varetti, S.; Maggiore, P.; Mazza, A. Development of a multifunctional panel for aerospace use through SLM additive manufacturing. Procedia CIRP 2018, 67, 215–220. [Google Scholar] [CrossRef]
- Inc. Altair Engineering. Hypermesh. Available online: https://2021.help.altair.com/2021.2/hwsolvers/rad/topics/solvers/rad/rad_user_guide_intro_c.htm#overview_ref_guide_rad_c (accessed on 5 May 2024).
- Imran, M.; Khan, A.A. Characterization of Al-7075 metal matrix composites: A review. J. Mater. Res. Technol. 2019, 8, 3347–3356. [Google Scholar] [CrossRef]
- Sharma, P.; Chandel, P.; Bhardwaj, V.; Singh, M.; Mahajan, P. Ballistic impact response of high strength aluminium alloy 2014-T652 subjected to rigid and deformable projectiles. Thin-Walled Struct. 2018, 126, 205–219. [Google Scholar] [CrossRef]
- Field, P.R.; Hand, W.; Cappelluti, G.; McMillan, A.; Foreman, A.; Stubbs, D.; Willows, M. Hail Threat Standardisation (EASA); EASA: Köln, Germany, 2008. [Google Scholar]
- Meng, S.; Taddei, L.; Lebaal, N.; Roth, S. Advances in ballistic penetrating impact simulations on thin structures using Smooth Particles Hydrodynamics: A state of the art. Thin-Walled Struct. 2021, 159, 107206. [Google Scholar] [CrossRef]
- Stellingwerf, R.F.; Wingate, C.A. Impact modeling with smooth particle hydrodynamics. Int. J. Impact Eng. 1993, 14, 707–718. [Google Scholar] [CrossRef]
- Montgomery, D.C. Design and Analysis of Experiments; John Wiley & Sons, Inc.: Sedona, AZ, USA, 2013; p. 684. [Google Scholar]
- Myers, R.H.; Montgomery, D.C.; Anderson-Cook, C.M. Response Surface Methodology: Process and Product Optimization Using Designed Experiments; John Wiley & Sons: Hoboken, NJ, USA, 2016. [Google Scholar]
- Rusu, M.; Soare, I. Comparative risk assessment in applicative aerospace projects using different approaches. INCAS Bull. 2018, 10, 233–246. [Google Scholar] [CrossRef]
Disclaimer/Publisher’s Note: The statements, opinions and data contained in all publications are solely those of the individual author(s) and contributor(s) and not of MDPI and/or the editor(s). MDPI and/or the editor(s) disclaim responsibility for any injury to people or property resulting from any ideas, methods, instructions or products referred to in the content. |
© 2024 by the authors. Licensee MDPI, Basel, Switzerland. This article is an open access article distributed under the terms and conditions of the Creative Commons Attribution (CC BY) license (https://creativecommons.org/licenses/by/4.0/).