Article

Critical Sample-Size Analysis for Uncertainty Aerodynamic Evaluation of Compressor Blades with Stagger-Angle Errors

1
School of Power and Energy, Northwestern Polytechnical University, Xi’an 710129, China
2
National Key Laboratory of Aerodynamic Design and Research, Xi’an 710129, China
3
School of Mechanical Engineering, Northwestern Polytechnical University, Xi’an 710129, China
*
Author to whom correspondence should be addressed.
Aerospace 2023, 10(12), 990; https://doi.org/10.3390/aerospace10120990
Submission received: 25 September 2023 / Revised: 9 November 2023 / Accepted: 13 November 2023 / Published: 25 November 2023
(This article belongs to the Special Issue Aero-Engine Design)

Abstract

:
Many probability-based uncertainty quantification (UQ) schemes require a large amount of sampled data to build credible probability density function (PDF) models for uncertain parameters. Unfortunately, the amounts of data collected as to compressor blades of aero-engines are mostly limited due to the expensive and time-consuming tests. In this paper, we develop a preconditioner-based data-driven polynomial chaos (PDDPC) method that can efficiently deal with uncertainty propagation of limited amounts of sampled data. The calculation accuracy of a PDDPC method is closely related to the sample size of collected data. Therefore, the influence of sample size on this PDDPC method is investigated using a nonlinear test function. Subsequently, we consider the real manufacturing errors in stagger angles for compressor blades. Under three different operating conditions, the PDDPC method is applied to investigate the effect of stagger-angle error on UQ results of multiple aerodynamic parameters of a two-dimensional compressor blade. The results show that as the sample-size of measured data increases, UQ results regarding aerodynamic performance obtained by the PDDPC method gradually converge. There exists a critical sample size that ensures accurate UQ analysis of compressor blades. The probability information contained in the machining error data is analyzed through Kullback–Leibler divergence, and the critical sample size is determined. The research results can serve as a valuable reference for the fast and cheap UQ analysis of compressor blades in practical engineering.

1. Introduction

The increasingly demanding targets for high reliability and stable service performance of the advanced aviation compressor require the technology to overcome various sources of uncertainties [1,2]. Compressor blades are usually designed as three-dimensional twisted parts with complex curved structures to meet the requirements of aerodynamic performance. Geometric errors in compressor blades are one of the most important sources of uncertainty, due to poor rigidity, tooling deflection, material residual stress, and other factors [3,4]. The harsh operating environment, including, for example, a high adverse pressure gradient, will magnify the influence of geometric uncertainties on the compressor’s performance. Garzon et al. [5] found that due to the inevitable geometric uncertainties, the average compressor efficiency can be reduced by 1%, accompanied by a dispersion of aerodynamic performance. With the recent developments in computing power, quantitative evaluation of the influence of geometric uncertainties on compressor performance has attracted extensive attention [6,7,8].
Advanced uncertainty quantification (UQ) methods are essential tools in the process of uncertainty evaluation for aviation compressors. The most commonly used UQ methods in the field of turbomachinery include the Monte Carlo method [9,10], surrogate-model-based method [11], multi-fidelity methods [12,13], and polynomial chaos-based method [14,15,16]. These methods are probability-based UQ schemes, and their uncertainty evaluation process can be generally divided into three steps. Firstly, it requires the building of probability density function (PDF) models of uncertain input parameters, in which a large amount of sampled data is collected and analyzed as the basis for the underlying modeling. The constructed PDF model occupies the primary position, since it determines the random input space for the whole UQ process. The second step is to combine the UQ algorithm with a response system such as a CFD solver to obtain the input–output mapping. The third step is post-processing and statistical analysis of the output results. The probability-based UQ methods require the PDF model as the basis for the random input for uncertainty analysis. Therefore, how to obtain an accurate and high-fidelity PDF model is an important prerequisite for obtaining reliable UQ results.
A credible PDF model usually requires a large amount of sampled data as the underlying support. Unfortunately, it is very difficult to extract or collect sufficient and available machining-error data for compressor blades in the field of aero-engines. The reason for the limited amount of data can be generally attributed to three aspects of the field. First, the profile detection of compressor blades using coordinate measuring machines or optical measurements is very expensive and time-consuming. Therefore, sampling inspection technology is often used to judge whether the manufactured blades are qualified as to practical engineering. Second, it is difficult to obtain sufficient machining data of the same types from the limited compressor rows. Third, the aero-compressor blades often involve the problem of data information security. As a consequence, the available machining error data for compressor blades are mostly limited and scarce. In this context, it is impossible to obtain an accurate high-fidelity PDF model, which greatly weakens the availability of the aforementioned probability-based UQ methods. In most practical applications, many reports [17,18,19] either avoid such construction of PDF models completely or fall back to less-accurate and lower-fidelity PDF models to conduct the UQ analysis. The credibility of the model output will bear severe risks using an unreliable input PDF model [20,21]. Therefore, it is imperative to seek a novel UQ method suitable for limited amounts of sampled data for compressor blades from the ground up.
In the field of geosciences, Oladyshkin et al. [22,23] proposed a data-driven polynomial chaos (DDPC) method to solve the uncertainty of carbon dioxide storage when facing scarce permeability information. The idea of a DDPC algorithm is to use the statistical moments of raw measured data to replace the PDF model for UQ analysis. Recently, Ahlfeld and Montomoli [24,25] combined the DDPC method with the Smolyak technique to solve high-dimensional UQ problems in turbomachinery. They applied this method to study the influence of manufacturing uncertainties on diffuser efficiency and turbine blades. By comparisons with the low-fidelity PDF model obtained from 100 elements of measured data, it was found that the DDPC method was more accurate and reliable. Guo et al. [26] used the DDPC method to investigate the performance impact of manufacturing errors on a 2D compressor blade. However, their results were still based on the input PDF model using kernel density estimation, ignoring the problem of limited amounts of sampled data. Wang et al. [1] proposed a novel preconditioner-based DDPC (PDDPC) method, which can alleviate the ill-conditioned problem when using high-order statistical moments. Considering the limited amounts of sampled data (100 samples) of stochastic stagger-angle errors, they used the PDDPC method to conduct a robust optimization design for a compressor blade.
In practical implementations, this DDPC-based UQ method is still rare in turbomachinery blades. First, there exists a poor numerical condition when using high-order statistical moments of sampled data [27]. Second, the calculation accuracy of the DDPC method is closely related to the sample size of collected data. To the best of the authors’ knowledge, there is no relevant literature studying the critical sample size that can be used for accurate UQ analysis. From the perspective of engineering, the processing cycle and detection time are very expensive for the compressor blades. Therefore, determining the critical sample size has great benefits for saving costs and shortening the UQ cycle.
For a turbomachinery blade, the stagger angle is an important parameter, because it affects the relative inlet flow direction, the variations of blade passages, and blade aeroelasticity [1,13]. Wang et al. [28] evaluated the influence of uncertain stagger-angle errors on the aerodynamic performance of a turbine blade, and discovered that the stagger-angle errors can cause fluctuations of the loss coefficient of up to 40%. Phan and He [13,29] found that the stagger-angle variations can affect the blade loading, exit flow angle, blade aeroelasticity and aerodynamic loss for the turbine blade. Lu et al. [30] found that the mis-staggering can be amplified by aerodynamic loading and the designed peak efficiency cannot be achieved for a transonic fan blade. Suriyanarayanan et al. [31] studied the influence of stagger-angle errors on NASA rotor 67. Their results showed that the sinusoidal arrangement of stagger-angle variations throughout the annulus is optimal compared to the linear and random types. These investigations have demonstrated that stagger-angle errors have a significant impact on turbomachinery blades. Therefore, it is imperative to conduct a critical sample-size analysis of uncertainty aerodynamic evaluation for compressor blades with stagger-angle errors.
The motivation behind this article can be summarized as follows: First, we introduce a preconditioner-based data-driven polynomial chaos (PDDPC) method to ensure the computational robustness when using high-order statistical moments. Then, the influence of sample size as to limited input data on the PDDPC method is studied using a nonlinear test function. Finally, we consider the actual manufacturing error of stagger angles for compressor blades. The influence of the sample size of stagger-angle error on UQ results of multiple aerodynamic parameters is discussed under different operating conditions. The research results can provide a valuable reference for UQ analysis of turbomachinery blades.

2. Research Object and Numerical Method

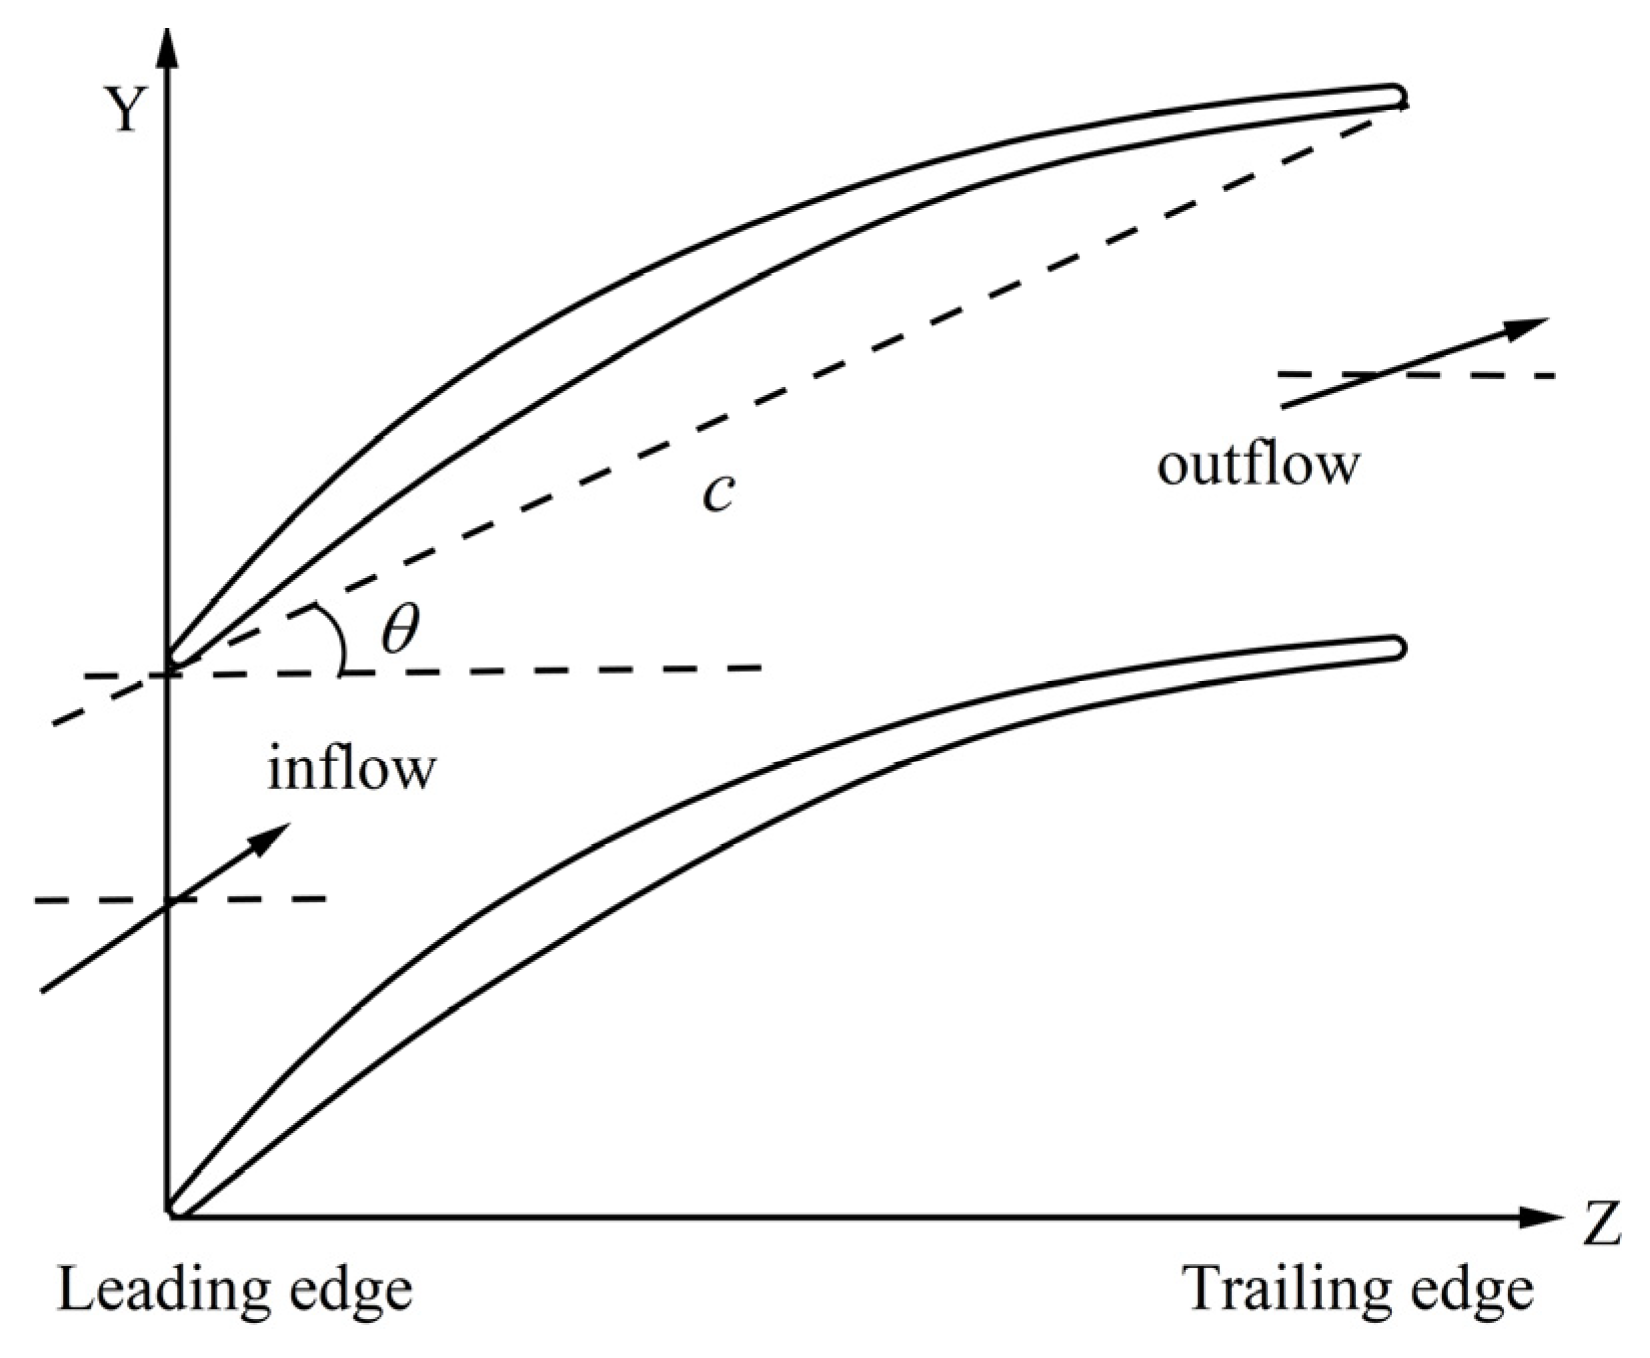
2.1. Compressor Blade Geometry and Manufacturing Uncertainty of the Stagger Angle

In this work, the research object is a two-dimensional compressor blade, as shown in Figure 1. Its chord is 69.95 mm, the design stagger angle ( θ ) is 26.58°, and the design incidence a is 2.5°. The main geometric and aerodynamic parameters are summarized in Table 1.
Due to inevitable torsional deformation, the actual stagger angles of manufactured blades always exhibit deviations from the initial design. The actual stagger angle consists of two parts: the initial design angle θ and the machining error θ ; see Equation (1).
θ r e a l = θ + θ
In this work, the stagger angles originate from mid-height sections of 100 compressor blades based on coordinate measuring machine (CMM) measurements. CMM–based measurement techniques can provide the manufacturing error data of stagger angles between nominal and manufactured blades. Figure 2 presents the detailed measured results and the actual compressor blade profiles with torsional errors. As depicted in Figure 2, the machining errors of stagger angle have obvious uncertain and stochastic characteristics. In practical engineering, we cannot obtain more machining error data on blade stagger angle due to various constraints. From the perspective of probability theory [32], 100 elements of sampled data cannot establish a high-fidelity PDF model. Therefore, we utilize the data-driven polynomial chaos method to propagate uncertainty where the statistical moments of measured data are used as the random inputs.

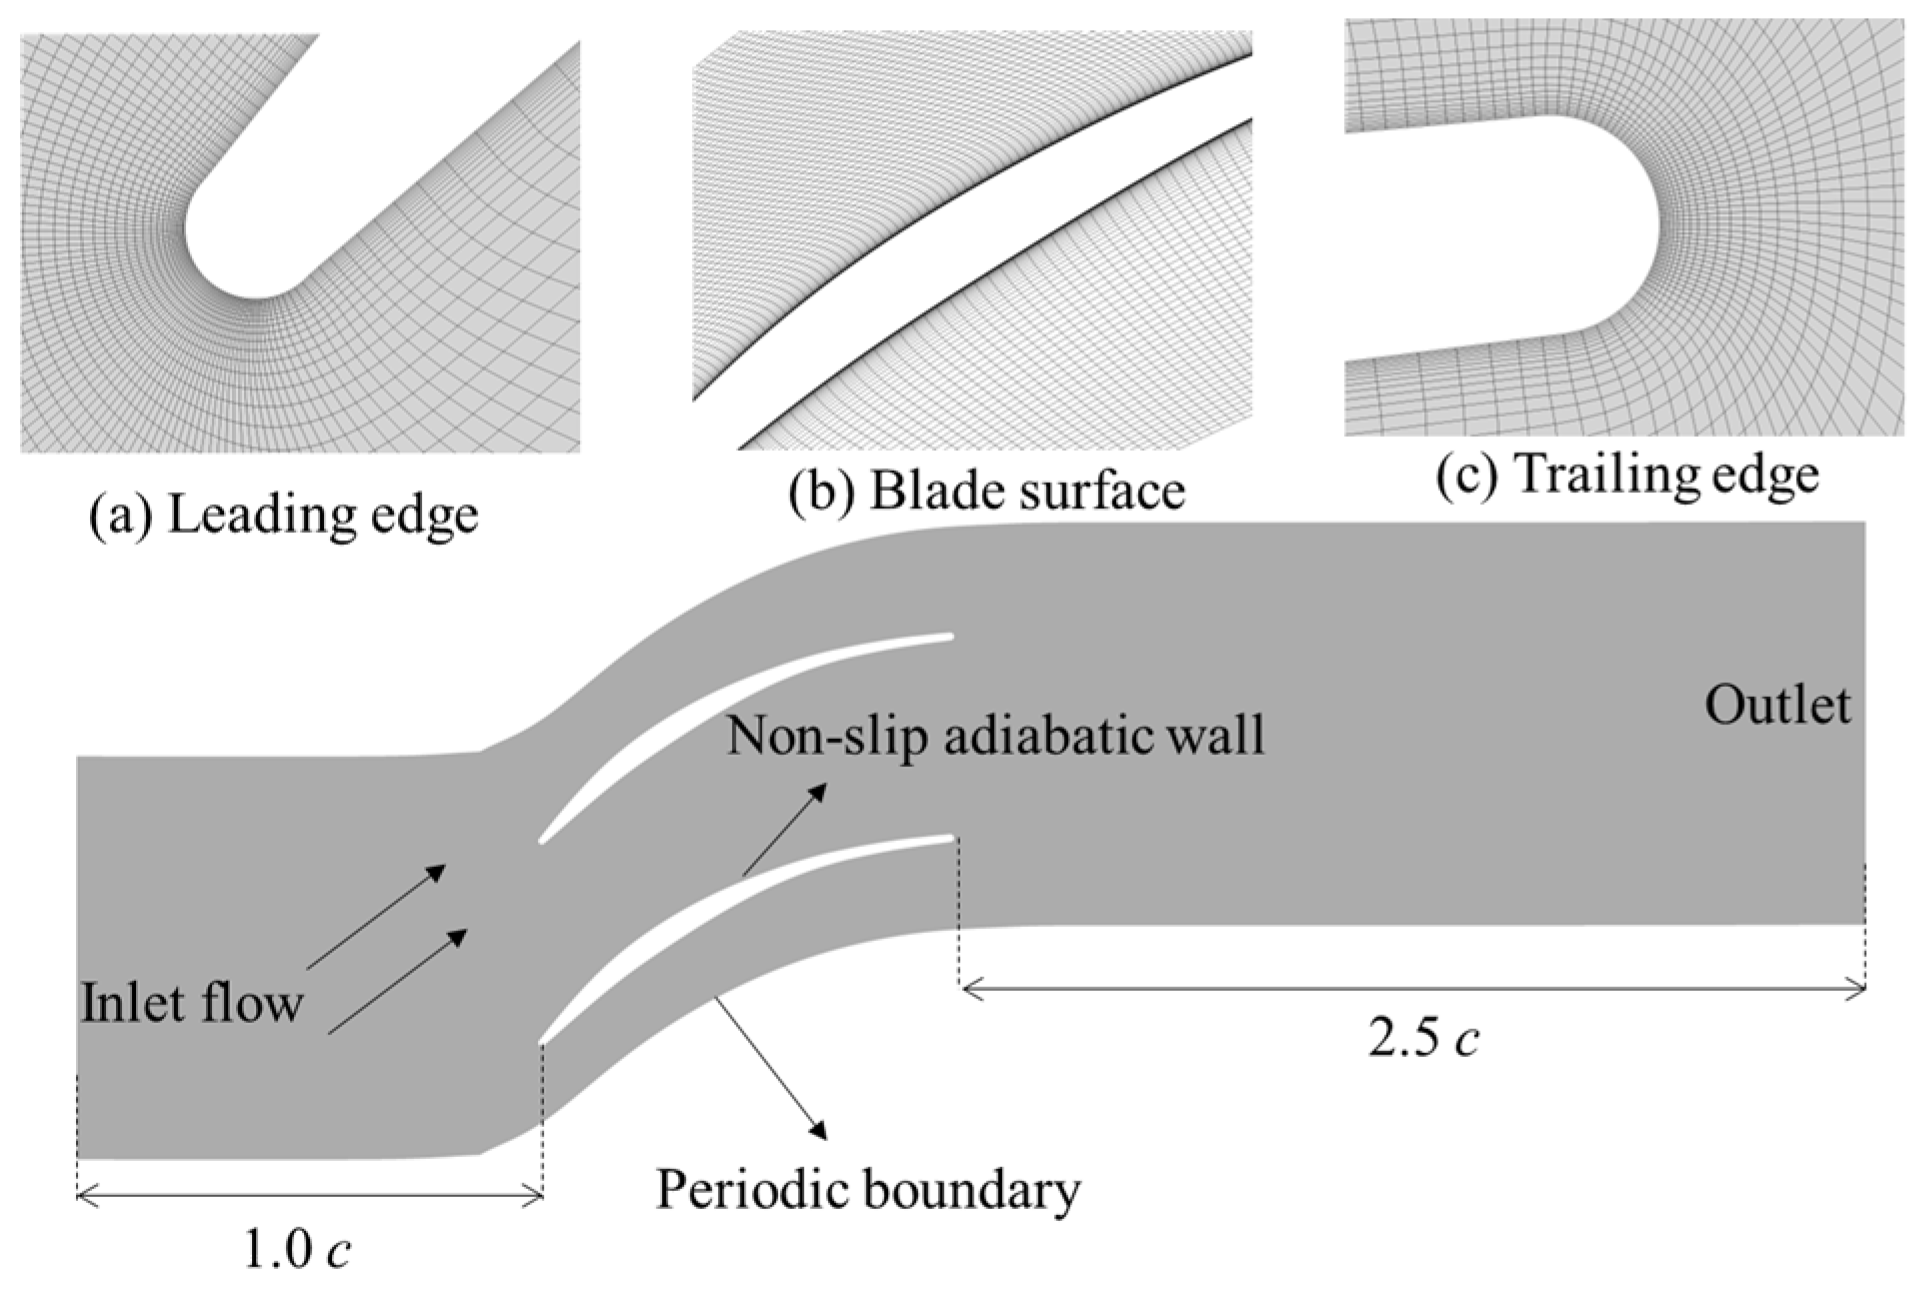
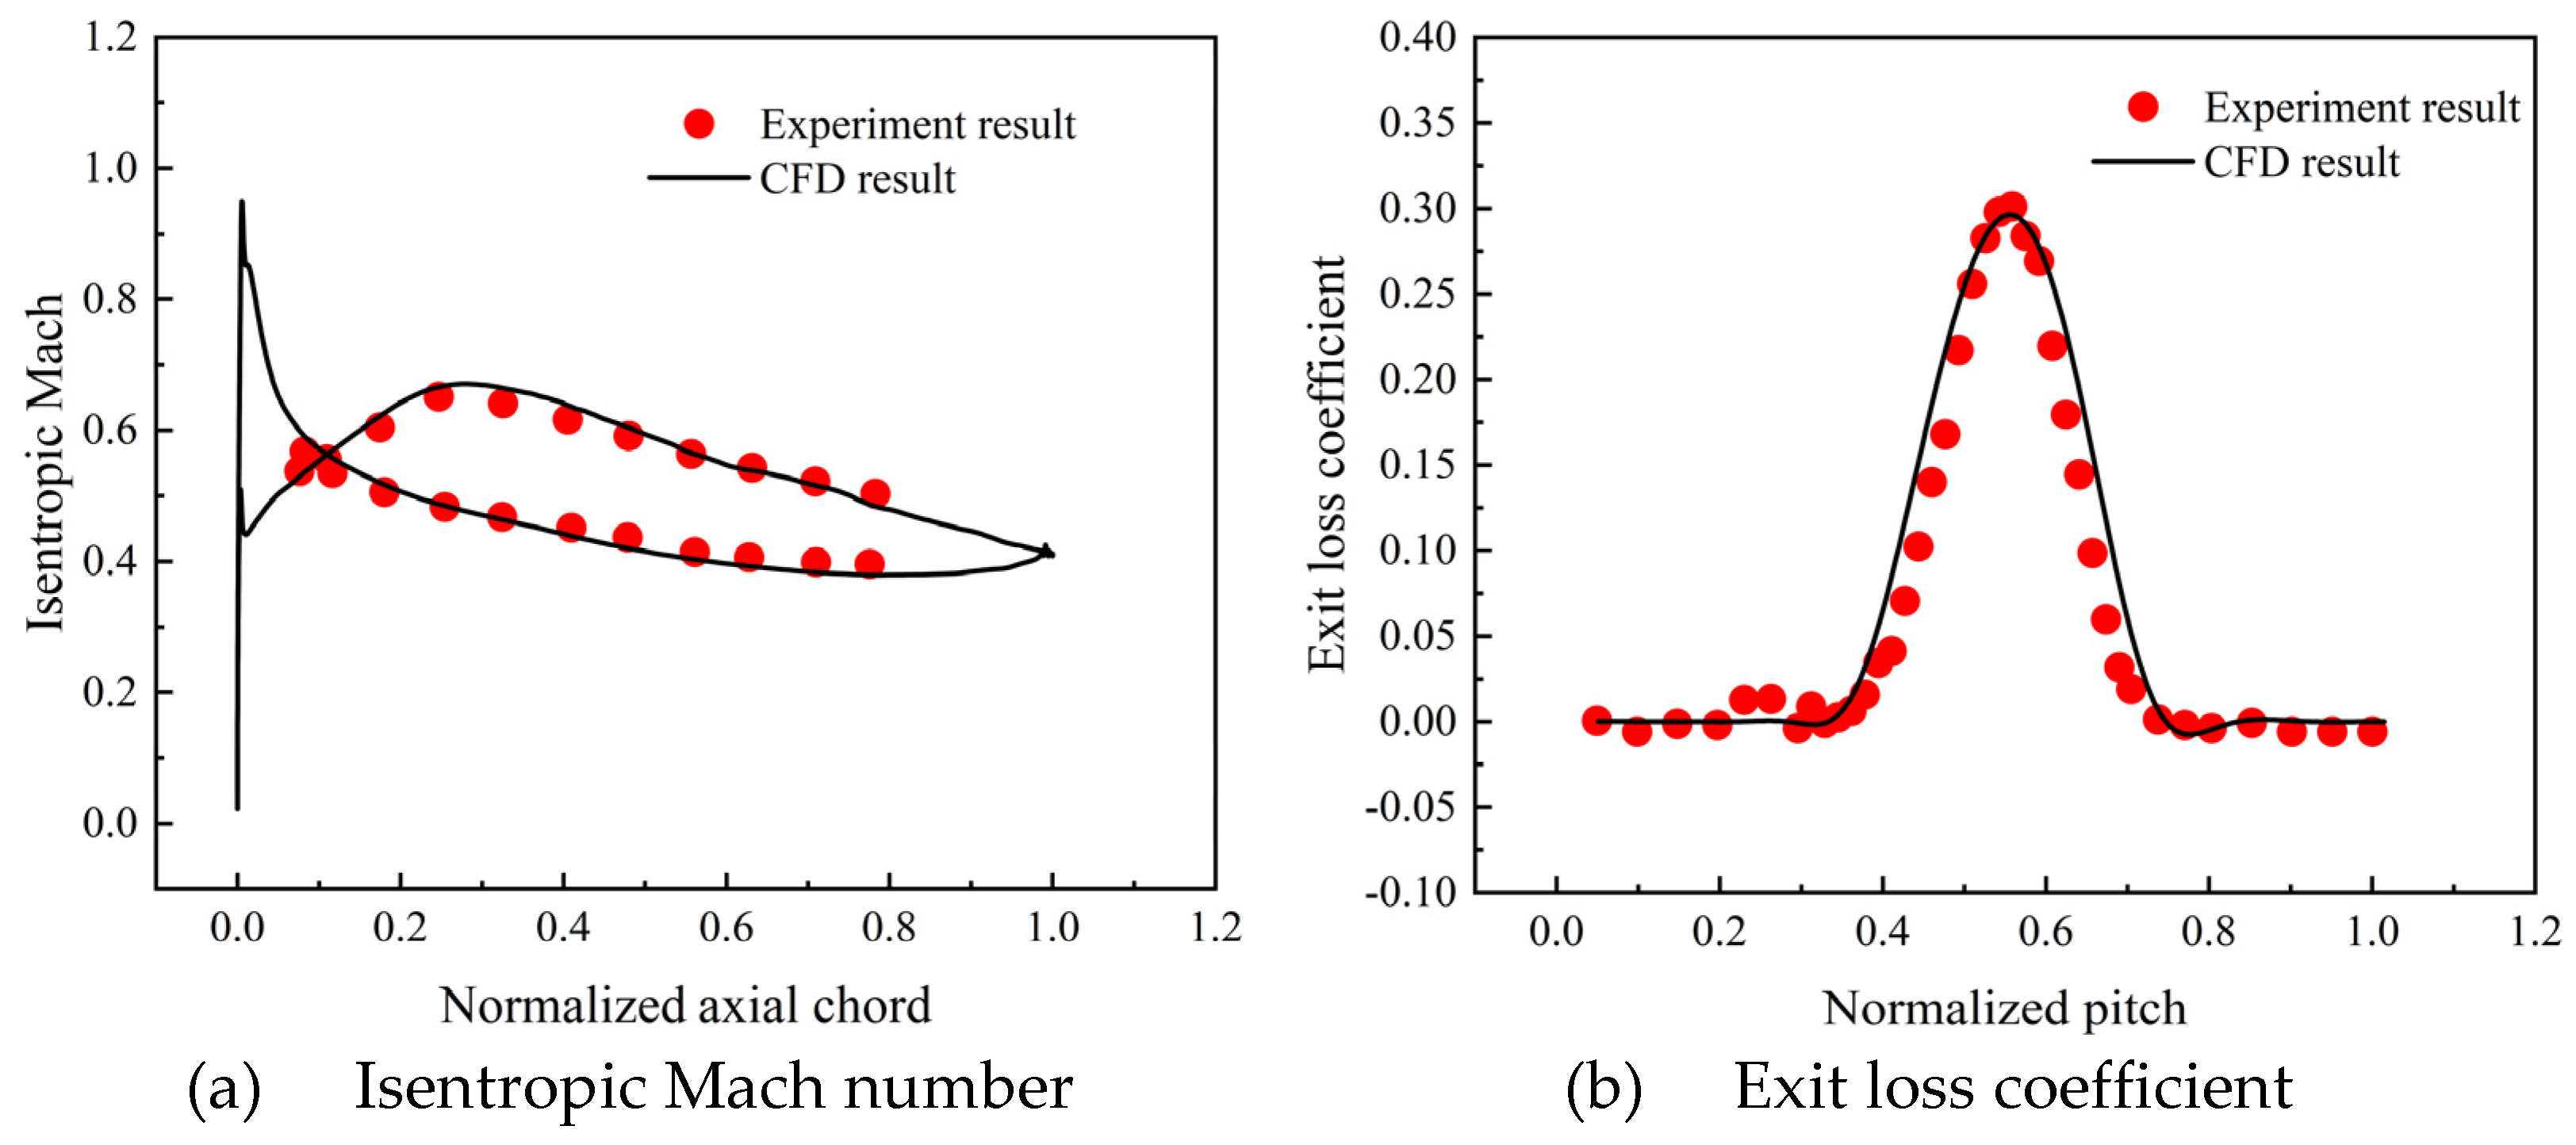
2.2. Numerical Method and Validation

Reynolds-averaged Navier–Stokes (RANS) equations are used to analyze the aerodynamic performance of compressor blades, using the commercial software NUMECA 11.2. The Spalart–Allmaras (SA) turbulence model [33] is adopted to enclose the governing equations. The second-order central difference scheme and four-step Runge–Kutta scheme are used for spatial discretization and time discretization, respectively.
Figure 3 shows the computational domain of compressor blade geometry. The inlet boundary conditions include total pressure, total temperature (300.0 K), and airflow angle. The static pressure (101,300 Pa) is imposed at the outlet boundary. The inlet Mach number is obtained by changing the inlet total pressure under various flow angles. Note that we use a 2D compressor blade case, so periodic boundary conditions are given along the pitch-wise direction. The Autogrid5 module is used to generate the O4H-type grid in the blade passage domain. The total grid number is approximately 9.83 × 10 4 . The first layer grid-scale from the wall is set as 10−6 m to guarantee that the dimensional distance y+ will be less than 3, meeting the requirements of the SA turbulence model.
The boundary conditions, number and structure of computational grids, turbulence model, and other calculation settings in this paper are consistent with our previous work [1]. To validate the reliability of the numerical simulation method, the predicted results of aerodynamic performance are compared with the experimental results in terms of the isentropic Mach number and exit loss coefficient. As can be seen from Figure 4, the predicted results agree well with the measured values, indicating the reliability of the chosen numerical method for predicting the aerodynamic performance.

2.3. Key Aerodynamic Quantities of Interest

The interested aerodynamic parameters for a 2D compressor blade include the total pressure loss coefficient ω , static pressure ratio π , isentropic Mach number M a i s , and Mach number. In this paper, our goals lie in quantifying the performance variations associated with the uncertain stagger-angle errors. These aerodynamic parameters are defined as
ω = P i n P o u t / P i n P 1
π = P 2 / P 1
M a i s = 2 γ 1 P i n P γ 1 / γ 1
where P i n and P o u t are the inlet total pressure and outlet pressure; P 1 , P 2 and P are the inlet static pressure, outlet static pressure, and the local static pressure at a location on the blade’s surface.

3. Uncertainty Quantification Method

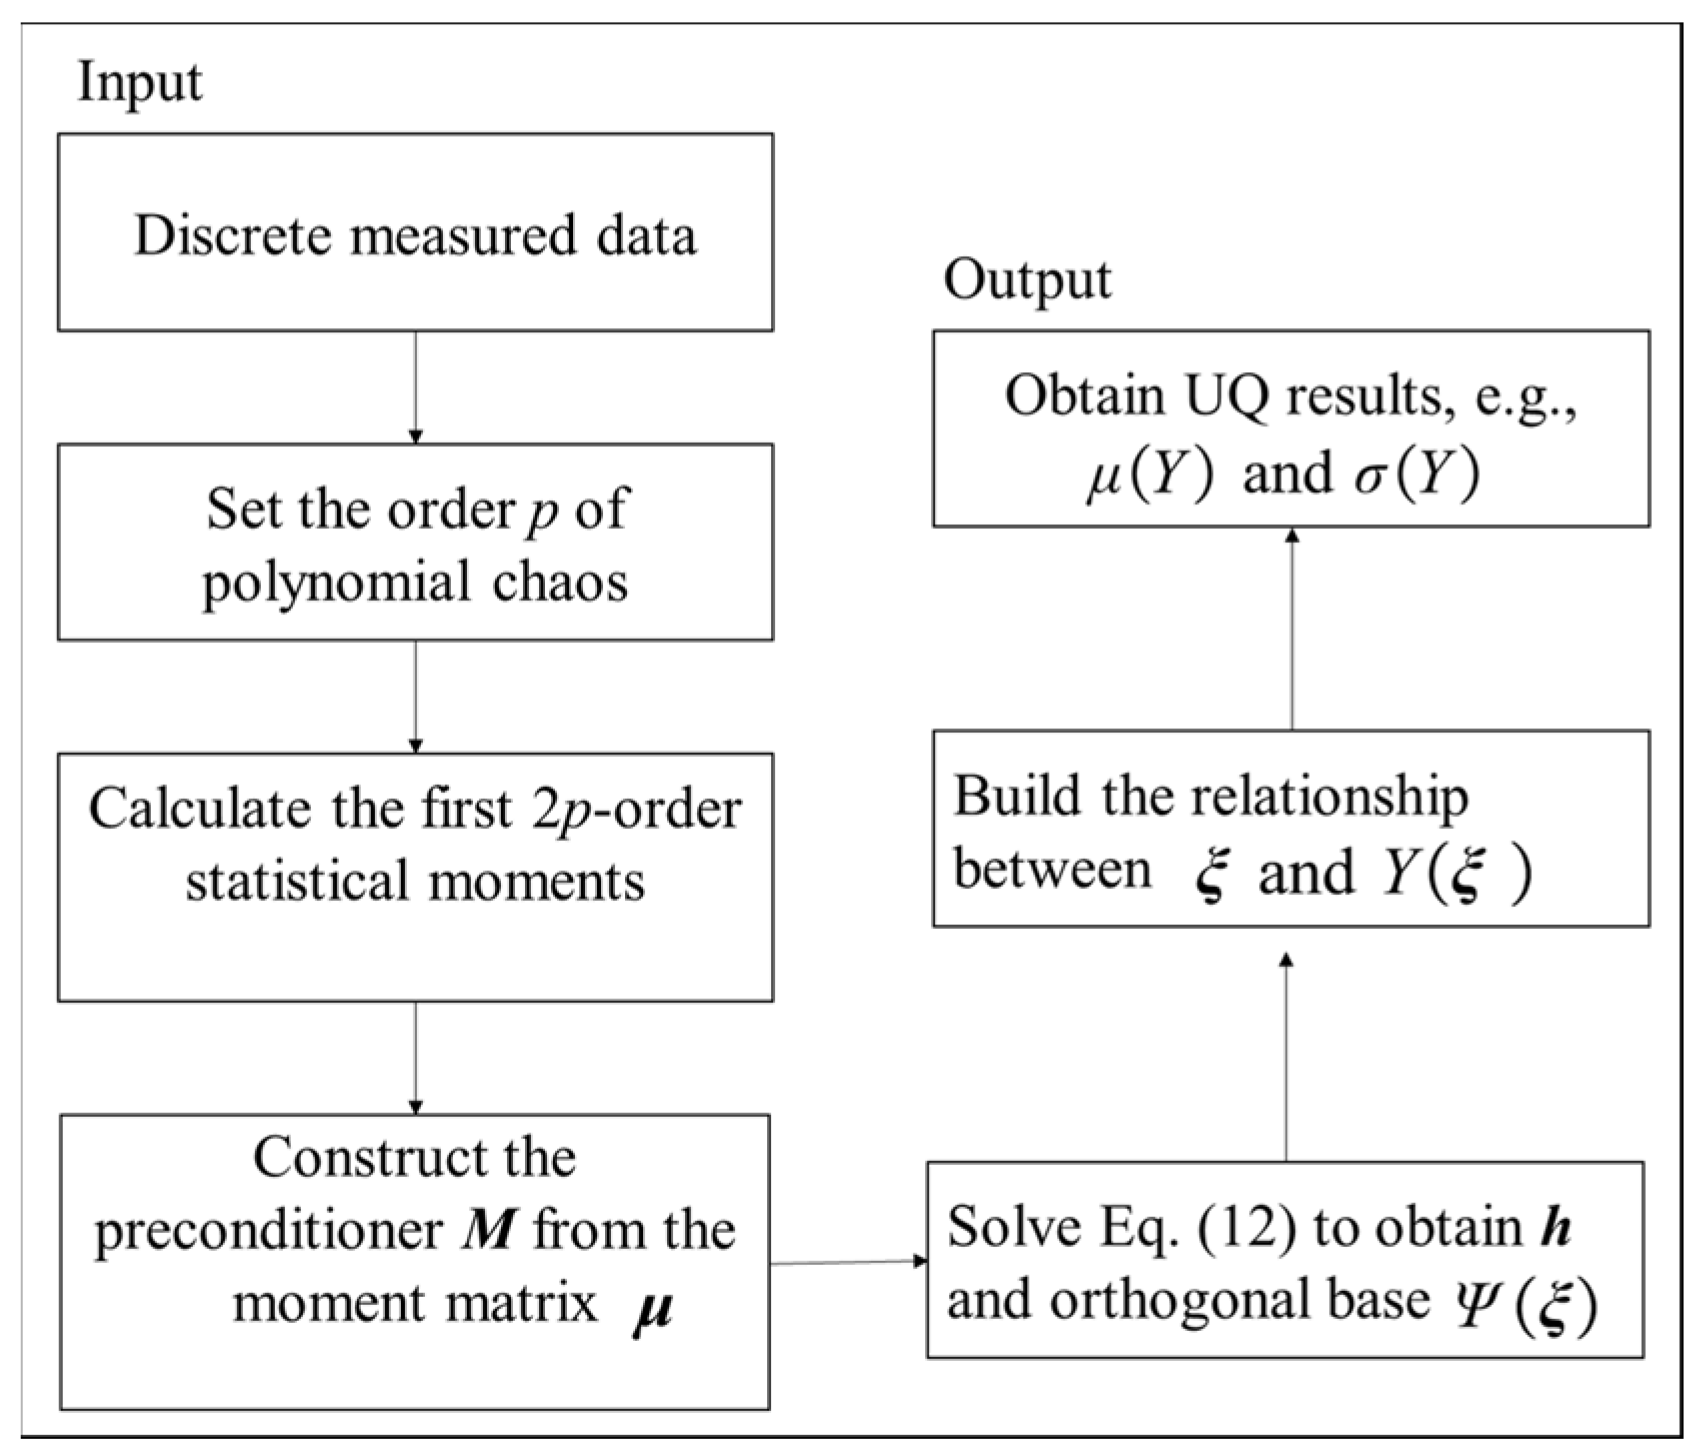
3.1. Preconditioner-Based Data-Driven Polynomial Chaos Method

This part provides the necessary mathematical basis for the uncertainty propagation of limited measured data. We consider a random process in the probability space Ω , Φ , Γ with space of events Ω , σ -algebra, and probability measure Γ . For the physical model Y ξ with n-dimensional inputs ξ Ω , if the ξ is random variable, the model output Y is also stochastic. According to the polynomial chaos theory [34], the model output Y can expand a series of orthogonal polynomials with order p:
Y = i = 0 Q u i Ψ ξ , Q = n + p ! n ! p ! 1
where u i is the polynomial chaos coefficient, Q denotes the truncated expansion term, and Ψ ξ denotes the polynomial basis that is orthogonal with respect to the probability measure Γ .
The orthogonal basis Ψ ξ is the core of mapping the relationship between random input and model output. For the traditional probability-based UQ methods, if we already know the PDF model of random input variable, the corresponding orthogonal basis can be easily obtained according to the Wiener–Askey scheme [35]. For example, the Hermite orthogonal polynomials can be used for modeling the effect of random variables described by continuous Gaussian probability distribution. Unfortunately, the amount of available sampled data is not enough to build an accurate and high-fidelity input PDF model in practical applications, and the correct orthogonal basis function also cannot be obtained.
In practical engineering, the measured data collected for manufactured compressor blades are mostly limited ( ξ 1 , ξ 2 , , ξ N ). Here, ξ i is available sampled data and N is the sample size. The key part of the data-driven polynomial chaos (DDPC) method is to use the statistical moments of sampled data to construct orthogonal basis Ψ ξ . The definition of kth statistical moment μ k can be represented as:
μ k = ξ k d Γ ξ 1 N i = 1 N ξ i k .
Next, we use the orthogonality of the basis function Ψ ξ . The orthogonal base Ψ k ξ of degree k can be written as:
Ψ k ξ = i = 0 k h i k ξ i
where h i k is the constant term. The relationships between orthogonal base Ψ k ξ and lower degree Ψ l ξ ( l k ) can be represented as:
ξ Ω h 0 0 i = 0 k h i k ξ i d Γ ξ = 0 ; ξ Ω i = 0 k 1 h i k 1 ξ i i = 0 k h i k ξ i d Γ ξ = 0 ; ξ Ω i = 0 k h i k ξ i i = 0 k h i k ξ i d Γ ξ = 1 .
Here, we assume that the orthogonal functions are the standard form, so their inner product is 1 when the degree is the same. Alternatively, Equation (8) can be further simplified as:
ξ Ω i = 0 k h i k ξ i d Γ ξ = 0 ; ξ Ω i = 0 k h i k ξ i + k 1 d Γ ξ = 0 ; ξ Ω i = 0 k h i k ξ i + k d Γ ξ = 1 .
Now we use the definition of statistical moment; Equation (9) can be rewritten as:
μ h = c μ = μ 0 μ 1 μ k μ 1 μ 2 μ k + 1 μ k μ k + 1 μ 2 k ; h = h 0 k h 1 k h k k ; c = 0 0 1
where μ represents the statistical moment matrix and h is the unknown constant term. This makes it obvious that one can determine the orthogonal base Ψ ξ by solving Equation (10). The statistical moment matrix μ is known as the Hankel matrix. A recent work in the open literature [36] has provided abundant evidence that Hankle matrix is often ill-conditioned and has a poor numerical condition. Therefore, the solution system of Equation (10) is very unstable, which severely limits the flexibility and effectiveness of the DDPC method.
To address this problem, we propose a novel preconditioner-based data-driven polynomial chaos (PDDPC) method to enhance the computational robustness and instability. The proposed preconditioner M should have the following properties: (1) the form of M is easy to derive; (2) M can alleviate the ill-conditioned problem. It can be found that the initial statistical moment matrix μ is positive definite and symmetric, and its inverse matrix can be easily derived. Therefore, the diagonal inverse matrix of μ is proposed as the preconditioner M:
M = d i a g μ 1 = d i a g μ 0 , μ 2 , , μ 2 k 1 .
Combined with the preconditioner M, Equation (10) can be rewritten as:
1 μ 0 1 μ 1 μ 0 1 μ k μ 2 1 μ 1 1 μ 2 1 μ k + 1 μ 2 k 1 μ k μ 2 k 1 μ k + 1 1 h 0 k h 1 k h k k = 0 0 μ 2 k 1
The constructed preconditioner M can improve the ill-conditioned conditions, so the orthogonal base Ψ ξ can be calculated smoothly. The polynomial chaos coefficient u i can be solved using the Galerkin projection method (see e.g., [37]).
Finally, the statistical results (i.e., mean value μ ( Y ) and the standard deviation σ ( Y ) ) of the model output Y can be computed by Equations (13) and (14). Figure 5 gives a schematic diagram of the uncertainty propagation process of the PDDPC method.
μ Y = u 0
σ 2 Y = i = 1 Q u i 2 Ψ ξ , Ψ ξ .

3.2. Validation on PDDPC

Based on the self-developed PDDPC method, this part will analyze the influence of sample size on the model outputs through a nonlinear test function. According to our previously published work in the literature [1], the computational robustness and accuracy of PDDPC have been validated by a series of tests using only 100 elements of sampled data. The results show that when using the p = 3 order method, PDDPC has reached a high calculation accuracy and good convergence behavior. Therefore, we still use the third-order PDDPC to study the impact of the sample size in this paper. The nonlinear test function is described as follows:
Y = 7 c o s 2 X + X 2 + 10 X , X ~ B e t a 4 , 4
where random variable X is assumed to follow Beta (4, 4) distribution.
According to Equation (6), it can be found that the sample size N will affect the statistical moments and the output results. In order to obtain the sensitivity of the PDDPC method to the sample size N, we randomly generate 11 sets of sample data (N = 20, 30, 40, 50, 60, 80, 100, 150, 200, 300, and 1000). The analytical values of μ Y and σ Y of the test function are calculated using 106 Monte Carlo simulations as the benchmark. The relative error of calculation result is defined as:
E r r = Y M C Y P D D P C / Y M C
Figure 6 shows the convergence rate in terms of μ Y and σ Y estimated using PDDPC method under each sample size N. The relative errors of μ Y and σ Y are given in Table 2. It can be observed that when N is less than 40, there is a large fluctuation in the calculation results of the model outputs. When the sample size N exceeds 40, the prediction results of the mean and standard deviation of the test case gradually converge. But it can also be observed that as the sample size N increases, the results do not converge monotonously. This can be attributed to the randomness of sampling. Fortunately, the results calculated by the PDDPC method still maintain a high level of accuracy.
Although the PDDPC method is a UQ scheme suitable for scarce amounts of sampled data, it still has a certain dependence on the sample size N. As the sample size N increases, the dependence of PDDPC gradually decreases. When the sample size N is greater than 40, PDDPC has a high calculation accuracy in predicting the statistical results in terms of the test function. Based on the results of the test function, we can infer that N = 40 is the critical sample size, which can then be used for the correct propagation of uncertainty.

4. Results and Discussion

In this section, the influence of sample size of stagger-angle error on uncertain aerodynamic evaluation of compressor blades is investigated under the condition of an inlet Mach number of 0.7. Figure 7 shows the uncertainty propagation process of stagger-angle errors where the PDDPC method is coupled with the CFD solver. In order to fully evaluate the effect of sample size, we consider three incidence operating conditions, i.e., blocking incidence condition (i = −0.5°), design incidence (i = 2.5°), and high-positive-incidence condition (i = 7°) (near stall).

4.1. Measured Data Processing

The measured data of stagger-angle errors in Section 2 are used as the input in the UQ analysis process. In Section 3.2, the test function shows that when sample size N is greater than 40, the third-order PDDPC method can achieve a high calculation accuracy. In this section, we also use the third-order PDDPC method to study the influence of sample size on aerodynamic performance of compressor blade. Six groups (N = 20, 30, 40, 50, 60, and 80) of varying sample sizes are generated from the initial sample set (N = 100), respectively. Figure 8 shows the histograms for each sample size. These sampled data will be used as random inputs for the PDDPC method. It can be observed that as the sample size N decreases, the probability information contained in the sampled data is further reduced. When the sample size N is 20 or 30, many measured error data have been lost compared with the initial sample set.

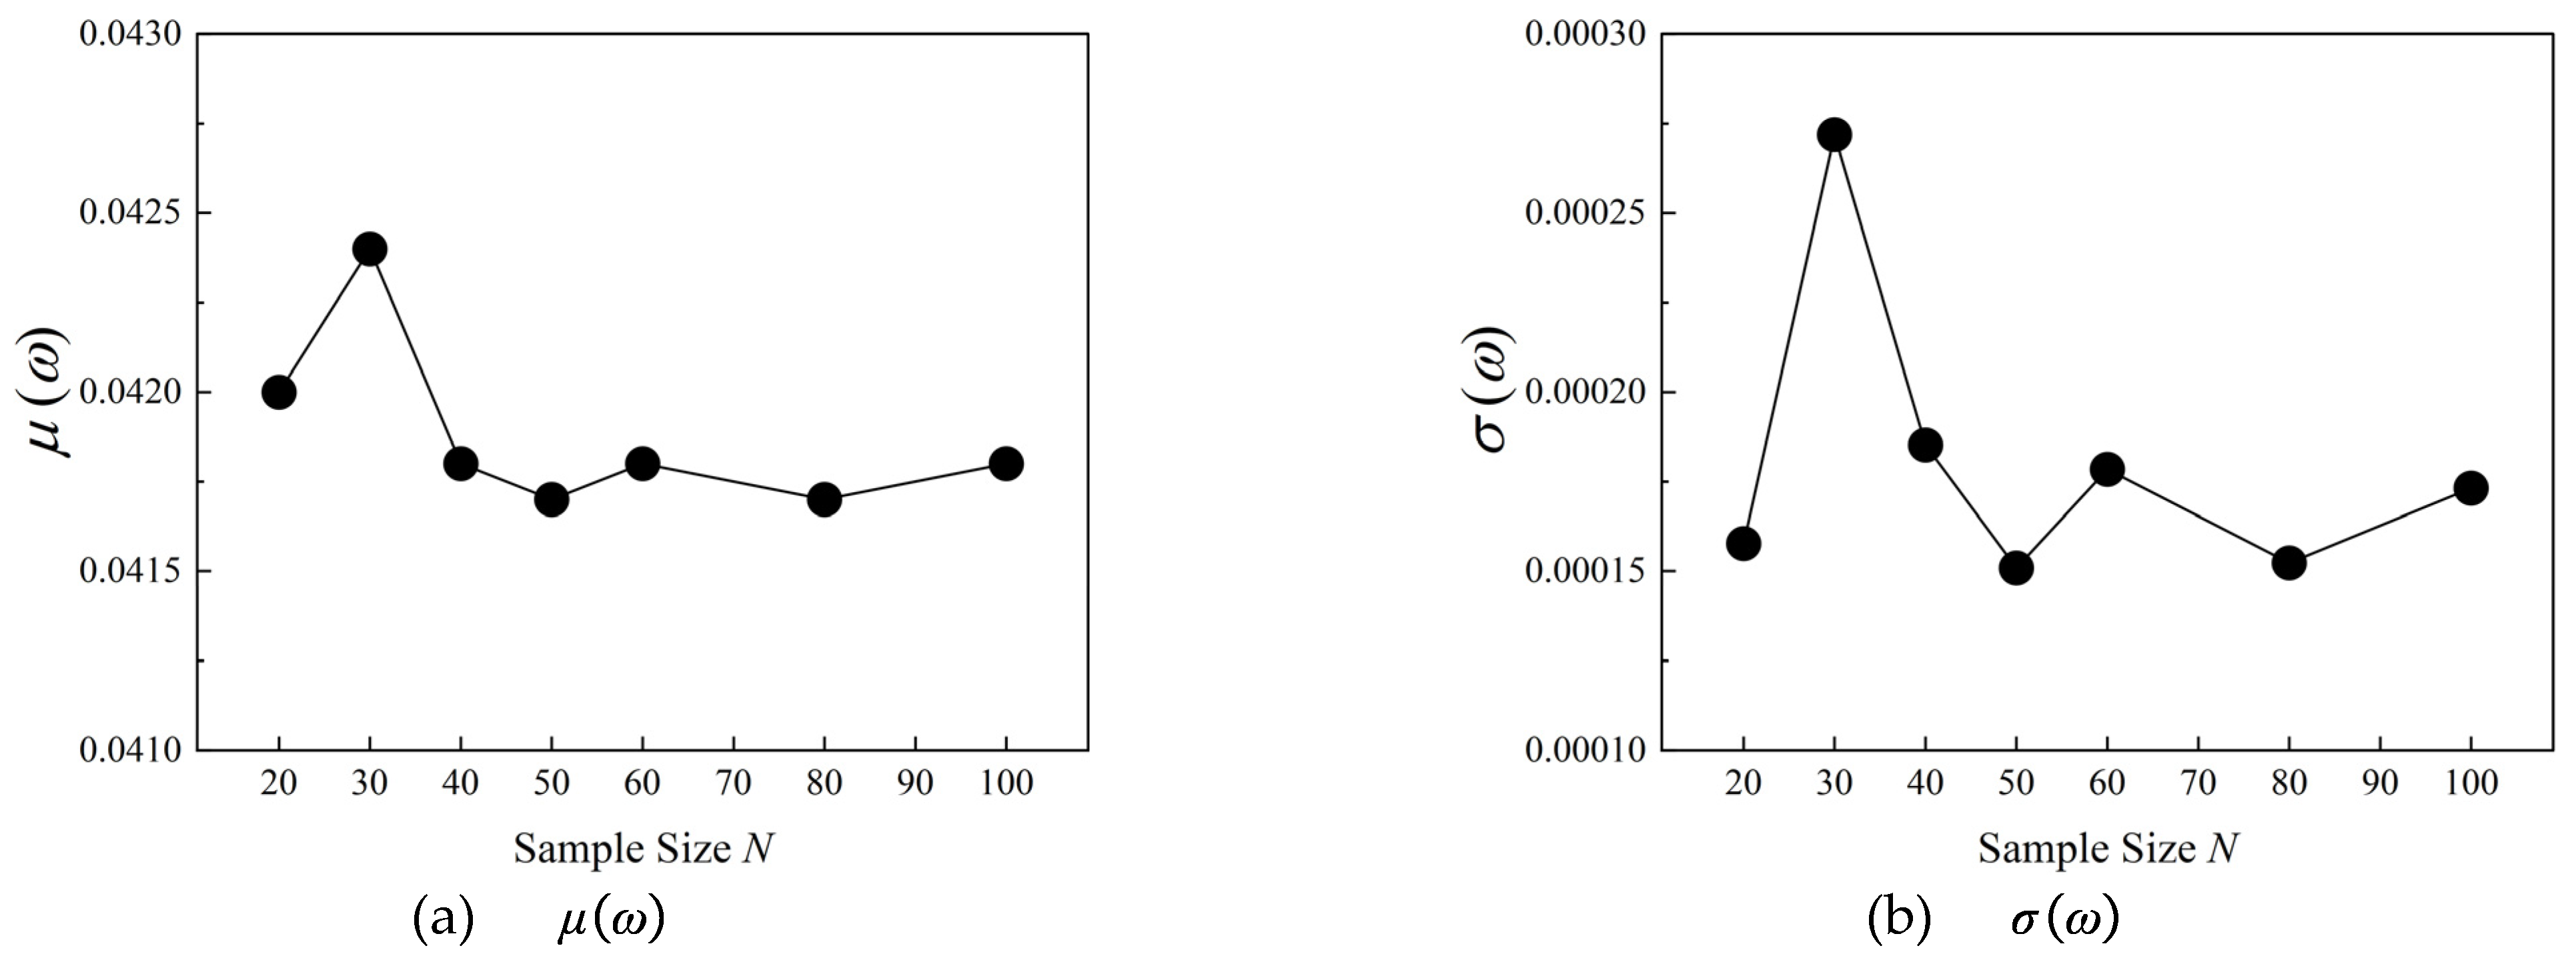
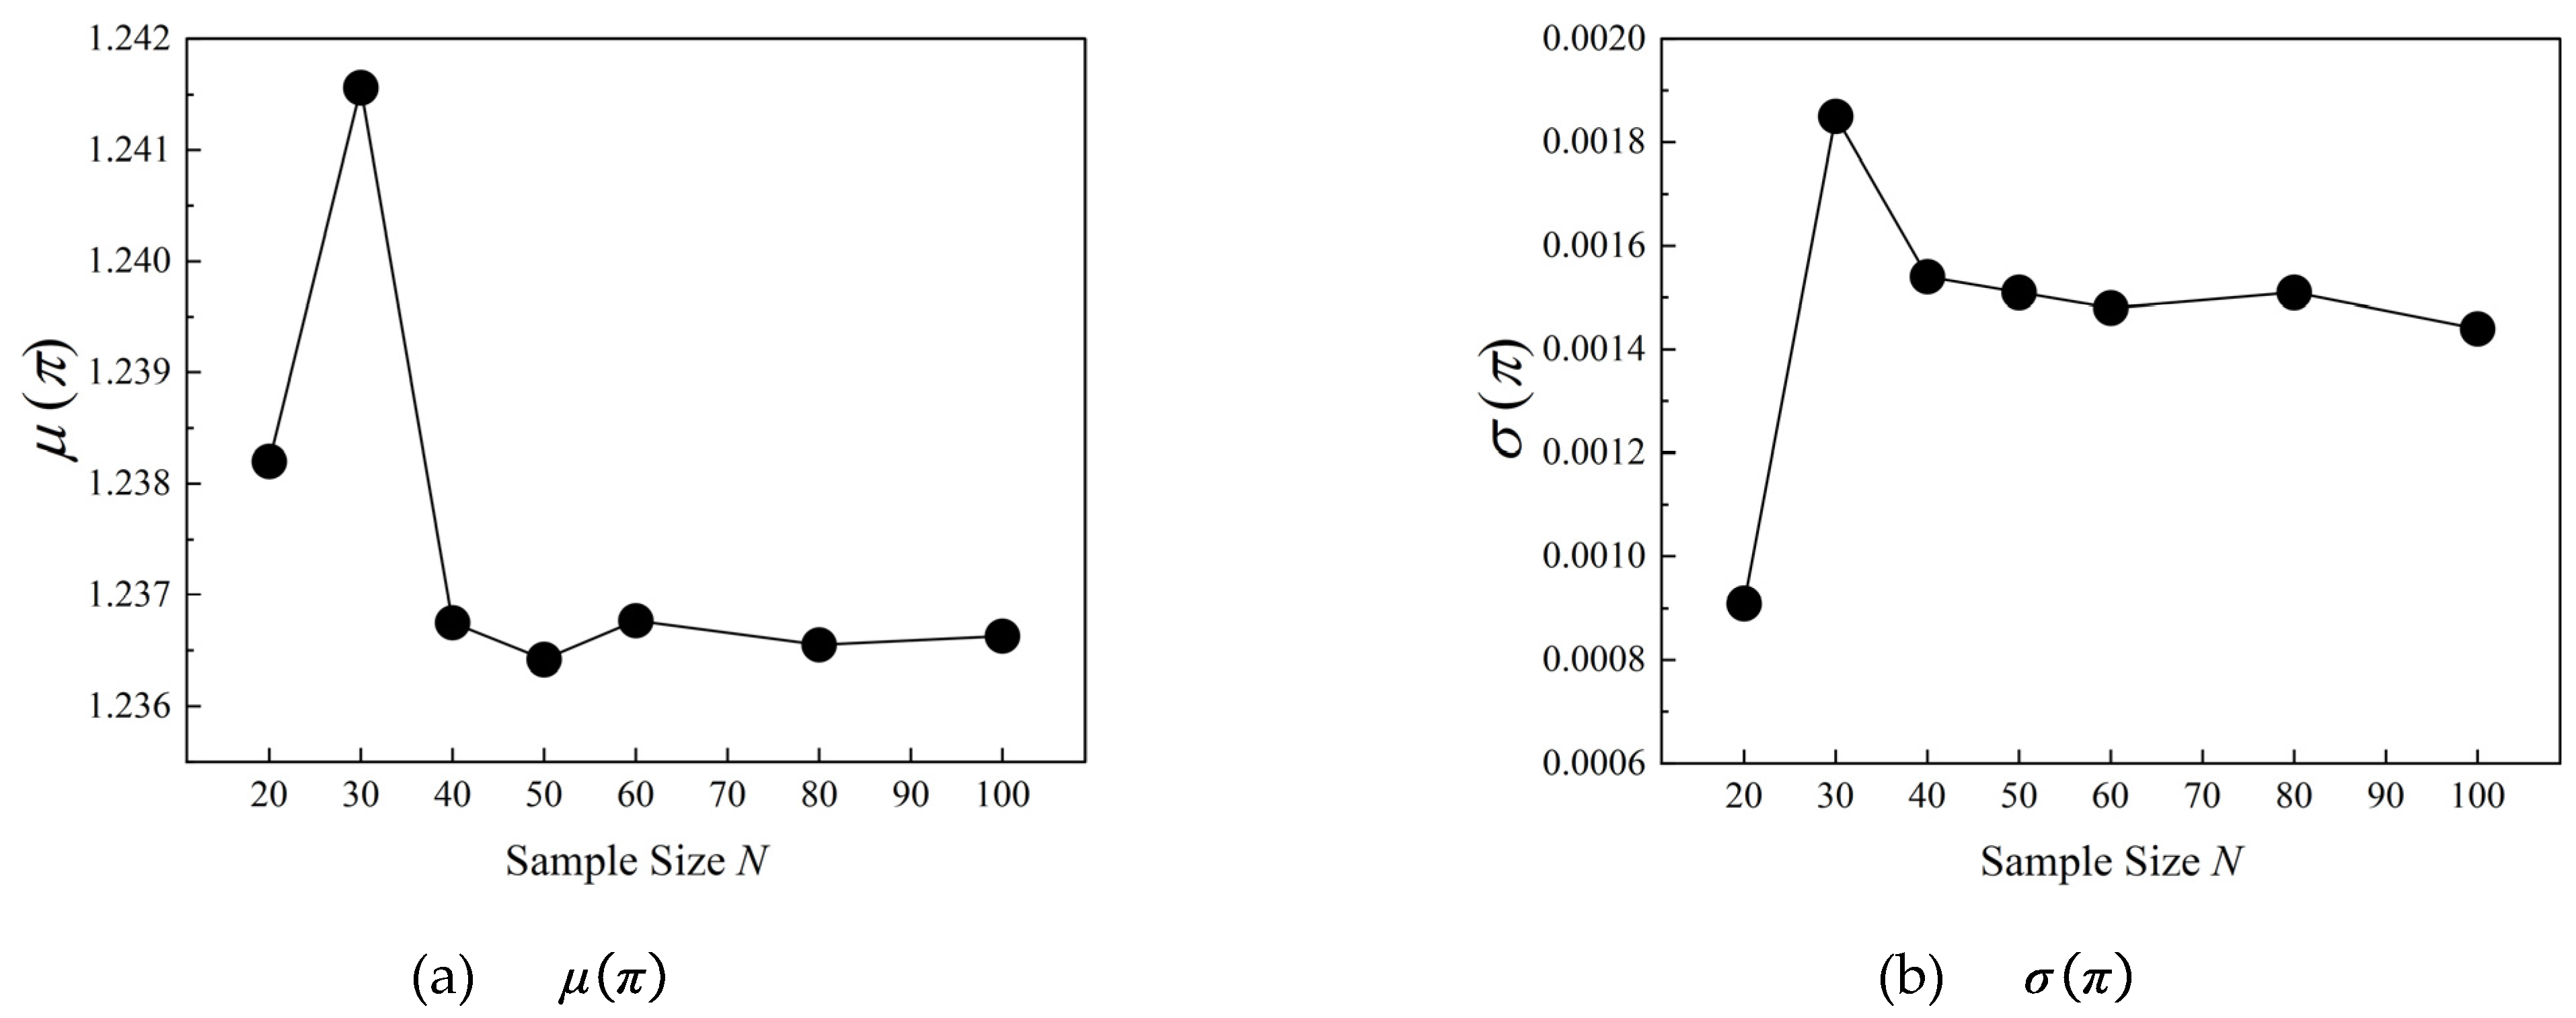
4.2. Aerodynamic UQ Results: Loss Coefficient ω and Static Pressure Ratio π

Under the blocking condition of incidence i = −0.5°, Figure 9 shows the mean value μ ω and standard deviation σ ω of the total pressure loss coefficient ω . It is worth noting that the previous open literature [1,25] has shown that 100 samples can be used for uncertainty propagation using the data-driven polynomial chaos method. Therefore, here we use the UQ results of 100 samples as the convergence reference values. It can be concluded from Figure 9a that the values of μ ω gradually convergence with the increase of the stagger-angle error samples. When the sample size N is 20 or 30, the values of μ ω fluctuates greatly. When the sample size N is higher than 40, the values of μ ω basically reach the convergence state. Figure 9b gives the convergence plot of σ ω with increasing data size N. It can be revealed that when the sample size is higher than 50, the results of σ ω can achieve a good convergence behavior.
For the static pressure ratio π of the compressor blade, it can be found from Figure 10 that the when sample size exceeds 40, the values of μ π and σ π estimated by the PDDPC method can achieve convergence of aerodynamic results. Under the operating condition of incidence i = −0.5°, the UQ results of the loss coefficient and static pressure ratio show that the PDDPC method has satisfactory performance to address the problem of limited measured data. For the uncertainty evaluation of compressor blades, using fewer measured data can not only reduce the detection cost but also greatly speed up the uncertainty analysis cycle.
Figure 11 displays the convergence plots of μ ω and σ ω under the design incidence i = 2.5° condition. It can be found that when sample size N exceeds 40, the values of μ ω have good aerodynamic convergence behavior. Although the values of σ ω have obvious fluctuations with increasing sample size, these fluctuations are very small. It is worth mentioning that the loss coefficient ω of the compressor blade is less affected by the uncertain stagger-angle errors at the design incidence condition. Figure 12 shows the UQ results ( μ π and σ π ) of static pressure ratio. When the sample size N exceeds 40 and 50 respectively, the calculation results of μ π and σ π can achieve a good convergence rate.
Figure 13 and Figure 14 present the UQ results of ω and π obtained by the PDDPC method under the operating conditions of incidence i = 7°. As can be seen from the convergence plots, when the sample size reaches 40, the UQ results of ω and π both exhibit a good convergence state. Table 3 gives the critical sample sizes for different aerodynamic parameters under various operating conditions. It can be found that, for the PDDPC method, 40 or 50 can be regarded as the critical sample size for the aerodynamic parameters of loss coefficient and static pressure ratio. Generally speaking, the aerodynamic performance of compressor blades is more sensitive to the stagger-angle error at the high-positive-incidence condition. The convergent UQ results of aerodynamic parameters can provide more solid confidence for uncertainty analysis using fewer samples.

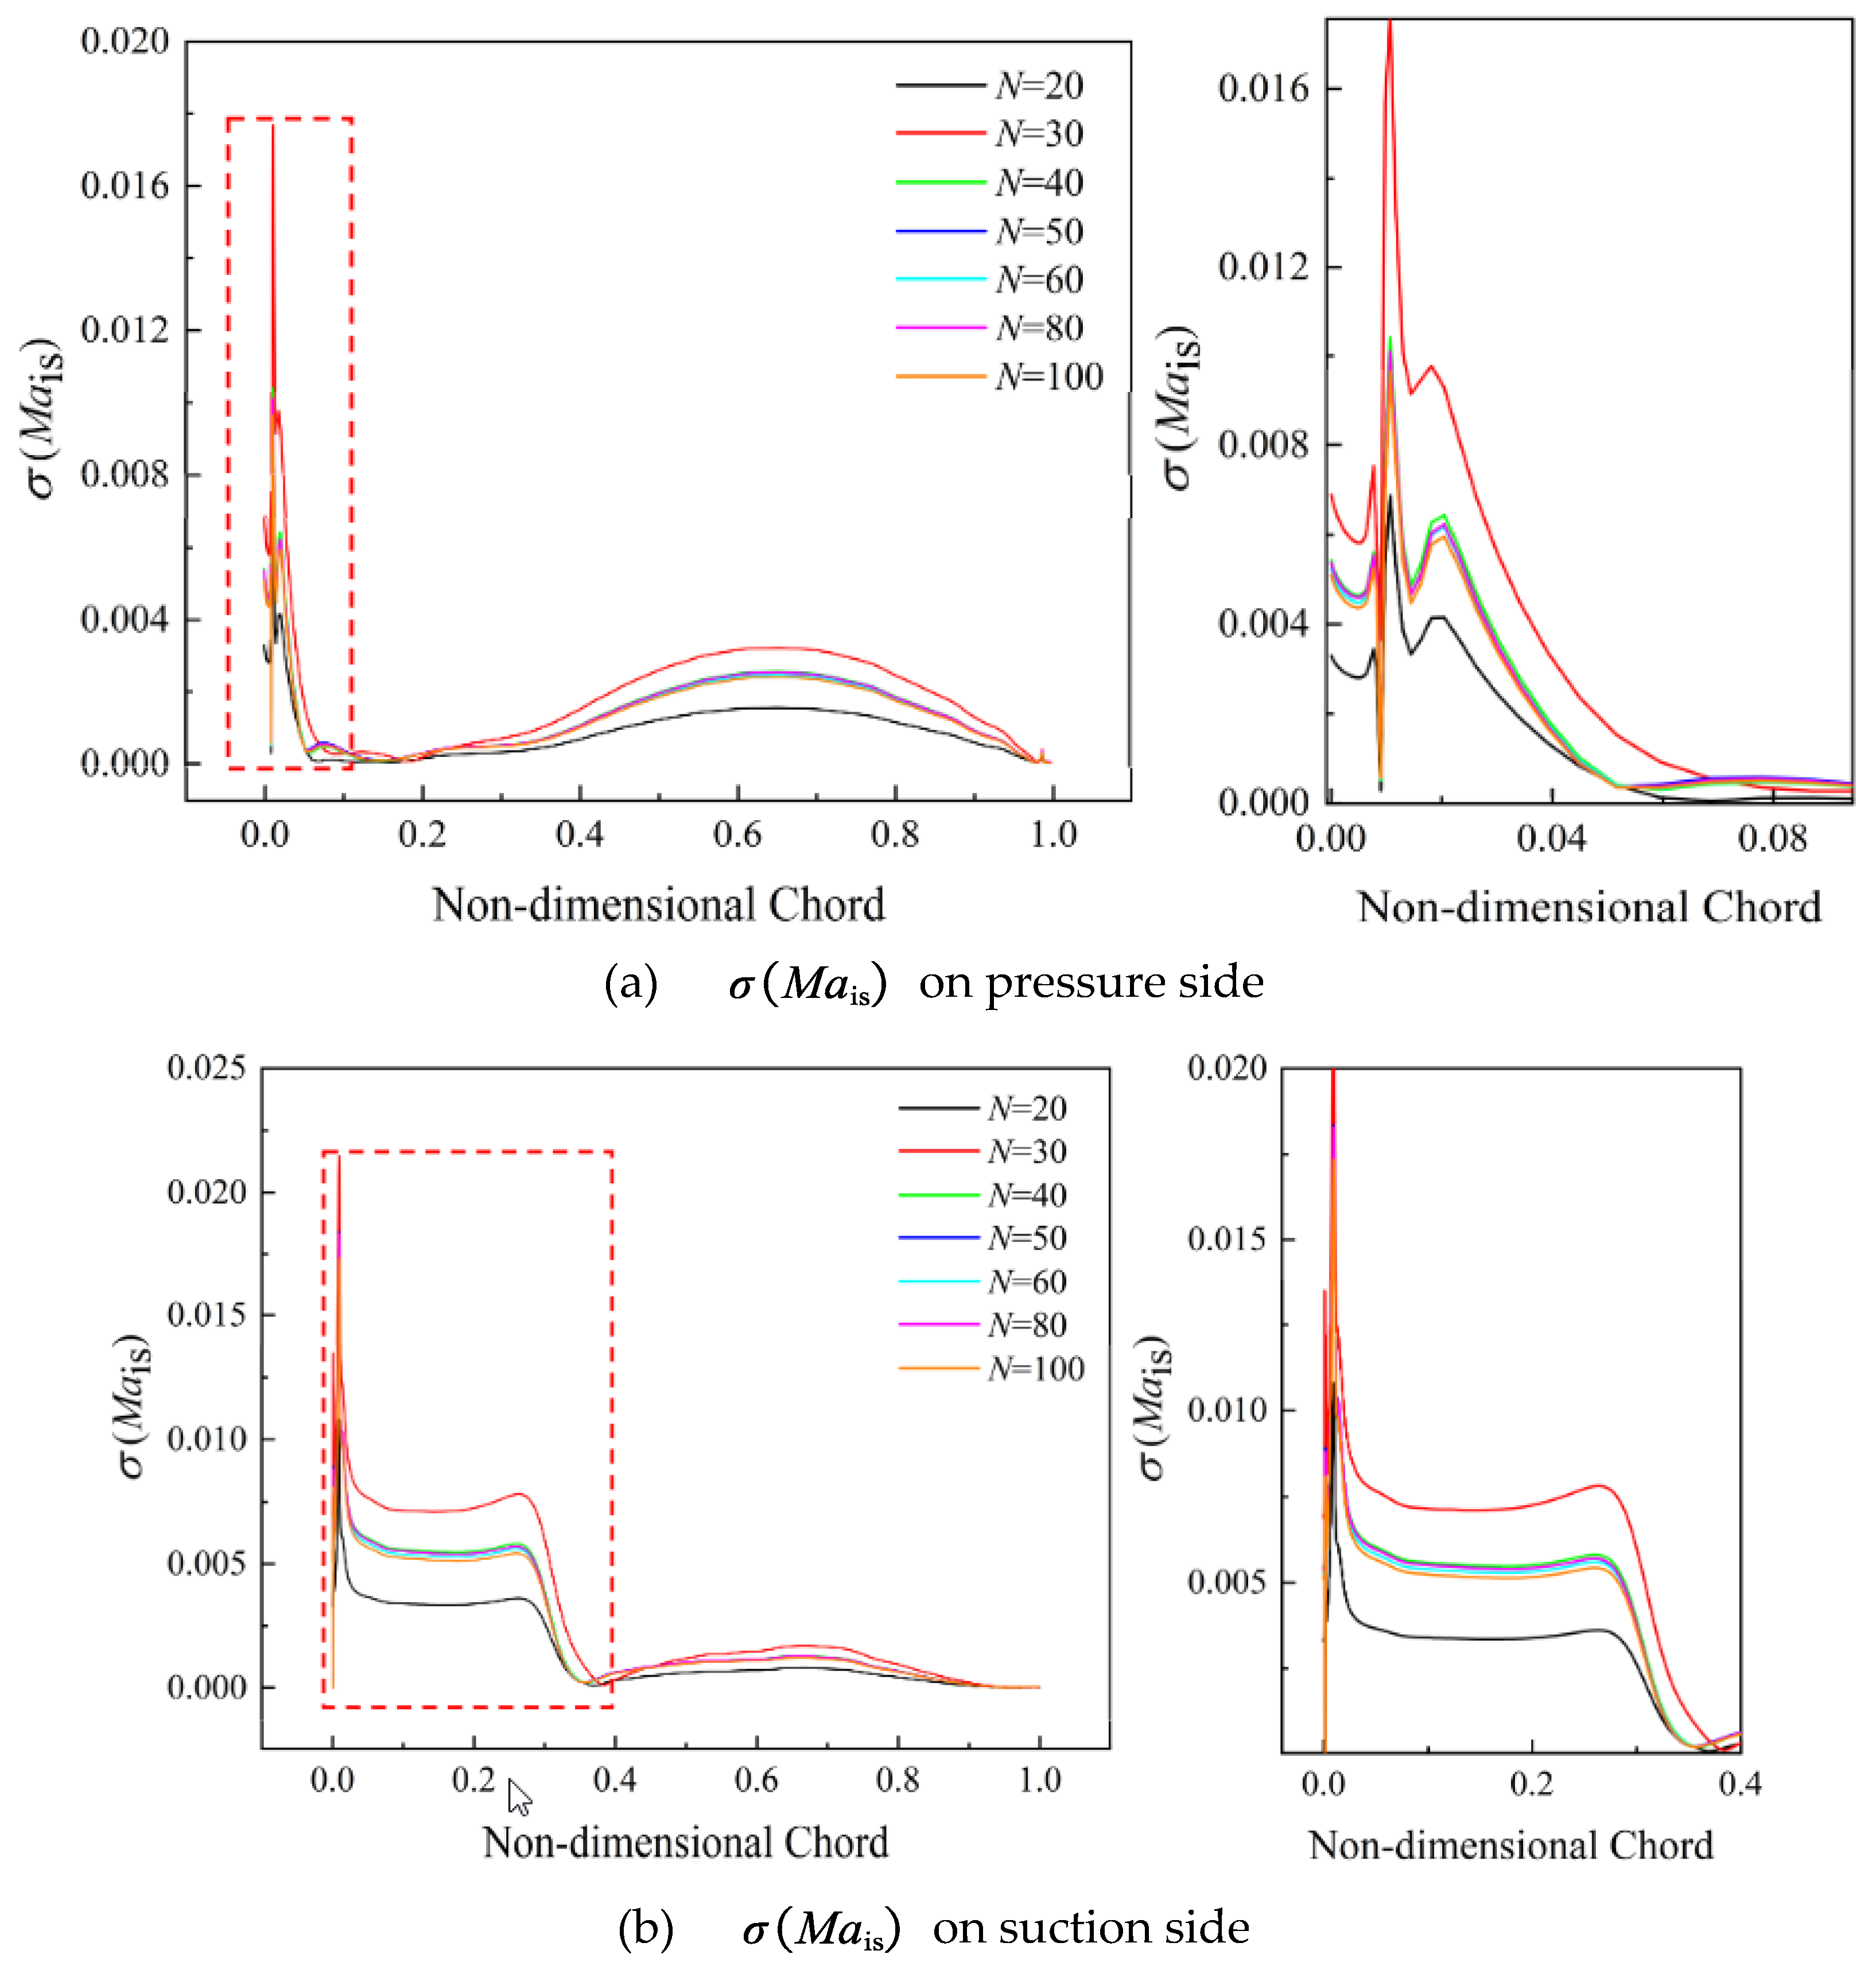
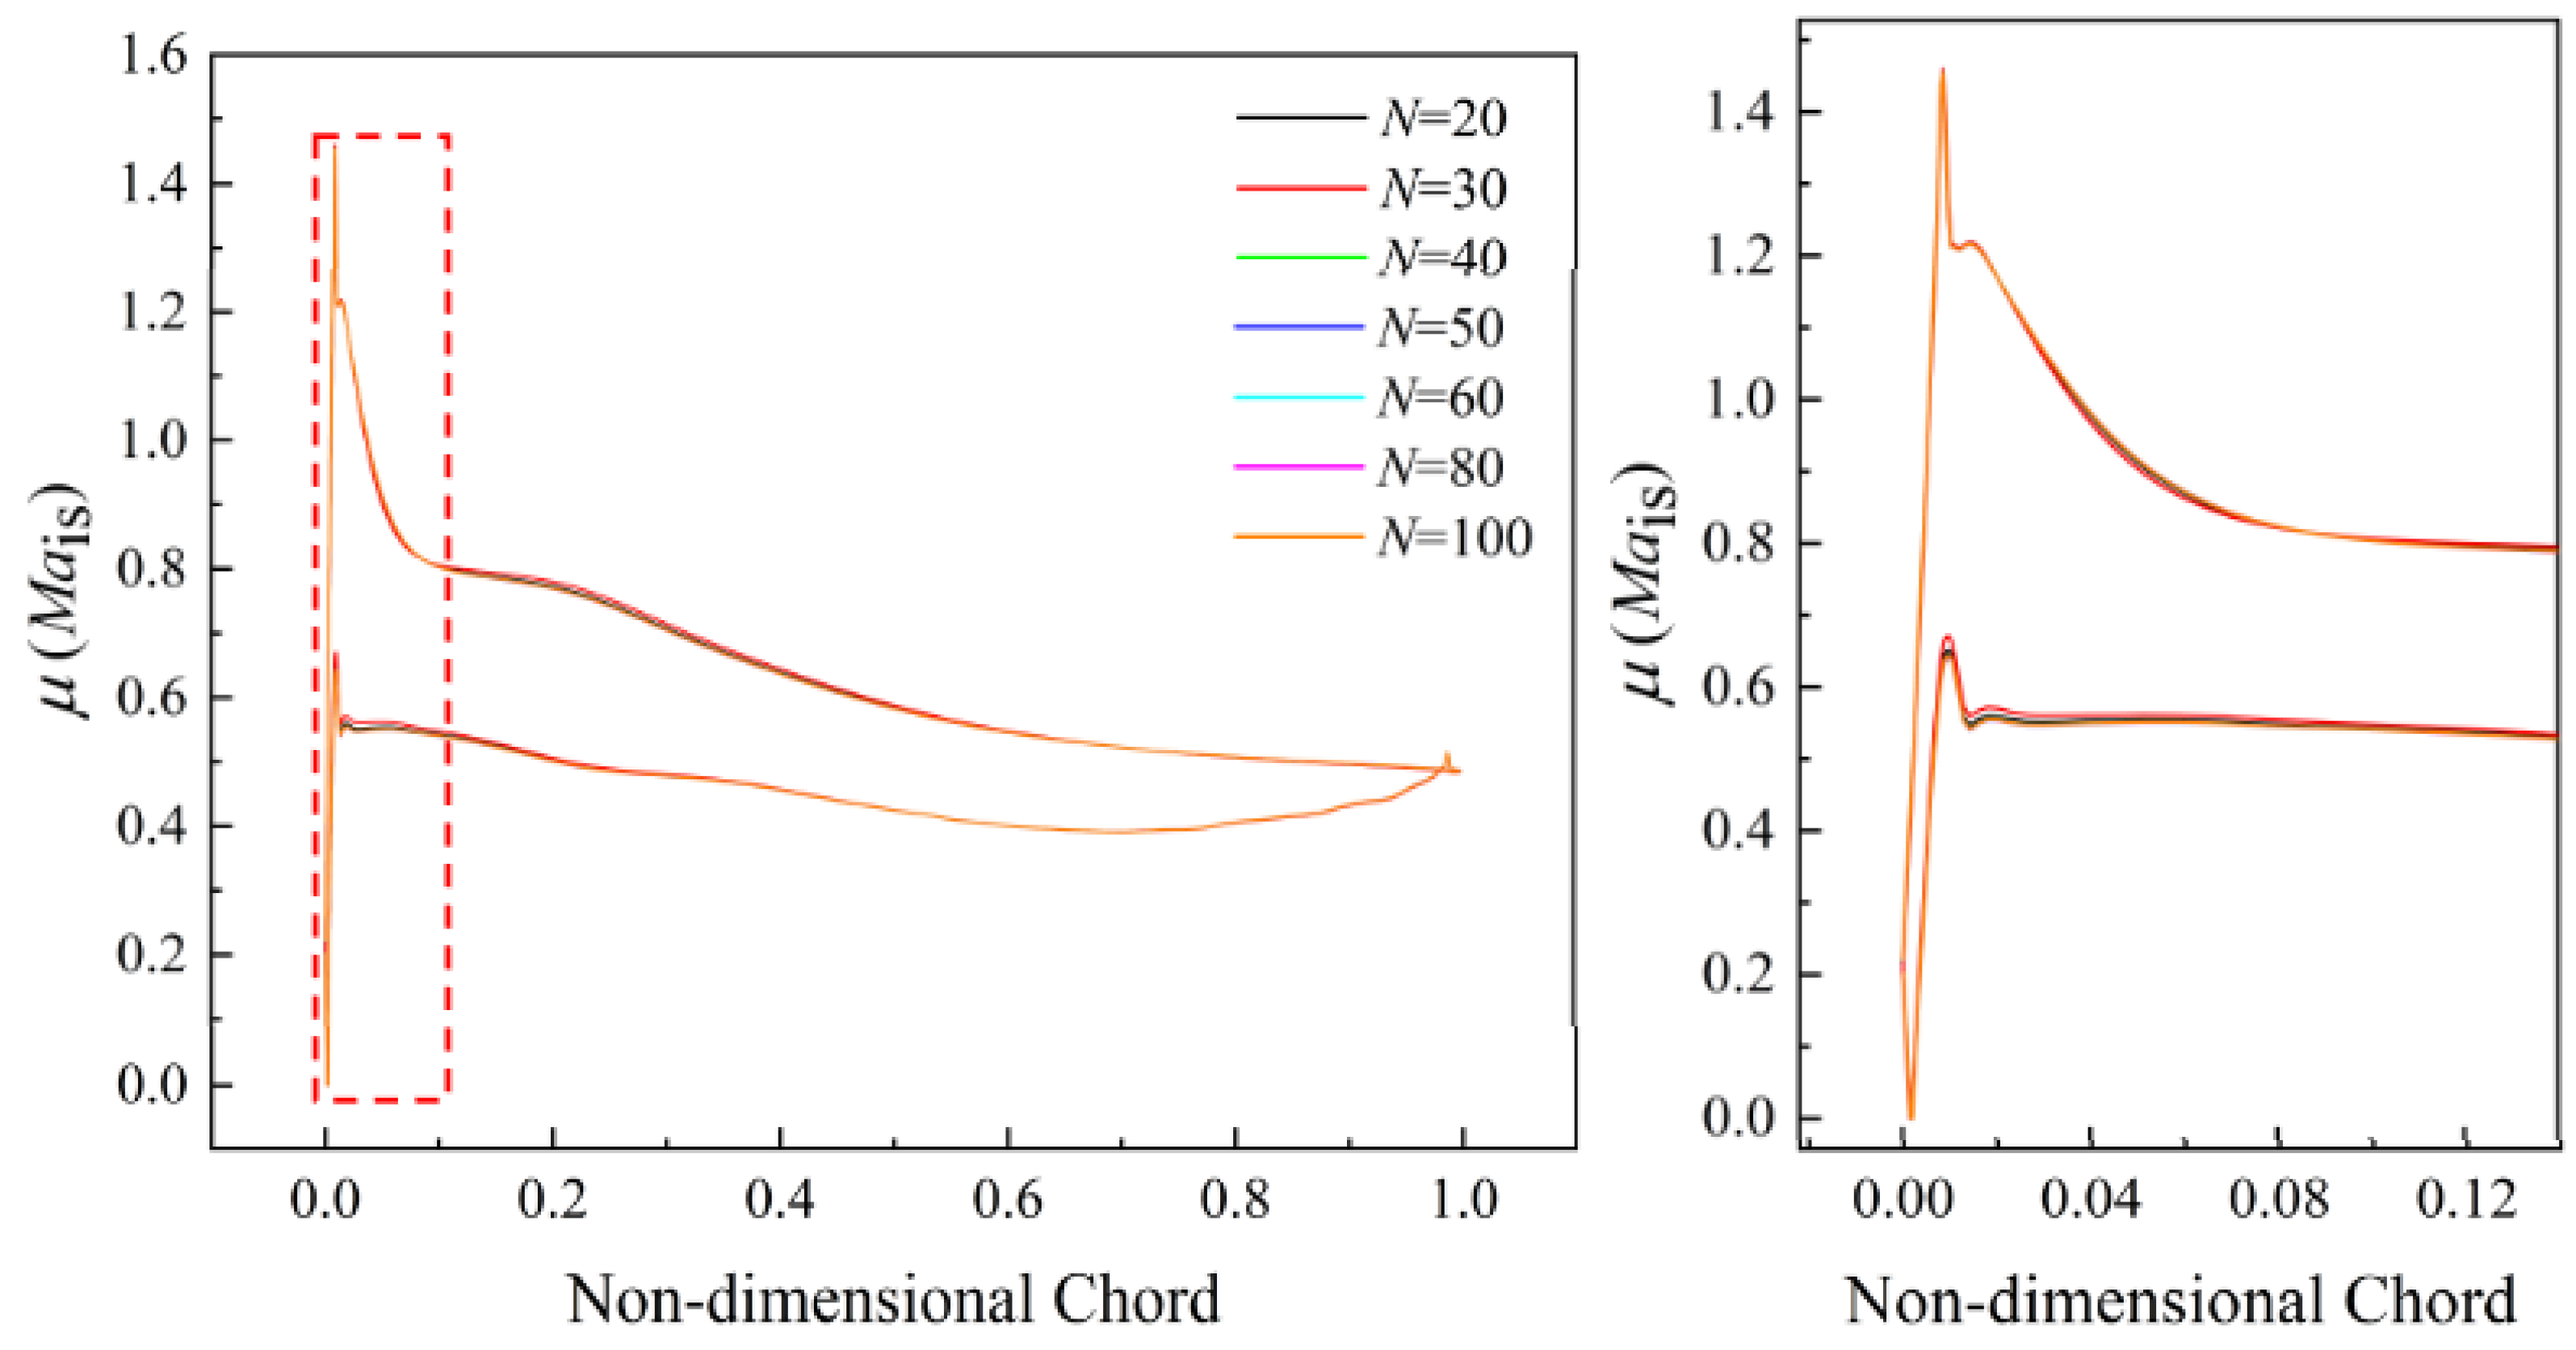
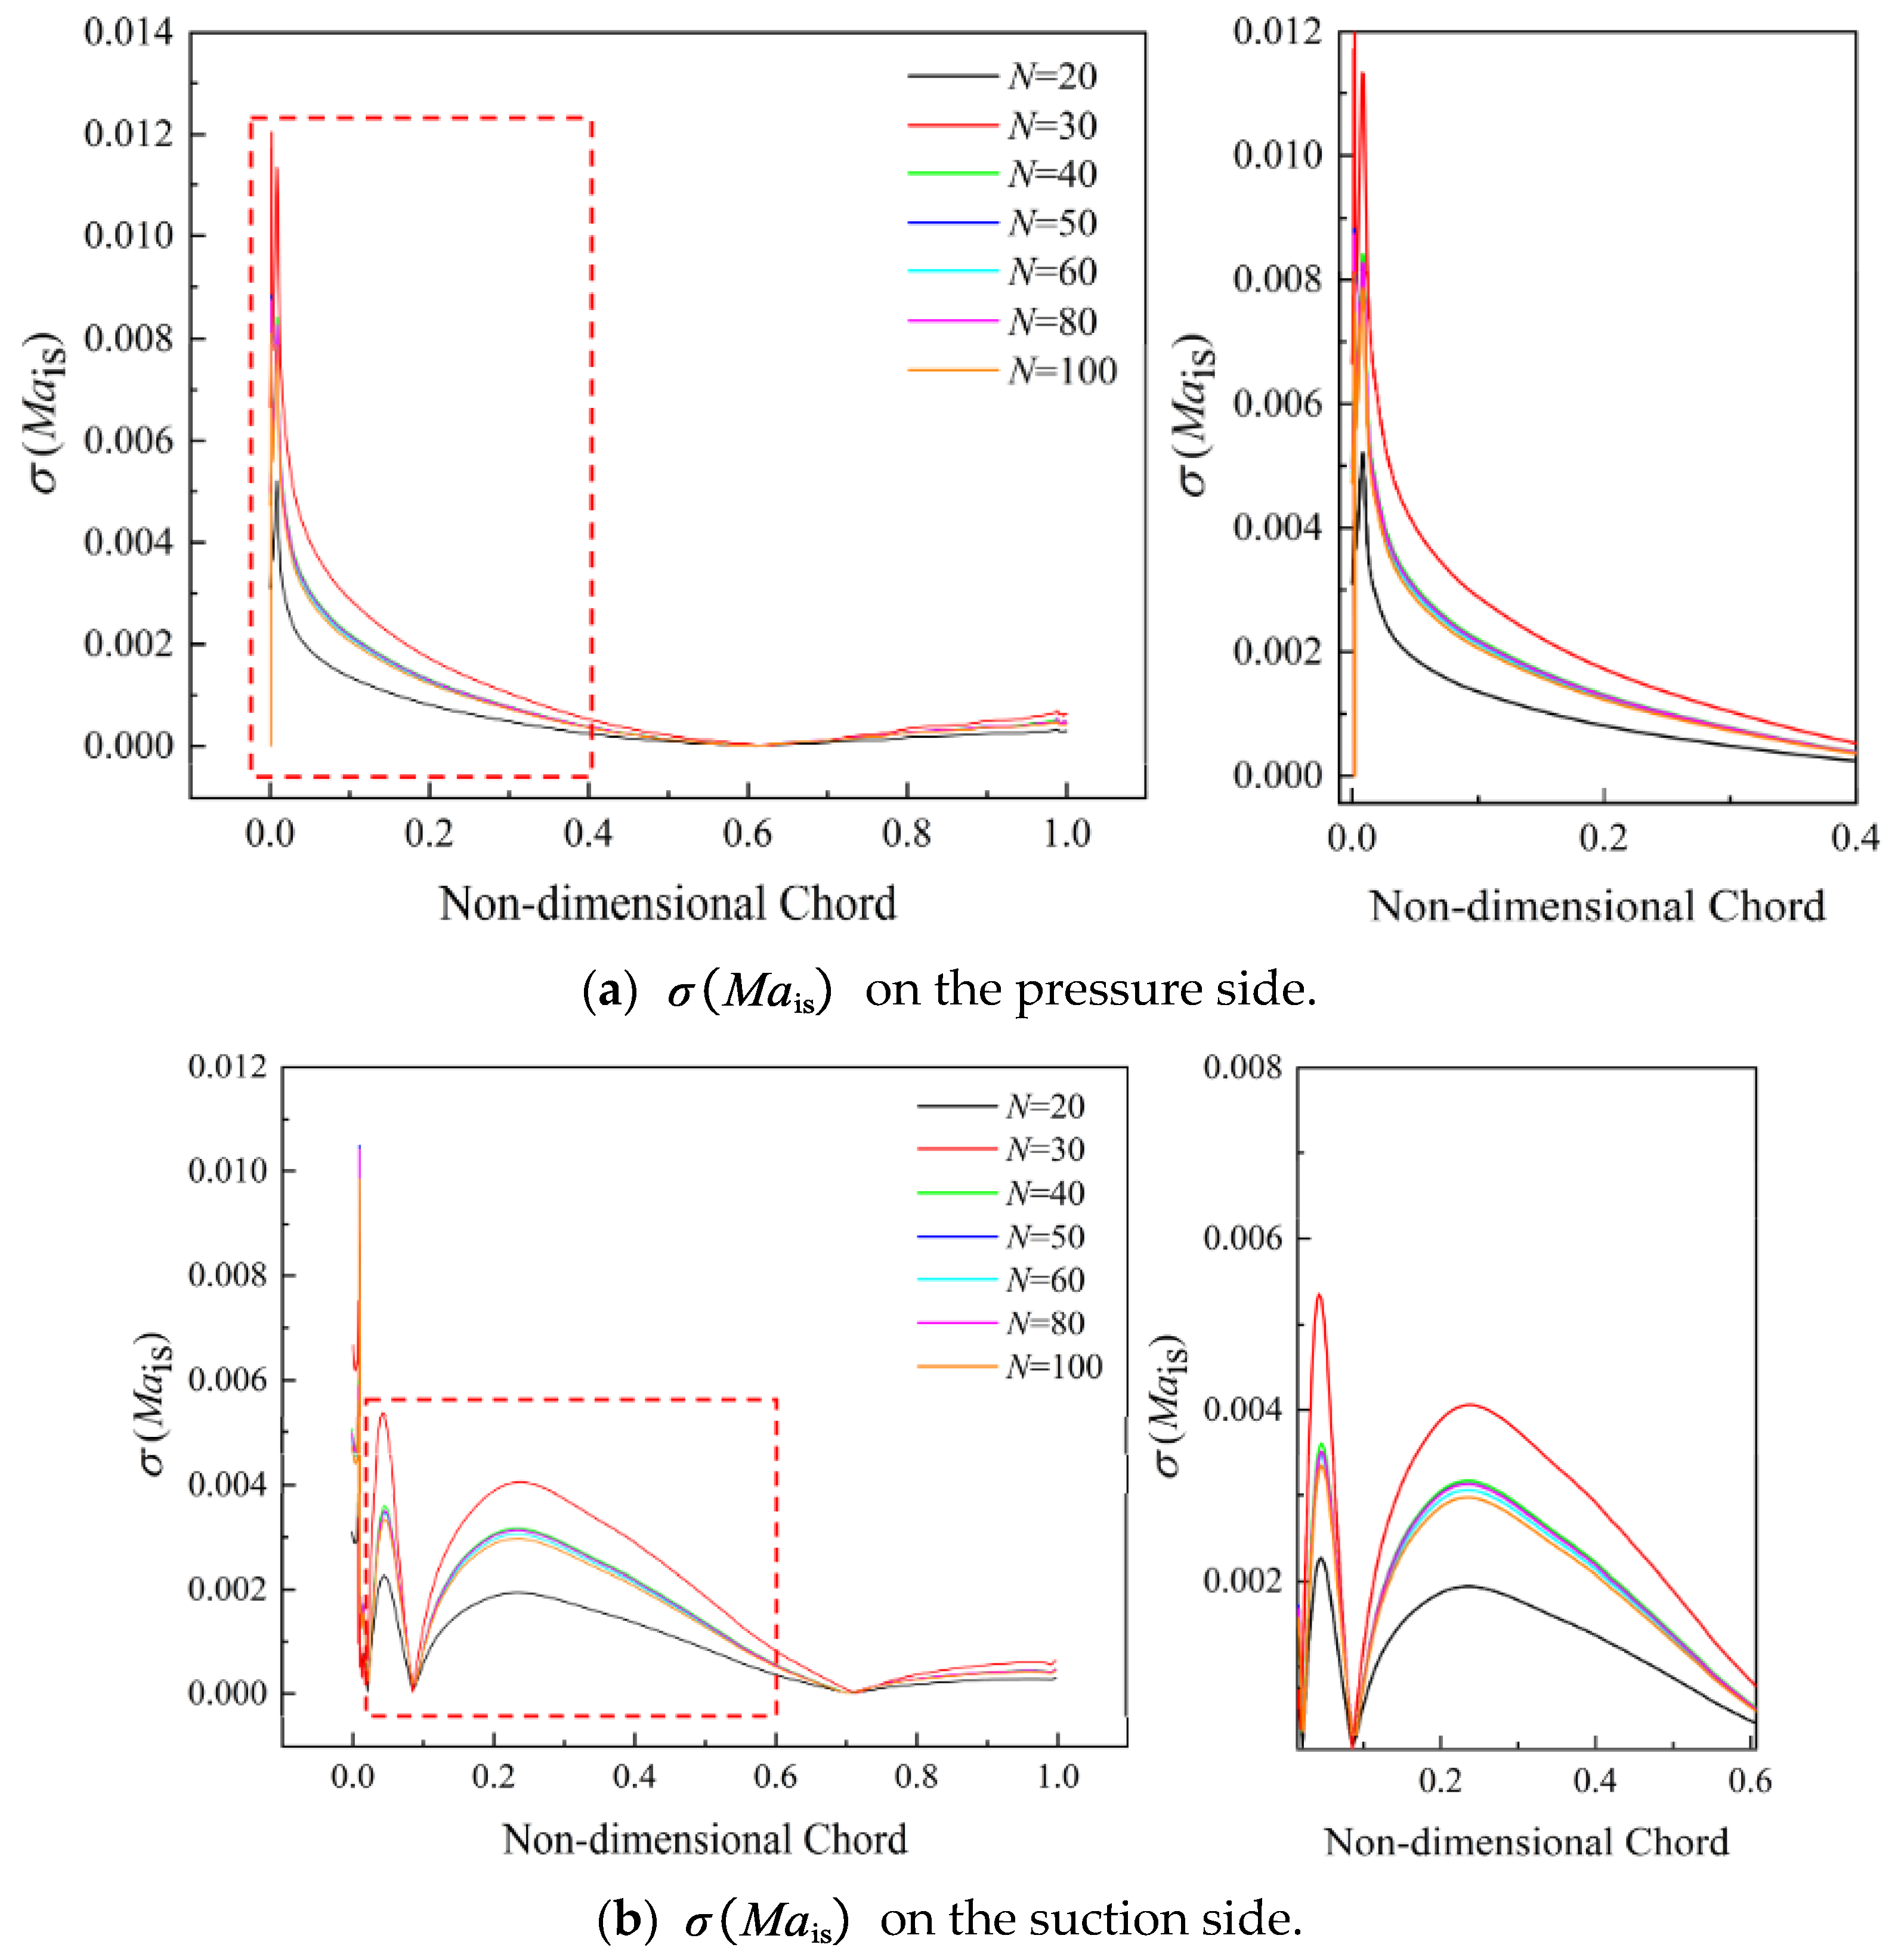
4.3. Aerodynamic UQ Results: Isentropic Mach Number M a i s

Figure 15 shows the mean value of the isentropic Mach number μ M a i s and the enlarged part at the incidence i = −0.5° condition. It can be clearly observed that the values of μ M a i s calculated by different sample sizes are essentially the same. When the sample size is 20 or 30, there are some differences on the acceleration section of the blade suction side. The results of σ M a i s are shown in Figure 16. For σ M a i s on the blade pressure side, the series of zones sensitive to uncertain stagger-angle errors that was obtained by the lower sample size (N = 20 and 30) differs from those obtained with other sample sizes. The predicted deviations occur mainly in the leading-edge region and the back part of the blade. For σ M a i s on blade suction side, the predicted deviations are mainly concentrated on the first 40% of normalized chord length when the sample size N is 20 or 30.
At the design incidence condition, the influence of the sample size on the μ M a i s is similar to that for incidence i = −0.5°, as shown in Figure 17. Figure 18 shows the results of σ M a i s . It can be determined from the illustration in Figure 18a that the influence of stagger-angle error on the pressure side (PS) is mainly concentrated in the first 30% of the normalized chord length. When the sample size is lower than 40, there is an underestimation or overestimation of fluctuations of blade isentropic Mach number. A similar situation exists for the results of σ M a i s on the suction side (SS).
Under the operation condition of incidence i = 7°, Figure 19 and Figure 20 show the convergence plots of μ M a i s and σ M a i s . As expected, the values of μ M a i s are less sensitive to the sample sizes of stagger-angle errors. It can be seen from Figure 20 that although the trend of convergence plots for fewer samples (N = 20 or 30) is similar to those for the other sample sizes, there is a large prediction error. For compressor blade designers, the incorrect estimates of sensitive zones can cause a significant risk for robust blade design. Therefore, it is important to obtain a critical sample size that can be used for accurate UQ analysis. Table 4 gives the critical sample size for Mais under various operating conditions. We could observe that the μ M a i s is less sensitive to sample size of stagger-angle error. Sample size N = 40 can be considered as the critical size.

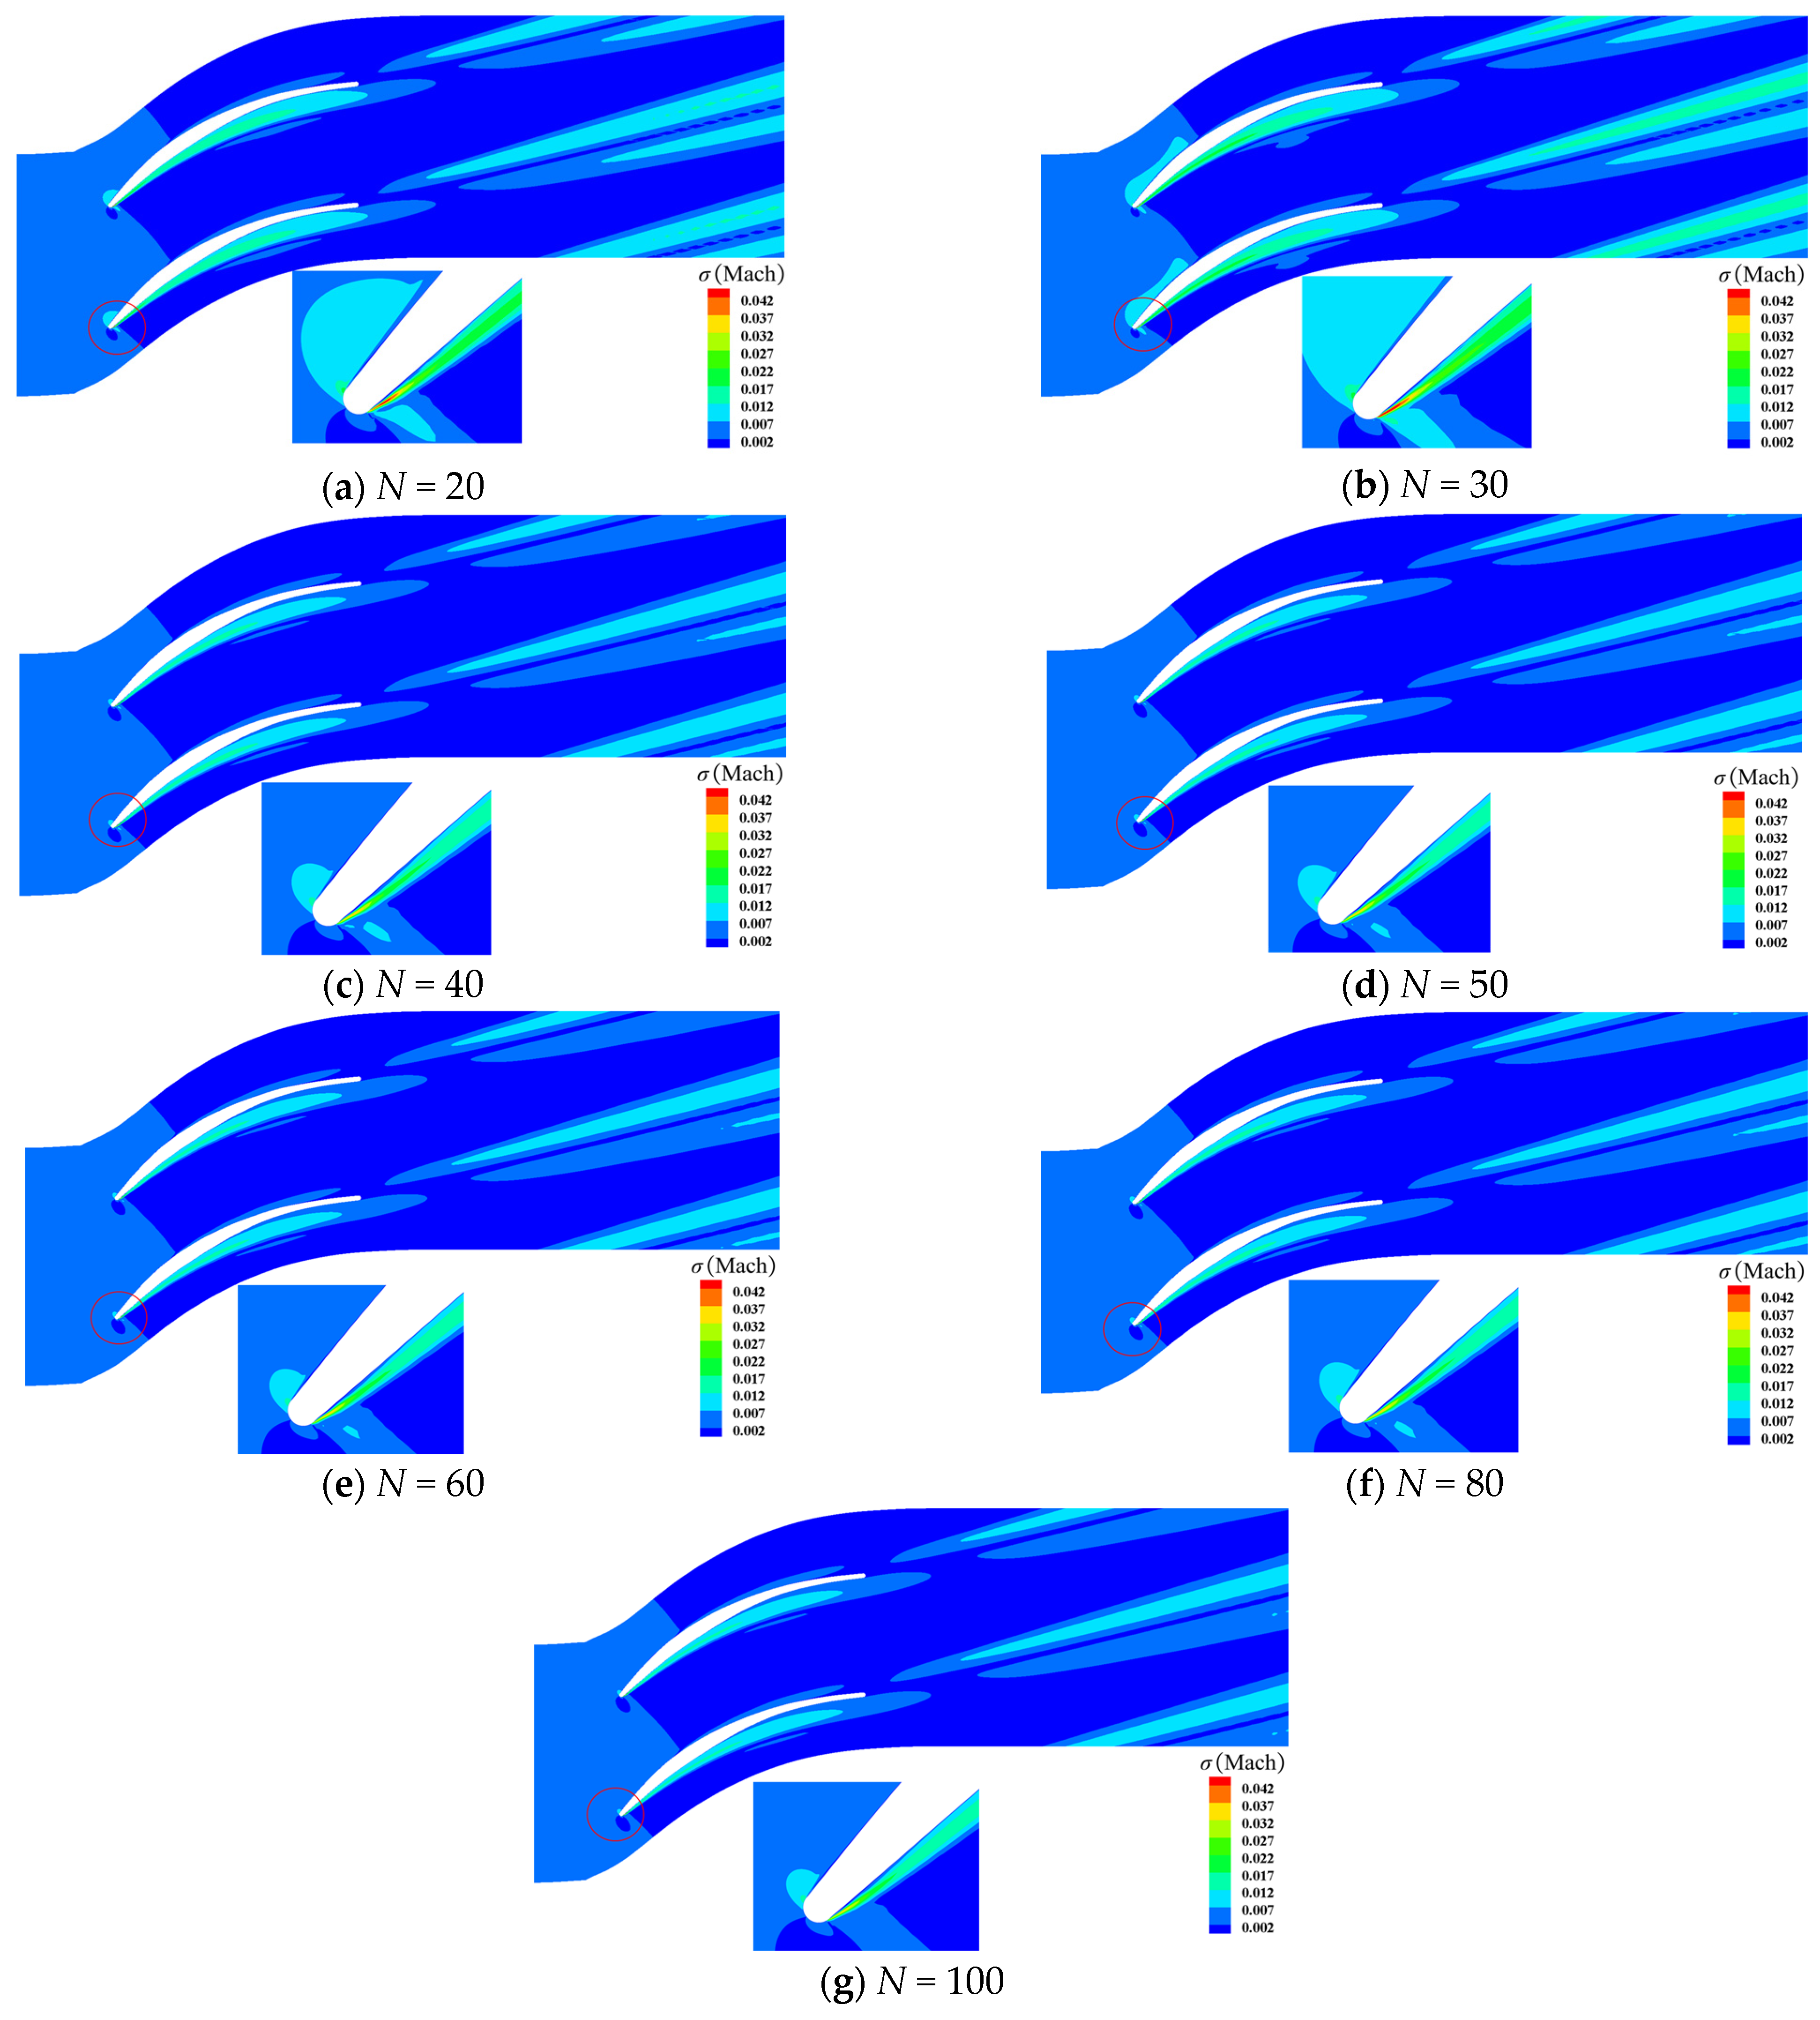
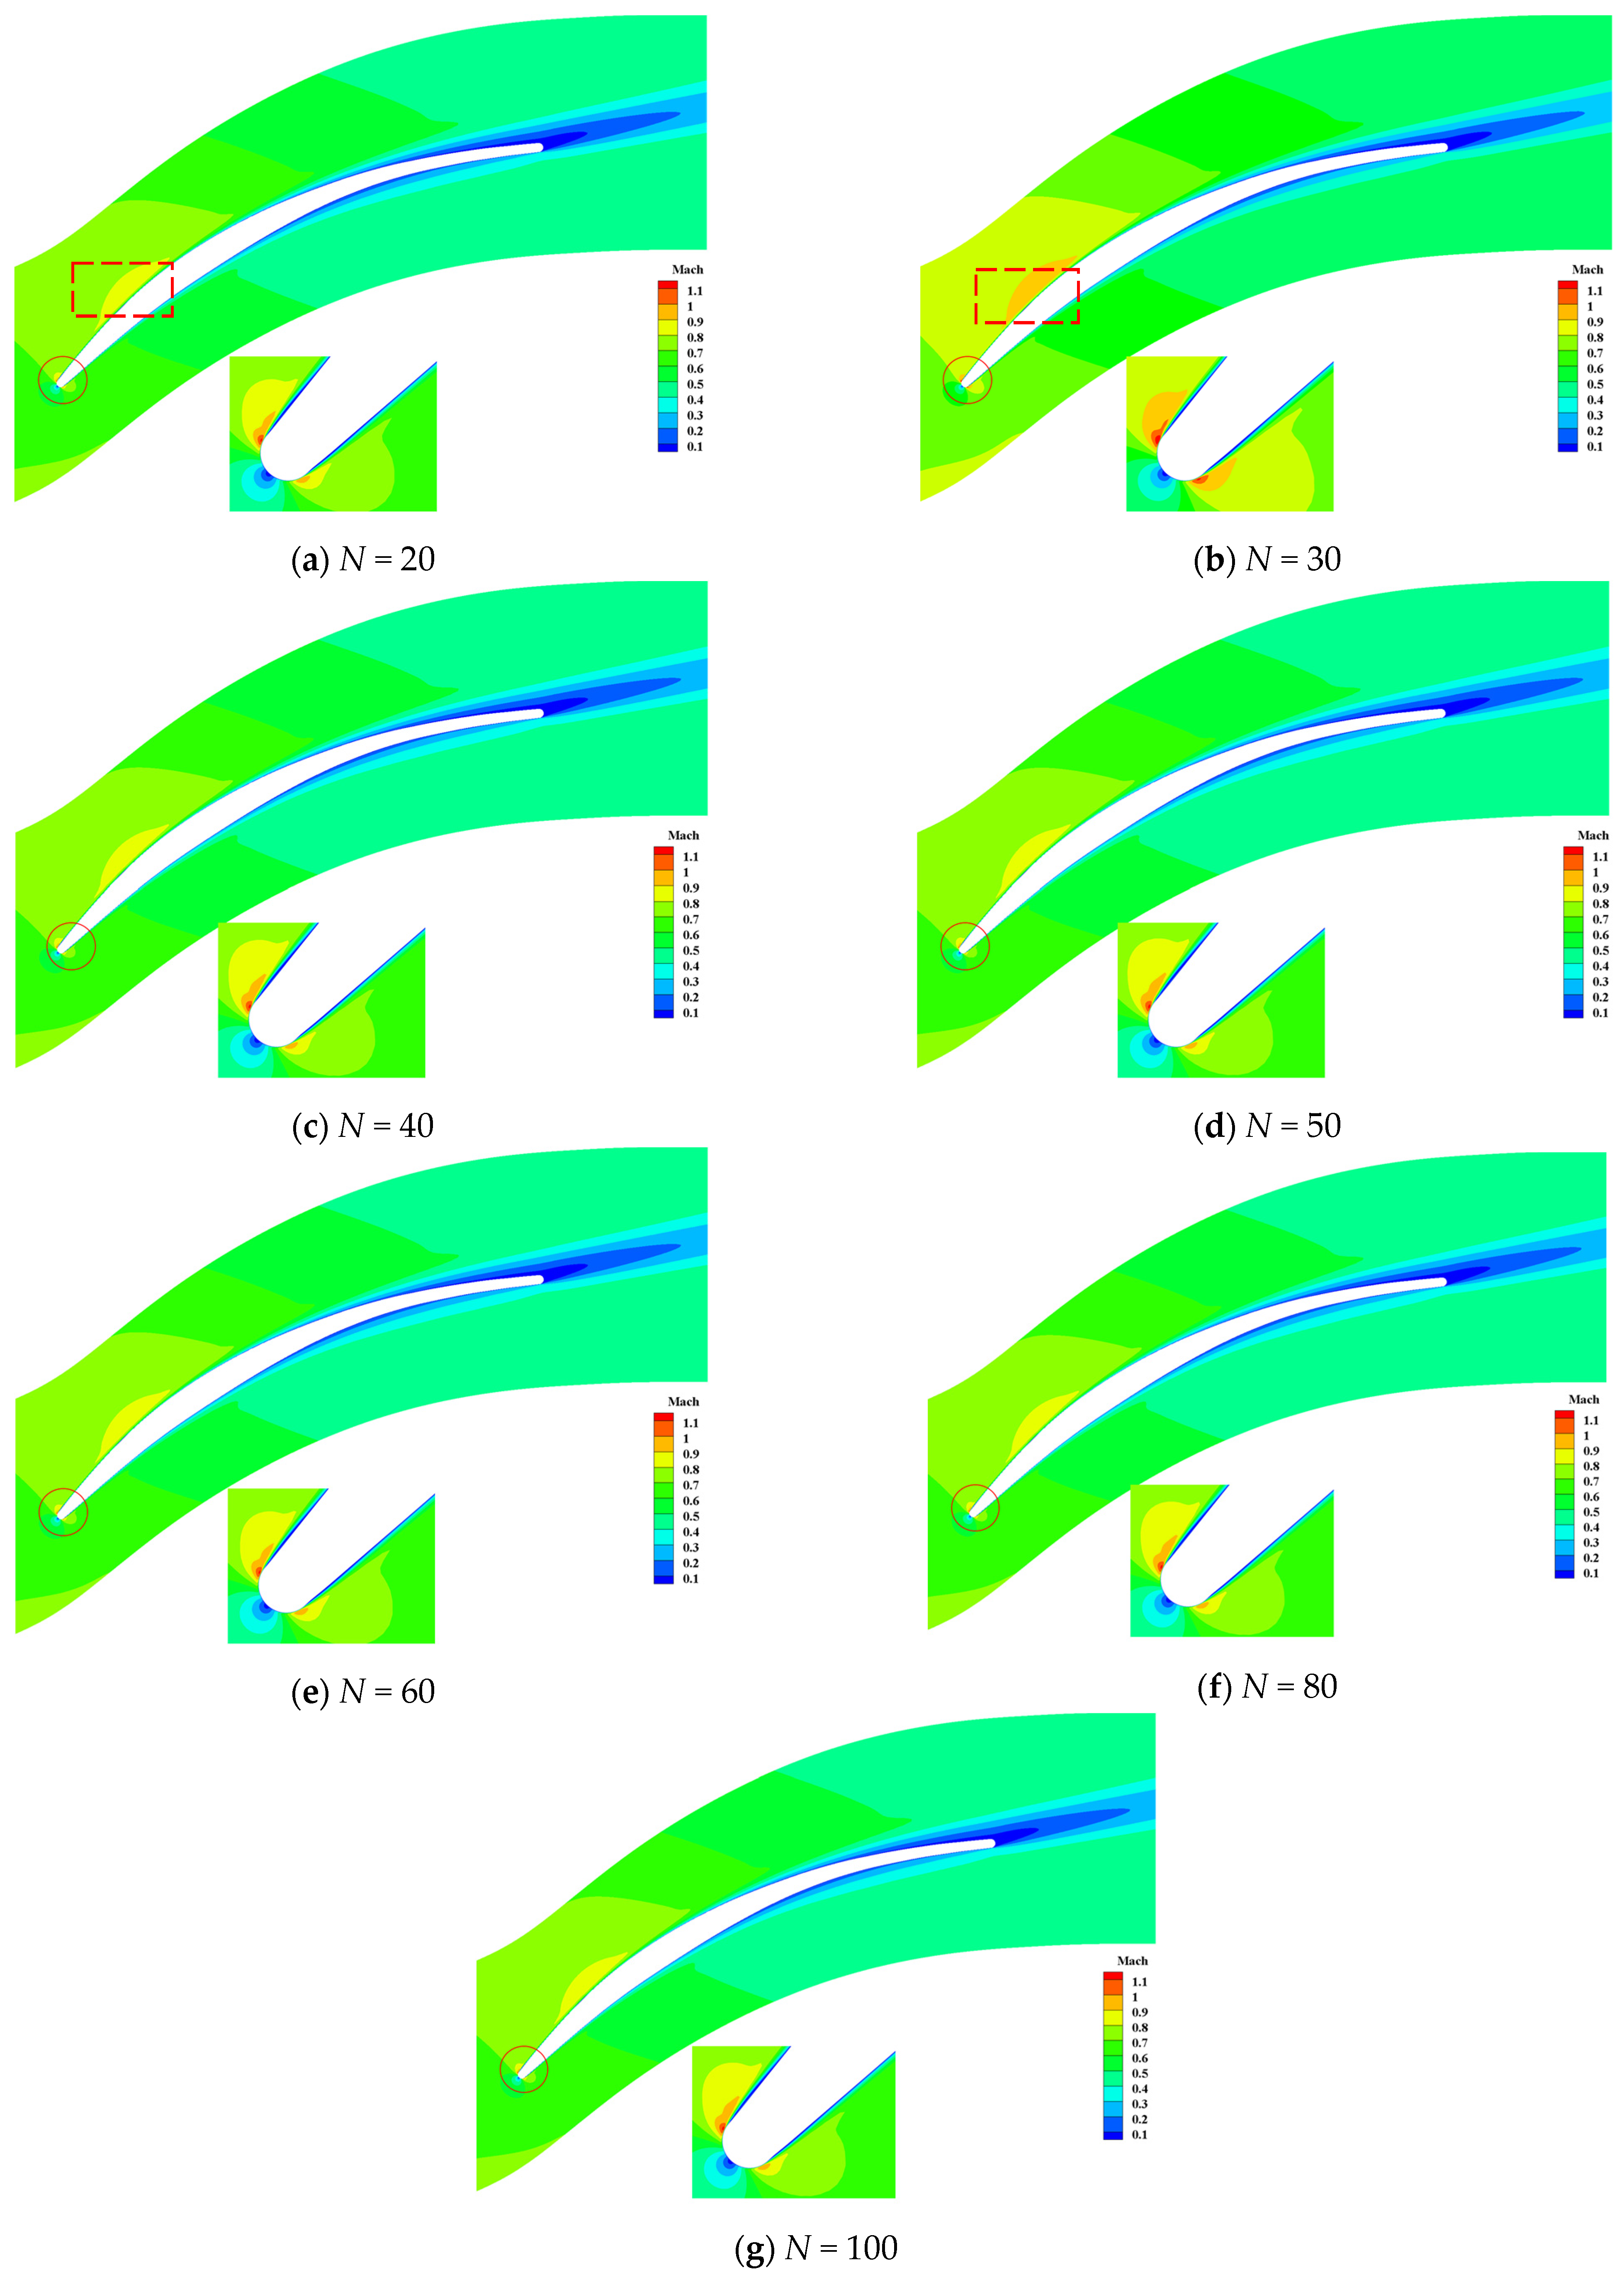
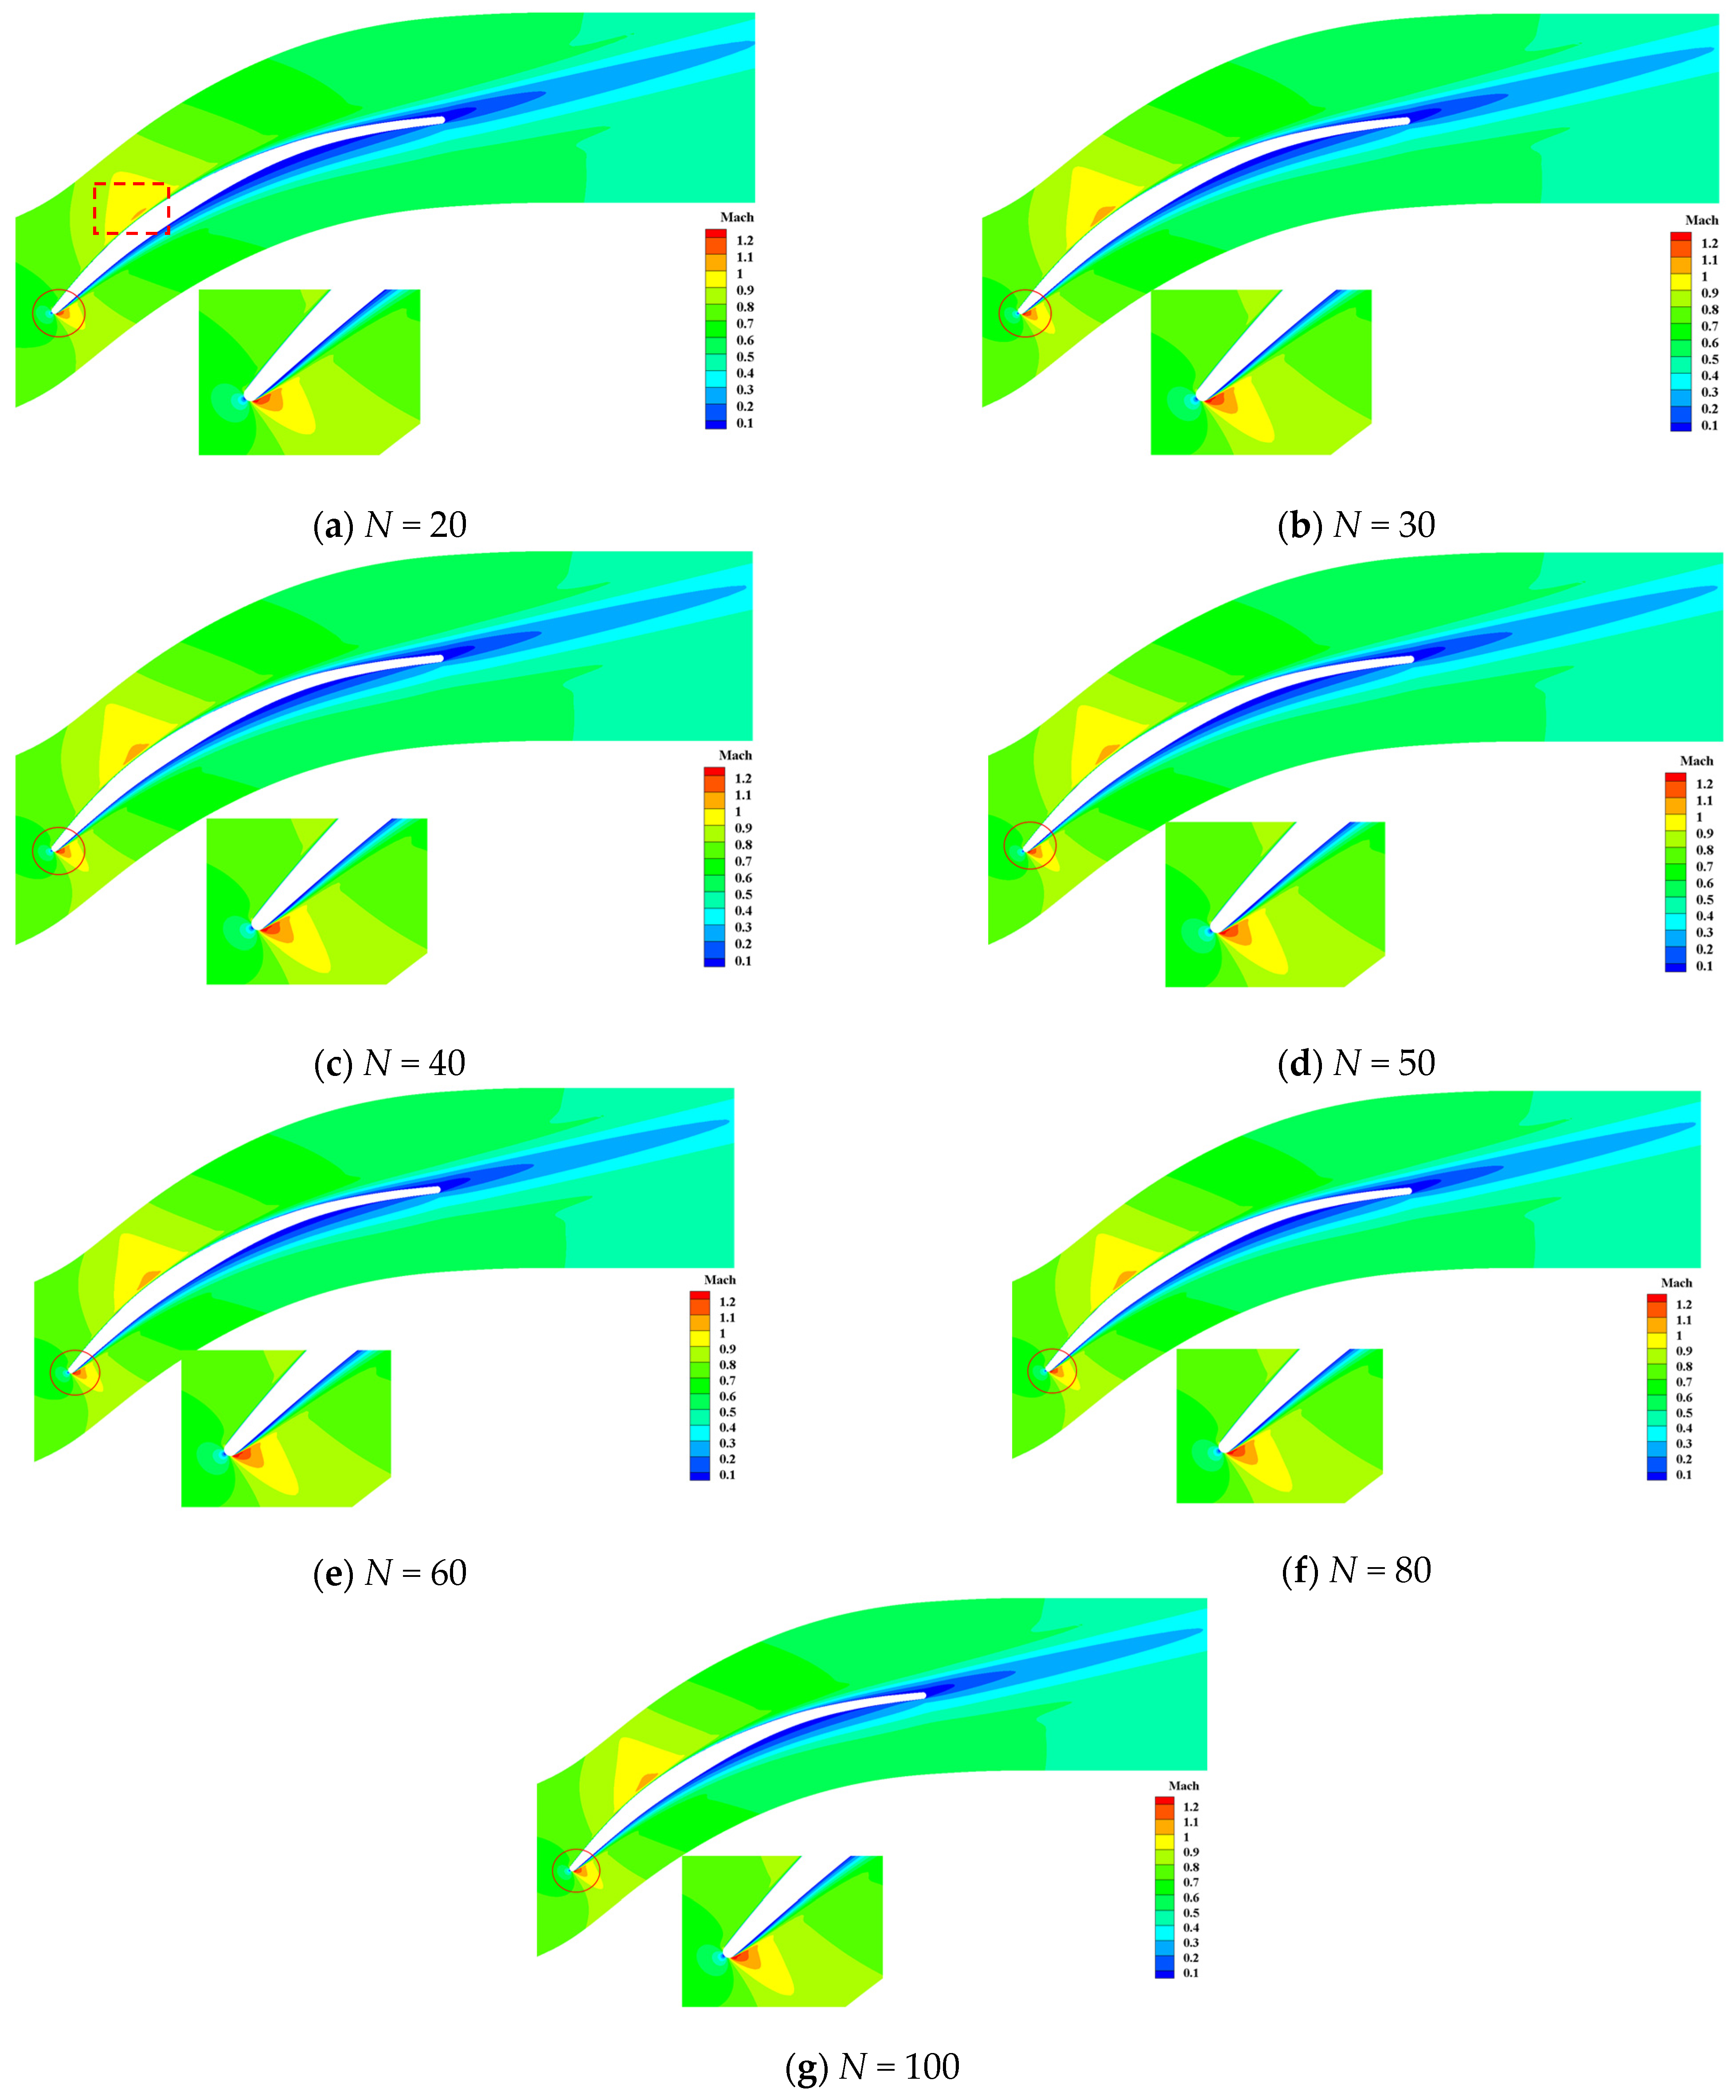
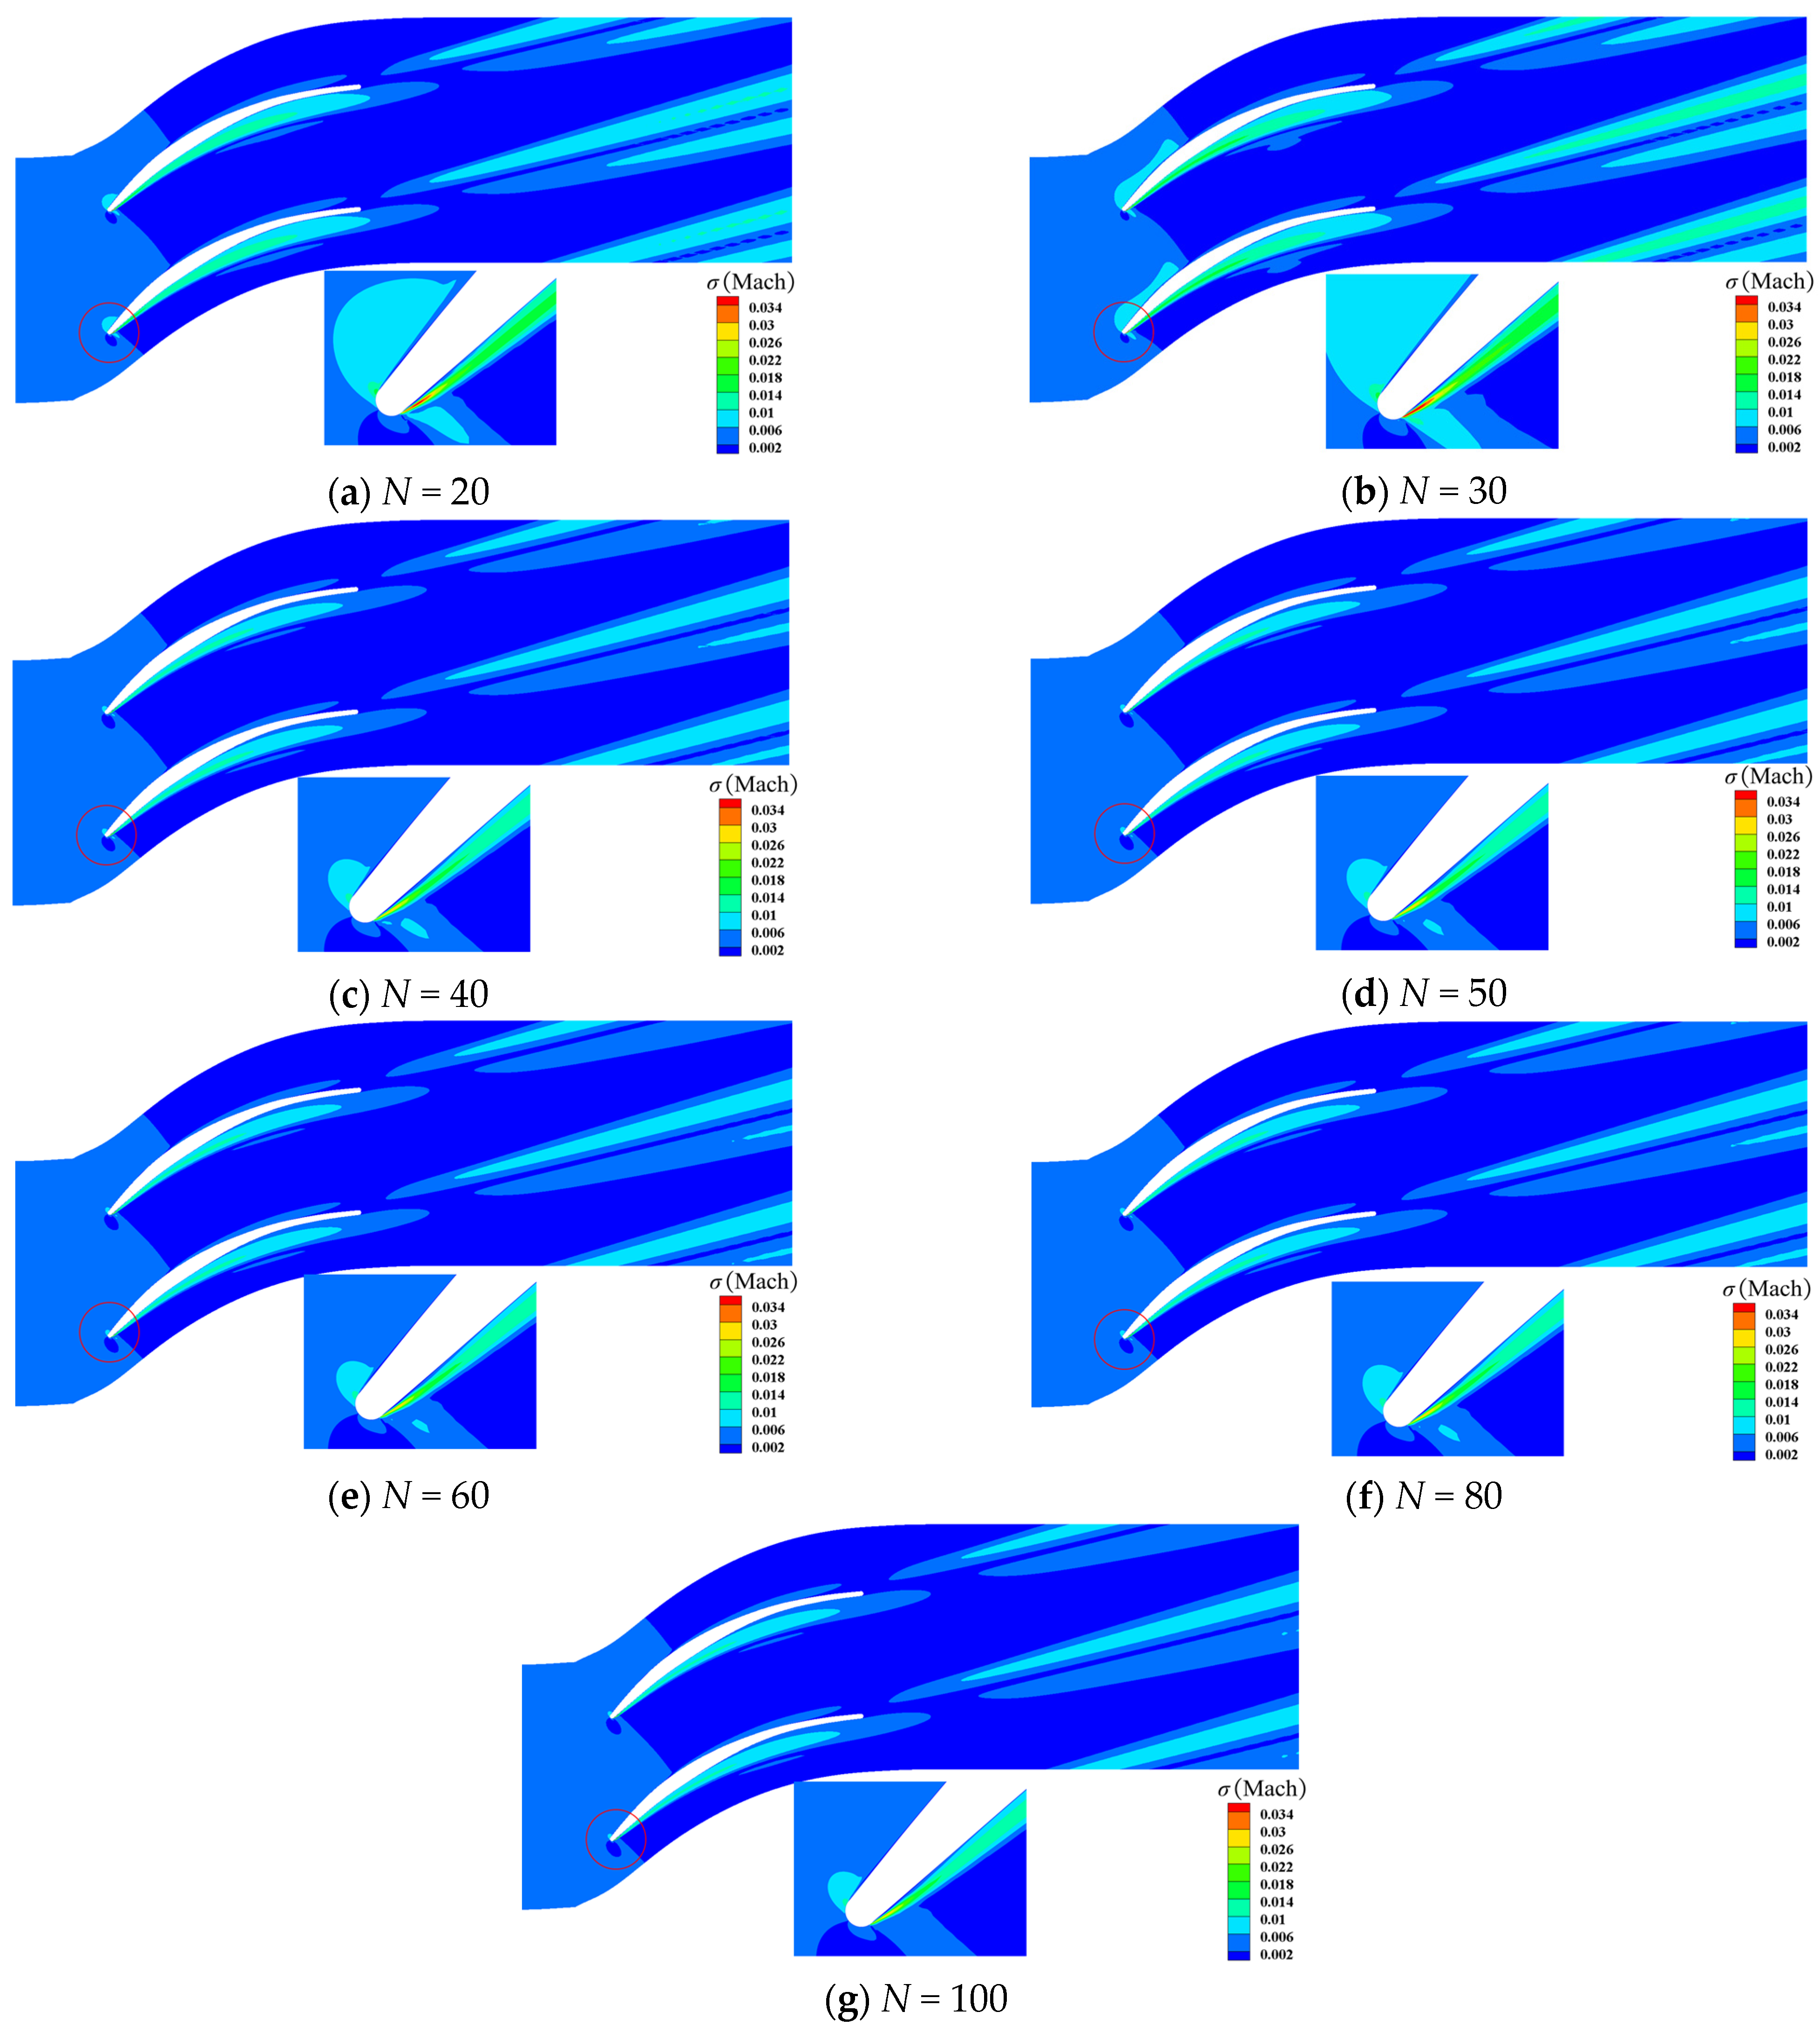
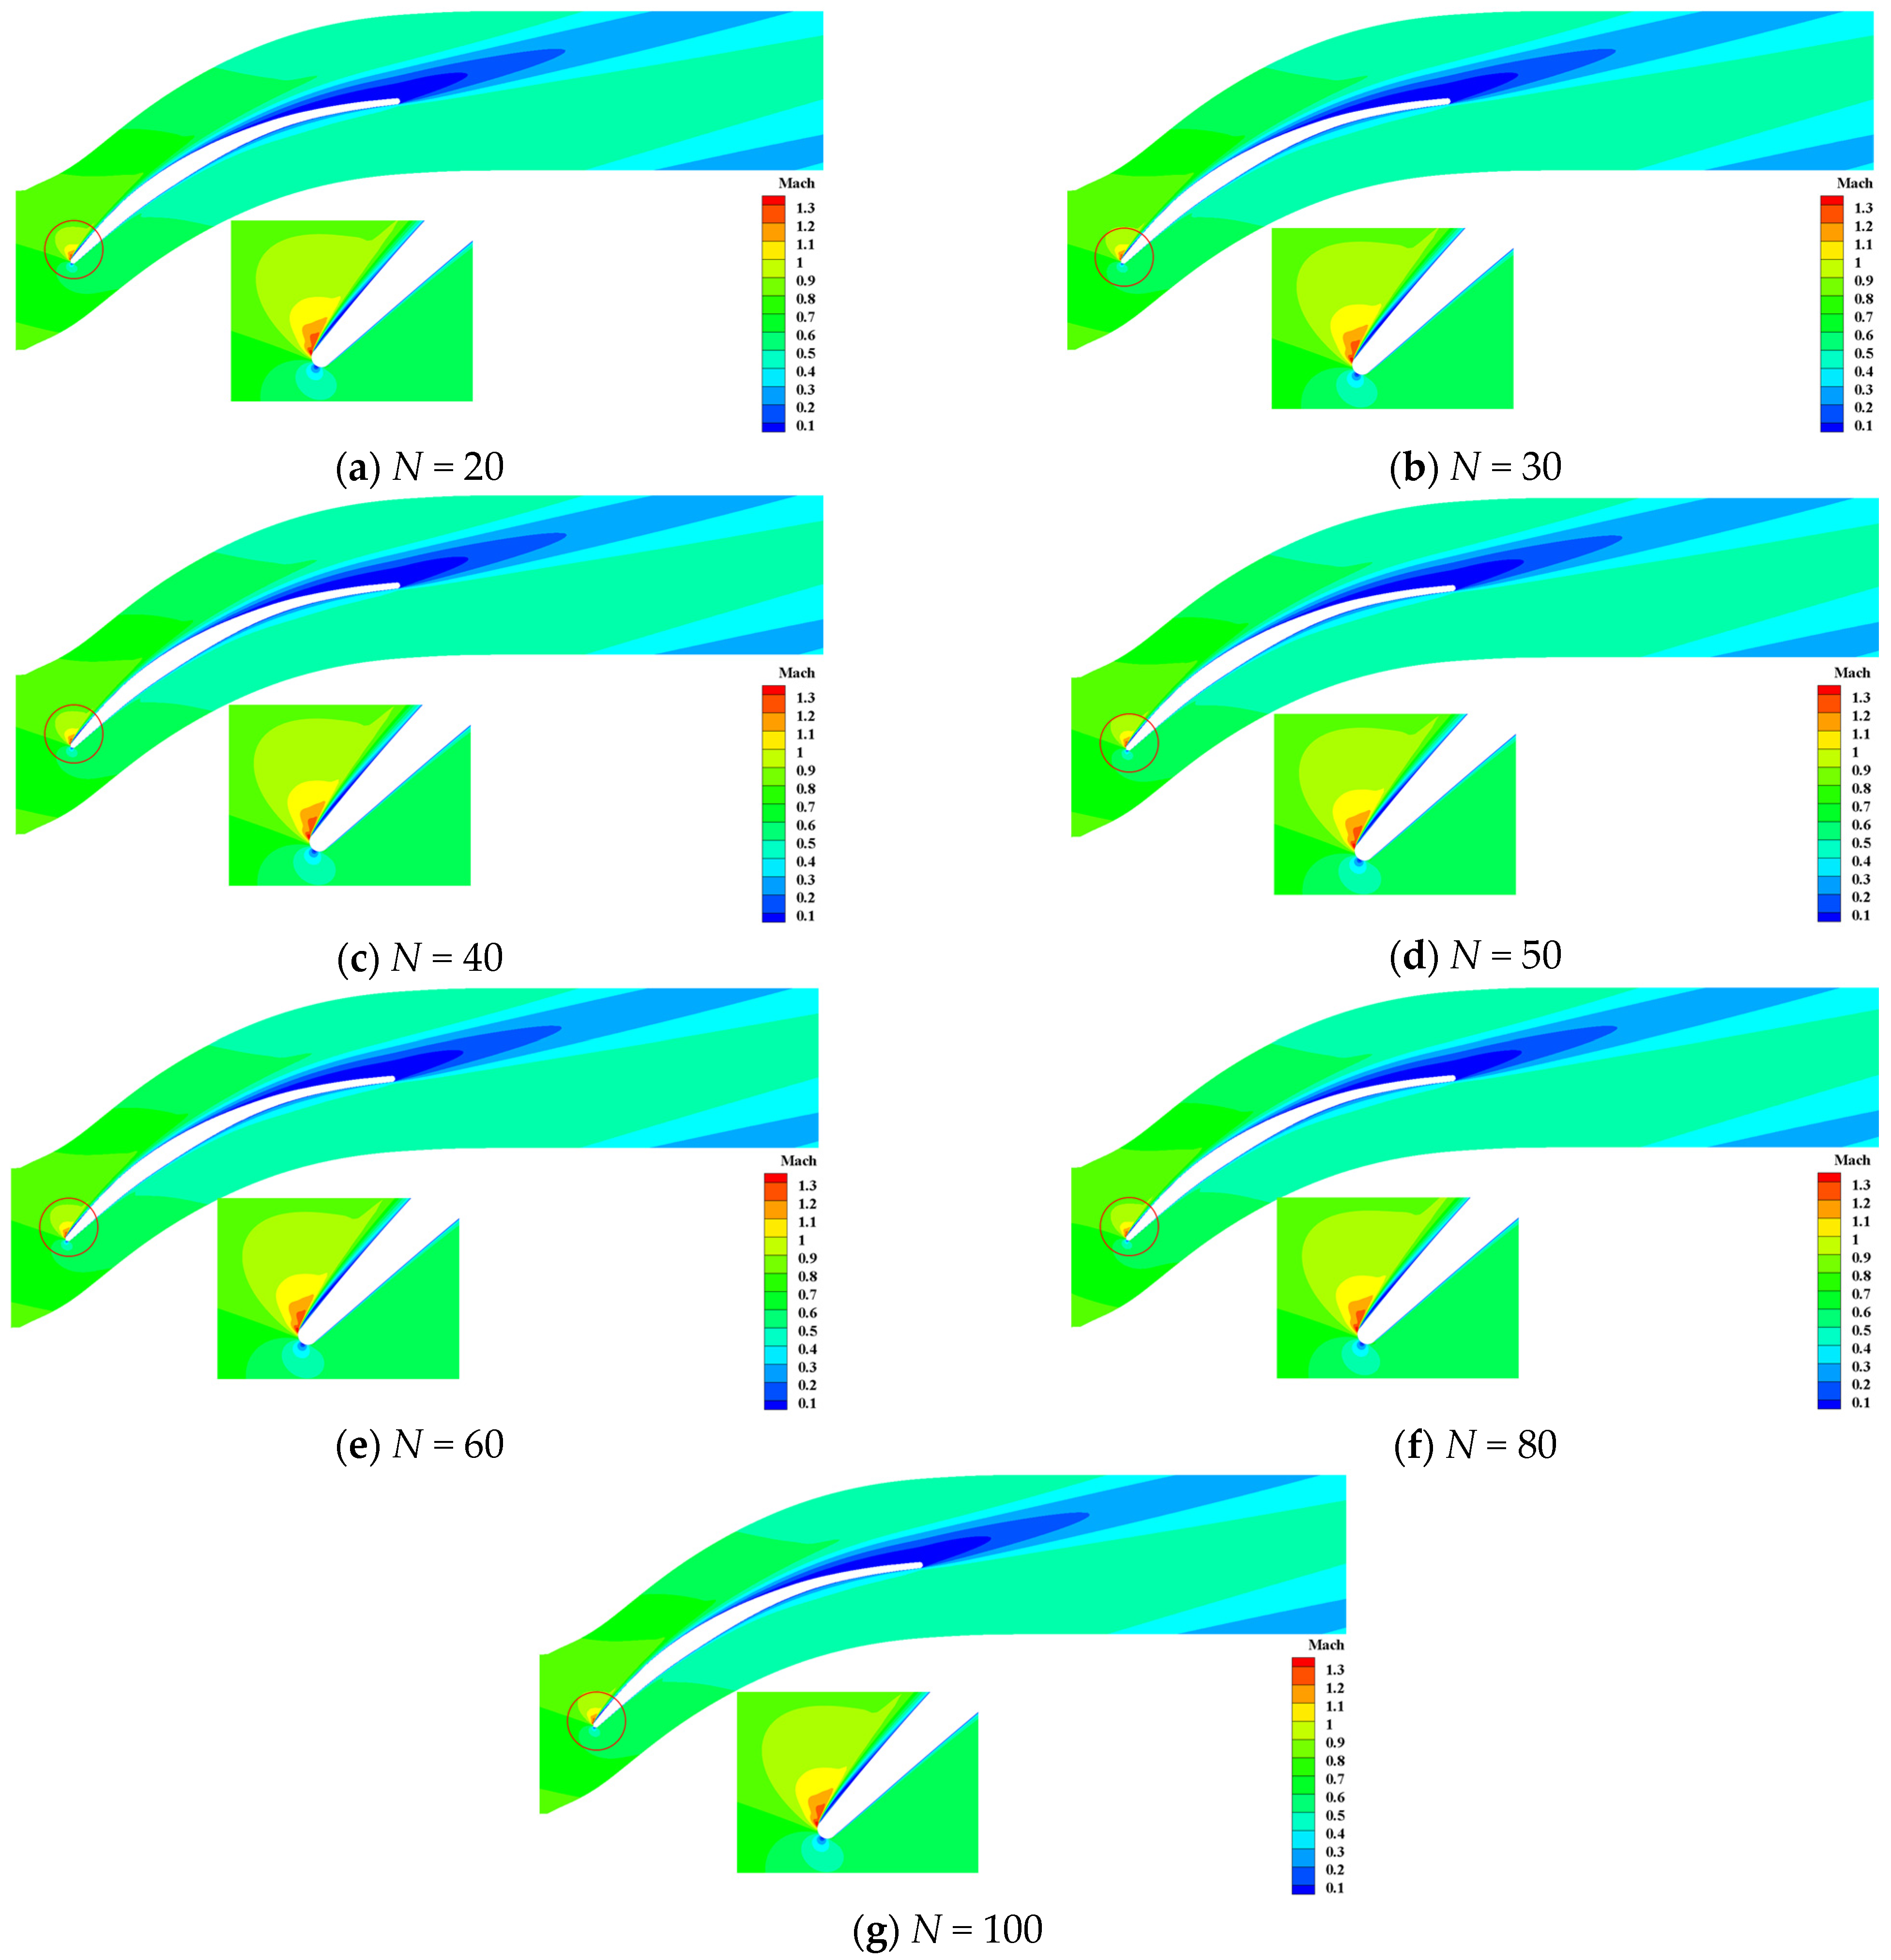
4.4. Aerodynamic UQ Results: Mach Contour

In this section, we consider the influence of sample sizes of stagger-angle errors on Mach contour at different incidence conditions. At the incidence i = −0.5° condition, the contour of μ M a c h is shown in Figure 21. We could observe that the trends of μ M a c h calculated by the PDDPC method are broadly consistent when the sample size N is greater than 20. For the contour of σ M a c h , it can be clearly found from Figure 22 that the flow fields calculated by the sample sizes of 20 and 30 are quite different from the convergent flow field. Figure 23 and Figure 24 display the contour of μ M a c h and σ M a c h at the design incidence condition. As shown in Figure 23, it can be seen that the contours of μ M a c h calculated by the sample sizes of 20 and 30 differ from the convergent results (see the acceleration area dotted by the rectangular dotted line). As can be seen from Figure 24, the contour of σ M a c h basically reaches the convergence state as the sample size exceeds 40. Figure 25 and Figure 26 display the contour of μ M a c h and σ M a c h at the incidence i = 7° condition. The contour of μ M a c h is less sensitive to sample size of stagger-angle errors. From Figure 26, it can be revealed that when sample size reaches 40, the contour of σ M a c h has been consistent with those of larger sample sizes. Table 5 gives the critical sample sizes of Mach at various incidence conditions. Based on these results, the blade designers can make reasonable choices about the sample sizes of manufactured blades in the uncertainty analysis stage, thus accelerating the UQ cycle and reducing costs.

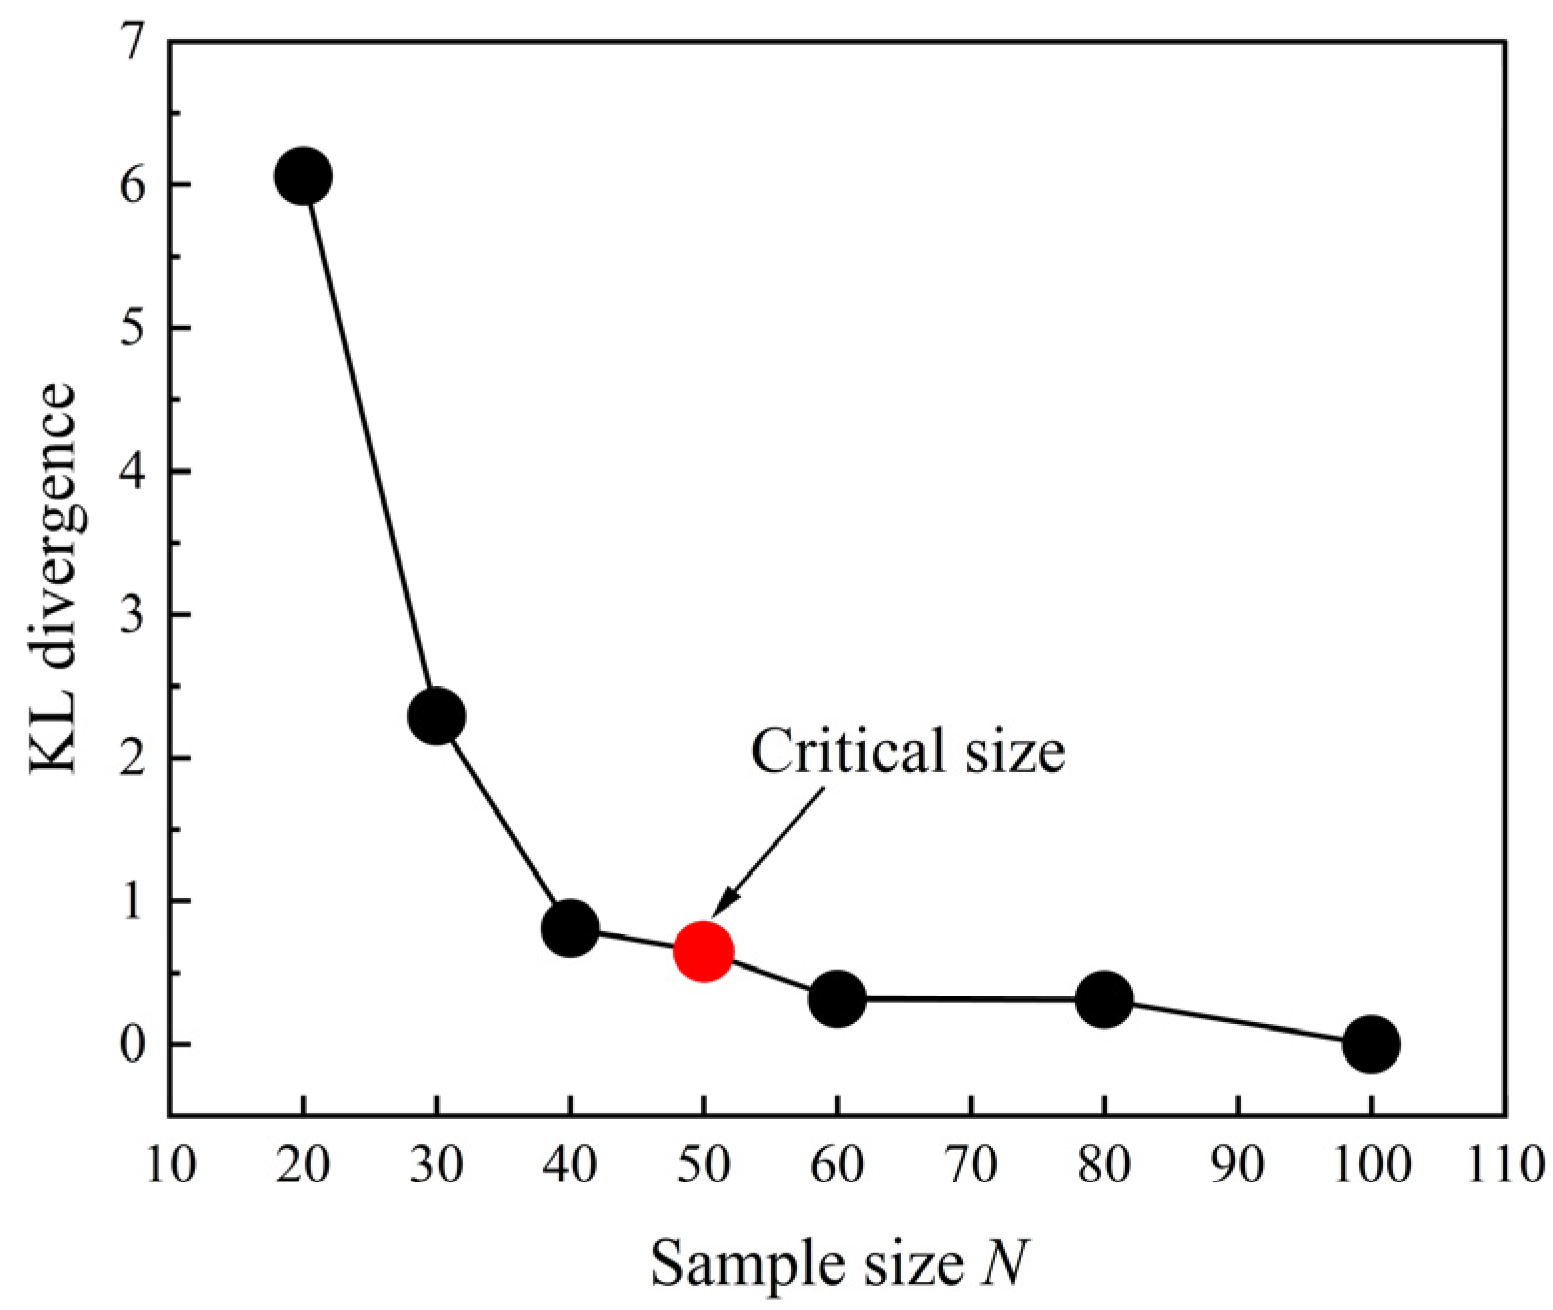
4.5. Kullback–Leibler Divergence Analysis

As the sample size of the measured data decreases beyond the critical size, the PDDPC method is unable to accurately propagate the uncertainty, even with high order accuracy. In fact, different sample sizes contain different propensities of probability information. Here we use the Kullback–Leibler (KL) divergence [38] to quantify the difference in probability information between 100 elements of sampled data (initial dataset) and other sample sizes (N = 20, 30, 40, 50, 60, and 80) of stagger-angle error data. These measured data have been shown in Section 4.1.
Given two sets of sampled data: X = ξ ( i ) i = 1 N h 1 and Y = ξ ( j ) j = 1 N h 2 , the sampled data is divided into H groups. The probability that the sampled data fall within each group is p = p ( X ) and q = q ( Y ) , respectively. The KL divergence can be computed by:
K L p | | q = i = 1 H p X l o g   p X l o g   q Y
As can be seen in Figure 27, when the two sets of measured data are the same, the KL result is 0, indicating that there is no difference in probability information. As the sample size decreases, the probability information loss increases. When the sample size is lower than 40, the probability information loss increases sharply. Although the KL results for sample sizes 40 and 50 are close, combined with our analysis of the convergence behavior of aerodynamic parameters at different operating conditions, a better convergence state can be achieved when the sample size reaches 50. Therefore, from a more conservative point of view, we choose 50 as the critical sample size in this work, considering uncertain stagger-angle errors.

5. Conclusions

(1)
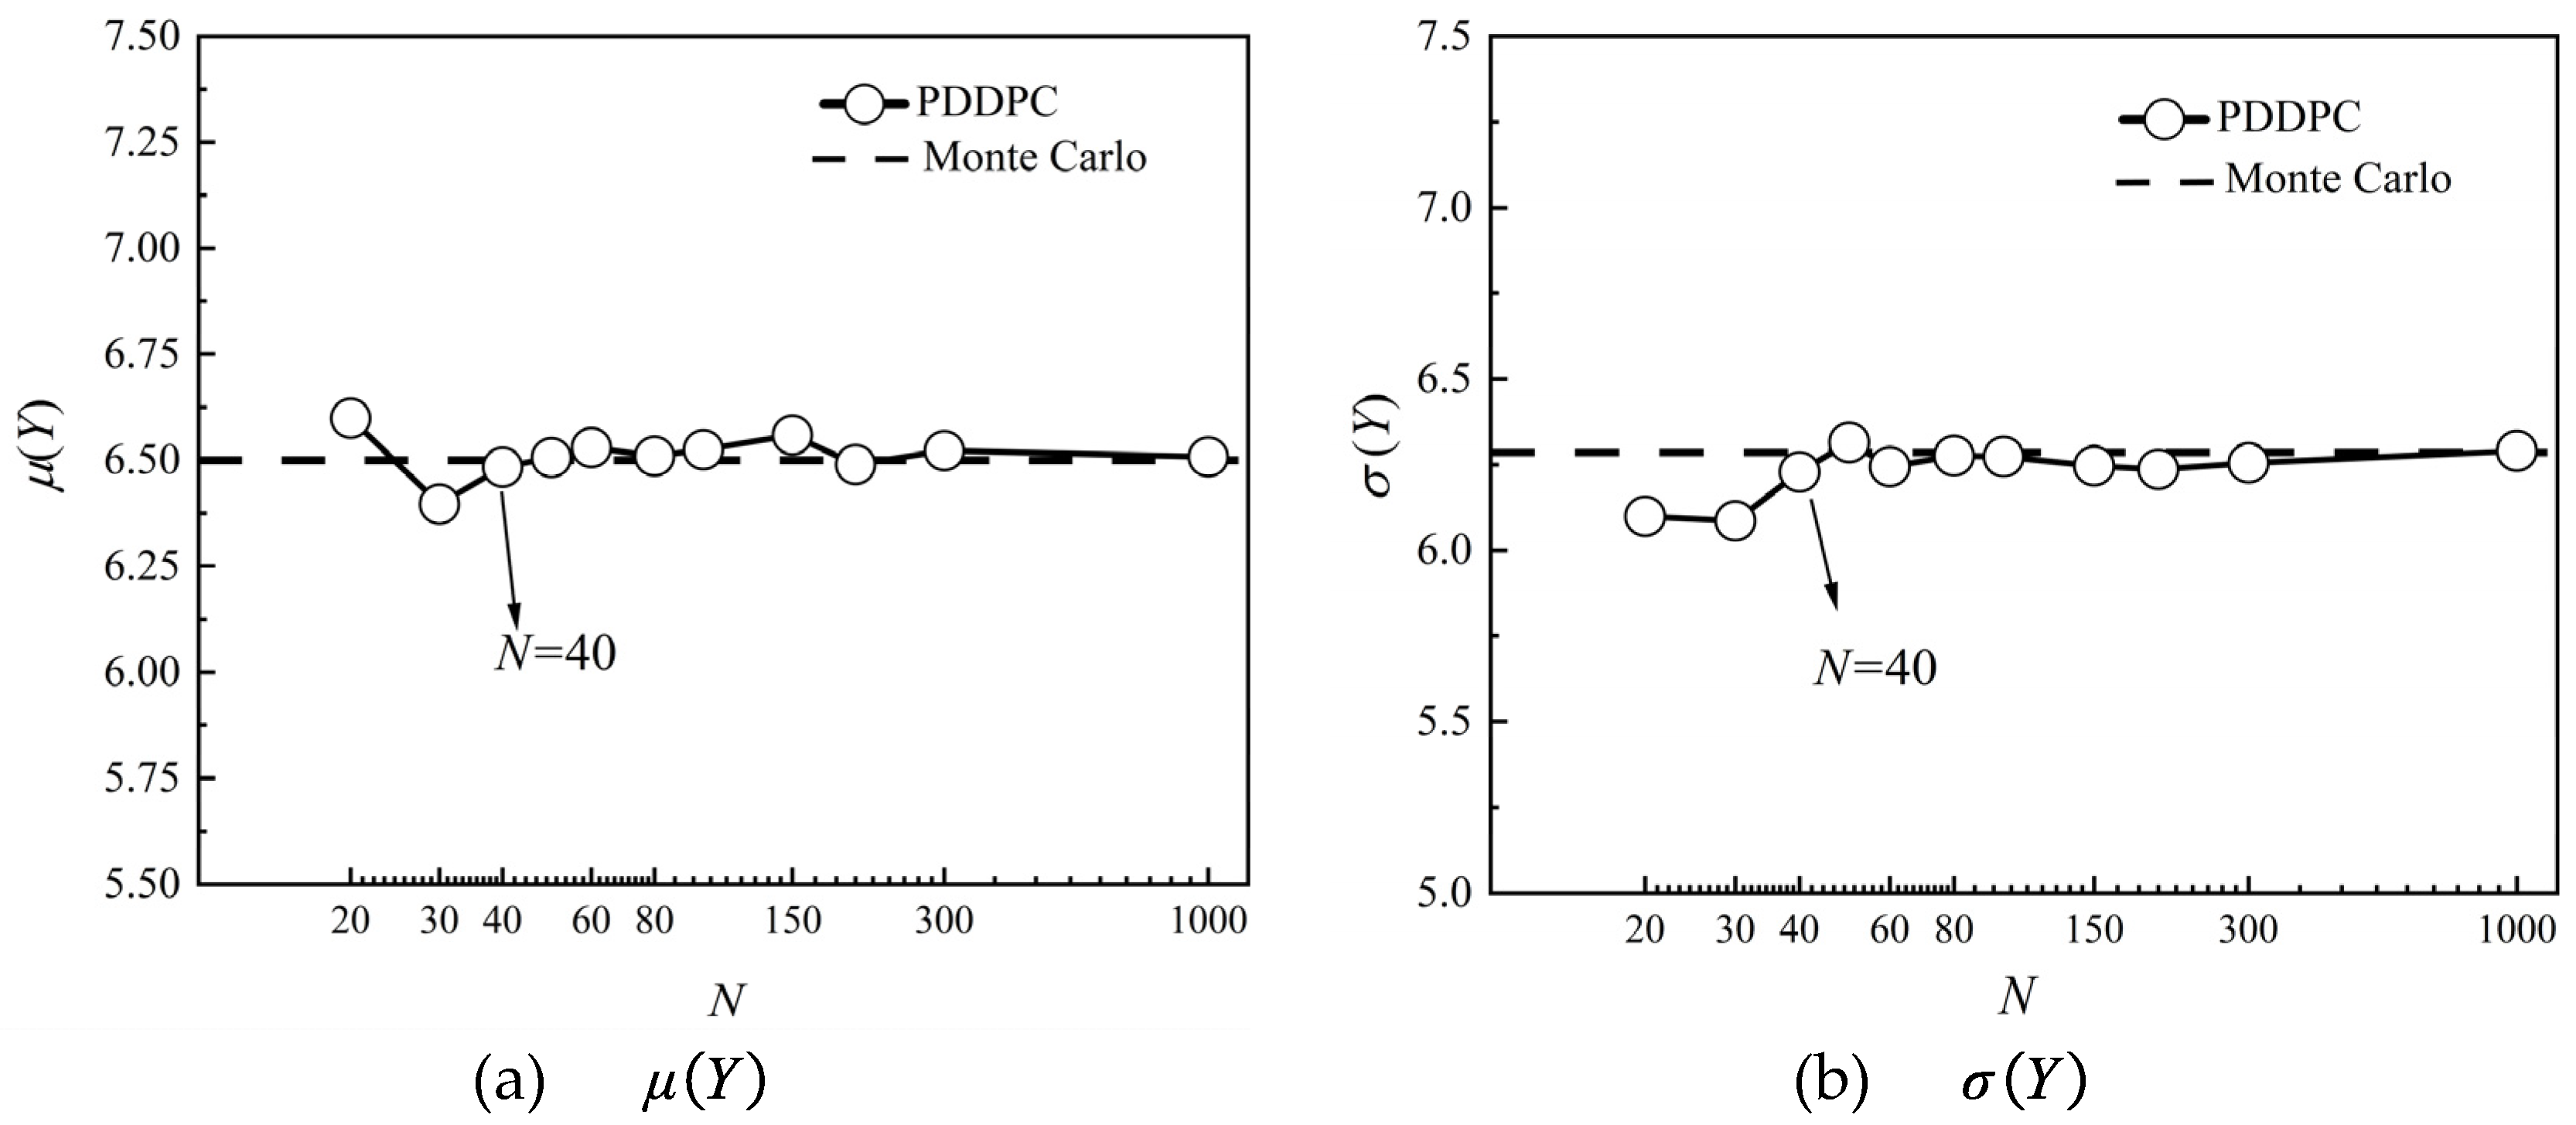
A UQ scheme dedicated to dealing with limited samples is proposed based on a preconditioner-based data-driven polynomial chaos (PDDPC) method. The influence of sample size on the calculation accuracy of PDDPC is investigated using a nonlinear test function. The results show that the calculation accuracy of the PDDPC method is dependent on the sample size of the input data. When the sample size N is greater than 40, the results of μ Y and σ Y of the test function gradually converge to the benchmark values calculated by the Monte Carlo method.
(2)
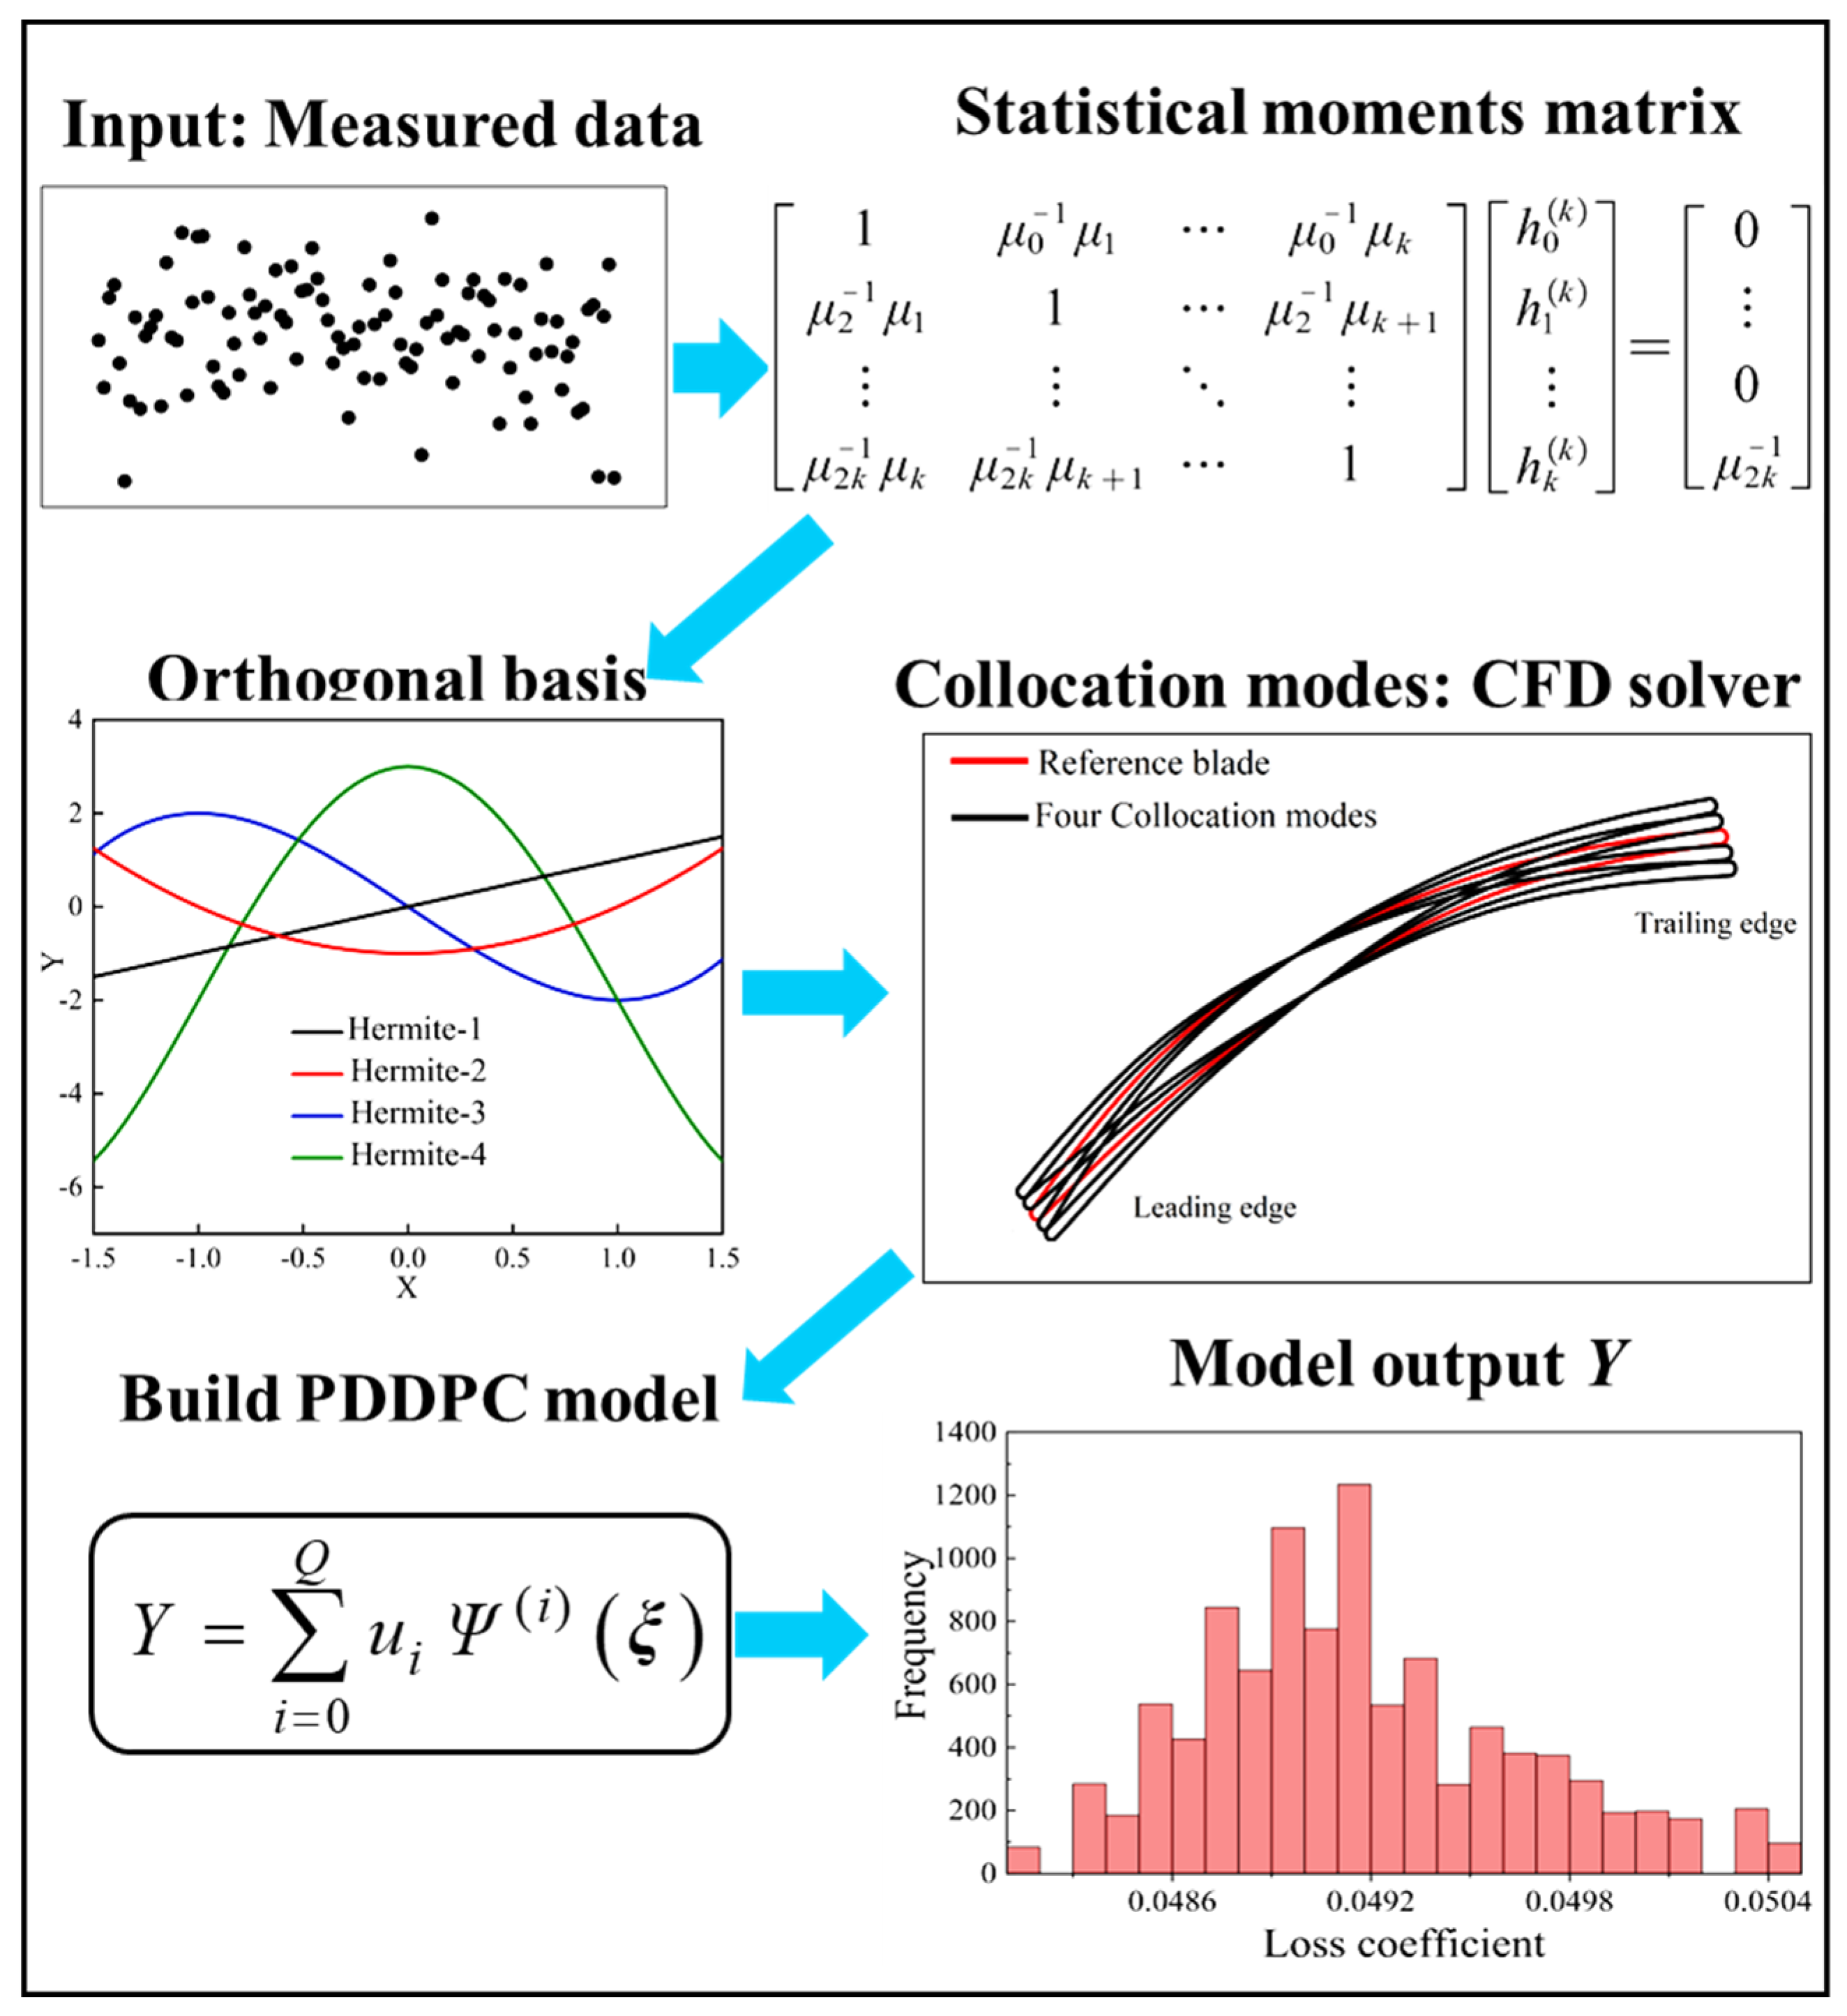
The measured data of stagger-angle errors are collected from a total of 100 middle sections of manufactured compressor blades. Taking the uncertain stagger-angle errors into consideration, we develop a framework for UQ analysis of compressor blades based on PDDPC combined with CFD solver. To demonstrate the functionality and effectiveness of the PDDPC method, the effects of the sample size of measured error data on multiple aerodynamic parameters, such as the total pressure loss coefficient, static pressure ratio, and isentropic Mach number, is explored under three operating conditions (blocking condition, design incidence condition and high incidence condition).
(3)
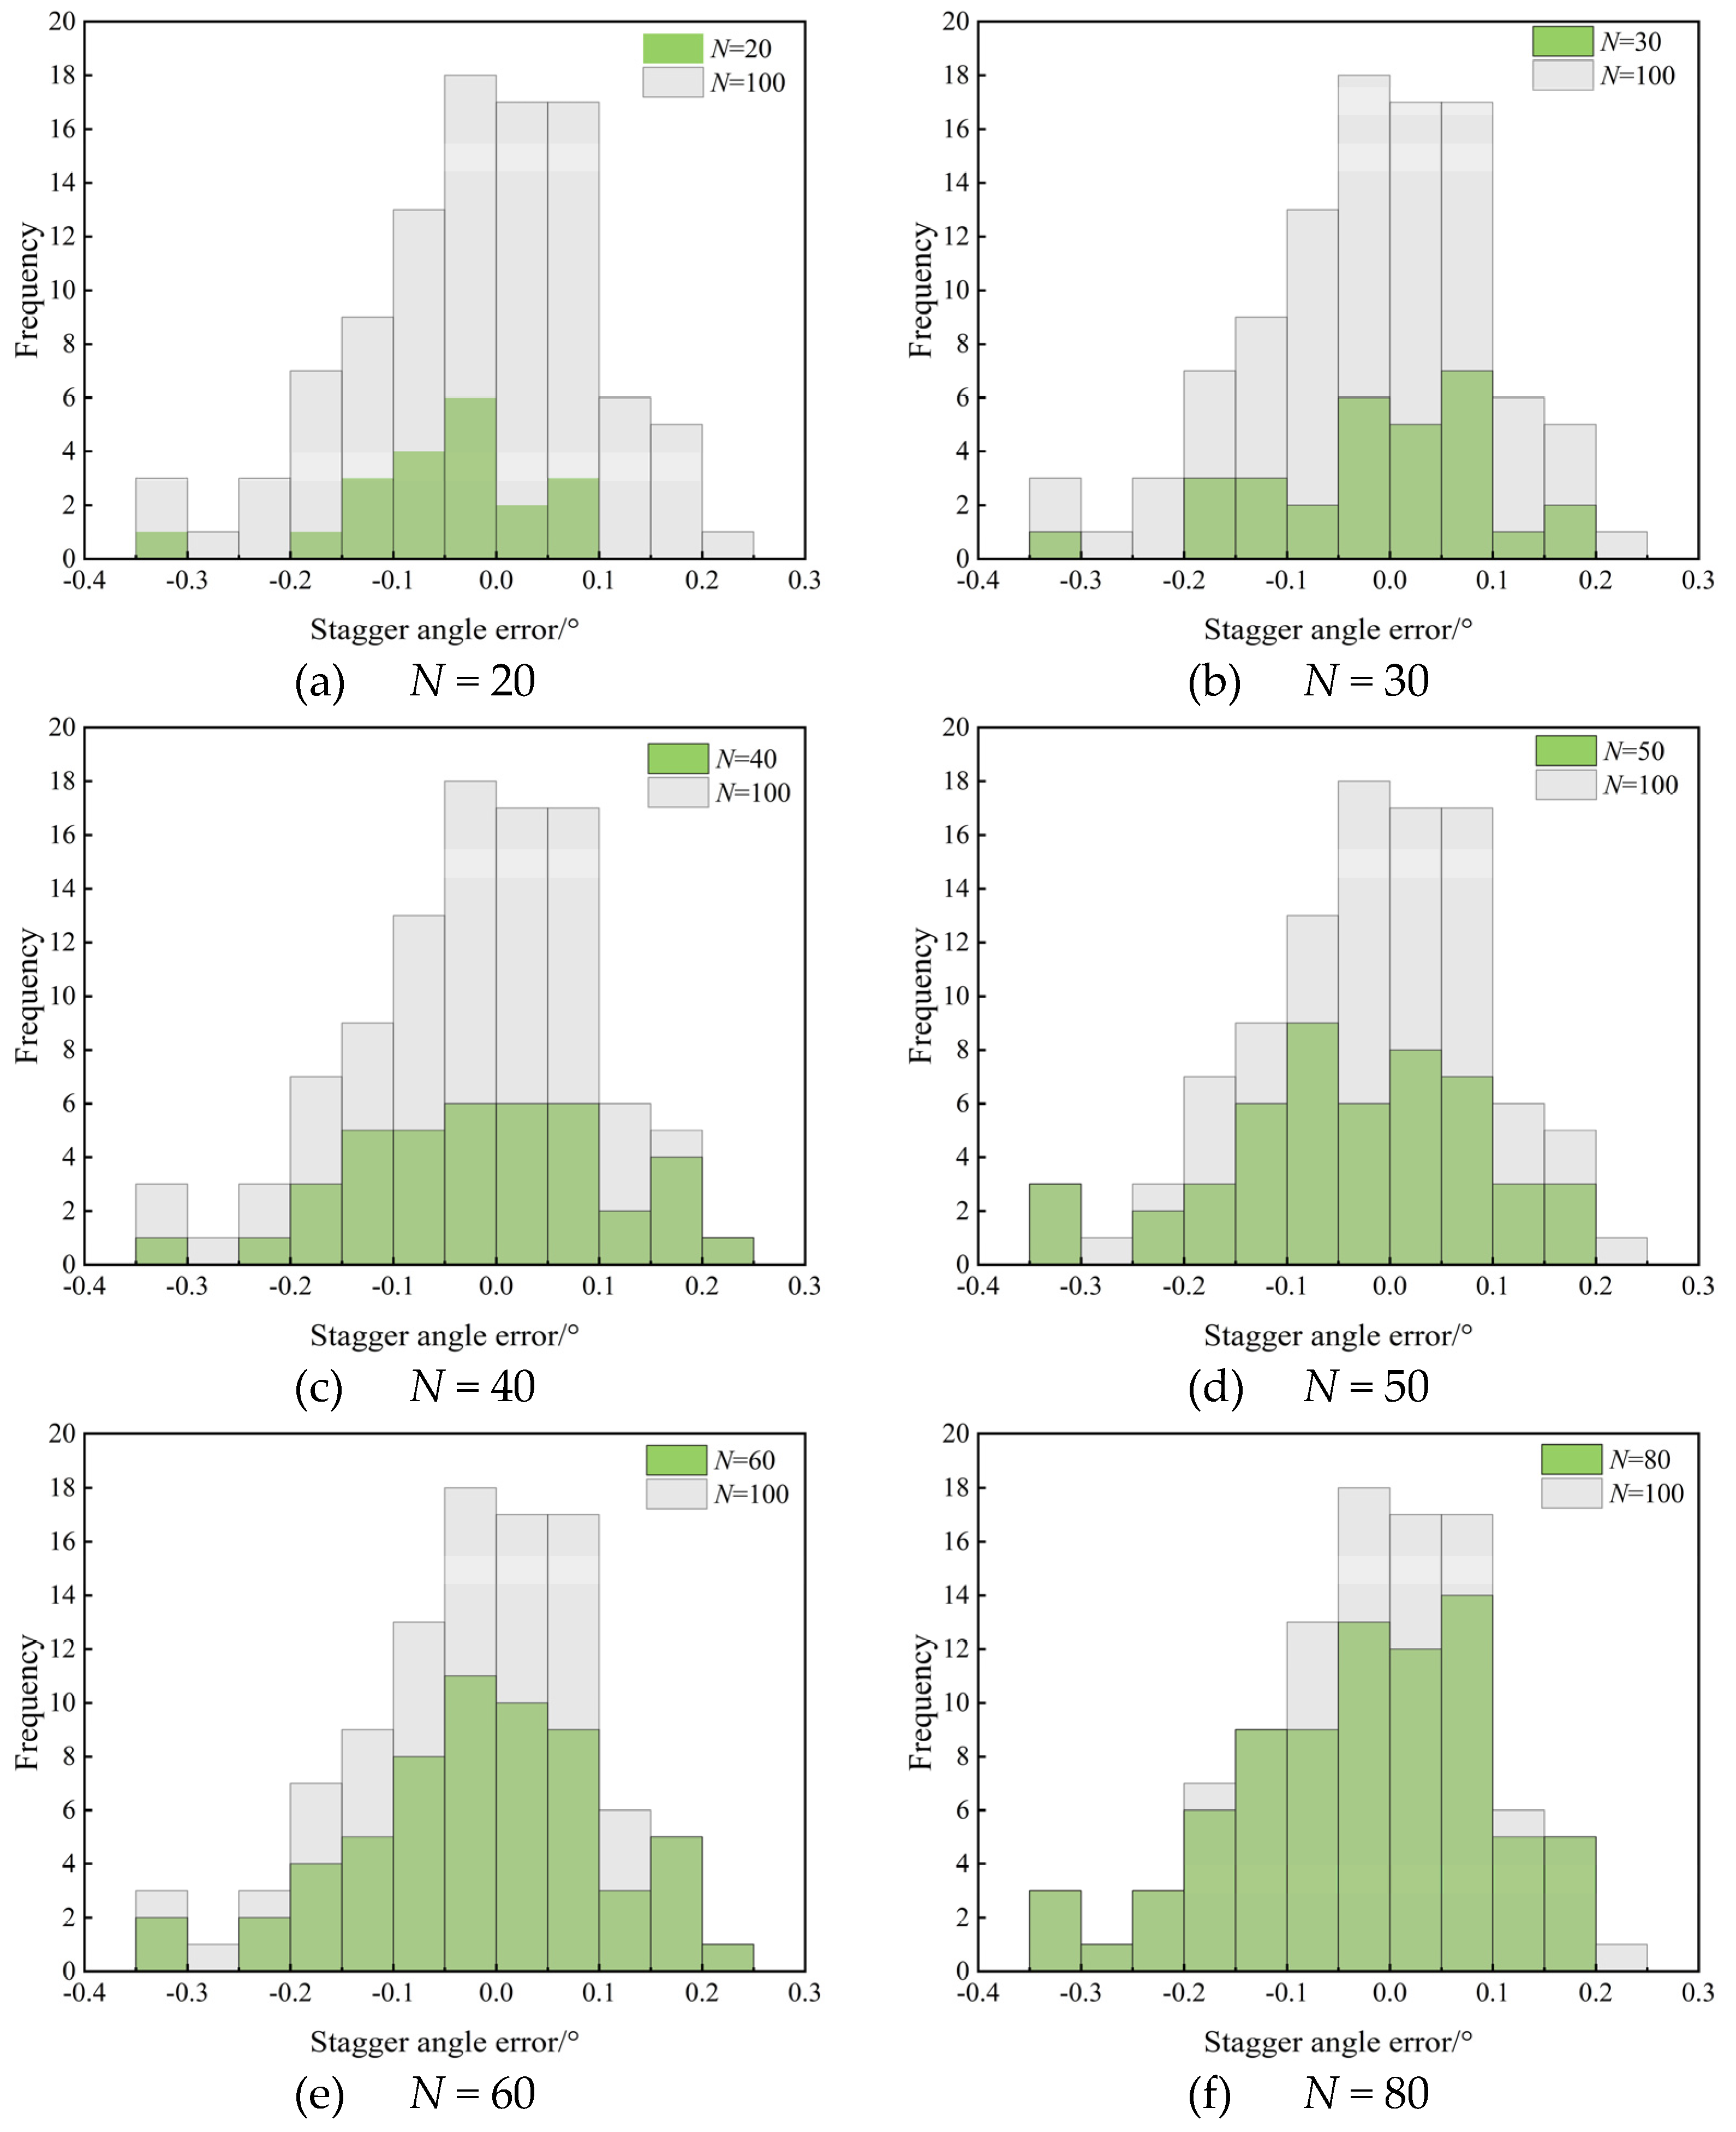
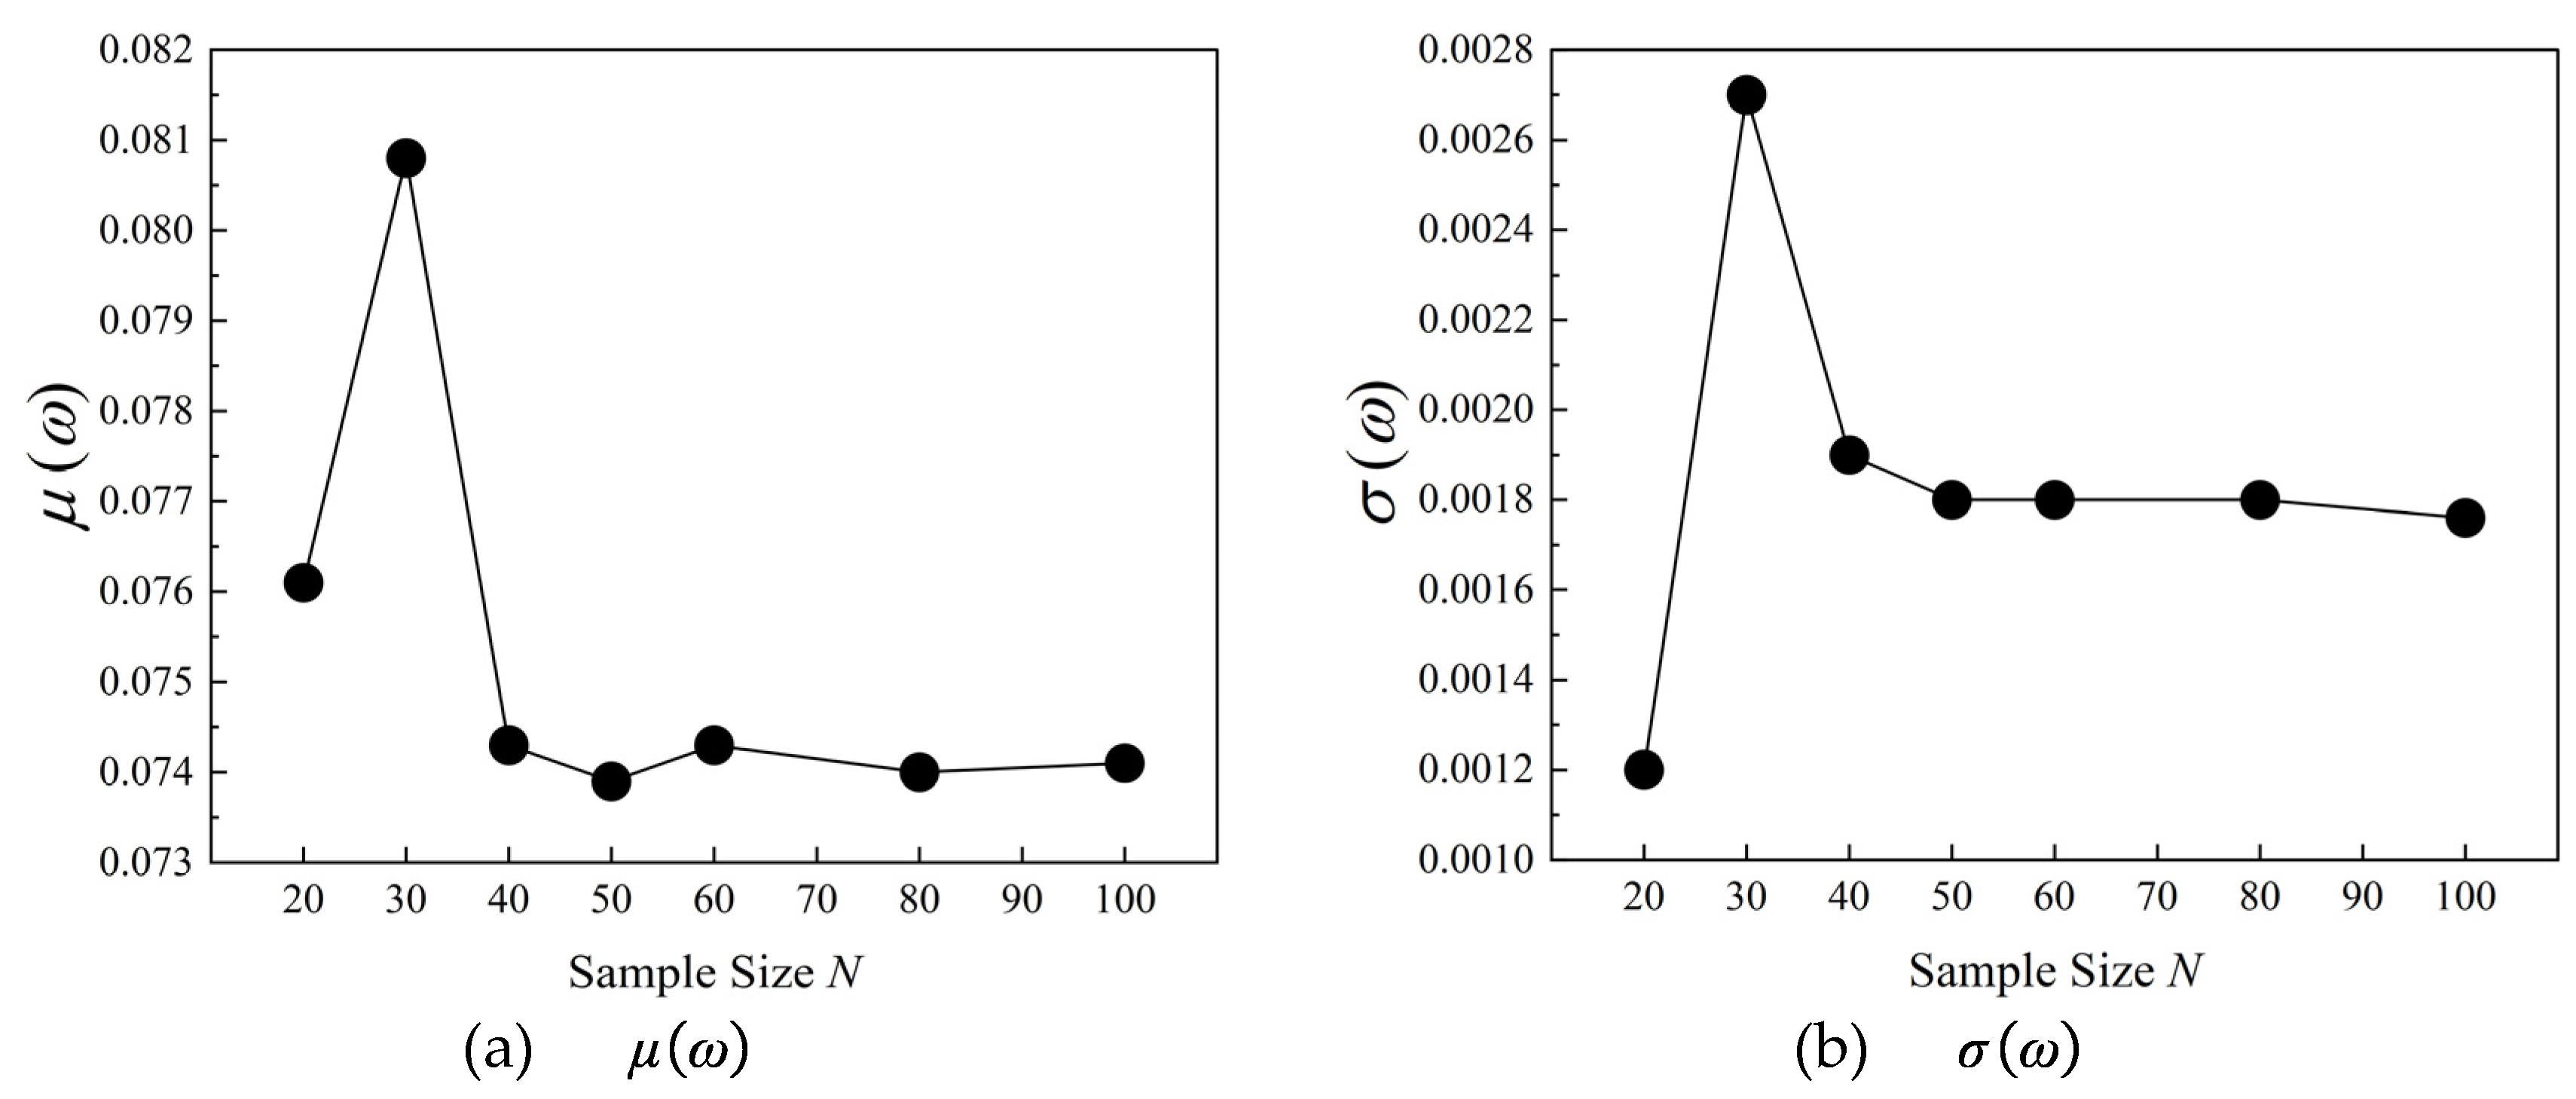
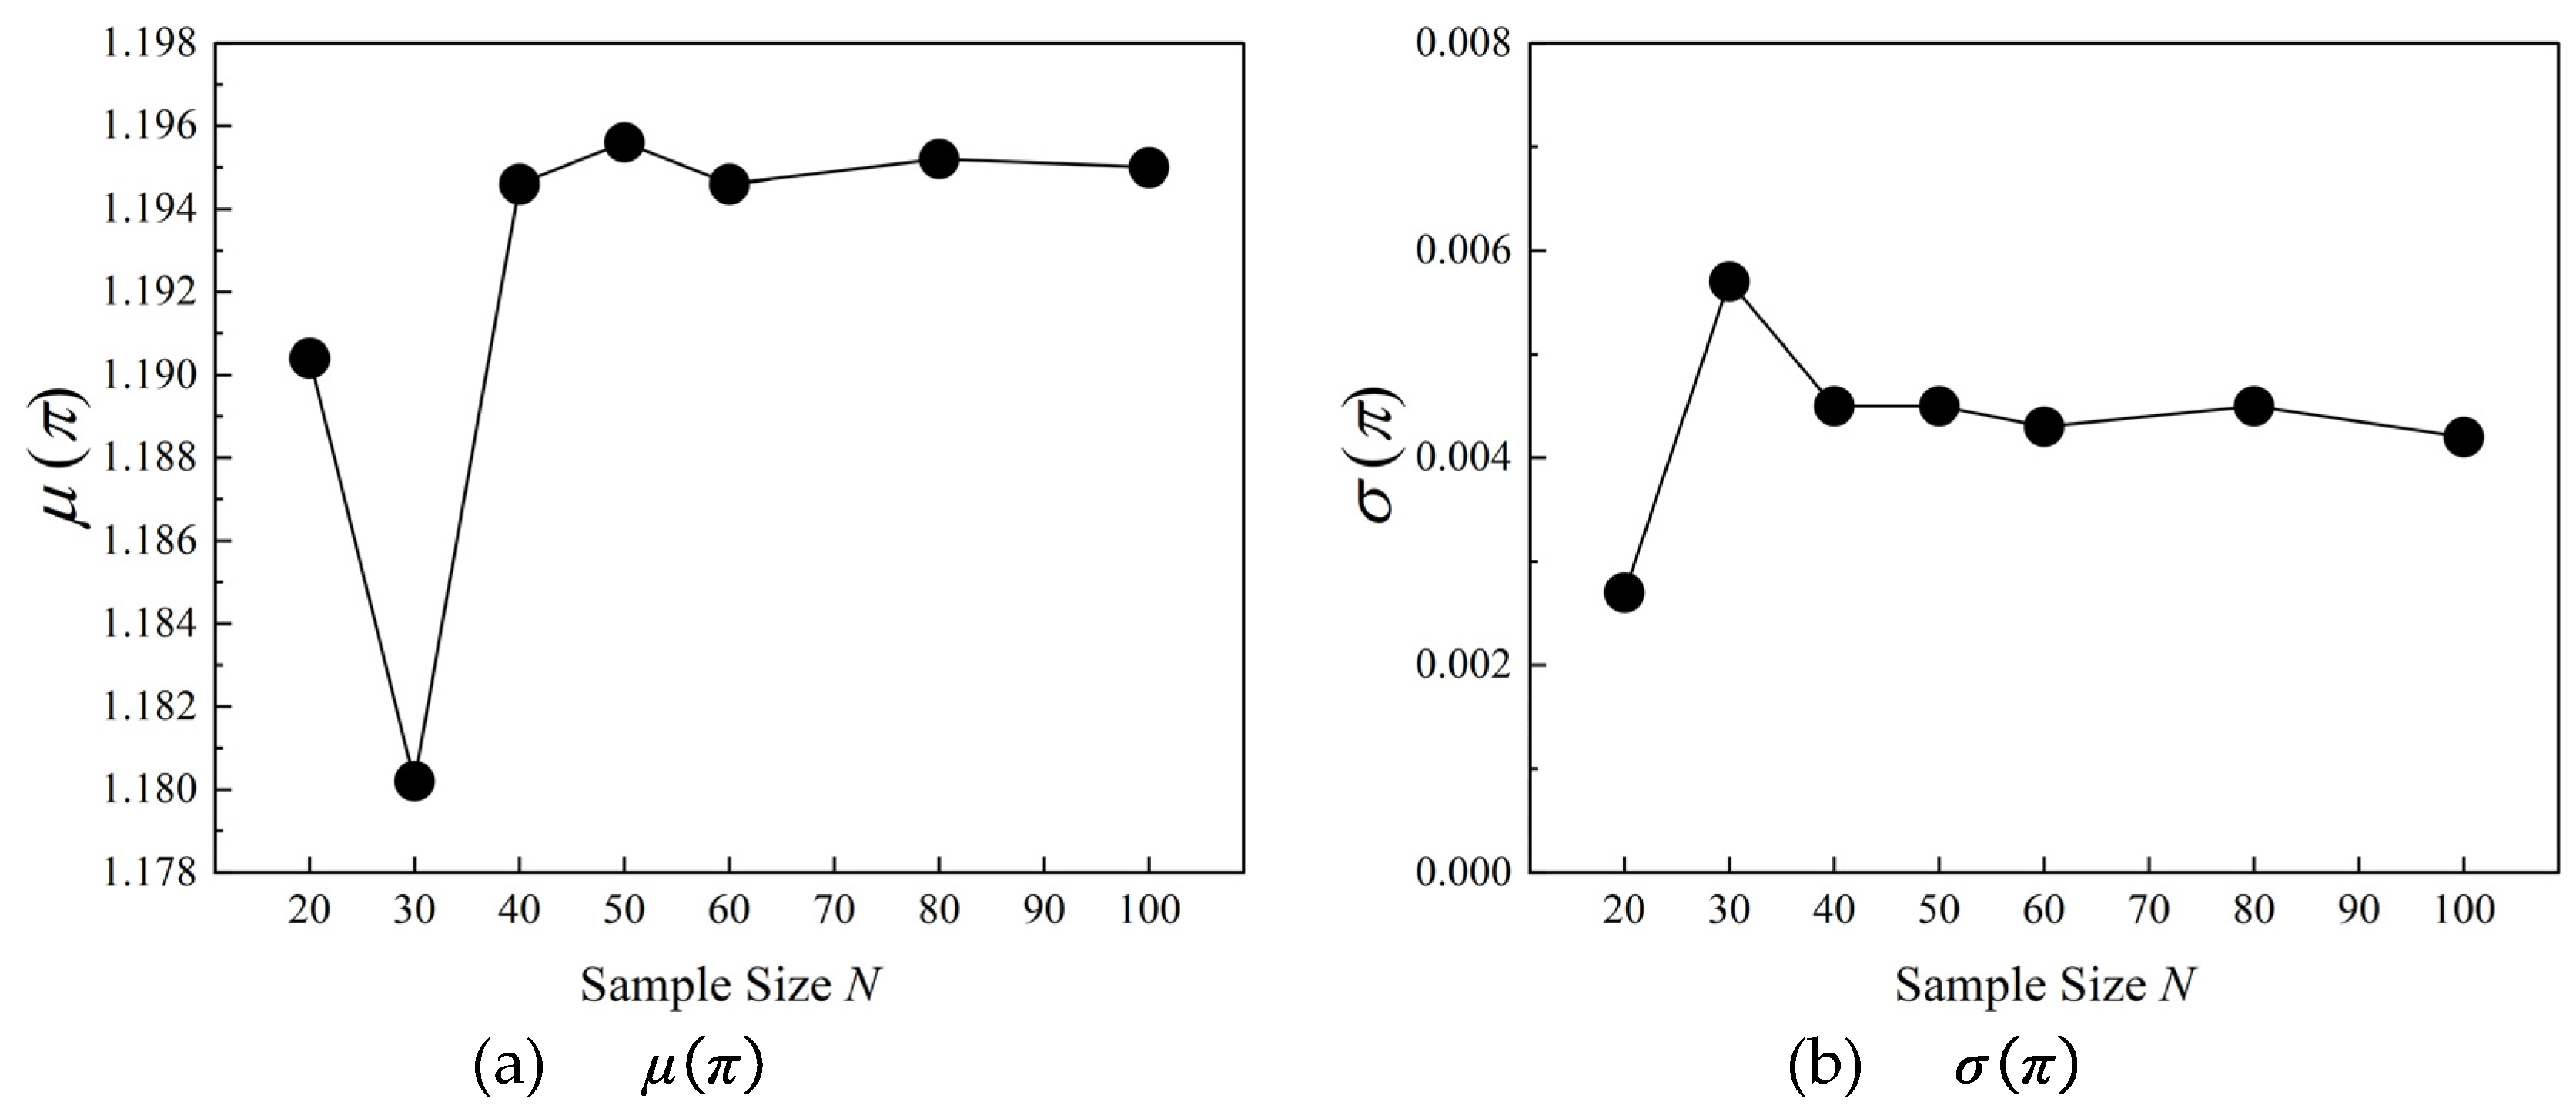
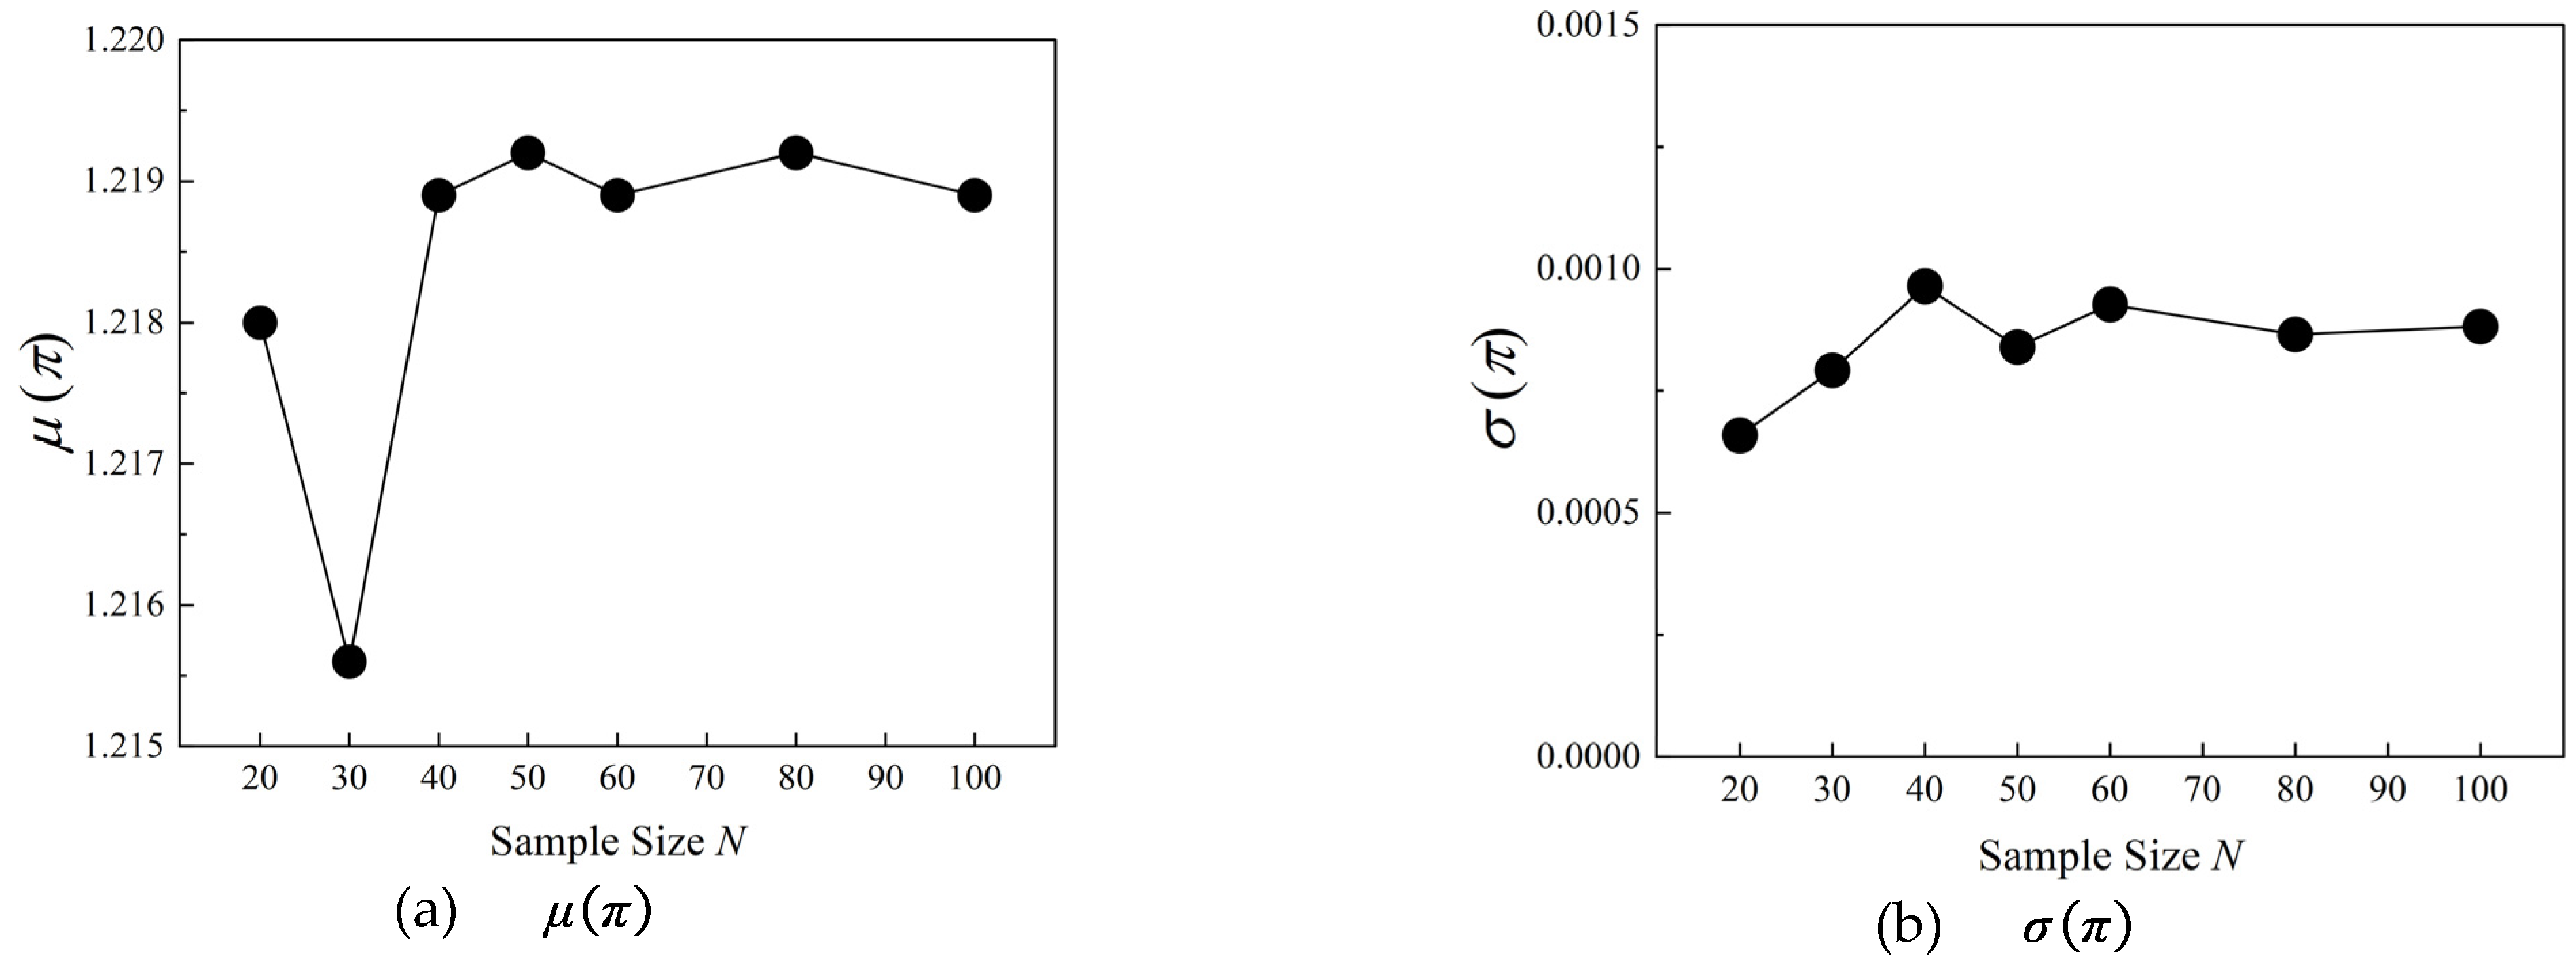
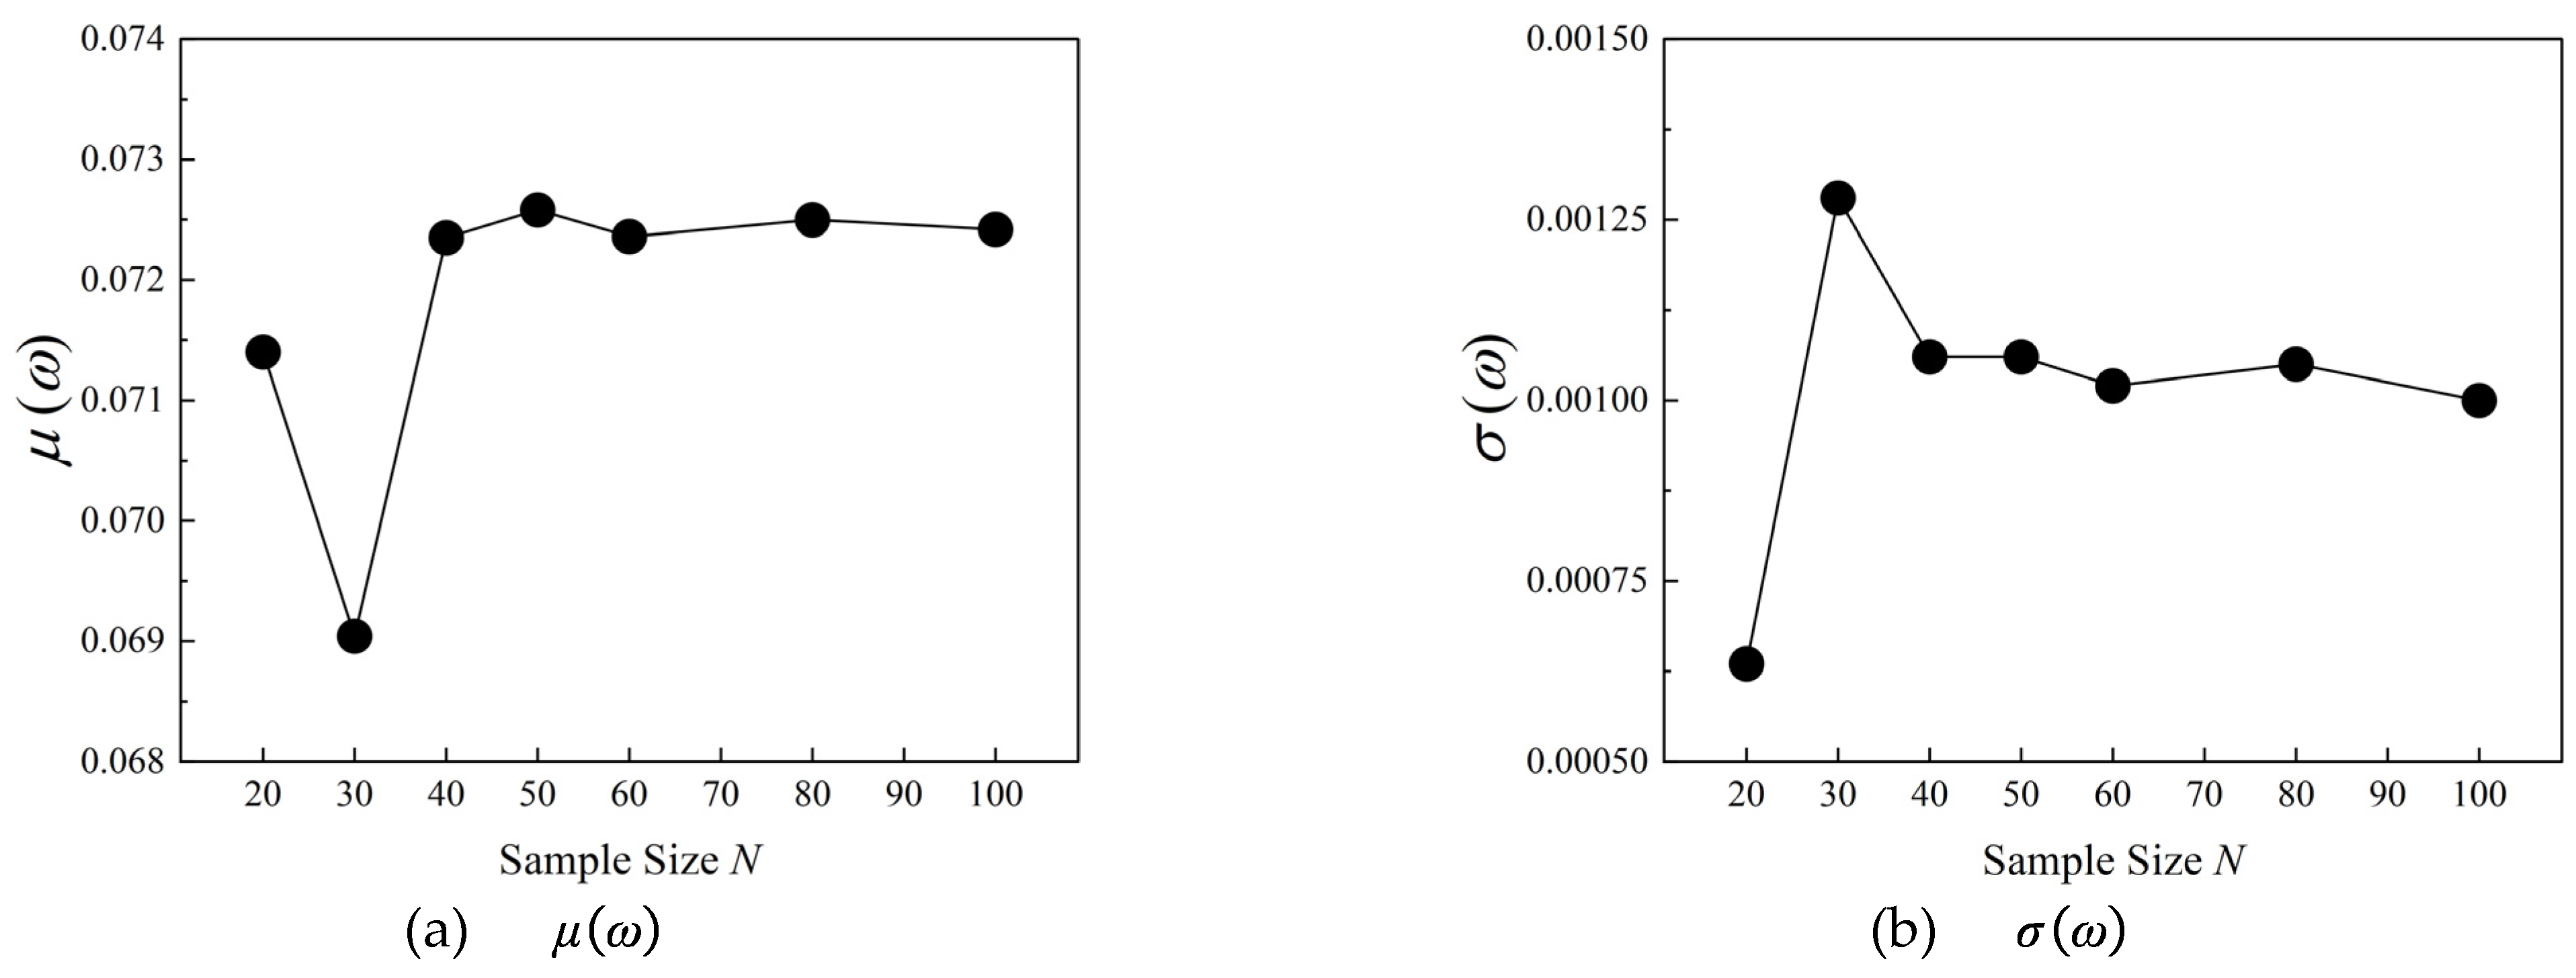
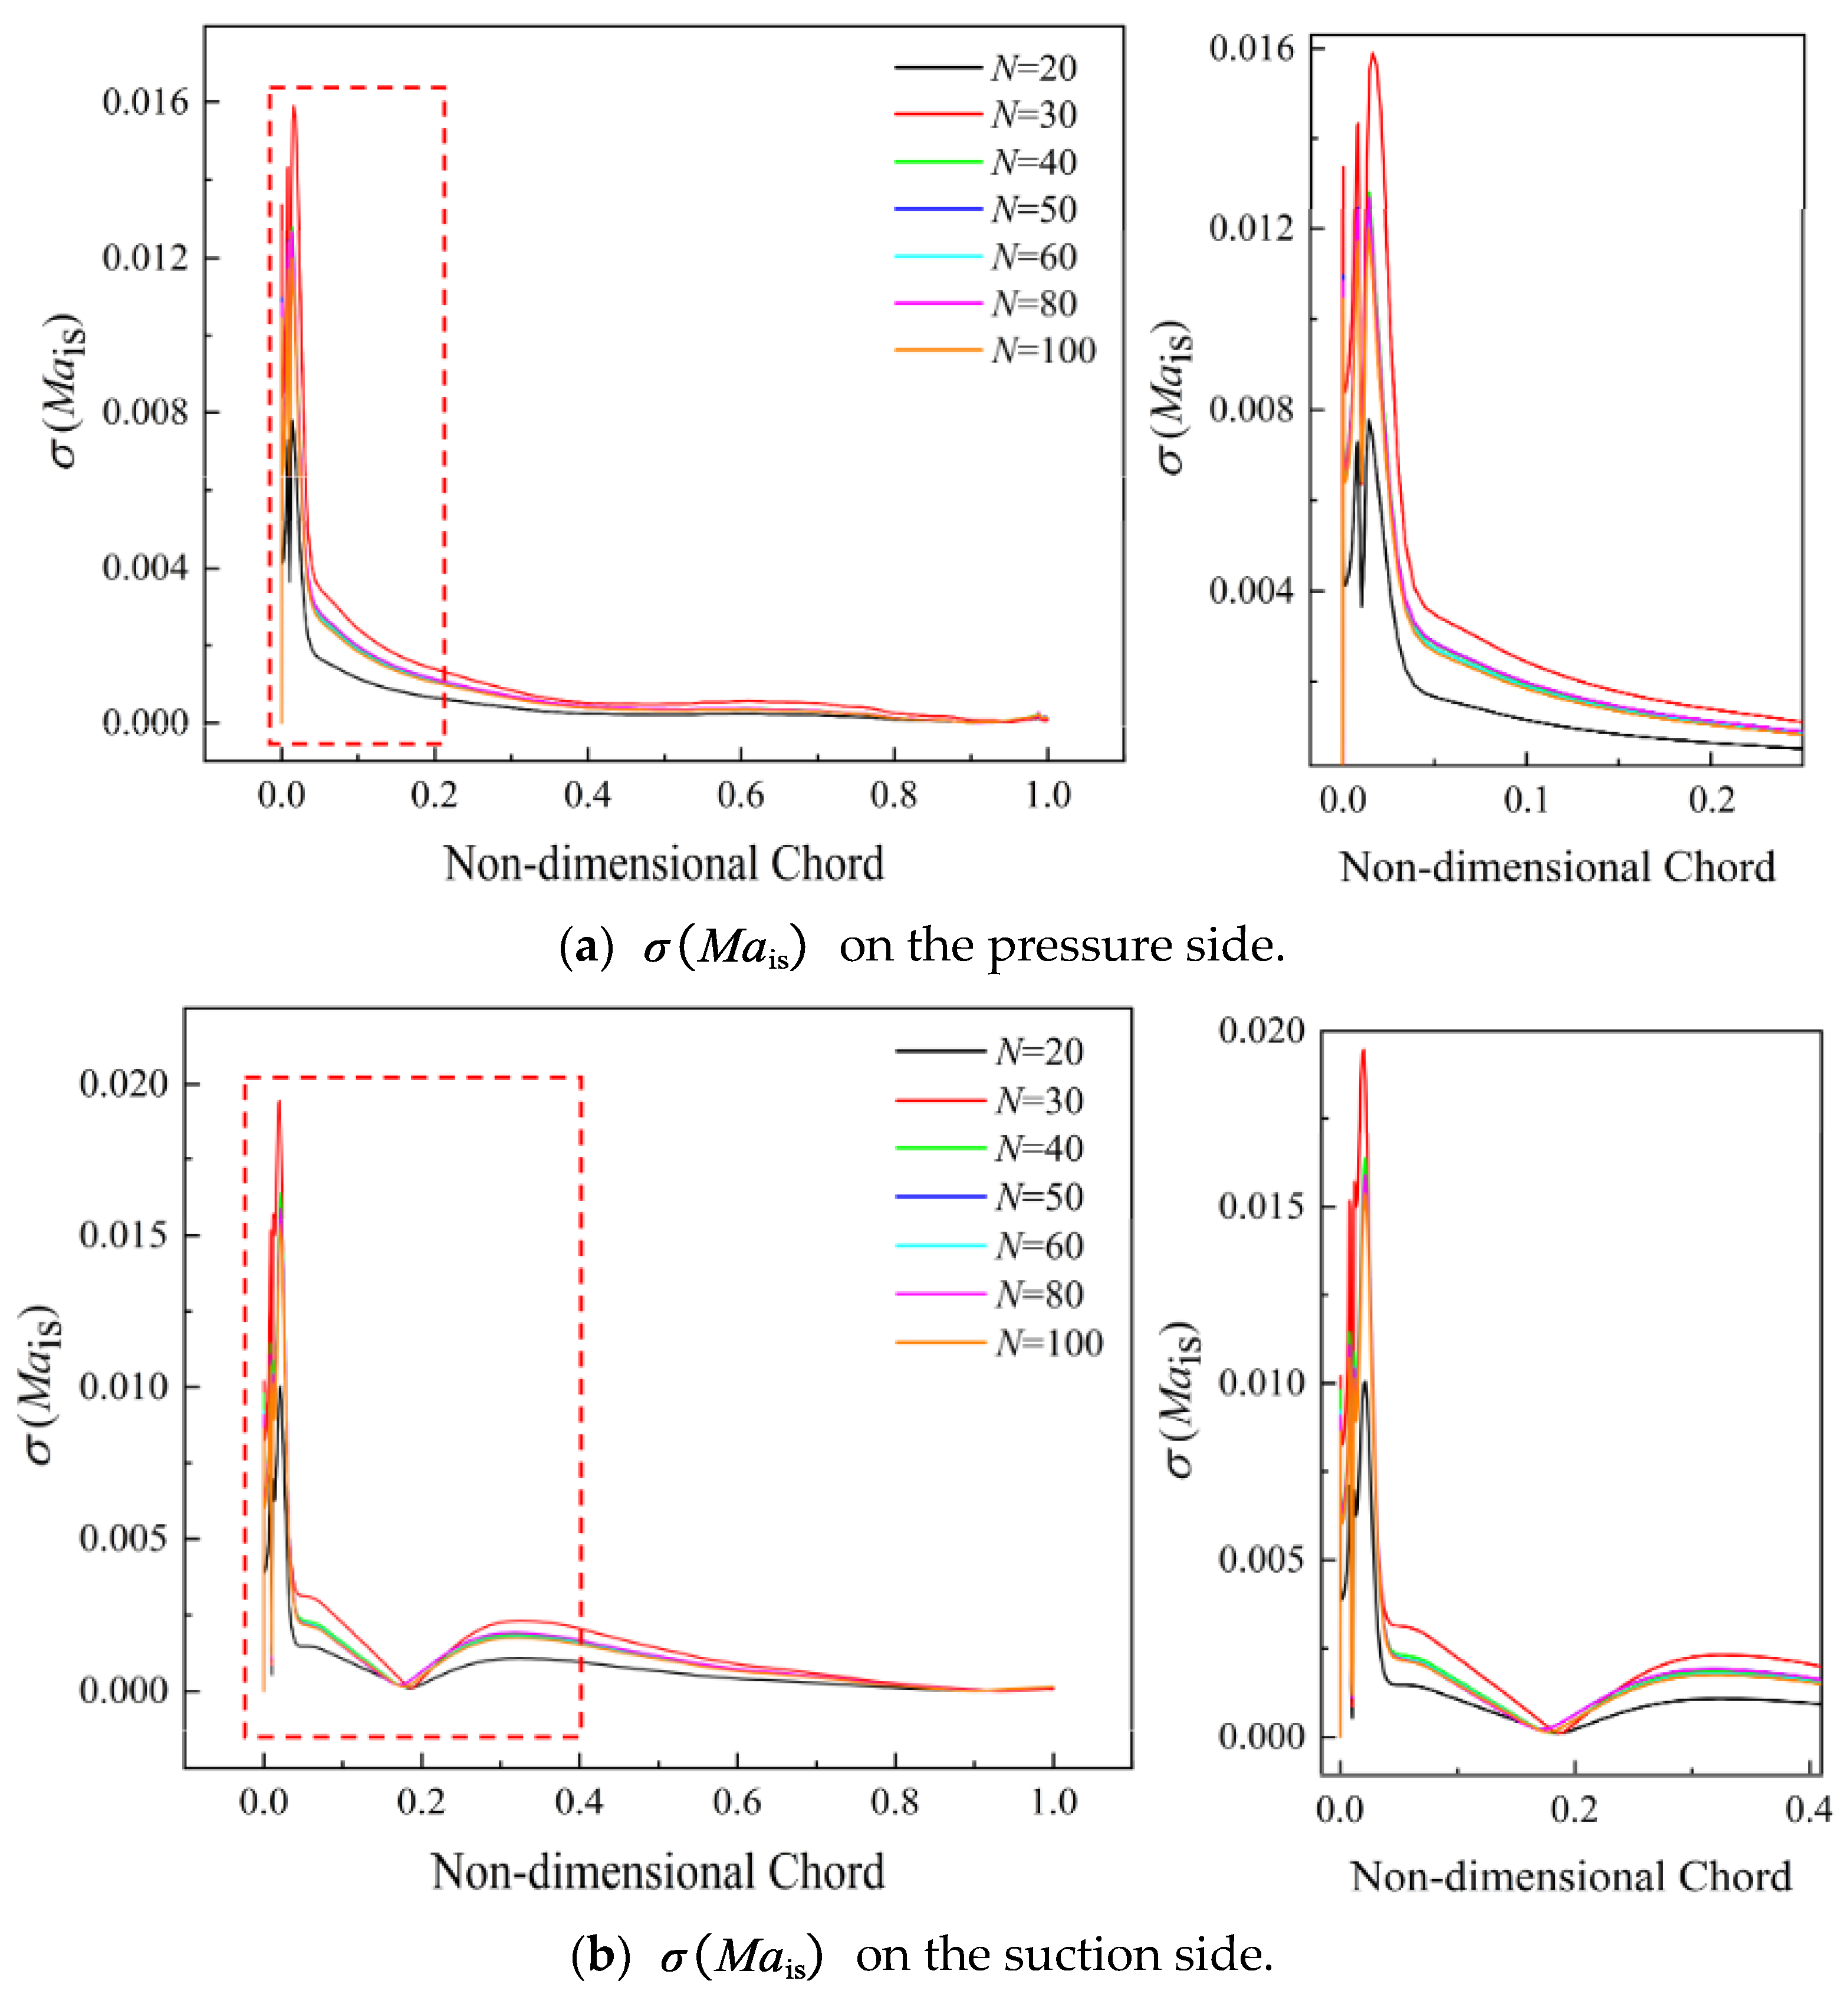
When the sample size of measured data for the stagger-angle error is greater than 50, the values of μ ω , σ ω , μ π , and σ π can reach a good convergence state regardless of operating conditions. The sample size has little effect on μ M a i s and μ M a c h . Its main effect is centered on σ M a i s and σ M a c h . When the sample size is 20 or 30, the zones sensitive to stagger-angle errors, as calculated by PDDPC, have large prediction errors. The incorrect estimates of sensitive zones can cause a significant risk for robust blade design. With a sample size exceeding 40, the estimated results of σ M a i s and σ M a c h are generally consistent. The UQ results of multiple aerodynamic parameters show that the PDDPC method has performance satisfactory to address the problem of limited measured data; there exists a critical sample size that can be used for rapid UQ analysis of compressor blades.
(4)
The KL divergence is used to analyze the probability information loss between the initial sample size (N = 100) and other sample sizes (N = 20, 30, 40, 50, 60, and 80) of stagger-angle error data. The results show that when the sample size of error data is lower than 40, the probability information loss increases sharply. Combined with the aerodynamic UQ convergence results, a sample size of 50 can be regarded as the critical size for accurately propagating the uncertainty of stagger-angle errors.

Author Contributions

Conceptualization, H.W. and L.G.; methodology, H.W.; software, H.W.; validation, H.W.; formal analysis, H.W. and L.G.; investigation, H.W.; resources, B.W.; data curation, H.W. and B.W.; writing—original draft preparation, H.W.; writing—review and editing, L.G. and B.W.; visualization, H.W.; supervision, L.G. and B.W.; project administration, H.W. and L.G.; funding acquisition, H.W., L.G. and B.W.; All authors have read and agreed to the published version of the manuscript.

Funding

This research was funded by the National Natural Science Foundation of China (Grant No. U2241249 and Grant No. 52175436), and the Innovation Foundation for Doctoral Dissertations of Northwestern Polytechnical University (Grant No. CX2021075).

Data Availability Statement

Data can be obtained by the communicator upon reasonable requirements.

Conflicts of Interest

The authors do not have any possible conflict of interest.

References

  1. Wang, H.; Gao, L.; Yang, G.; Wu, B. A data-driven robust design optimization method and its application in compressor blade. Phys. Fluids 2023, 35, 66114. [Google Scholar]
  2. Dow, E.A.; Wang, Q. The Implications of Tolerance Optimization on Compressor Blade Design. J. Turbomach. 2015, 137, 101008. [Google Scholar] [CrossRef]
  3. Zhao, B.; Ding, W.; Shan, Z.; Wang, J.; Yao, C.; Zhao, Z.; Liu, J.; Xiao, S.; Ding, Y.; Tang, X.; et al. Collaborative manufacturing technologies of structure shape and surface integrity for complex thin-walled components of aero-engine: Status, challenge and tendency. Chin. J. Aeronaut. 2023, 36, 1–24. [Google Scholar] [CrossRef]
  4. Wang, P.; Li, S.; Zhang, D.; Li, Y. The machining error control of blade shape based on multivariate statistical process control. Proc. Inst. Mech. Eng. Part B J. Eng. Manuf. 2014, 229, 1912–1924. [Google Scholar] [CrossRef]
  5. Garzon, V.E.; Darmofal, D.L. Impact of Geometric Variability on Axial Compressor Performance. J. Turbomach. 2003, 125, 692–703. [Google Scholar] [CrossRef]
  6. Xu, S.; Zhang, Q.; Wang, D.; Huang, X. Uncertainty Quantification of Compressor Map Using the Monte Carlo Approach Accelerated by an Adjoint-Based Nonlinear Method. Aerospace 2023, 10, 280. [Google Scholar] [CrossRef]
  7. Lejon, M.; Andersson, N.; Ellbrant, L.; Martensson, H. The Impact of Manufacturing Variations on Performance of a Transonic Axial Compressor Rotor. J. Turbomach. 2020, 142, 081009. [Google Scholar] [CrossRef]
  8. Ma, C.; Gao, L.; Wang, H.; Li, R.; Wu, B. Influence of leading edge with real manufacturing error on aerodynamic performance of high subsonic compressor cascades. Chin. J. Aeronaut. 2021, 34, 220–232. [Google Scholar] [CrossRef]
  9. Yao, W.; Chen, X.; Luo, W.; Van Tooren, M.; Guo, J. Review of uncertainty-based multidisciplinary design optimization methods for aerospace vehicles. Prog. Aerosp. Sci. 2011, 47, 450–479. [Google Scholar] [CrossRef]
  10. Cliffe, K.A.; Giles, M.B.; Scheichl, R.; Teckentrup, A.L. Multilevel Monte Carlo methods and applications to elliptic PDEs with random coefficients. Comput. Vis. Sci. 2011, 14, 3–15. [Google Scholar] [CrossRef]
  11. Wang, J.; Wang, B.; Yang, H.; Sun, Z.; Zhou, K.; Zheng, X. Compressor geometric uncertainty quantification under conditions from near choke to near stall. Chin. J. Aeronaut. 2023, 36, 16–29. [Google Scholar] [CrossRef]
  12. Mohanamuraly, P.; Müller, J.-D. An adjoint-assisted multilevel multifidelity method for uncertainty quantification and its application to turbomachinery manufacturing variability. Int. J. Numer. Methods Eng. 2021, 122, 2179–2204. [Google Scholar] [CrossRef]
  13. Phan, H.M. Modeling of a turbine bladerow with stagger angle variation using the multi-fidelity influence superposition method. Aerosp. Sci. Technol. 2022, 121, 107318. [Google Scholar] [CrossRef]
  14. Xiu, D.; Karniadakis, G.E. The Wiener–Askey Polynomial Chaos for Stochastic Differential Equations. SIAM J. Sci. Comput. 2002, 24, 619–644. [Google Scholar] [CrossRef]
  15. Zhang, K.; Li, J.; Zeng, F.; Wang, Q.; Yan, C. Uncertainty Analysis of Parameters in SST Turbulence Model for Shock Wave-Boundary Layer Interaction. Aerospace 2022, 9, 55. [Google Scholar] [CrossRef]
  16. Shi, W.; Chen, P.; Li, X.; Ren, J.; Jiang, H. Uncertainty Quantification of the Effects of Small Manufacturing Deviations on Film Cooling: A Fan-Shaped Hole. Aerospace 2019, 6, 46. [Google Scholar] [CrossRef]
  17. Lange, A.; Voigt, M.; Vogeler, K.; Schrapp, H.; Johann, E.; Gümmer, V. Impact of Manufacturing Variability on Multistage High-Pressure Compressor Performance. J. Eng. Gas Turbines Power 2012, 134, 112601. [Google Scholar] [CrossRef]
  18. Xia, Z.; Luo, J.; Liu, F. Performance impact of flow and geometric variations for a turbine blade using an adaptive NIPC method. Aerosp. Sci. Technol. 2019, 90, 127–139. [Google Scholar] [CrossRef]
  19. Salehi, S.; Raisee, M.; Cervantes, M.J.; Nourbakhsh, A. An efficient multifidelity ℓ1-minimization method for sparse polynomial chaos. Comput. Methods Appl. Mech. Eng. 2018, 334, 183–207. [Google Scholar] [CrossRef]
  20. Kiureghian, A.D.; Liu, P.L. Structural Reliability under Incomplete Probability Information. J. Eng. Mech. 1986, 112, 85–104. [Google Scholar] [CrossRef]
  21. Red-Horse, J.R.; Benjamin, A.S. A probabilistic approach to uncertainty quantification with limited information. Reliab. Eng. Syst. Saf. 2004, 85, 183–190. [Google Scholar] [CrossRef]
  22. Oladyshkin, S.; Class, H.; Helmig, R.; Nowak, W. A concept for data-driven uncertainty quantification and its application to carbon dioxide storage in geological formations. Adv. Water Resour. 2011, 34, 1508–1518. [Google Scholar] [CrossRef]
  23. Oladyshkin, S.; Nowak, W. Data-driven uncertainty quantification using the arbitrary polynomial chaos expansion. Reliab. Eng. Syst. Saf. 2012, 106, 179–190. [Google Scholar] [CrossRef]
  24. Ahlfeld, R.; Belkouchi, B.; Montomoli, F. SAMBA: Sparse Approximation of Moment-Based Arbitrary Polynomial Chaos. J. Comput. Phys. 2016, 320, 1–16. [Google Scholar] [CrossRef]
  25. Ahlfeld, R.; Montomoli, F. A Single Formulation for Uncertainty Propagation in Turbomachinery: SAMBA PC. J. Turbomach. 2017, 139, 111007. [Google Scholar] [CrossRef]
  26. Guo, Z.; Chu, W.; Zhang, H. A data-driven non-intrusive polynomial chaos for performance impact of high subsonic compressor cascades with stagger angle and profile errors. Aerosp. Sci. Technol. 2022, 129, 107802. [Google Scholar] [CrossRef]
  27. Guo, L.; Liu, Y.; Zhou, T. Data-driven polynomial chaos expansions: A weighted least-square approximation. J. Comput. Phys. 2019, 381, 129–145. [Google Scholar] [CrossRef]
  28. Kun, W.; Fu, C.; Jianyang, Y.; Yanping, S. Nested sparse-grid Stochastic Collocation Method for uncertainty quantification of blade stagger angle. Energy 2020, 201, 117583. [Google Scholar] [CrossRef]
  29. Phan, H.M.; He, L. Efficient modeling of mistuned blade aeroelasticity using fully-coupled two-scale method. J. Fluids Struct. 2022, 115, 103777. [Google Scholar] [CrossRef]
  30. Lu, Y.; Green, J.; Stapelfeldt, S.C.; Vahdati, M. Effect of Geometric Variability on Running Shape and Performance of a Transonic Fan. J. Turbomach. 2019, 141, 101012. [Google Scholar] [CrossRef]
  31. Suriyanarayanan, V.; Rendu, Q.; Vahdati, M.; Salles, L. Effect of Manufacturing Tolerance in Flow Past a Compressor Blade. J. Turbomach. 2021, 144, 41005. [Google Scholar] [CrossRef]
  32. Chuang-Stein, C. Sample size and the probability of a successful trial. Pharm. Stat. 2006, 5, 305–309. [Google Scholar] [CrossRef] [PubMed]
  33. He, X.; Zhao, F.; Vahdati, M. Uncertainty Quantification of Spalart–Allmaras Turbulence Model Coefficients for Compressor Stall. J. Turbomach. 2021, 143, 081007. [Google Scholar] [CrossRef]
  34. Wiener, N. The Homogeneous Chaos. J. Comput. Phys. 1938, 60, 897–936. [Google Scholar] [CrossRef]
  35. Xiu, D.; Karniadakis, G.E. Modeling uncertainty in flow simulations via generalized polynomial chaos. J. Comput. Phys. 2003, 187, 137–167. [Google Scholar] [CrossRef]
  36. Zheng, M.; Wan, X.; Karniadakis, G.E. Adaptive multi-element polynomial chaos with discrete measure: Algorithms and application to SPDEs. Appl. Numer. Math. 2015, 90, 91–110. [Google Scholar] [CrossRef]
  37. Gao, L.; Ma, C.; Cai, M.; Li, R.; Wang, H.; Yang, G. Influence of uncertain inflow conditions on a subsonic compressor cascade based on wind tunnel experiment. Proc. Inst. Mech. Eng. Part C J. Mech. Eng. Sci. 2022, 236, 8285–8299. [Google Scholar] [CrossRef]
  38. Martín, F.; Moreno, L.; Garrido, S.; Blanco, D. Kullback-Leibler Divergence-Based Differential Evolution Markov Chain Filter for Global Localization of Mobile Robots. Sensors 2015, 15, 23431–23458. [Google Scholar] [CrossRef]
Figure 1. Compressor blade geometry.
Aerospace 10 00990 g001
Figure 2. Measurement of stagger angle: (a) real manufactured blade profiles; (b) histogram of stagger-angle error.
Aerospace 10 00990 g002
Figure 3. Computational mesh and domain of compressor blade passage.
Aerospace 10 00990 g003
Figure 4. Comparison between experimental measurement and numerical results.
Aerospace 10 00990 g004
Figure 5. The schematic diagram of the PDDPC method.
Aerospace 10 00990 g005
Figure 6. Convergence results of μ Y and σ Y with different sample sizes.
Aerospace 10 00990 g006
Figure 7. A schematic diagram of uncertainty propagation of stagger-angle errors.
Aerospace 10 00990 g007
Figure 8. Histograms of each sample size used in UQ analysis.
Aerospace 10 00990 g008
Figure 9. Convergence plots of μ ω and σ ω under incidence i = −0.5°.
Aerospace 10 00990 g009
Figure 10. Convergence plots of μ π and σ π under incidence i = −0.5°.
Aerospace 10 00990 g010
Figure 11. Convergence plots of μ ω and σ ω under incidence i = 2.5°.
Aerospace 10 00990 g011
Figure 12. Convergence plots of μ π and σ π under incidence i = 2.5°.
Aerospace 10 00990 g012
Figure 13. Convergence plots of μ ω and σ ω under incidence i = 7°.
Aerospace 10 00990 g013
Figure 14. Convergence plots of μ π and σ π under incidence i = 7°.
Aerospace 10 00990 g014
Figure 15. Results of μ M a i s with different sample sizes at incidence i = −0.5°.
Aerospace 10 00990 g015
Figure 16. Results of σ M a i s with different sample sizes at incidence i = −0.5°.
Aerospace 10 00990 g016
Figure 17. Results of μ M a i s with different sample sizes at incidence i = 2.5°.
Aerospace 10 00990 g017
Figure 18. Results of σ M a i s with different sample sizes at incidence i = 2.5°.
Aerospace 10 00990 g018
Figure 19. Results of μ M a i s with different sample sizes at incidence i = 7°.
Aerospace 10 00990 g019
Figure 20. Results of σ M a i s with different sample sizes at incidence i = 7°.
Aerospace 10 00990 g020
Figure 21. μ M a c h contour with different sample sizes at incidence i = −0.5°.
Aerospace 10 00990 g021
Figure 22. σ M a c h contour with different sample sizes at incidence i = −0.5°.
Aerospace 10 00990 g022
Figure 23. μ M a c h contour with different sample sizes at incidence i = 2.5°.
Aerospace 10 00990 g023
Figure 24. σ M a c h contour with different sample sizes at incidence i = 2.5°.
Aerospace 10 00990 g024
Figure 25. μ M a c h contour with different sample sizes at incidence i = 7°.
Aerospace 10 00990 g025
Figure 26. σ M a c h contour with different sample sizes at incidence i = 7°.
Aerospace 10 00990 g026
Figure 27. KL results for different sample sizes.
Aerospace 10 00990 g027
Table 1. Main geometric parameters of the compressor cascade.
ParametersValues
Chord length c (mm)69.9
Camber angle (°)39.61
Geometric inlet angle (°)45.83
Maximum thickness/mm3.51
Design incidence (°)2.5
Stagger angle θ (°)26.58
Table 2. Relative errors for test functions.
N (Sample Size) Err - μ Y % Err - σ Y %
201.531.13
301.590.68
400.250.16
500.090.18
600.460.28
800.150.60
1000.380.21
1500.910.69
2000.160.91
3000.350.37
10000.120.03
Table 3. Critical sample sizes for aerodynamic parameters.
Aerodynamic ParametersCritical Sample Size
i = −0.5°i = 2.5°i =
μ ω 404040
σ ω 504040
μ π 404040
σ π 405040
Table 4. Critical sample sizes of Mais.
Aerodynamic ParametersCritical Sample Size
i = −0.5°i = 2.5°i =
μ M a i s ---------
σ M a i s on PS404040
σ M a i s on SS404040
Table 5. Critical sample sizes for Mach.
Aerodynamic ParametersCritical Sample Size
i = −0.5°i = 2.5°i =
μ M a c h 3040---
σ M a c h 404040
Disclaimer/Publisher’s Note: The statements, opinions and data contained in all publications are solely those of the individual author(s) and contributor(s) and not of MDPI and/or the editor(s). MDPI and/or the editor(s) disclaim responsibility for any injury to people or property resulting from any ideas, methods, instructions or products referred to in the content.

