Article

Accuracy Investigations of Dynamic Characteristic Predictions of Tip Leakage Flow Using Detached Eddy Simulation

1
School of Power and Energy, Northwestern Polytechnical University, Xi’an 710072, China
2
School of Aerospace Engineering, Xi’an Jiaotong University, Xi’an 710049, China
*
Authors to whom correspondence should be addressed.
These authors contributed equally to this work.
Aerospace 2024, 11(1), 29; https://doi.org/10.3390/aerospace11010029
Submission received: 26 October 2023 / Revised: 23 December 2023 / Accepted: 26 December 2023 / Published: 28 December 2023
(This article belongs to the Special Issue Aero-Engine Design)

Abstract

:
The accurate prediction of tip leakage flow is the premise for flow mechanism analysis and compressor performance optimization. The detached eddy simulation (DES) method, which compromises cost and accuracy, has excellent potential for a high Reynolds flow, like a compressor.However, in the case of tip leakage flow, especially when there are multiple wall boundary layers and strong shear between the mainstream and leakage flow, the DES method exhibits accuracy deficiencies. This paper explores the resolution of the critical detailed structures using the DES method and its correlation with the accuracy of time-averaged aerodynamic parameter predictions. Based on this, we propose the necessary conditions for the DES method to accurately predict the leakage flow from the perspective of the detailed structure of the flow field. A simplified model is proposed to emphasize the characteristics of tip leakage flow with “multiple walls + narrow tip gap”, and the high-fidelity flow field of the WALE LES method is used as a benchmark. With the main fluctuation structures obtained by the SPOD method, it is concluded that the DES method is unable to resolve the Kelvin–Helmholtz instability at the initial position of the leakage, which leads to the generation of the secondary leakage vortex upstream of the leakage and the breakdown of the induced vortex, two critical flow structures, being incorrectly estimated. This can lead to misestimationsof the force direction on the tip leakage vortex and the main fluctuation on the flow field. As a result, the tip leakage vortex trajectory evolves toward the middle of the passage along the tangential direction and away from the upper wall downstream of the leakage compared with the LES results. Predictions of losses in the upstream and midstream regions are underestimated, whereas they are overestimated downstream of the leakage and outside the passage.Therefore, the accurate resolution of these two critical detailed structures is an essential prerequisite for the precise prediction of tip leakage flow using DES series methods.

1. Introduction

As one of the dominant secondary flows in a compressor, tip leakage flow has an important influence on compressor efficiency [1], stability [2], and aerodynamic noise [3]. Refined design and flow control techniques implemented in the tip region can effectively alleviate the adverse effects associated with tip leakage flow. However, this effectiveness hinges on a comprehensive comprehension of the flow field structure and dynamic characteristics within the tip region. For example, the precise prediction of the tip leakage vortex (TLV) breakdown location and the region of low-energy fluid near the casing are essential prerequisites in casing treatment [4] and boundary layer suction techniques [5]. These prerequisites are crucial for minimizing blockage effects and improving stability. As tip jet injection [6] and plasma excitation techniques [7], precise predictions of initial unsteady disturbances and the specific location of blade tip flow separation play critical roles, respectively. Obviously, it is evident that the accurate capture of these critical flow characteristics serves as the cornerstone of refined design and effective control. Therefore, the high-fidelity prediction of the flow field within the compressor tip region is imposed with elevated requirements.
During the early stages, researchers systematically investigated time-averaged flow characteristics [8], vortex structures [9], and crucial aerodynamic parameters [10] in the compressor tip region based on the Reynolds-averaged Navier–Stokes (RANS) method. This initial research significantly advanced the fundamental understanding of the compressor tip flow. As the importance of unsteady characteristics in affecting losses and aerodynamic stability in compressor tip flow fields becomes increasingly recognized, researchers turned to the Unsteady Reynolds-averaged Navier–Stokes (URANS) method. The URANS method helps to arrive at the consensus that compressor stall inception contains two types, namely modal wave [11] and spike inception [12]. Moreover, the wavelength and amplitude propagation speed of the stall inceptions have been researched, providing an opportunity for the development of active control technology. However, the URANS method cannot provide a high-fidelity flow field in the strong shear region and anisotropic flow fields such as tip flow, especially in near-stall conditions [13]. Furthermore, it could only capture unsteady fluctuations and frequencies induced by rotor rotation, making it difficult to distinguish between unsteady fluctuations caused by different flow-detailed structures [14,15]. In contrast, as a turbulent vortex-resolving method, large eddy simulation (LES) has been proven to provide higher-fidelity results in tip flow, especially in the resolution of the unsteady flow details [16]. However, the calculation consumption of the LES is not affordable due to the considerable gird number and infinitesimal time step in a high Reynolds compressor flow field [17]. This becomes particularly challenging in multistage or multirow environments, making it difficult to meet engineering applications. Moreover, although the Wall-Modeled LES (WMLES) reduces computational costs compared to pure LES, the performance depends on the accuracy of the model near the wall [18].
As a hybrid RANS-LES method, the detached-eddy simulation (DES) approach uses the RANS method in the boundary layer, whereas it uses the LES in the separation region [19].As the DES series methods gradually develop, they have been widely applied in compressor predictions [20,21,22,23], reaching a compromise between computational efficiency and accuracy and offering the possibility of achieving high-fidelity numerical simulations for multi-row blade configurations within the compressor [24]. However, DES series methods belong to the weak RANS/LES coupling method, as there is a lack of conversion mechanism from modeled turbulent kinetic energy to analytical turbulent kinetic energy at the junction region of the RANS and LES domains [25]. As a result, there is a “gray area” in the junction region, which may cause the GIS (Grid-Induced Separation) [26] and slow LES development (SLD) problem [27]. Specifically, characterized by the “multi-wall + narrow tip gap” structure, the tip clearance flow exhibits complex characteristics that include the mutual interactions of multiple attached boundary layers on the casing/wall, blade tip, and blade suction side [28], as well as the strong shear effect between the mainstream and leakage flow (flowing perpendicular to each other) [29]. These complex characteristics will further magnify the deficiencies of DES series methods, especially the SLD issue [30]. Consequently, DES series methods still face specific challenges when employed in the compressor tip flow.
Su conducted numerical simulations of a certain 1.5-stage compressor using the URANS and DES97 methods [31], respectively. The results showed that at the near-stall point, the efficiency and pressure ratios obtained by the DES97 method were essentially consistent with those of the URANS method, illustrating that the DES97’s predictions are inaccurate under extreme conditions. Moreover, Wu conducted numerical simulations of a compressor cascade with tip clearance using the IDDES method [32]. The results revealed that the prediction of the pressure at 20% to 60% of the chord length on the blade suction side of the tip region deviates even more from experimental data compared to the URANS results. In addition, there were also noticeable discrepancies in the prediction of the TLV trajectory compared to the LES results. Furthermore, Reira conducted numerical simulations of a certain transonic compressor rotor using the URANS and ZDES method and the results revealed that both methods exhibited the same dominant frequency [33]. Additionally, the fluctuation amplitudes captured by the ZDES method were close to those of the URANS upstream of the leakage flow, which differed significantly from the rich frequency results obtained through LES [16]. Additionally, it is difficult to assess the accuracy of predictions for crucial detailed structures. It could be seen that the prediction of tip leakage based on the DES series method is inadequate in the aspect of the time-averaged aerodynamic parameters and unsteady fluctuations.
In conclusion, the current assessment of the prediction accuracy of DES-type methods primarily involves comparing them to low-precision URANS, high-precision LES, and experimental results in terms of time-averaged performance, unsteady frequency characteristics, and other aerodynamic parameters. This is like an a posteriori method that can only present the results of the method but cannot reveal the reasons for inaccurate predictions from the perspective of the detailed structure of the flow field.Obviously, it is insufficient for the improvement of the application of DES series methods to the tip leakage flow. Liu [13] and He [34] compared the predictive ability of the URANS, DDES, and enhanced DDES (EDDES) method in the tip of a low-speed large-scale axial compressor. The vortex structure of the DDES and EDDES results is richer and the resolution of the turbulent kinetic energy correlates more with the experiment results. Unfortunately, due to the lack of high-precision numerical results like LES for benchmarking, it was impossible to comparatively verify the accuracy of the predictions in terms of detailed structure. Furthermore, the abundance of vortex structure could not represent an accurate prediction of the key flow field detailed features like vortex breakdown and development. Importantly, it is necessary to identify the detailed structures that are not captured correctly and reveal the mechanism for the inaccuracy prediction of the aerodynamic parameters.
The main objective of this study is to propose a judgmental basis for evaluating the accuracy of DES series methods in the application of tip leakage flow from the perspective of detailed structures. It should be noted that the factors that affect the prediction performance of DES series methods vary considerably among different research subjects [30]. Therefore, to emphasize the special geometry of the tip leakage, i.e., the “multi-wall + narrow tip gap” structure and the corresponding aerodynamic characteristics, a simplified model was established to focus on the accuracy of DES-type methods in such special flows. Based on this model, the prediction differences in the DES method on time-averaged aerodynamic parameters are compared using the high-fidelity numerical flow field of the LES as a benchmark. Furthermore, the ability of the DES method to capture the key detailed flow structure is explored with the help of main frequency fluctuation reconstruction results by the spectral proper orthogonal decomposition (SPOD) method. Consequently, the correlation mechanism between the inaccurate resolution of the detailed structure and the difference in aerodynamic parameters of the DES method is revealed. The conclusions of this paper can serve as a necessary basis for judging the prediction accuracy of DES series methods in tip leakage flow from the detailed flow structure perspective.

2. Computational Model and Numerical Method

2.1. Simplified Model of the Tip Clearance

The compressor clearance flow field comprises the tip leakage flows and other complex physical phenomena such as suction surface separation, the horseshoe vortex, the passage vortex, etc. A simplified model was proposed to extract the tip leakage flows from the complex flow field based on the compressor cascade with tip clearance. Two features characterize the model, i.e., the generation of the jet from the tip clearance and the shear of the jet and the mainstream.

2.1.1. Geometry and Flow Characteristics of Compressor Tip Clearance

Geometrically, the tip clearance is a structure of multiple walls with a narrow tip gap formed by the top of the blade, the end wall, the curved suction, and pressure surfaces. The flow passage experiences a dramatic change from contraction to expansion along the tangential direction, which is illustrated in Section A-A of Figure 1.
The end wall section in Figure 1 shows that the suction surface and the pressure surface consist of the flow expansion passage, causing an adverse pressure gradient. The end wall section in Figure 1 shows that the suction surface and the pressure surface consist of the flow expansion passage, causing an adverse pressure gradient.
The particular flow structures in the tip gap are formed with the control of the special tip clearance geometry. Specifically, the tangential pressure gradient drives the leakage over the blade tip. It generates boundary layers at the physical walls on both sides of the gap, which is illustrated by the red arrow in Section A-A of Figure 1. Then, the leakage transforms into a half-bounded jet after detaching from the blade tip, which is highlighted as a green arrow in Figure 1. The interaction between the jet and mainstream (the shear layer) generates a tip leakage vortex (TLV), one of the primary features in the clearance flow field. Meanwhile, driven by the jet, the boundary layer near the blade tip and the end wall evolves and affects the flow field in the passage. Additionally, other complex vortex structures, such as passage vortex [35], separation vortex [36,37], horseshoe vortex, and induced vortex (IV) have been proved to affect the trajectory, strength, and vorticity of the leakage flow through energy exchange such as mixing and squeezing.

2.1.2. Simplified Model of the Tip Leakage Flow

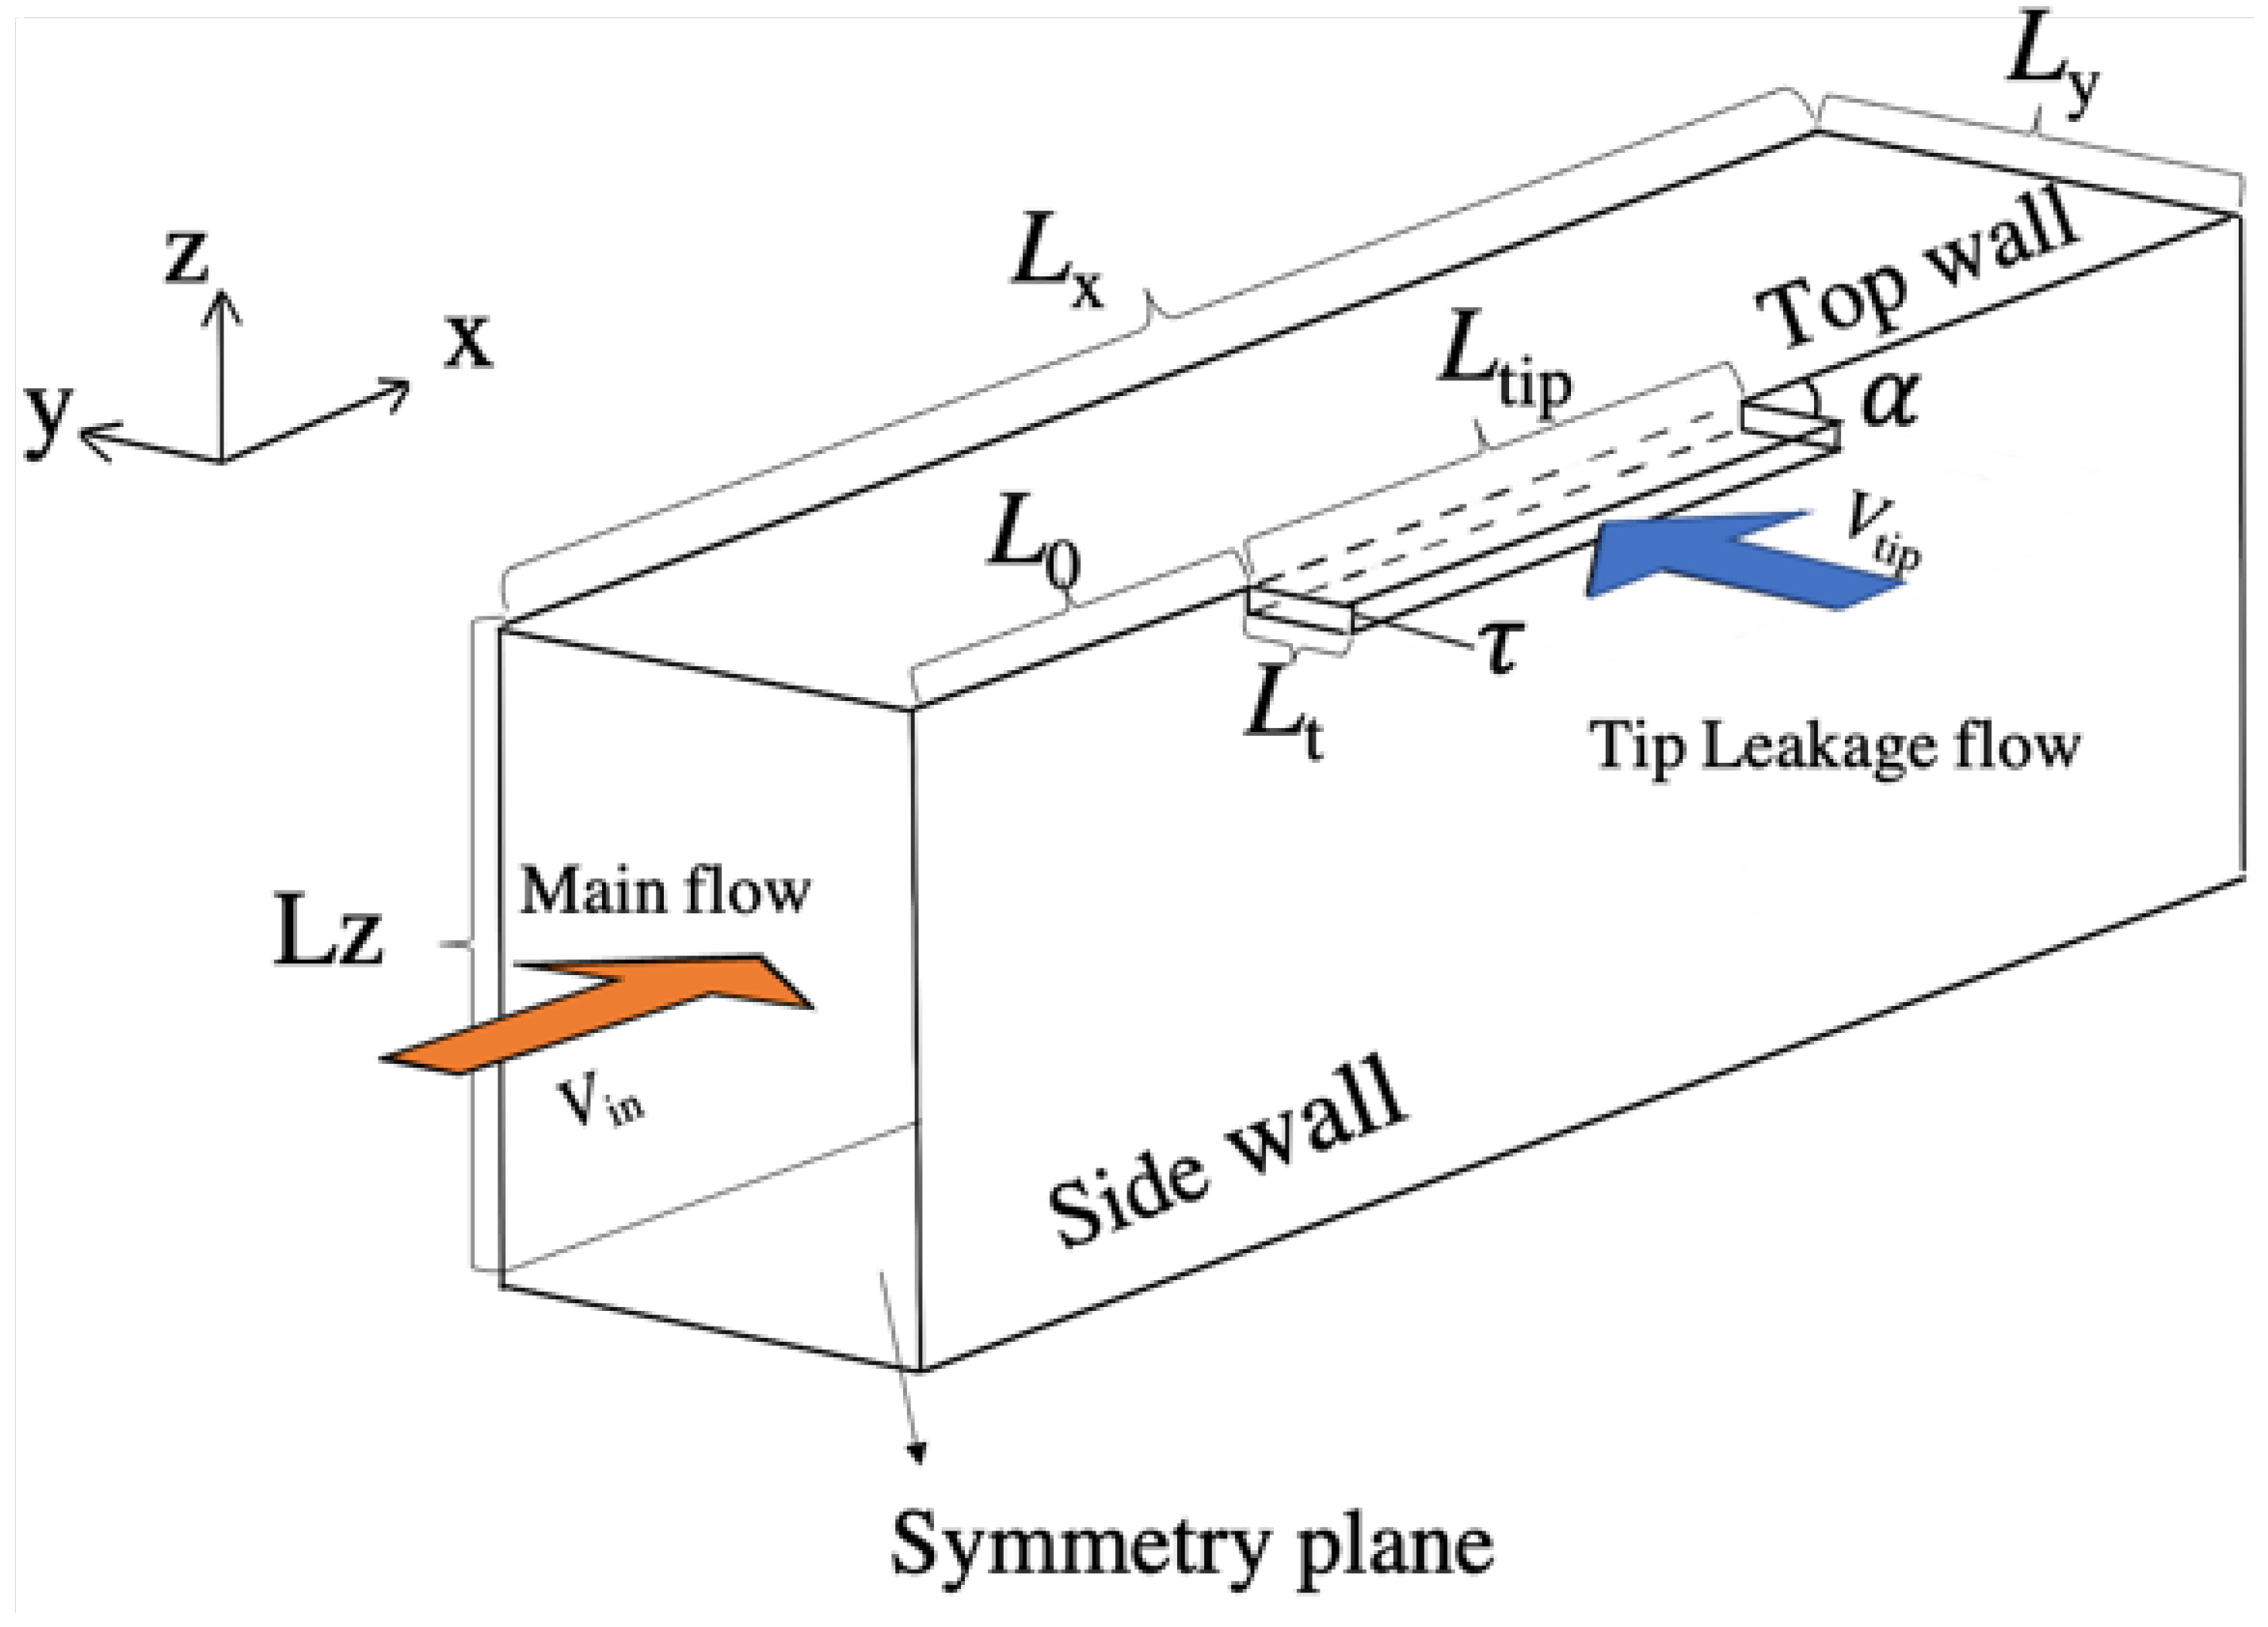
In this study, a simplified model is established to characterize the leakage flow and the multiple wall boundary layer effects and remove the complex vortex features generated by streamwise and tangential pressure gradients. As shown in Figure 2, the simplified model comprised a square passage and a tip gap. A square passage with a slit could characterize the leakage flow [29]. The tip gap component characterizes the multi-wall boundary layers and is indispensable for the capture of the transition from the RANS domain (near blade tip) to the LES domain (initial shear layer). The square passage is a simplification of the cascade passage consisting of a top wall, two side walls, and a symmetry plane at the bottom. Additionally, the tip gap is a simplified tip clearance structure composed of upper and lower solid walls connected to the square passage. According to the model, the mainstream along the X direction in the square interacts with the leakage flow from the tip gap with an angle of α , which forms the TLV.
The sizes of the simplified model geometry abstracts from a compressor cascade are shown in Table 1, where L y and L z are the width and height of the square passage, corresponding to the pitch of the cascade and blade height, respectively;
L t i p , L t , and τ are the size of the tip gap, corresponding to the axial chord length of the blade, the maximum thickness of the blade, and the tip clearance size, respectively.
α is the angle between the tip gap and the square passage, representing the angle between the leakage flow and the mainstream.
L 0 is the distance between the start position of the tip gap and inlet, corresponding to the distance between leading edge of the blade and the inlet.
L x is the axial length of the whole calculation domain. The size of the tip gap channel in this paper is L t i p = h = 0.06 m, and the specific values of other parameters are given in Table 1. At the same time, X N , Y N , and Z N represent the normalized streamwise, tangential, and spanwise coordinates, respectively; see Equations (1)–(3).
X N = X L 0 L t i p
Y N = Y L y
Z N = Z L z

2.2. Numerical Methods

The wall-adapted local eddy-viscosity model large-eddy simulation (WALE LES) and the DES methods are selected to solve the three-dimensional transient Navier–Stokes (N-S) equations, respectively, and based on the CFX solver, the subgrid-scale viscosity coefficient (SGS) μ sgs is obtained by solving the Smagorinsky subgrid model with the WALE LES method. Compared to the original Smagorinsky model, the WALE LES method (without ambiguity, the following is called LES) ensures the eddy-viscosity coefficient in the viscous sublayer is close to zero and captures the transition from laminar to turbulent flow at the near-wall region [38]. The DES method used in this paper is based on the SST model [26], similar to the DDES method [25]. The mixed-length l hyb is used instead of l t in the original SST k ω by introducing the delay function F DES based on the mixed function F 2 ; see Equation (4), where
F D E S = max l t C D E S Δ 1 F 2 , 1
l t = k β * ω
Δ = max ( Δ x , Δ y , Δ z )
F 2 = tanh arg 2 2
arg 2 = max 2 k β * ω d , 500 ν d 2 ω
  • C D E S is the constant 0.61 in the DES method,
  • k is the turbulent kinetic energy,
  • ω is the turbulent dissipation rate,
  • β * is a constant 0.09,
  • d is the distance from the grid center to the nearest wall,
  • ν is the kinematic viscosity,
  • Δ is the maximum value of a grid-scale in the x, y, z directions.
The delay in the transformation from RANS ( F 2 = 1 ) to LES ( F 2 = 0 ) is achieved through F 2 , which can avoid the problem of GIS [26]. In terms of the discrete format, we use the central difference scheme as the discrete spatial convection, whereas the second-order backward Euler is used for the time discrete convection. Regarding the boundary conditions, although we set the average pressure at the outlet, the total temperature and pressure are set at the inlet. The velocity of the mainstream and jet flow are controlled by adjusting the total pressure at the inlet of the square and tip gap (mainstream’s Mach number: 0.4). Anyway, the Mach number of the leakage is set to 0.4 to ensure the calculation’s convergence stability and avoid the backflow at the tip gap inlet.
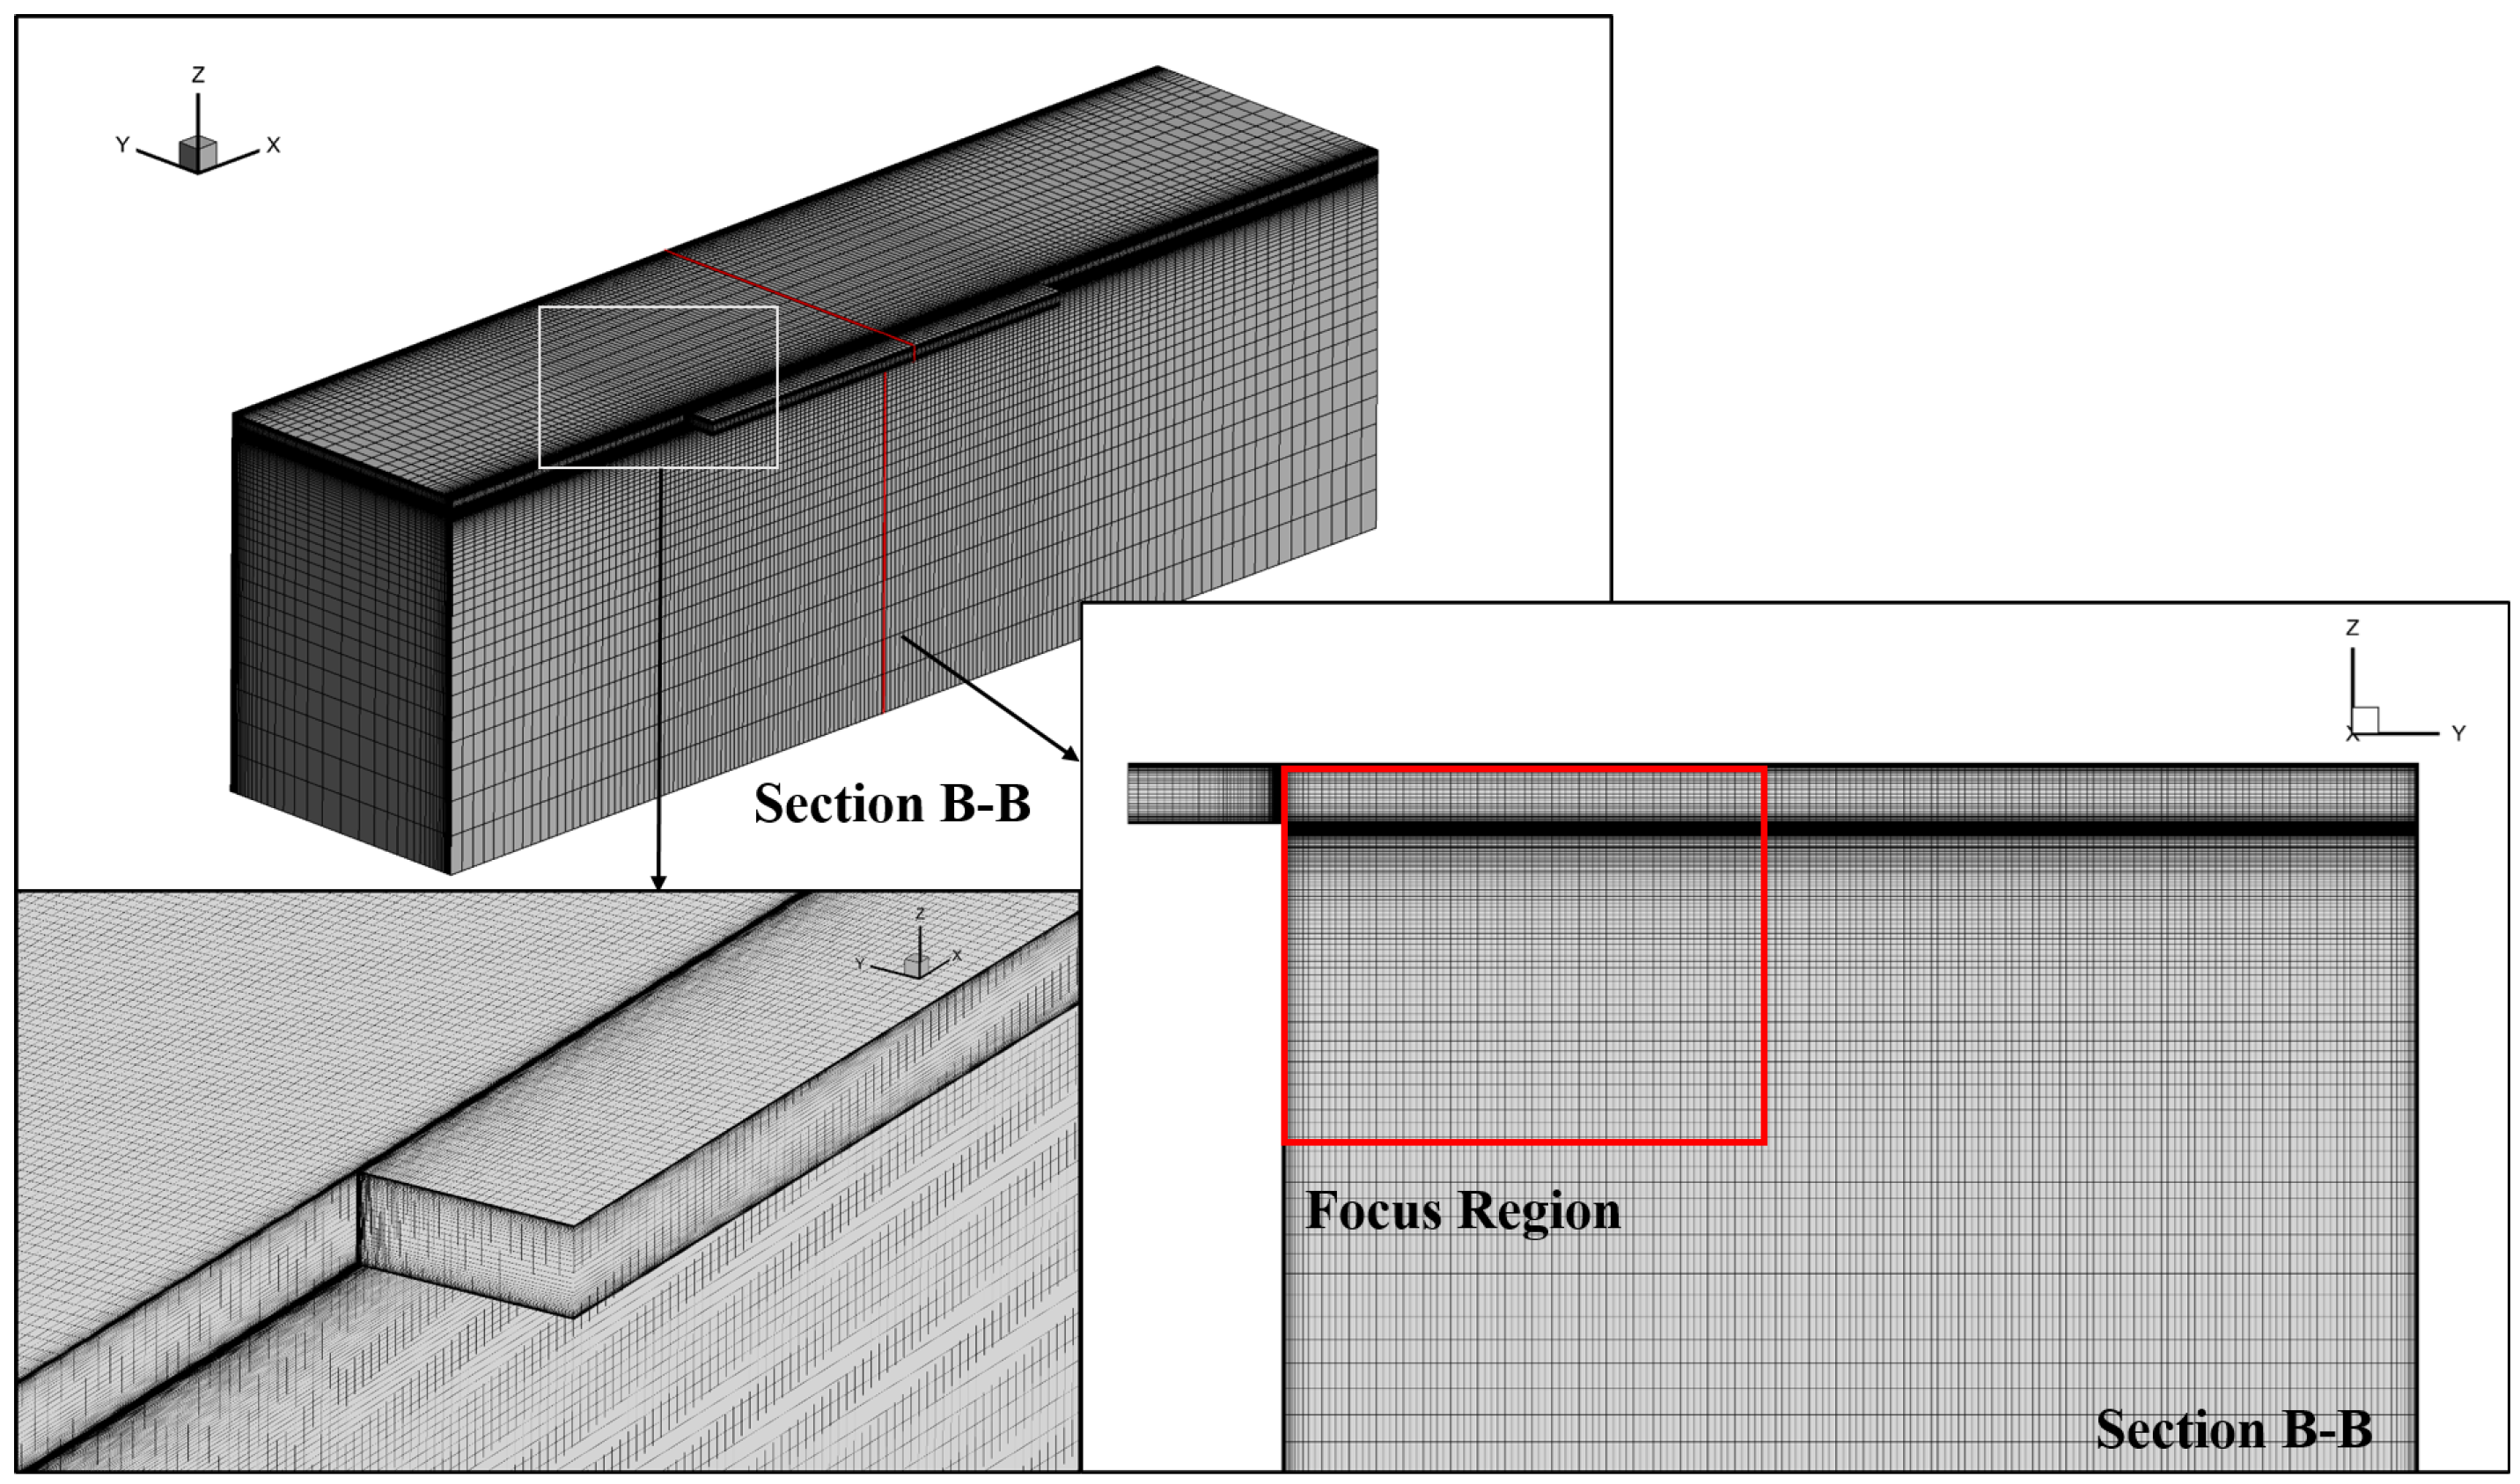
As shown in Figure 3, the calculation domain of the simplified model comprised two H-type domains, the square passage and the tip gap with 301 × 201 × 205 ( X × Y × Z ) and 201 × 73 × 61 ( X × Y × Z ) cells, respectively. Notably, the grid here in the red box is refined at the position of the leakage and mainstream’s shear layer; that is, the focus region, to meet the requirements of the WALE LES method that is y + < 1 near the solid walls and x + < 40 and z + < 30 at the focus region in Figure 3, resulting in a total grid number of 15.54 million. Contrastingly, the same grid is used in the DES calculation to eliminate grid-based influence. The physical time step Δ t p h y s i c s is set to 1 × 10 6 s, ensuring the Courant number is less than 1.

2.3. Data Processing Methods

2.3.1. Time Average of the Unsteady Flow Field

It is necessary to study the time-averaged characteristics of a flow field, such as the trajectory of the TLV and loss distribution in the tip flow. Unfortunately, it is difficult to determine the unique primary frequency ( f main ) of the tip leakage flow since it is by nature broadband and rich. Therefore, the smallest one of the high-amplitude frequency bands of the outlet mass flow rate ( f 1 ), using the Fast Fourier Transform, was chosen for the average period. We obtained the time-averaged results of the unsteady data h ¯ ( x , y , z , t ) over three periods, guaranteeing that the smallest high-amplitude frequency band was contained three times by the unsteady data corresponding to the smallest high-amplitude frequency band.
h ¯ ( x , y , z ) = t t + 3 / f 1 h ¯ ( x , y , z , t ) d t 3 / f 1
where t represents the physical time when the unsteady flow field converges.

2.3.2. Spectral Proper Orthogonal Decomposition (SPOD)

In extracting the main flow field fluctuations and understanding the flow mechanism, the data-driven mode decomposition method performs well, with visual mode structure inspections often directly revealing the underlying flow physics; for example, vortex interactions, vortex shedding, flow instabilities, and so on [39]. The core part of the SPOD program refers to the literature [40]. Compared with the traditional proper orthogonal decomposition (POD) method, SPOD can extract the physical modes of a specific frequency band in an energy mode while obtaining all the modes arranged in descending order of energy, taking into account the frequency domain information of the flow field. Compared with the dynamic mode decomposition (DMD) method, the frequency mode extracted by this method is more representative. Finally, the principle of the SPOD method is as follows:
A snapshot matrix Q N t K = h 1 , h 2 , , h N t based on fluctuation vectors is constructed first, where N t is the total number of snapshots and K is the total number of grid cells. Using the Welch periodogram method, the data matrix Q N t K is then segmented into N b sub-block matrixes, each sub-block matrix comprising N f snapshots. Equation (10) shows the n t h sub-block matrix Q ( n ) N f K :
Q ( n ) N f K = h 1 ( n ) , h 2 ( n ) , , h N f ( n ) ; 1 n N b
where h k ( n ) represents the k t h snapshot in the n t h sub-block matrix. Since each block is assumed to be a statistically independent realization under the ergodicity hypothesis, we subsequently performed a discrete Fourier transform on each block to transform the data into the frequency domain; then, the k t h snapshot of the n t h sub-block is as follows:
h ^ k ( n ) = 1 N f j = 1 N f w j h j ( n ) e i 2 π ( k 1 ) ( j 1 ) / N f
The weights w j represent the nodal value of a window function that can be used to reduce spectral leakage caused by the non-periodicity of the snapshot data in each frequency-domain block [41].
Then, we reshape the frequency domain matrices according to their frequency. As shown in Equation (12), Q ^ k is constructed by all the snapshots h ^ k ( n ) whose frequencies are k. The weighted cross spectral density (CSD) matrix for the k t h element can be designed by Equation (13):
Q ^ k = h ^ k 1 , h ^ k 2 , , h ^ k N b ; 1 n N b
S k = 1 N b W 1 2 Q ^ k * Q ^ k W * 1 2
Furthermore, the eigenvalue decomposition of the CSD matrix S k is carried out. The mode Φ k corresponding to the frequency k is obtained according to the eigenvalue matrix Λ k and the eigenvector matrix Ψ k , as shown in Equation (14). The energy of each mode ϕ k ( n ) is characterized by the component λ k ( n ) of the eigenvalue Λ k .
Φ k = Q ^ k Ψ k Λ k ( 1 / 2 )
In this study, the flow field reconstruction is based on the time domain reconstruction method [42]. After the original snapshot data Q N t K expressed as a linear combination of SPOD modes (see Equation (15)), the coefficient conversion matrix A ˜ is solved as shown in Equation (16). The weight matrix W changes with the parameters selected in the snapshot.
Q N t K Q ˜ A ˜
A ˜ = Φ ˜ * W Φ ˜ 1 Φ ˜ * W Q N t K
The matrix Φ ˜ contains the SPOD modes of all frequencies, namely:
Φ ˜ = ϕ 1 1 , ϕ 1 2 , , ϕ 1 N b , ϕ 2 1 , ϕ 2 2 , , ϕ 2 N b , , ϕ N f 1 , ϕ N f 2 , , ϕ N f N b
Finally, the fluctuating flow field ( h ˜ m ) at the m t h moment can be reconstructed by Equation (18).
h ˜ m = Φ ˜ * W Φ ˜ 1 Φ ˜ * W h m

3. Results and Analysis

3.1. The Resolution of the DES Method for Tip Leakage Flow

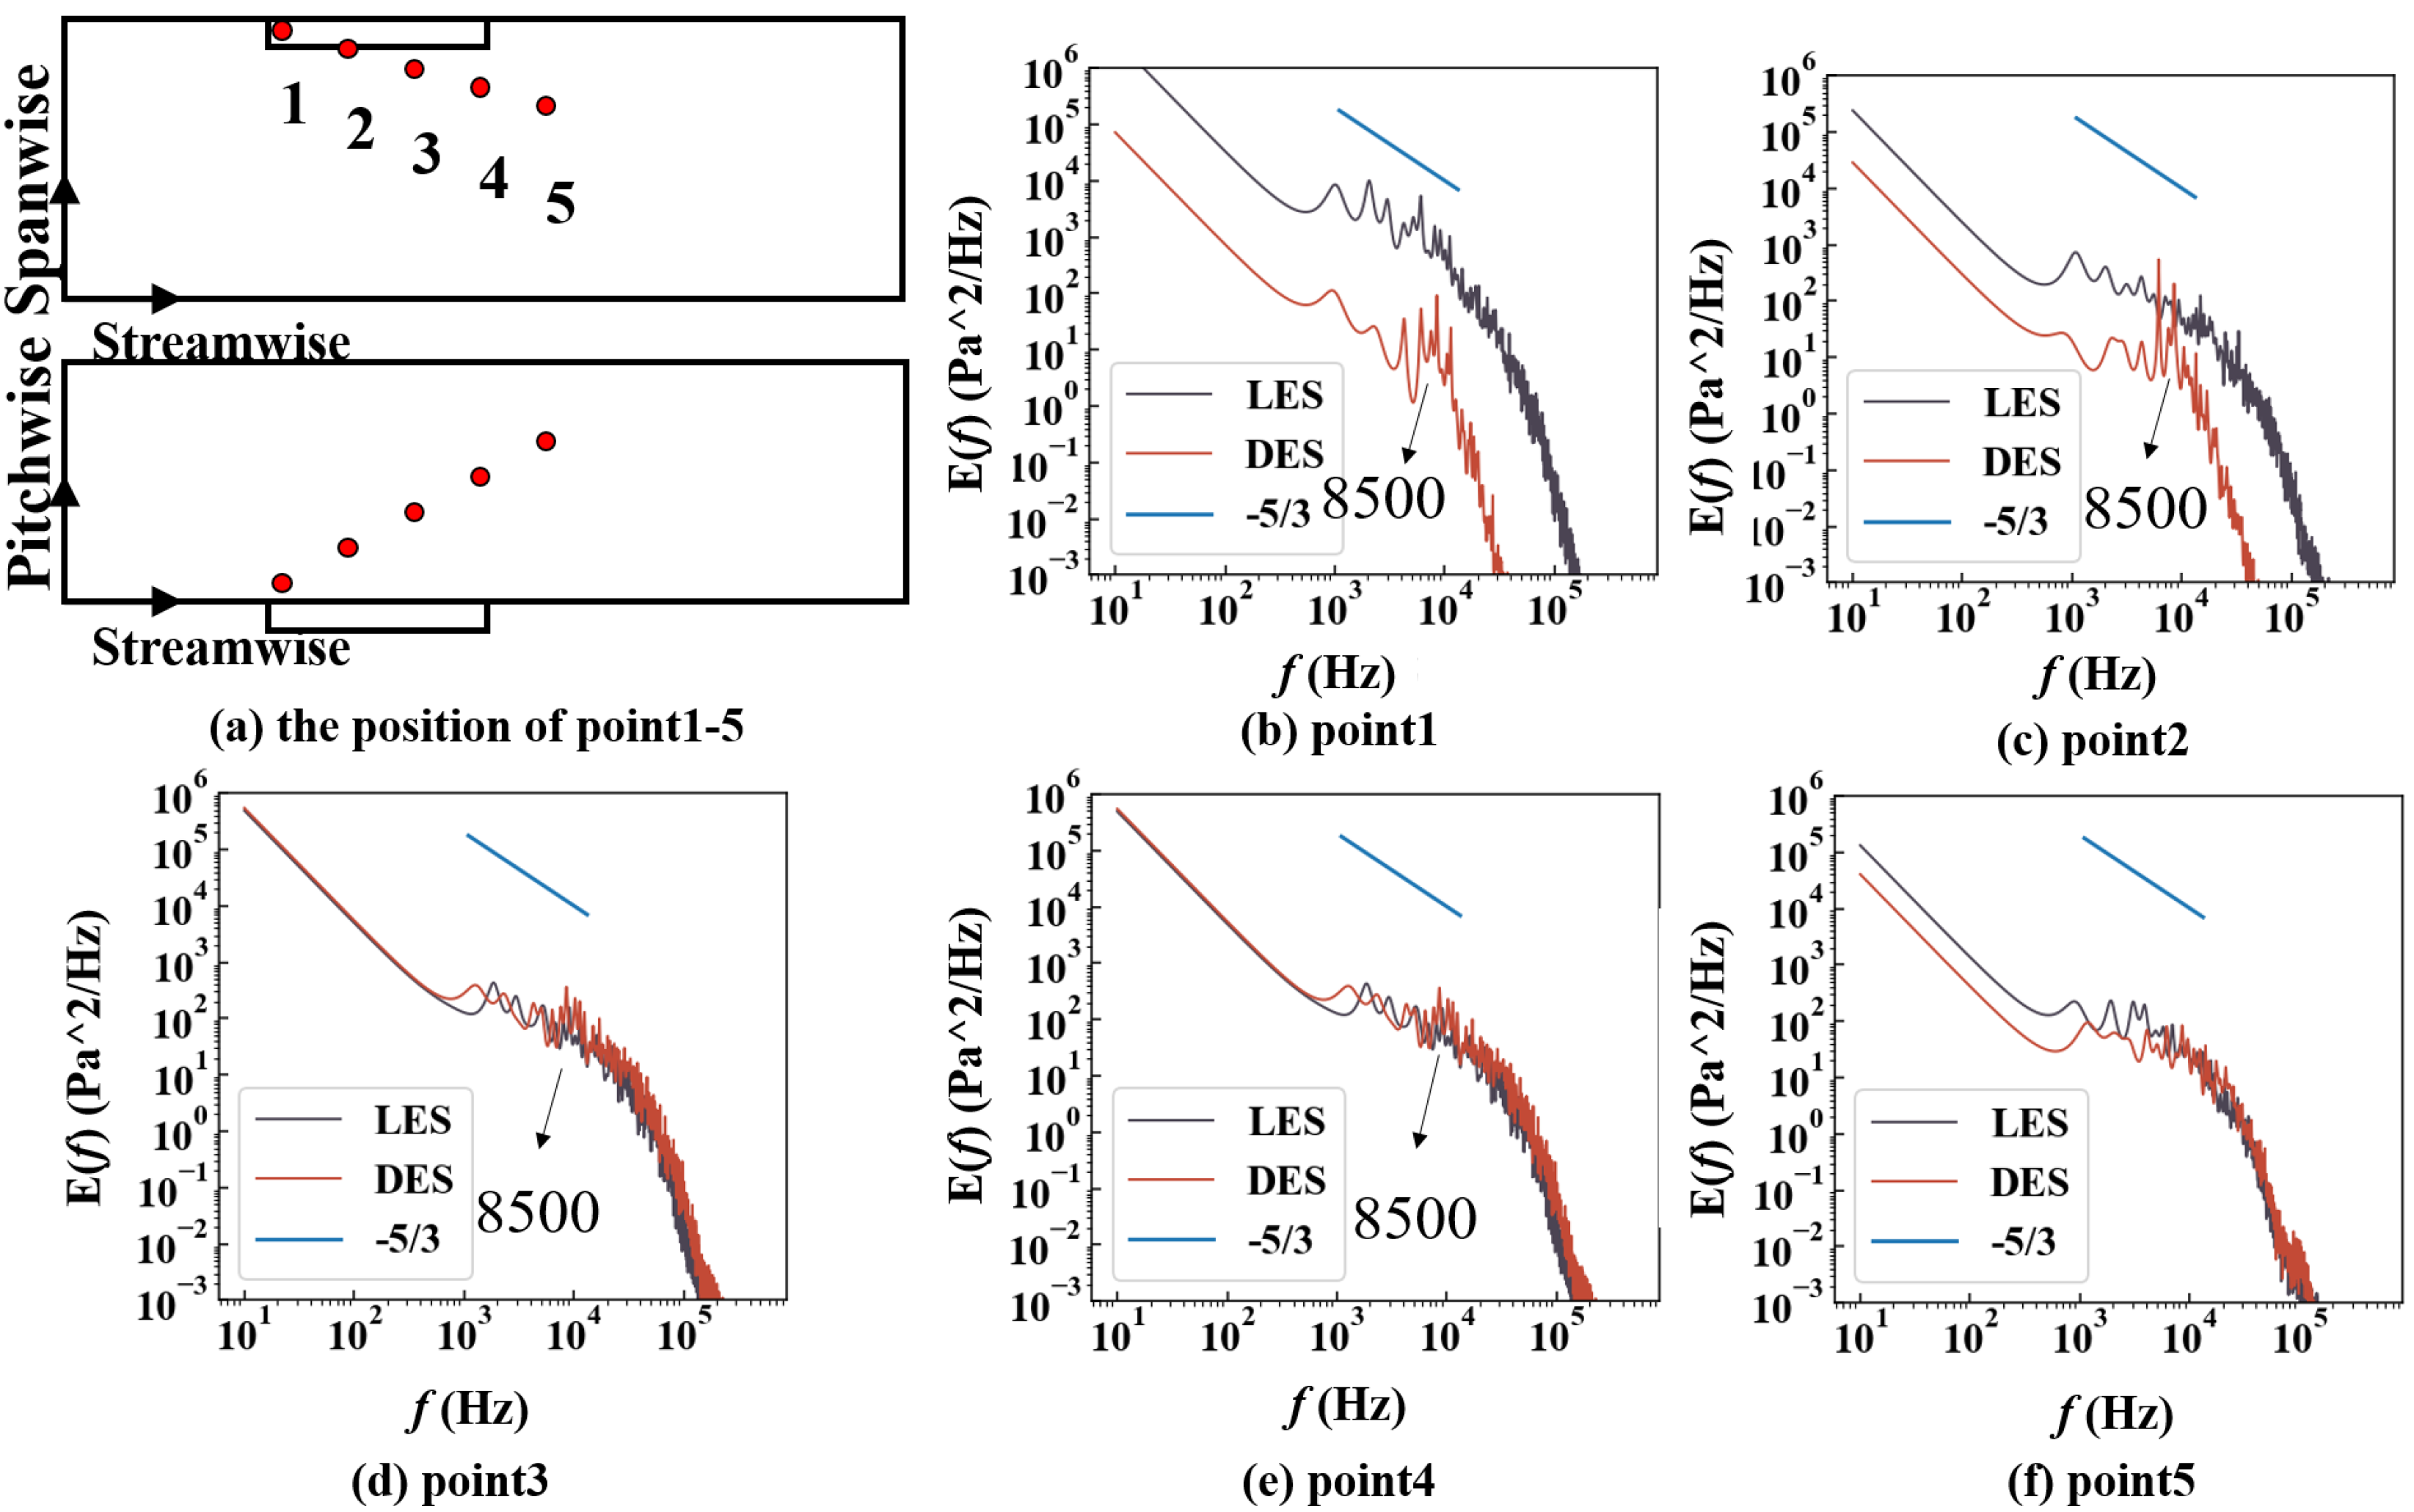
To verify the LES and DES resolution in the tip field, Figure 4 shows the power spectral density of the pressure fluctuation at five representative monitor points. Figure 4a demonstrates the positions of the detection points, where point 1 is at TLV’s starting position, and point2–point5 are arranged along the leakage vortex core’s trajectory to ensure that the numerical monitoring point remains in the fluctuating area caused by the leakage flow. The vertical coordinate E denotes the energy density at the corresponding frequency. In this study, the parametric autoregressive (AR) method based on the Burg method [43] is used for data resulting from the unsteady results, which has a good quality spectral estimate even for short data records. With a slope of −5/3 in the inertial subrange ( 10 3 to 10 4 Hz), the power spectral densities of the five monitoring points based on LES were roughly consistent, proving the reliability of the LES results.
Conversely, the DES results show that the power spectral density of the two near-wall monitoring points (i.e., point1 and point2 in the URANS region) at the beginning of the leakage vortex did not match the slope of −5/3, indicating that the TKE captured by DES at these two positions was much smaller than that of LES. Investigations also reveal that a different high-energy region from the LES results exists near the 8500 Hz frequency band, showing that the resolved TKE at point1 and point2 does not reach the LES level. At point3 and point4, however, although the power spectral density results obtained by the two methods are relatively close, slight differences still exist at 8500 Hz, indicating that the DES method has a local high-fluctuation energy region. Then, for point 5, the farthest point from the wall, the power spectral density of the DES and LES results are very similar.
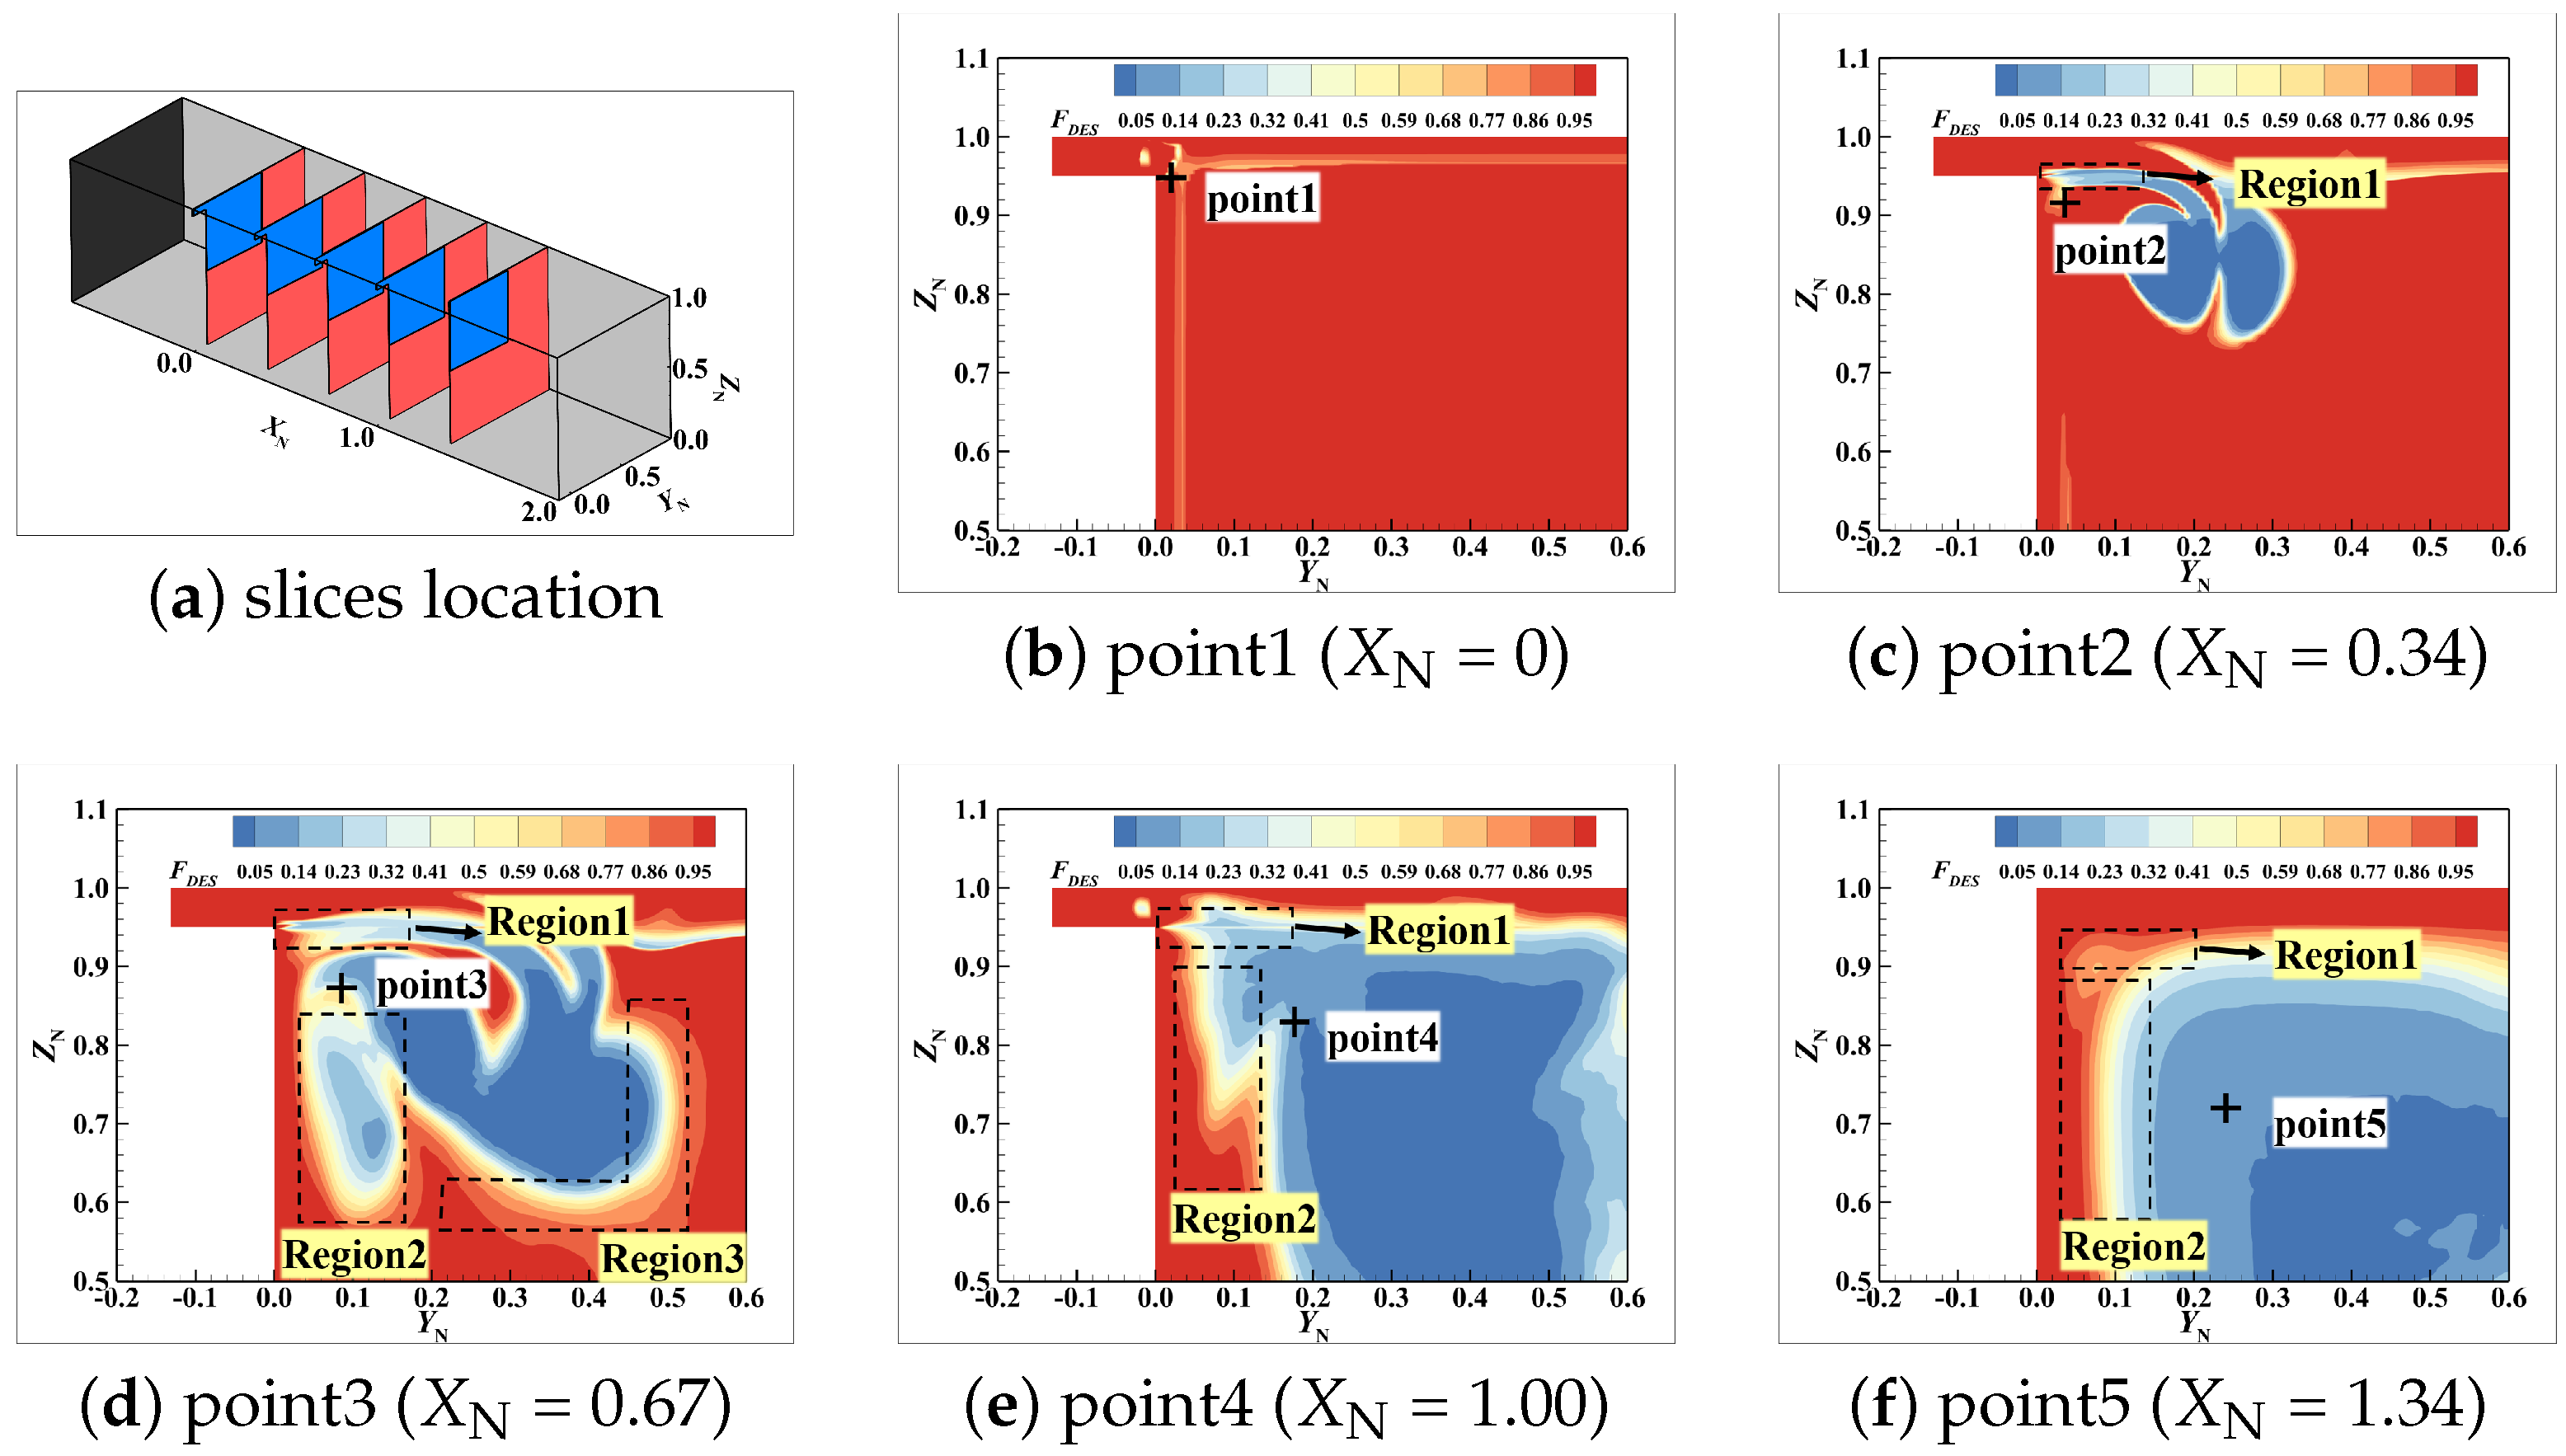
The time-average F D E S contours are given on five cross-sections perpendicular to the mainstream direction, as shown in Figure 5a. In general, although the LES is used only for large separation regions, the URANS is used for the near-wall and non-notable fluctuation regions. There is an obvious transition area at the interface between the URANS and LES, where 0 < F D E S < 1 , that is, the gray areas. Specifically, points1 and point2 reside within the URANS region, resulting in significantly reduced fluctuations compared to LES. On the other hand, points3 andpoint4 are positioned within the gray area, so although it is close to the LES results at the overall level, there is a relatively concentrated high-energy band at 8500 Hz, differing from LES. The gray area primarily appears where leakage flows leave the tip gap, interacting with the mainstream (Region 1), the region near the left wall ( Y N = 0 , Region 2), and the boundary of the large separation area in the middle of the passage (Region 3). In summary, the DES model can achieve similar results to the LES method in the resolving of turbulent fluctuation in the LES domain, whereas the difference primarily exists in the URANS region and gray areas.
Finally, the vortex structure iso-surface is based on the Liutex criterion.Compared to traditional second-generation vortex identification methods such as Q criteria, it has the following advantages: First, it can reduce the misjudgment of vortex structures near the wall caused by shear and tension. Furthermore, the Liutex method is not sensitive to the selection of thresholds, ensuring that strong and weak vortices in the flow field are identified clearly at the same time [44,45]. The iso-surfaces are contoured by the I Q v (Figure 6), which more intuitively presents the difference between DES and LES in resolving the tip clearance turbulence. This work is accomplished using the software LiutexUTA. Anyway, the I Q v is a variable used to evaluate the proportion of the resolved TKE to the total TKE [46]. A higher I Q v implies a larger percentage of resolved turbulence. For the resolved turbulence of the leakage vortex, the I Q v of the LES method is greater than 0.8, whereas the I Q v of the DES method is less than 0.8, indicating that the DES method does not reach the LES level needed for the resolved turbulence of the generation and development downstream of the leakage vortex.

3.2. The Prediction of the Critical Time-Averaged Parameters

3.2.1. Trajectory of Tip Leakage Vortex

Since previous studies have shown that the trajectory of a TLV is critical for rotating the instability of a compressor [47,48,49,50], the accuracy of the TLV trajectory prediction is crucial. Figure 7 shows the distribution of the spatial position of the TLV core extracted from the LES and DES time-averaged results, characterizing the trajectory of the TLV in the spanwise and tangential directions. The abscissa, which is normalized by the clearance length, indicates the flow direction, and X N = 0 and X N = 1 of the abscissa represent the beginning and end of the tip gap, respectively. The tangential and spanwise components are indicated by the ordinates in Figure 7a and Figure 7b, respectively. Thus, Y N = 0 represents the beginning of the tip leakage, whereas Z N = 1 and Z N = 0.95 represent the end wall and the blade top, respectively.
Although the trajectories of the TLV simulated by the two methods are similar before X N = 0.83 , diversity gradually increases after that. Specifically, in the tangential direction ( Y N ), the trajectory captured by the DES method is more biased toward the physical wall of the Y N = 0 side. Moreover, in the spanwise direction ( Z N ), the trajectory captured by the DES method is farther away from the upper-end wall ( Z N = 0 ). In summary, although the DES methods predict the trajectory of the TLV well upstream from the passage, an observed large prediction deviation exists downstream.

3.2.2. Flow Field Loss

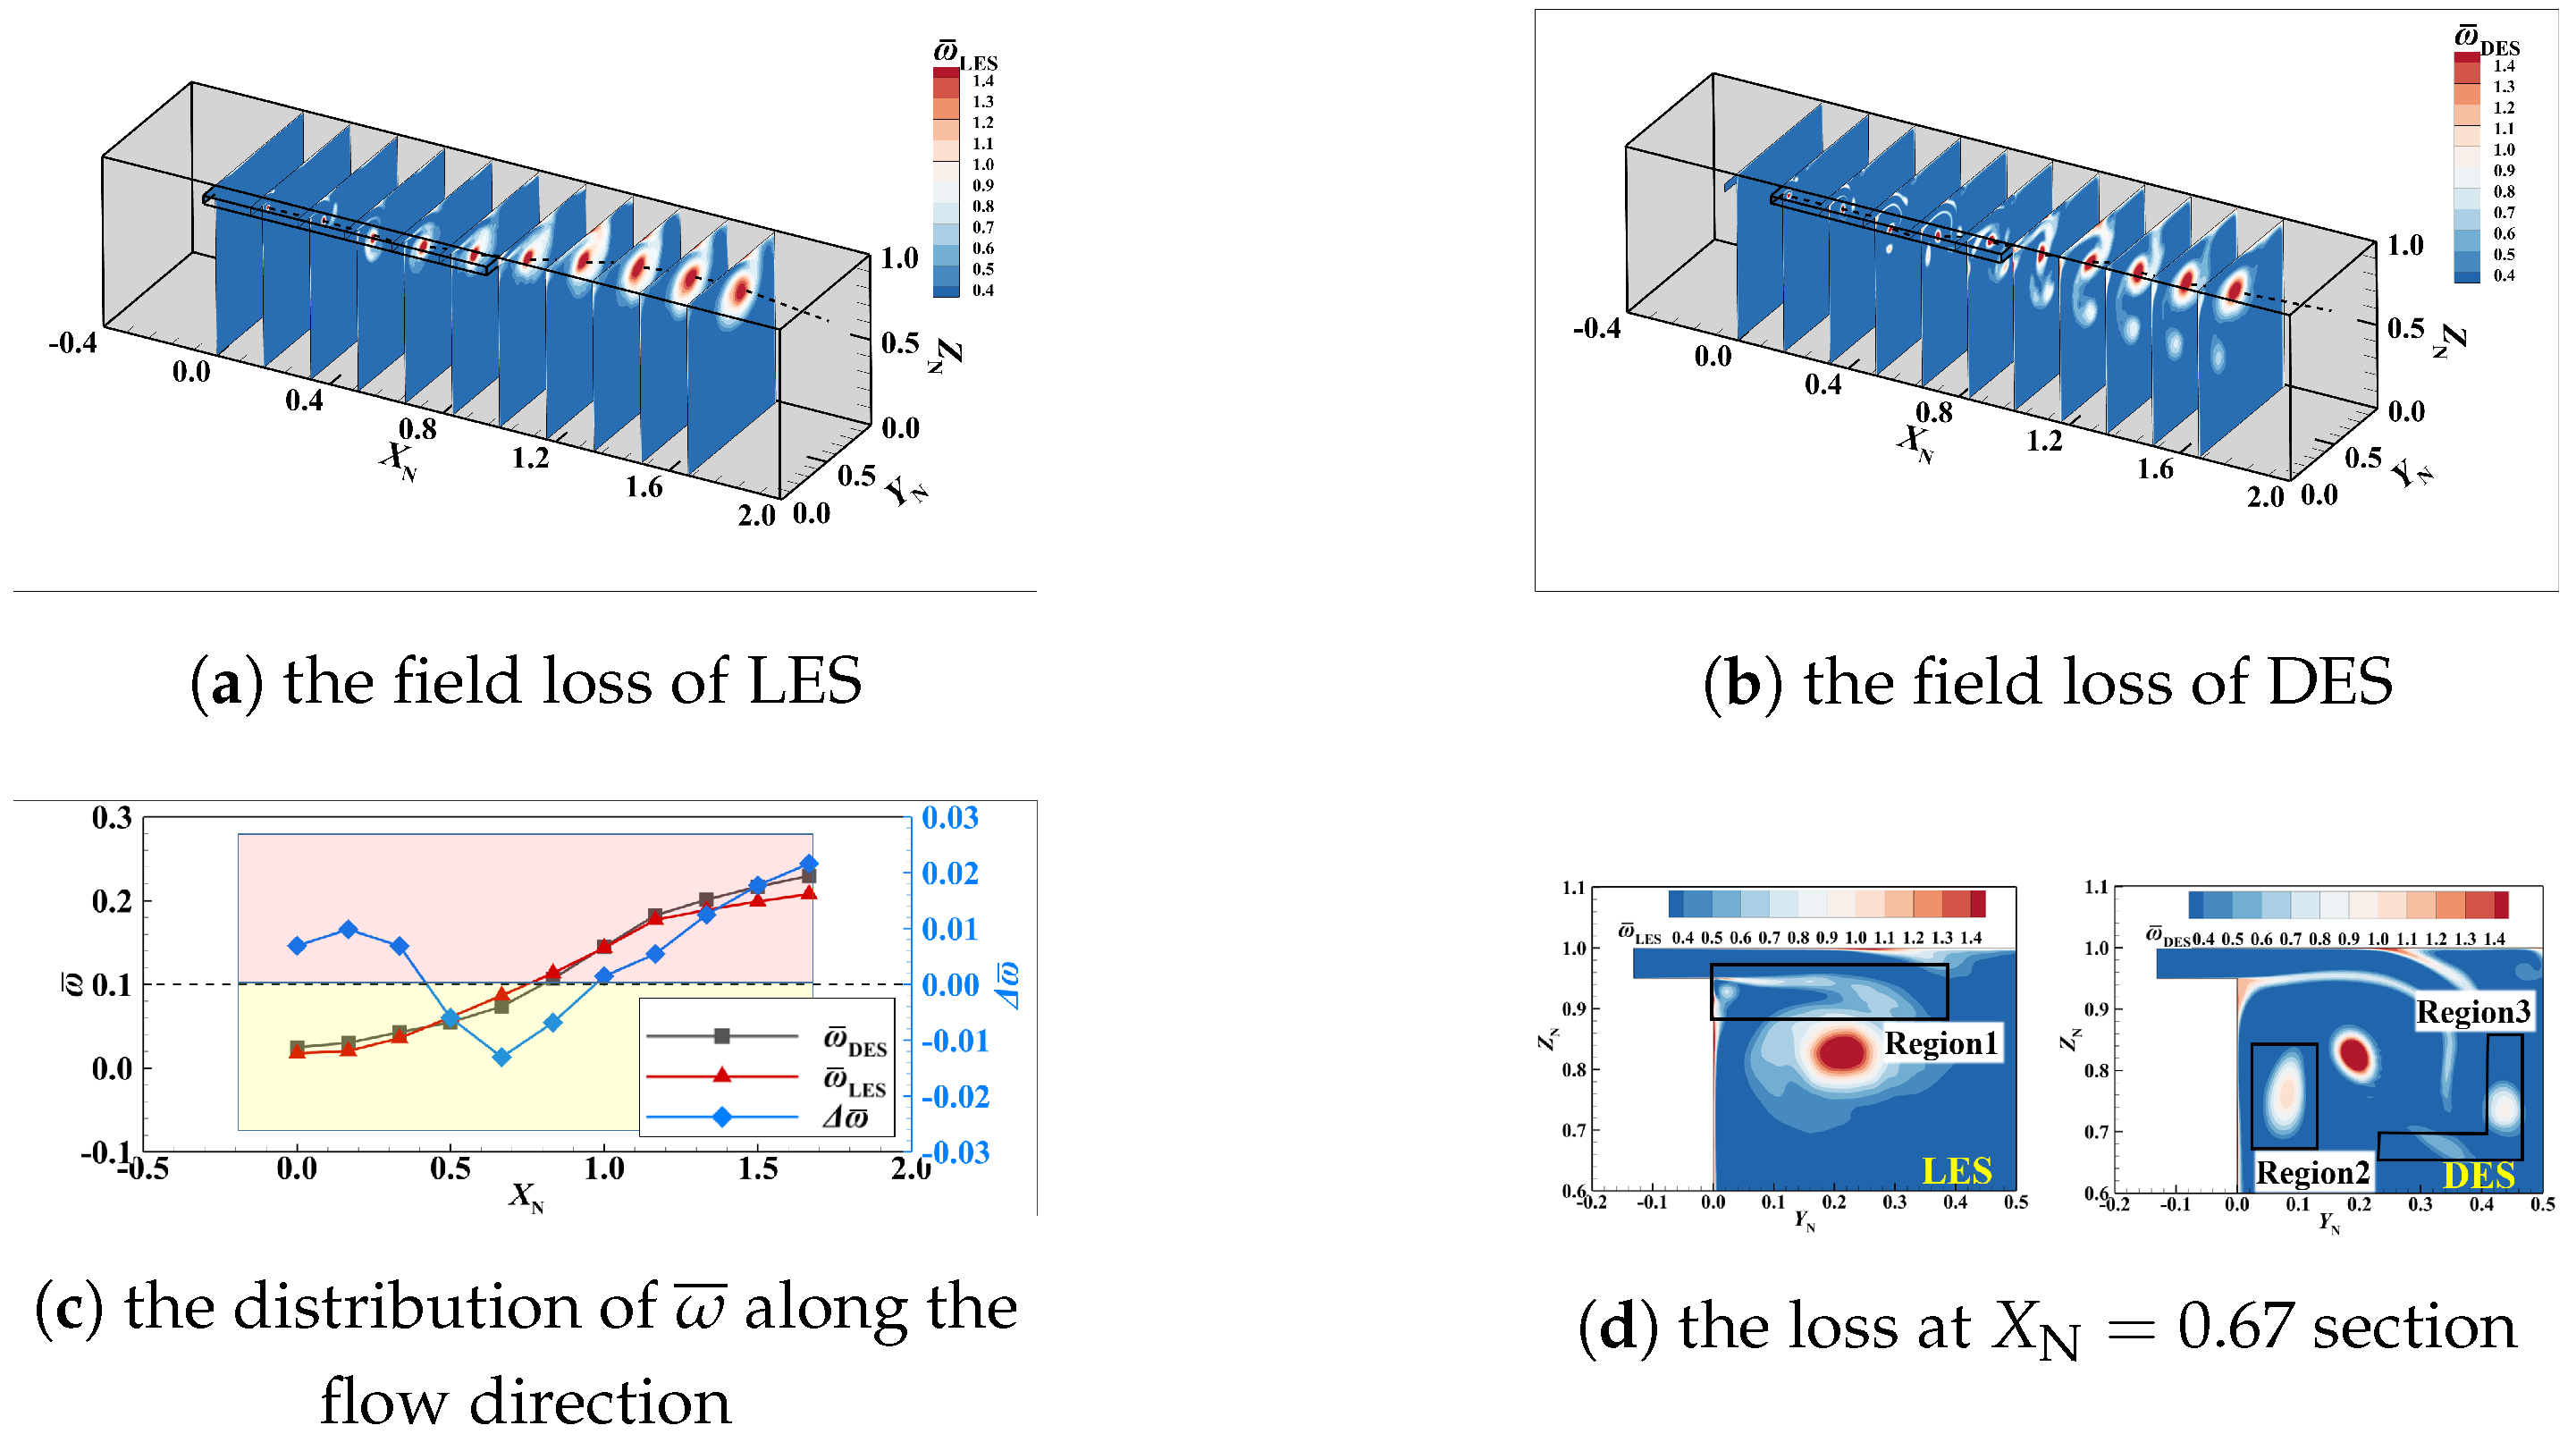
Aerodynamic loss caused by tip clearance flow is another critical impact on compressor performance, which accounts for about 20–30% of a compressor’s overall loss [1]. Accordingly, the prediction accuracy of a flow field loss in the tip region can significantly impact overall performance prediction accuracy. Figure 8a,b shows the total pressure loss ( ω ¯ ) of the LES and DES simulations, respectively, at the different cross-sections along the flow direction. The total pressure loss can be found with Equation (19), where P t in is the average inlet total pressure, P in is the inlet static pressure, and P t is the local total pressure. The black dotted line in the figure shows the position of the vortex core in the flow field, corresponding to the high-loss area in the tip flow field.
ω ¯ = P t in P t P t in P in
Subsequently, the mass-averaged loss of each cross-section is calculated and shown by the red and gray lines in Figure 8c, and the loss trends based on the DES result are roughly similar to those of LES. Therefore, from the DES and LES results, we predicted the absolute loss deviation ( Δ ω ¯ ) to show the position where the two methods largely deviated from the loss (Equation (20), blue line in Figure 8c corresponding to the right ordinate).
As shown in Figure 8c, the maximum deviation of the loss is at the X N = 0.67 cross-section, where the loss calculated by DES is lower than that of LES. Conversely, the loss predicted by DES downstream ( X N > 1 ) is higher than that of LES and the deviation gradually increases along the flow direction. Since the wake disturbance is ignored in the simplified model, the downstream loss deviation comes from upstream mispredictions. Figure 8d shows the detailed loss contours at the X N = 0.67 cross-section where the deviation reaches the maximum. The main gray areas marked in Figure 5 are also given here. It can be observed that positions with large loss deviation are very close to the gray areas, i.e., Region 1, Region 2, and Region 3. From these results, it can be inferred that the deviation in loss prediction is closely related to gray areas.
Δ ω ¯ = ω ¯ DES ω ¯ LES

3.3. Mechanism Analysis of the Time-Averaged Parameters Difference Based on Detailed Flow Structures

3.3.1. Detailed Structure of Tip Leakage Flow

Based on the Liutex method of the LES and DES results at a certain time, Figure 9 shows the transient vortex structure where contoured by local static pressure, the iso-surface is L i u t e x mag = 10 , 000 , and the minimum pressure is TLV’s vortex core position. As specifically shown in Figure 9a, the TLV predicted by LES is generated at the starting position of the tip gap ( X N = 0 ) ; it is also surrounded by secondary leakage vortex (STLV) during the downstream developments. The red box in Figure 9a shows that the STLV generates at the position of ( X N = 0.2 ) , enters the square passage in several strands, and gradually confluences into the TLV. Anyway, there is an IV induced by the shear effect of the leakage flow outside the TLV (Y+) near the upper-end wall. Furthermore, the vortex core of the IV shakes and corkscrew-shaped twists during the downstream development and then breaks up into large-scale turbulence at ( X N = 0.4 ) , which is a spiral-type vortex breakdown [47]. Subsequently, the broken vortex structure and the TLV interfere with each other.
Conversely, Figure 9b shows the DES transient vortex structure. Although the TLV and IV are captured similarly to the LES results, the DES results show that IV develops into two branches, i.e., IV1 and IV2, at ( X N = 0.35 ) . The IV1 develops downstream and surrounds the TLV. Its trajectory appears anticlockwise around the TLV along the flow direction, and the vortex core begins to shake at ( X N = 0.75 ) , breaking at ( X N = 0.90 ) . The other branch IV2 always exists outside the TLV, and the vortex core begins to shake and break at ( X N = 0.72 ) . According to Lucca’s theory [47], vortex breakdown is related to strong local fluctuations. However, the flow field fluctuation energy captured by DES in the passage is smaller than that of LES (shown in Figure 4), making the IV less likely to break.
In summary, from the perspective of vortex topology capture in the tip region, DES does not correctly capture the generation of the STLV and the IV’s spiral-type breakdown phenomenon. Importantly, it is noted that the simplified model neglects the structures at the leading and trailing edges of the blade, adverse pressure gradients in the passage, and the tangential passage contraction process when the airflow enters the blade tip gap. So in a real situation, other complex vortex structures, such as passage vortex and separation vortex, should be considered. These will affect the trajectory, strength, and vorticity of the leakage flow through energy exchanges such as mixing and squeezing.Anyway, the influence of adverse pressure gradients can result in an earlier breakdown of the TLV.
Unfortunately, it is difficult to identify the interactions between various vortex structures only through the transient vortex, thus complicating the evaluation of these two unresolvable detailed structures on other parts of the flow field. Fortunately, with the SPOD method, we can extract structures corresponding to the main frequency fluctuations in the flow field to illustrate the interactions between different vortex structures and, in turn, further elucidate the impact of these two structures on the flow field.

3.3.2. The Dominant Flow Structures in the Tip Leakage Flow Field

In this section, we thus use the SPOD method to decompose and reconstruct flow field data, finally extracting the crucial flow field structures corresponding to main flow field fluctuations.
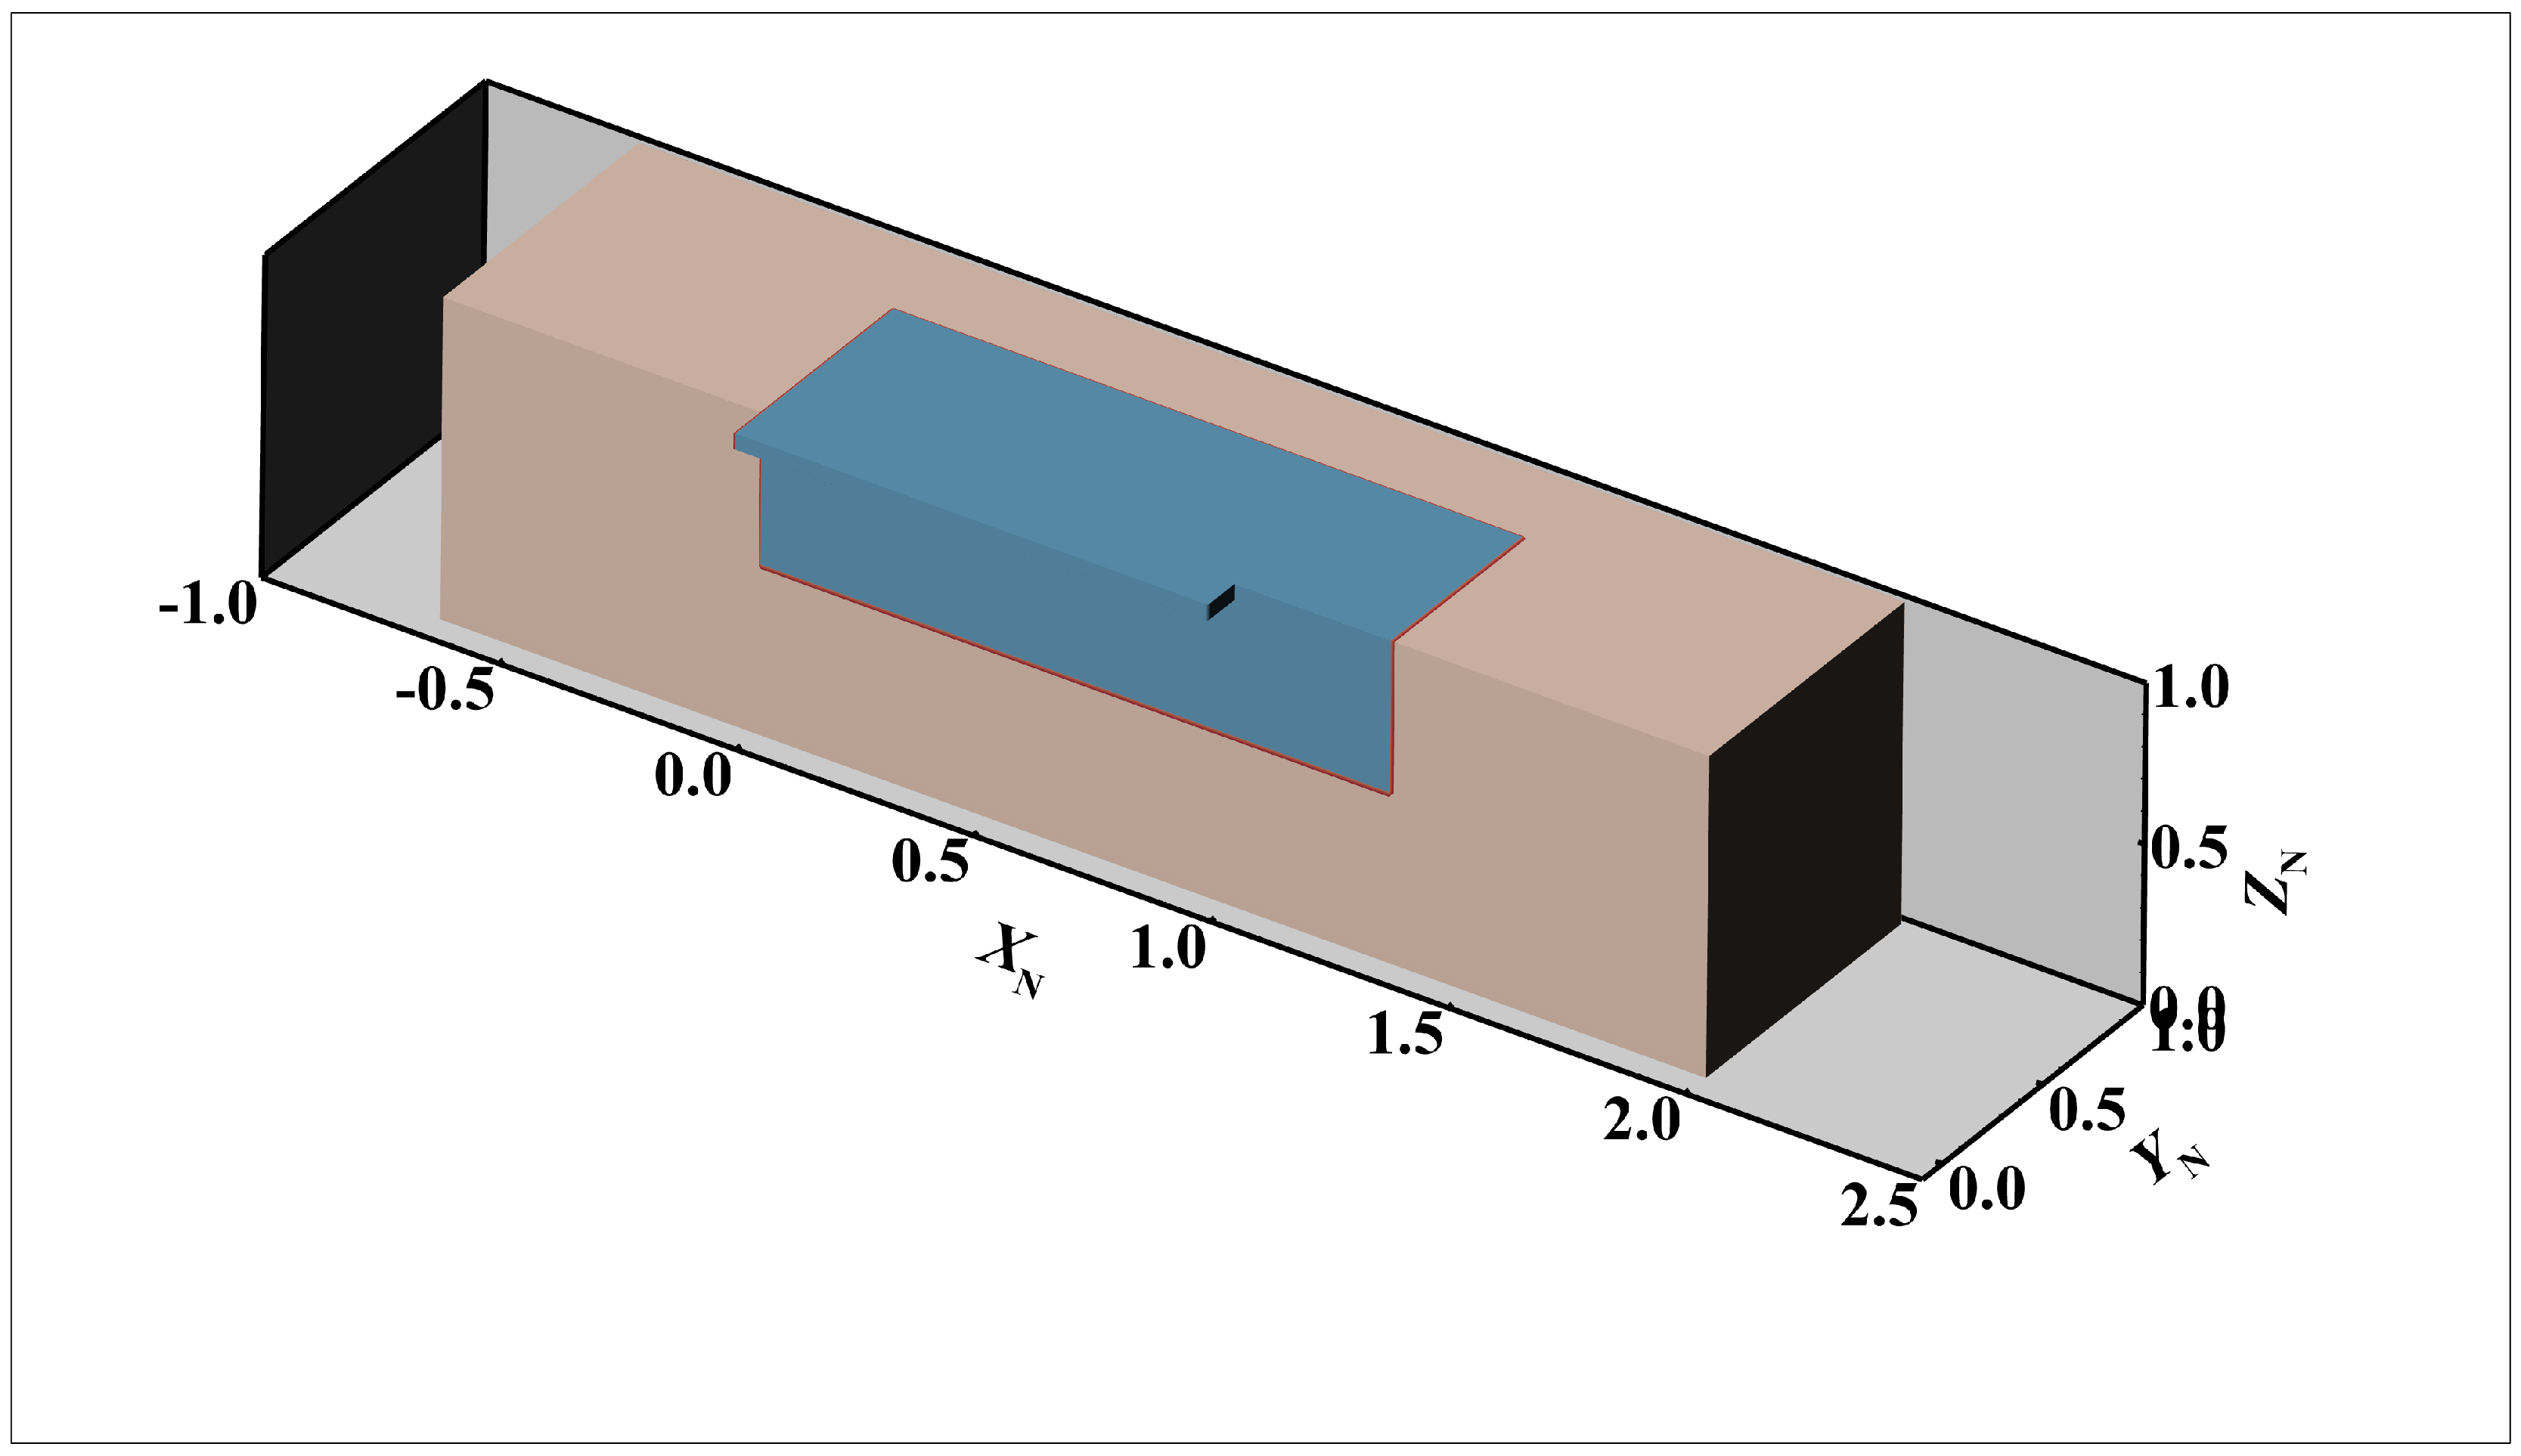
Extracting the static pressure data from the blue region in Figure 10 for the SPOD decomposition, the flow direction, tangential direction, and spanwise range are X N [ 0 , 1.2 ] , Y N [ 0.013 , 0.6 ] , and Z N [ 0.5 , 1.0 ] , respectively. The input data are the flow field snapshots at 2048 moments, each of which contains static pressure fluctuation data at 6.82 million spatial points. Anyway, the physical time interval between the two snapshots is 5 × 10 6 s, namely 5 × Δ t p h y s i c a l . Moreover, the data are divided into eight block matrices (i.e., N b = 8 ). The snapshot number N f in each block matrix is 1024, and the overlapping snapshot number N o between two blocks is 880. The Hanning window is selected as the window function. The weight function W of each cell is based on the normalized volume of the local grid W = V i / V ¯ . Finally, we complete the calculation and reconstruction of the SPOD decomposition using a 2T memory computing node on the Tianhe II server.
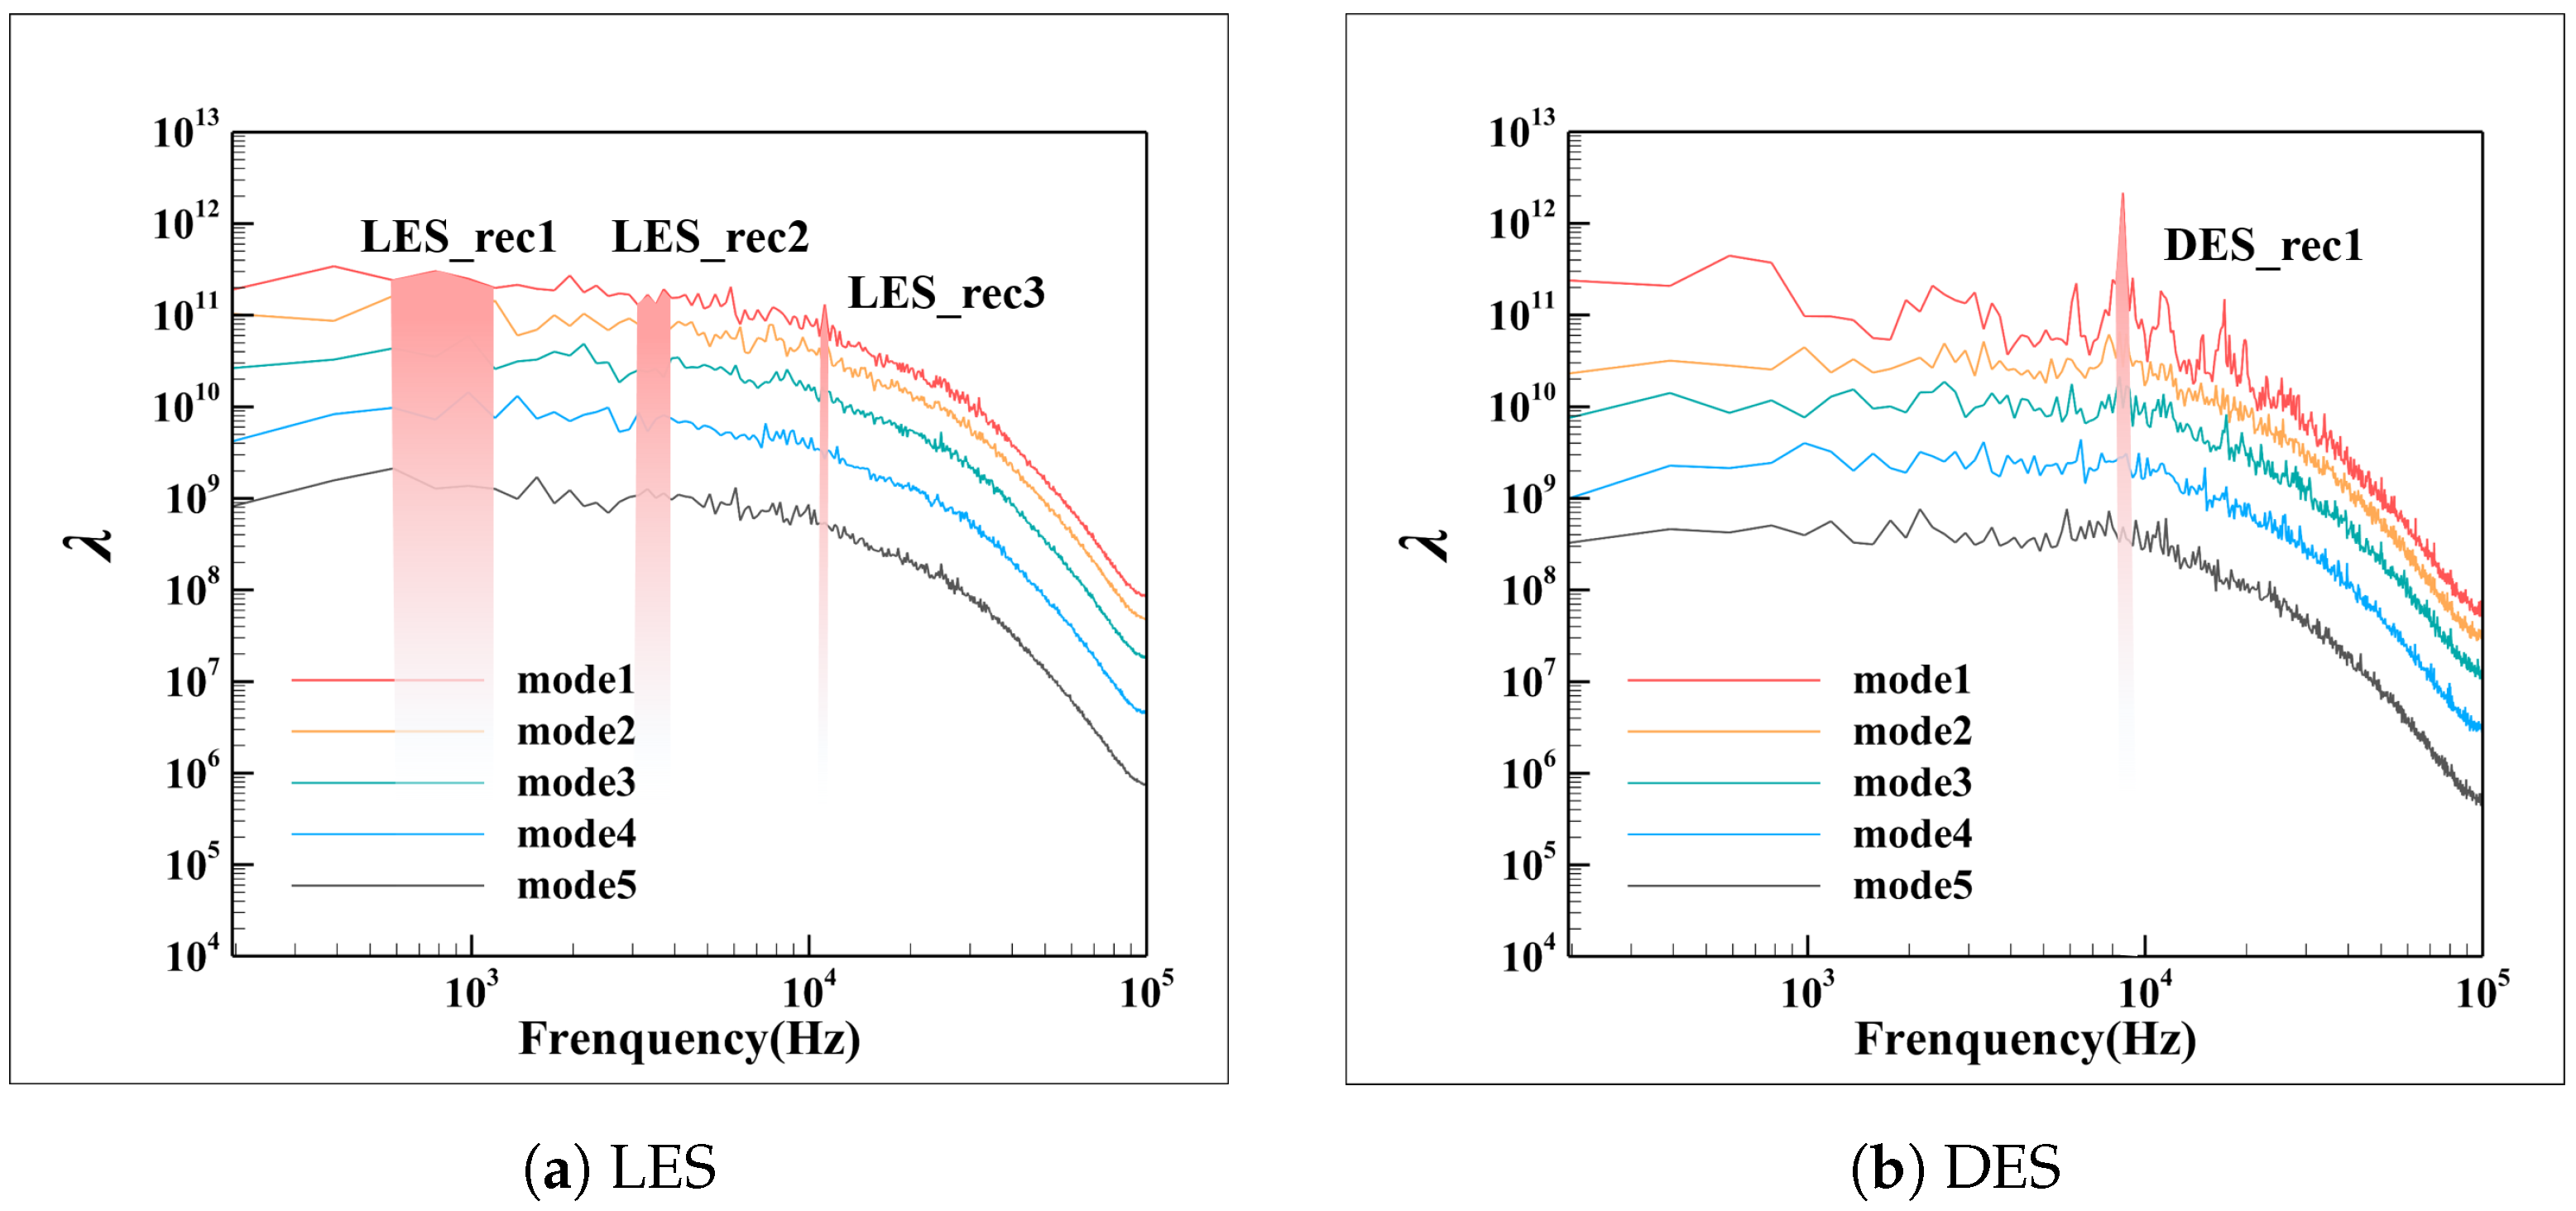
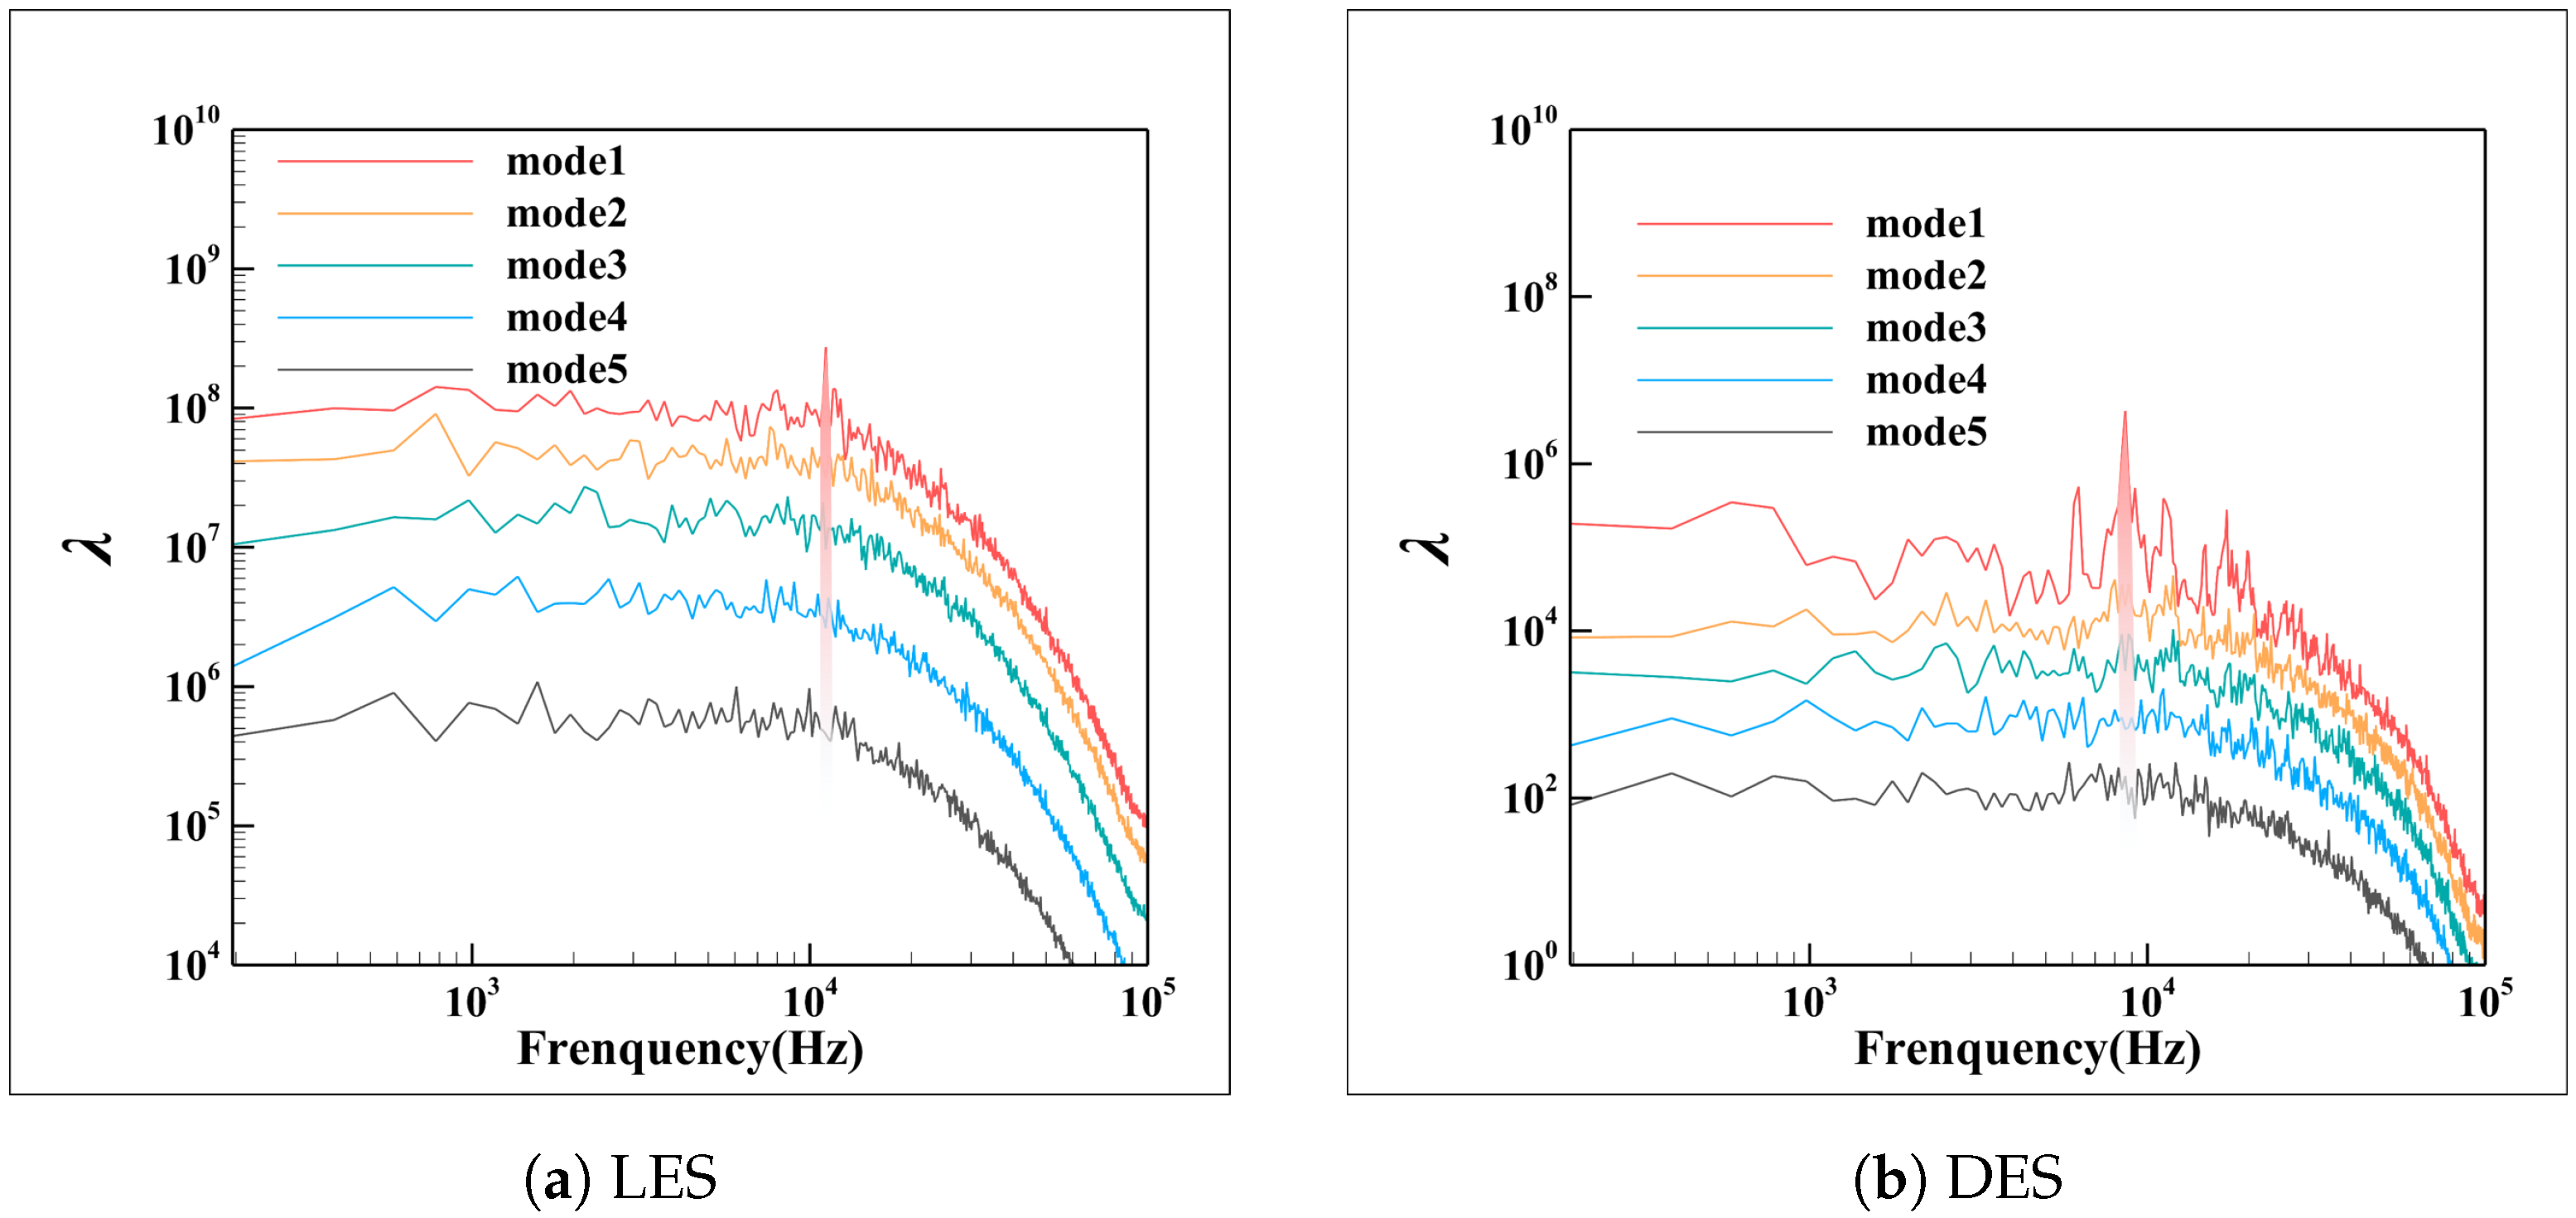
Figure 11 shows the energy spectrum of the first five modes obtained by SPOD decomposition. It can be seen that since the energy ratio of the first-order mode is significantly higher than the others and the energy ratio of the fifth-order mode is tiny, the modes after mode 5 are negligible here. Overall, from the energy spectrum perspective, the LES results exhibit the following characteristics: (1) mode 1 and mode 2 occupy the majority of the fluctuation energy and the energy distribution of both are close, being high in low frequency and low in high frequency; (2) the energy frequency band is rich, possessing both multi-band and wide spectrum characteristics. Conversely, the DES result is quite different: (1) the fluctuation energy is primarily concentrated in mode 1, with a higher energy distribution at a specific frequency (8000–9000 Hz); (2) the main frequency band occupies the majority of fluctuation energy, whereas the high-frequency energy band is narrow. Compared with the rich frequency distribution of LES, the flow field simulated by DES has a significant dominant frequency; that is, high-energy fluctuations are captured within 8000–9000 Hz.
Since the coherent structure with a high fluctuation energy has the most significant influence on the flow in the unsteady flow field, we selected high-energy frequency bands with the first-order modes from the LES and DES results for flow field reconstruction. Table 2 shows the selected frequency bands. The reconstruction result is the superposition of the flow field at a selected frequency band in the first-order mode.
Figure 12 shows the reconstructed flow field at a specific frequency obtained by the LES and DES methods, respectively. The red and green iso-surfaces are the pressure fluctuation iso-surfaces in the reconstructed flow fields corresponding to the specific frequency. They indicate the main fluctuation position. Due to the fluctuation energy differences corresponding to each frequency band, we varied the values of the iso-surface to show the core fluctuation position in the reconstruction results of the specific, as depicted in the figure. The blue iso-surface in each figure is L i u t e x mag = 10 , 000 , representing the vortex structure of a transient flow field. It could intuitively reflect the physical phenomena corresponding to the main fluctuation.
For the LES results, the reconstructed flow field LES_rec1 with a low frequency of 700–1000 Hz is shown in Figure 12a. The fluctuation amplitude of this frequency band is the largest, and the major source of fluctuation is the shake of the TLV core. In the reconstructed flow field of LES_rec2 (Figure 12b), the pressure fluctuation appears in the upstream region of the TLV and the IV in the space of X N [ 0 , 0.32 ] , and the downstream region of the interaction between the two vortices of X N [ 0.32 , 0.70 ] . In the pressure fluctuation flow field corresponding to the high frequency of 10,500–11,500 Hz, as shown in the black box in Figure 12c, the fluctuation position is more complicated, which is the mixing result of the generation of the STLV, the breakdown of the TLV and IV. On the contrary, from the reconstruction results of DES in Figure 12d, the fluctuation of the flow field comes from the breakdown of the two IV branches and the interference with the TLV.
Overall, the above results indicate that the main fluctuation sources of the LES flow field from large to small are as follows: the TLV core shake(located along the leakage flow), the interference between IV and TLV(mainly located upstream of the leakage), and the influence of STLV (mainly located at the middle and downstream of the leakage). Additionally, we observed that the major fluctuations captured in the DES results only come from the IV, comprising the breaking of the IV1 and IV2, and their interference mixing with the TLV (downstream of the leakage).

3.3.3. Impact of Dominant Flow Structures on Time-Averaged Parameters

(1)
Reasons for the differences in tip leakage flow trajectory
As shown in Figure 13a, the trajectory of the leakage vortex in the numerical flow field of LES is affected by two vortex structures in the tangential direction, namely the IV and STLV. The STLV acts on the TLV in the Y+ direction through viscous shear. The vector of the IV is opposite to the vector direction of the TLV, rotating clockwise along the flow direction. Therefore, there is a Y- direction force on the leakage vortex in the tangential direction. The leakage vortex trajectory is the result of the combined action of these two forces in different directions. From the SPOD decomposition results, the effect of the STLV is more notable after X N = 0.4 (Figure 12c). The effect of the IV on the leakage vortex, before and after the vortex breakdown, is mainly in the range of X N [ 0 , 0.7 ] , as shown in Figure 12b. It means that the trajectory of TLV is only affected by the force of the STLV in the Y+ direction after X N > 0.7 .
The SPOD decomposition results (Figure 12d) show the numerical field of DES, with the trajectory of the TLV being mainly affected by the two IV branches. As shown in Figure 13b, although the vortex vector directions of the two branches are the same, the directions of the force acting on the TLV are different due to their different spatial positions. The force of IV2 on the outer side of the TLV is along the Y- direction. For IV1, in the range of X N [ 0.6 , 0.9 ] , because it is located inside the leakage vortex, its tangential force on the leakage vortex is along the Y+ direction, and the leakage vortex trajectory is affected by two IV branches. After X N > 0.9 , IV1 has turned to the upper side of the leakage vortex and broken, providing an obvious force along the Z-direction.
In summary, within X N [ 0 , 0.9 ] , the leakage vortex in the LES and DES flow fields is affected by the forces in two different directions in the tangential direction. Although the sources are different, the trajectory of the TLV is relatively close from the time-average point of view. However, after X N > 0.9 , because the leakage vortex in the LES flow field is only affected by the STLV of the Y + force, the trajectory is more inclined to Y+, whereas the DES is only affected by the IV2 with Y- direction force. In the spanwise direction, the IV1 turns to the upper side of the leakage vortex at X N > 0.9 , and the vortex core expands and squeezes the TLV, resulting in the TLV trajectory more biased towards Z- direction based on DES. It can be concluded that the difference in the prediction of the STLV and IV development is the main reason for differing downstream leakage vortex trajectory predictions.
(2)
Reasons for the differences in flow loss
In the simplified model, the source of the loss is relatively straightforward because no complex physical phenomena, such as separation caused by shock waves, wakes, and adverse pressure gradients, exist. Theoretically, the flow loss (non-near wall) in the simplified model mainly comes from flow shear and vortex mixing. The SPOD decomposition results show that the vortex interaction mainly appears in the X N > 0.4 region rather than X N [ 0 , 0.4 ] , which indicates that the loss in X N [ 0 , 0.4 ] is dominated by flow shear. Figure 8c proves that the loss in the X N [ 0 , 0.4 ] region is only within 5%, which is smaller than that downstream. Therefore, we mainly analyze the causes of the loss differences in the range of X N > 0.4 .
Furthermore, according to the SPOD decomposition results (Figure 12b) from the flow field simulated by LES, the major fluctuation appears in X N [ 0.4 , 0.7 ] where the breakdown of IV occurs, which implies that the vortex breakdown is the main source of the loss. In contrast, instead of breaking, the IV of the DES flow field develops into two branches IV1 and IV2, causing the main fluctuations at Region 2 and Region 3 in Figure 8d, which dominates in the loss of this range. Subsequently, due to the breakdown of the IV1 and IV2 in the DES flow field, the range of X N > 0.9 becomes the main fluctuation region according to the SPOD decomposition results (Figure 12d), whereas the fluctuation in the LES flow field here has stabilized after mixing. In consequence, the loss predicted by DES is small in X N [ 0.4 , 0.7 ] and large in X N > 0.9 , according to Figure 8c. Therefore, it can be concluded that the difference in the capture of the IV development is the main reason for loss prediction differences.

3.3.4. The Reason for Inaccurate Prediction in Detailed Structures

In a word, caused by the failure of DES to capture the IV breakdown and STLV generation accurately, the above analysis showed inaccurate tip leakage vortex trajectory and loss prediction. Accordingly, investigating what factors lead to this inaccurate capture and the importance of the gray areas is necessary.
In order to reveal the correlation mechanism between DES gray areas and differences in the capture of the detailed unsteady flow structures, the X N = 0.67 cross-section was extracted for SPOD decomposition and to reconstruct the main fluctuation flow field. The q = [ p , V x , V y , V z , Δ s ] is chosen as the fluctuation snapshot, and the weight function is shown in Equation (21), following the principle of total disturbance energy [51] that the energy of fluctuation contains the turbulent energy, the entropy potential, and the pressure potential. The input data are snapshots of the flow field at 2048 moments, each containing static pressure fluctuation data at 46,000 spatial points. Other relevant settings are consistent with Section 3.3.2. The multi-parameter fluctuation SPOD energy spectrum of the X N = 0.67 slice is shown in Figure 14. The 10,600–11,500 Hz and 8000–9000 Hz frequency bands in the first-order mode representing the main fluctuation in LES and DES are reconstructed, respectively, and the reconstruction results are shown in Figure 15. The contour is pressure fluctuation, and the vector is the projection of this section’s velocity fluctuation. At the same time, the partially enlarged view in Figure 15 gives the tangential velocity gradient in the spanwise direction.
E = 1 2 V R T ¯ ρ ¯ ρ 2 + R ρ ¯ ( γ 1 ) T ¯ T 2 + ρ ¯ u i 2 d V = 1 2 V 1 γ p ¯ p 2 + ( γ 1 ) p ¯ γ R 2 Δ s 2 + ρ ¯ u i 2 d V
It is evident from Figure 15 that noticeable tangential velocity gradients are generated when the secondary leakage flow ejects from the tip gap and shears with the mainstream and consequently forms the Kelvin–Helmholtz (K-H) instability in the area enclosed by the black box. Driven by K-H instability, the shear layer generates strong unsteady fluctuations. Subsequently, it forms STLV along the tangential direction, corresponding to the black dotted arrow in Figure 15a, and finally confluences into the TLV. This result is similar to that shown in the high-energy fluctuation reconstruction results of SPOD in Figure 12c, indicating that the STLV structure comes from K-H instability.
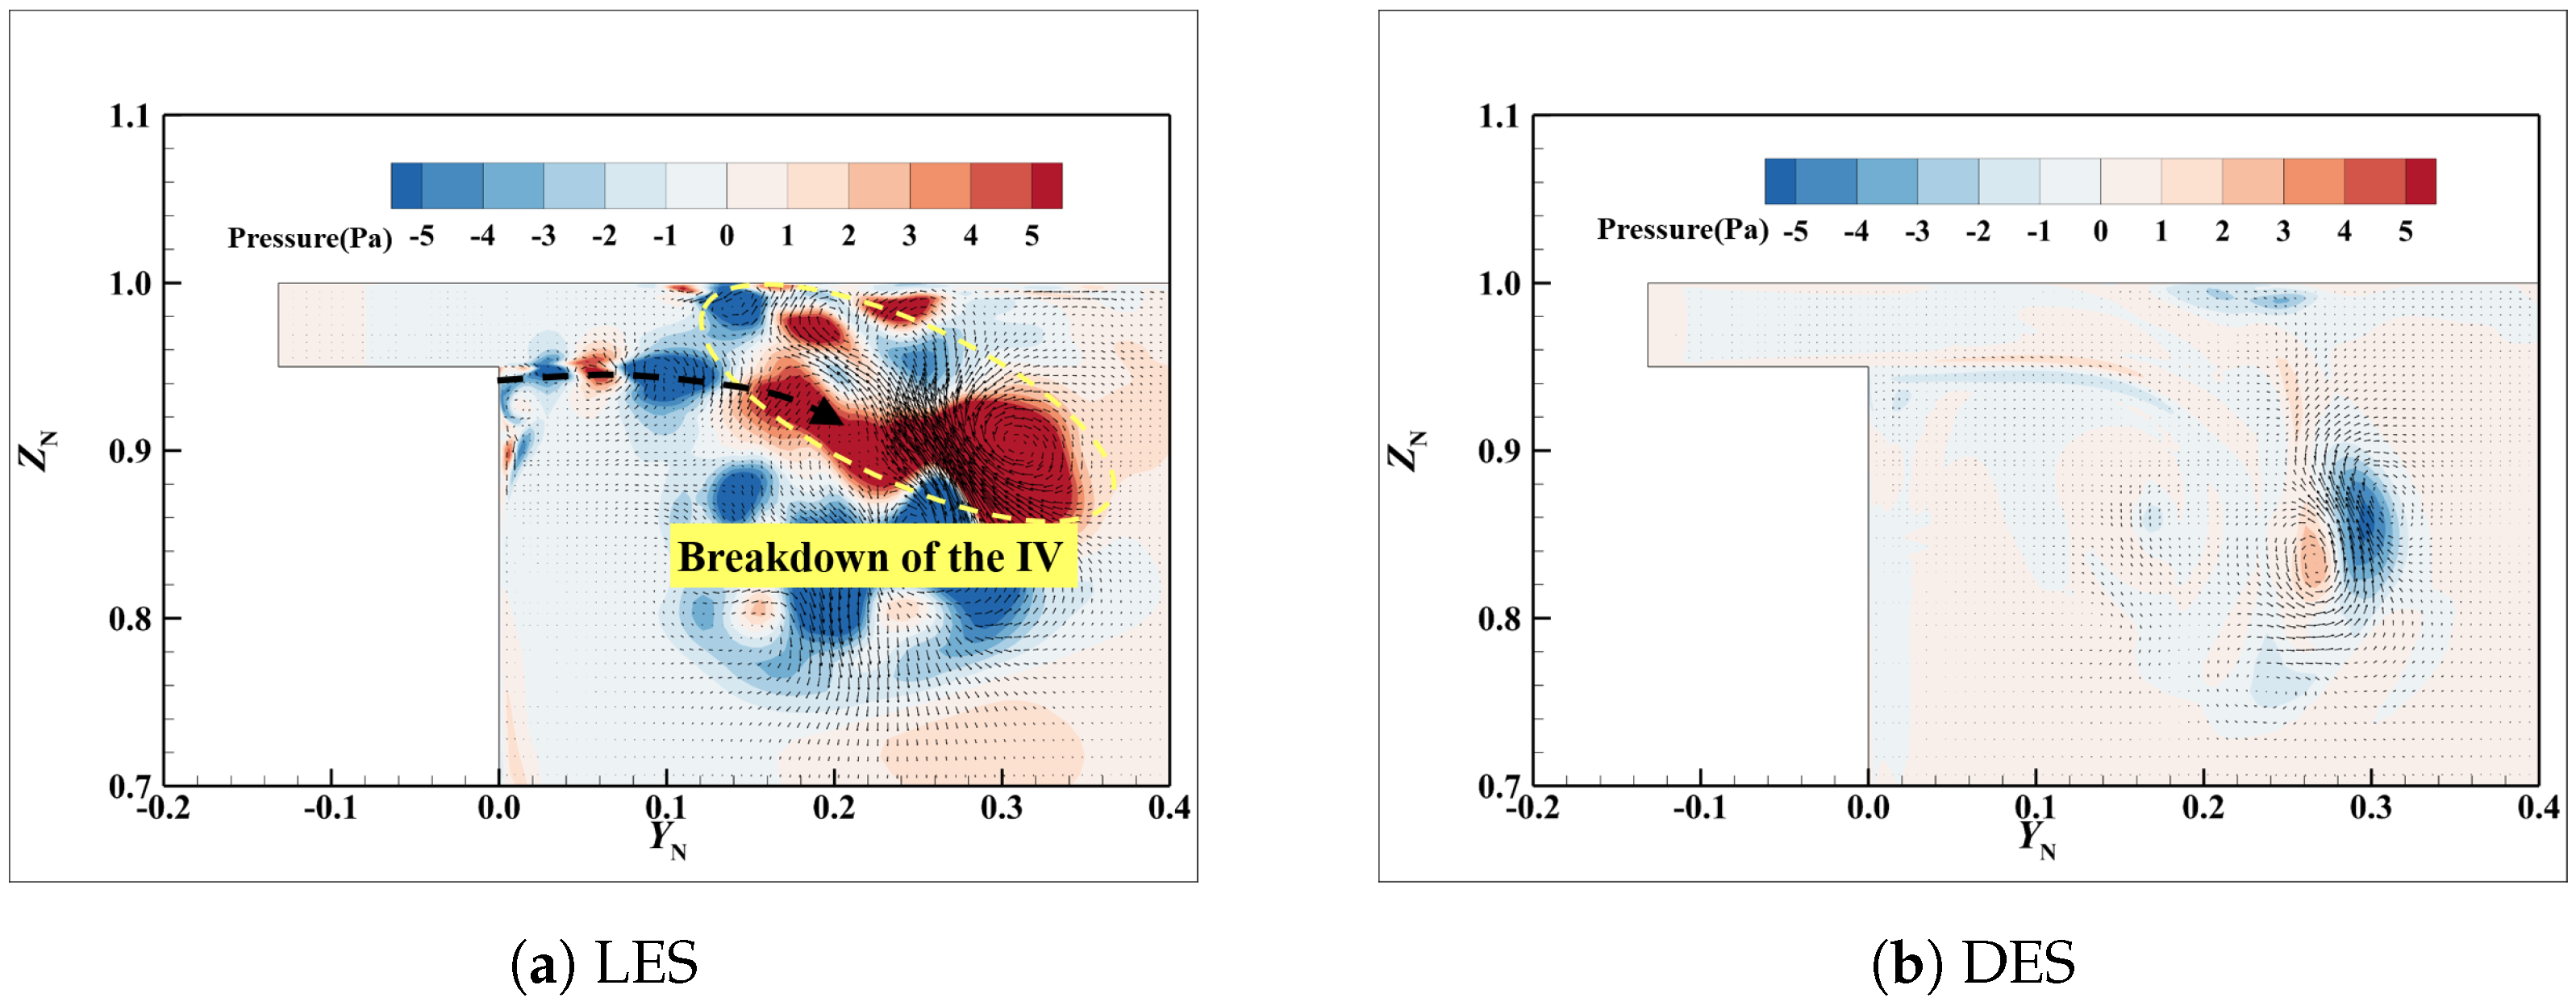
To explore the reason why the IV in the DES result is unbroken at the position X N = 0.4 , the reconstruction results of the high-energy bands based on SPOD multi-parameter decomposition at the X N = 0.34 slice (the upstream position of the breakdown of IV) are given in Figure 16. It can be intuitively seen that the pressure and velocity fluctuation captured by LES is obviously larger than that of the DES method. The yellow dotted area corresponds to the IV range. It is obvious that IV breaks under the impact of the secondary leakage fluctuation, corresponding to the black dotted arrow in Figure 16a. On the contrary, the fluctuation of the secondary leakage flow is suppressed in the DES results (Figure 16b), and accordingly, the insufficient TKE causes the IV not to break up. Subsequently, IV develops downstream into IV1 and IV2. In other words, the fluctuation of STLV is the main reason for the breakdown of IV.
In the DES simulation, the K-H instability is in the Region 1 gray area, where the leakage flow ejects out of the gap channel and shears with the mainstream. Due to the slow transition from the RANS region to the LES region, the K-H instability is suppressed, and the unsteady fluctuation cannot be correctly analyzed.
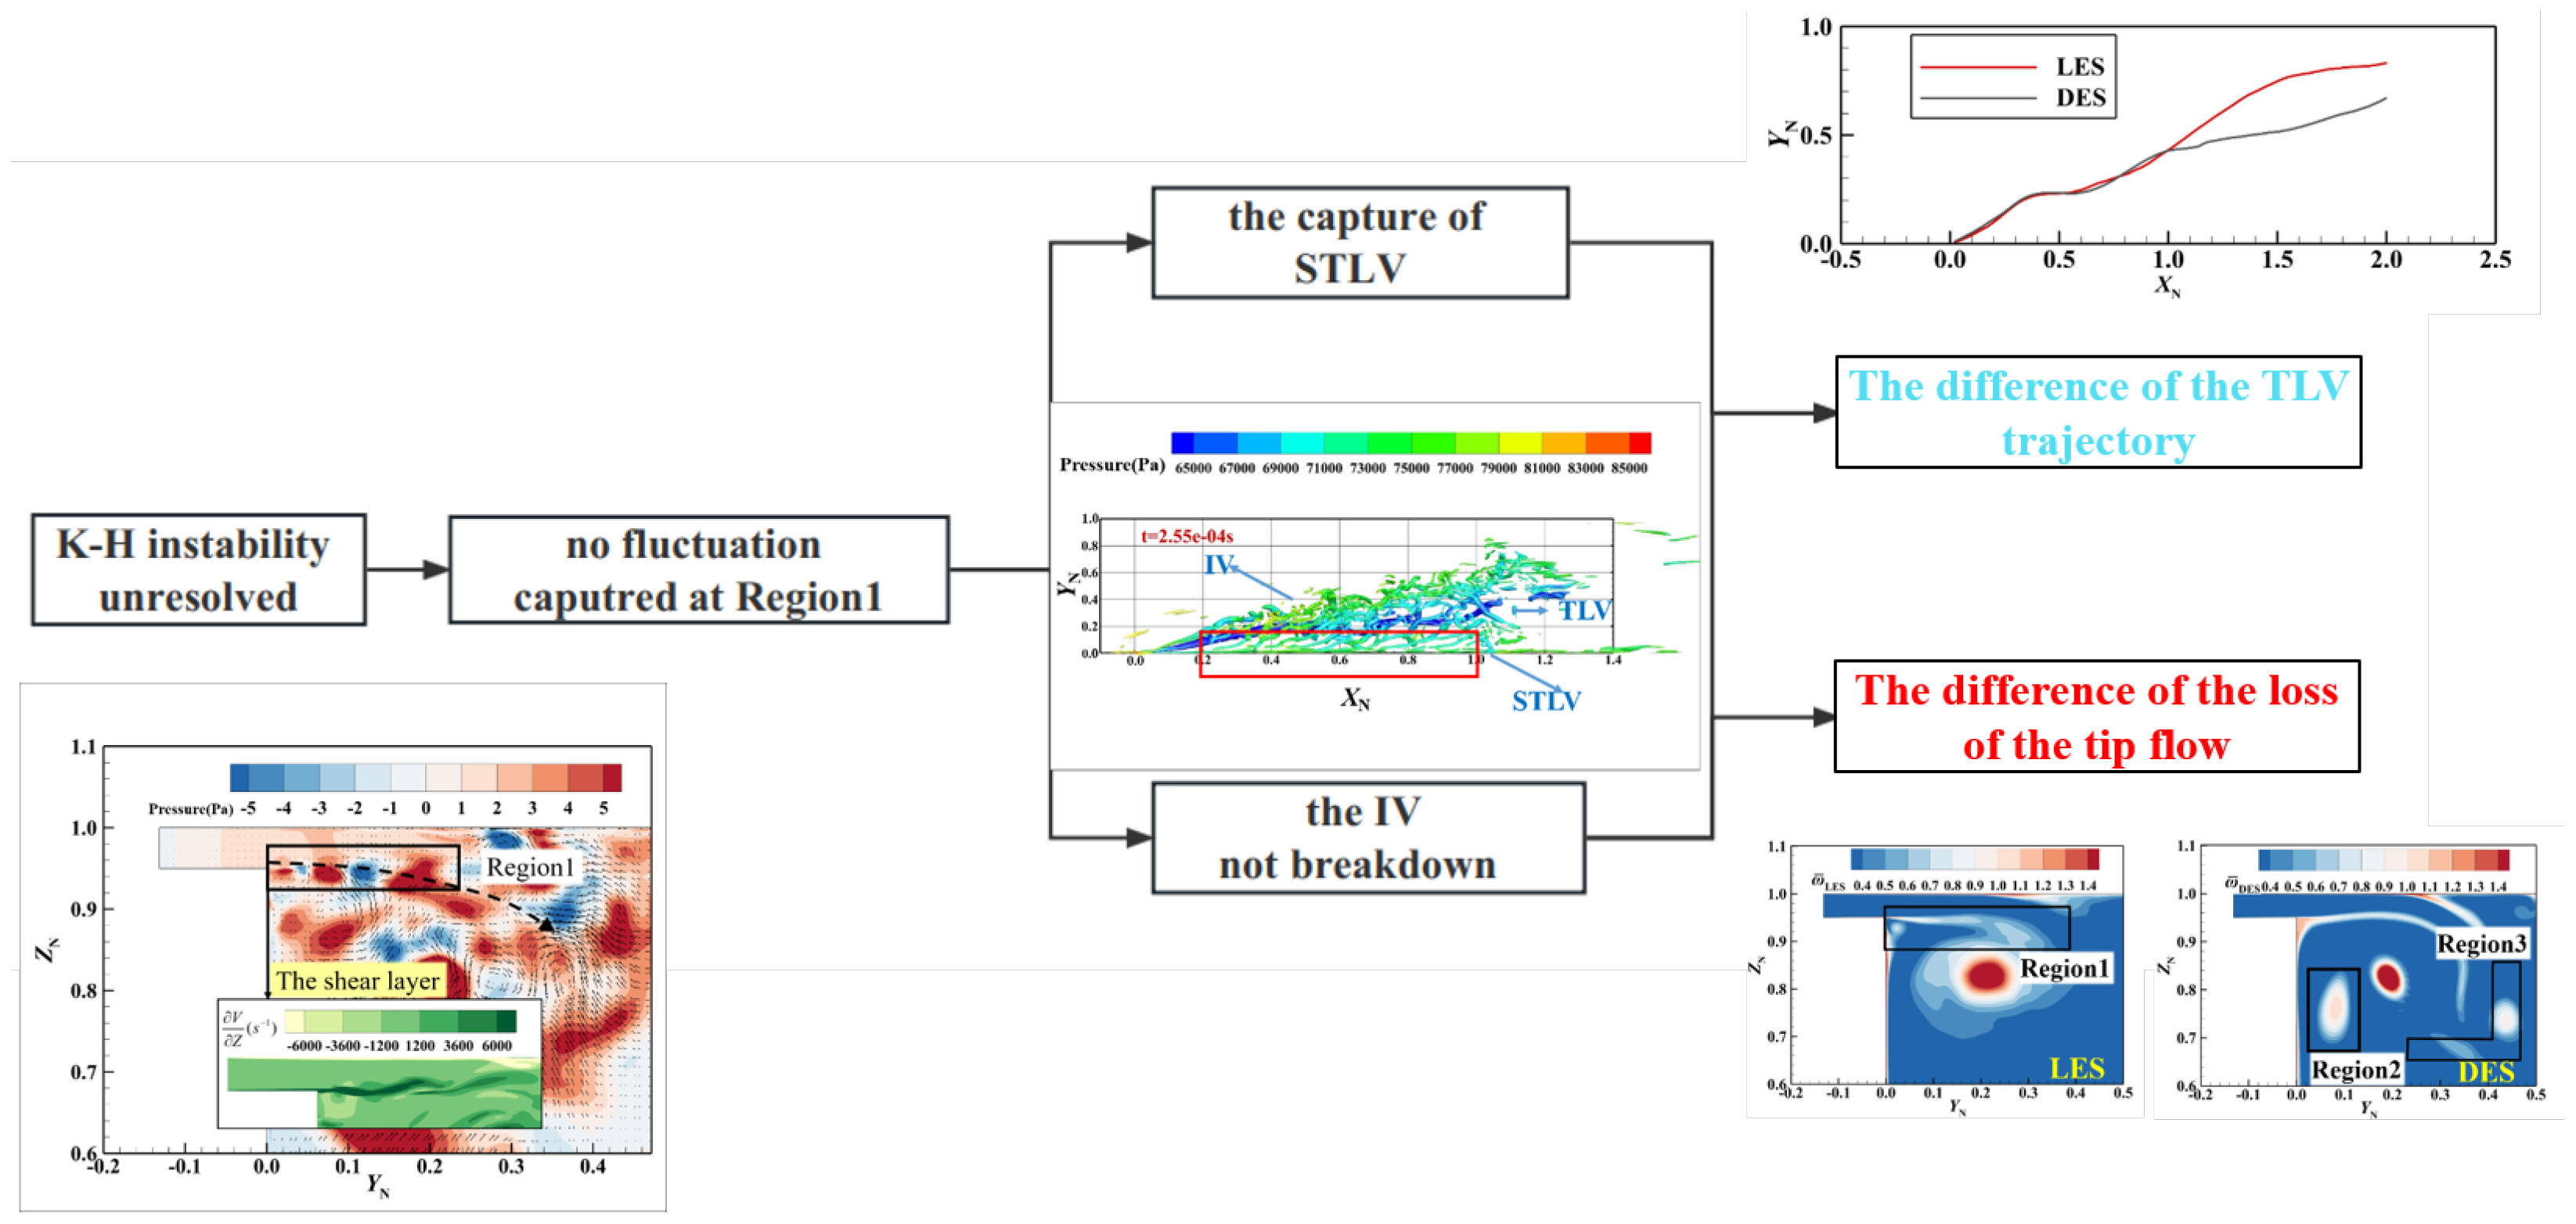
In sum, as shown in Figure 17, due to the influence of the gray area at Region 1 in DES, the K-H instability phenomenon is uncaptured, resulting in the inaccurate capture of the STLV generation and IV development, both of which affect the trajectory of the vortex core. Furthermore, the diversity of IV development leads to the inaccurate prediction of the main fluctuation sources in the flow field, causing inaccurate total pressure loss predictions in the DES method. Therefore, correctly capturing K-H instability is the key to improving the accuracy of tip clearance flow field simulation.

4. Conclusions

This paper delves into the accuracy of the Detached Eddy Simulation (DES) method in predicting tip-leakage flow. Firstly, based on the simplified model of the compressor tip region and compared with the WALE LES results, the accuracy of the time-averaged aerodynamic parameters by the DES method has been researched. Furthermore, by examining the vortex structure and main fluctuation characteristics of the flow field, it proposes the essential prerequisites for accurate prediction when employing the DES method in tip leakage flow applications, i.e., the correct capture of two crucial detailed structures. Lastly, from the perspective of the inherent gray areas problem within the DES method, it unveils the underlying causes for the DES method’s inaccuracies in predicting crucial flow field features. The primary conclusions are as follows:
(1)
Differences between the DES and LES results during the simulation of time-averaged parameters and detailed structures: Regarding the time-averaged parameters, compared with the LES results, the DES-captured TLV trajectories are close inside the passage and different outside of it, both in spanwise and tangential directions. Meanwhile, the value and spatial distribution of the flow field loss captured by the DES are different from the LES results. Furthermore, the loss predicted by DES is larger from the beginning to the middle part and outside of the passage, and smaller from the middle to the end part of the passage. As for detailed flow structures, the DES method could not capture the generation of the STLV and the breakdown of the IV.
(2)
The correlation between the difference in detailed structures and the deviation of time-averaged parameters: due to the inaccurate capture of STLV and IV, the force on the TLV core is different, leading to inaccurate TLV trajectory predictions in the spanwise and tangential directions. For the total pressure loss, the diversity of IV development leads to the different predictions of the main fluctuation sources in the flow field, which leads to inaccurate prediction of the loss position and value.
(3)
The influence mechanism of the “gray area” on detailed structures: In the flow field prediction of tip clearance leakage flow by the DES method, the gray area mainly exists in the shear layer Region 1 formed by the leakage jet and mainstream, Region 2 near the side wall ( Y N = 0 ), downstream of the leakage, and Region 3 in the middle of the passage. Due to the slow transition from the RANS to the LES in Region 1, the K-H instability, which should have been resolved was suppressed, causing the STLV to not successfully be captured. Consequently, the IV development is correctly resolved because the fluctuation injection of STLV is not captured, resulting in incorrect simulation results of IV development.
Therefore, the correct capture of the STLV’s generation and IV’s breakdown is a judgmental basis for evaluating the accuracy of DES series methods in tip leakage flow application from the perspective of detail structures. Furthermore, based on the work of this paper, to improve the accuracy of the compressor tip clearance flow prediction by the DES method, it is necessary to ensure that the K-H instability of the shear layer formed by the leakage flow and the mainstream is correctly resolved.

Author Contributions

Conceptualization, S.L., R.L. and L.G.; methodology, S.L. and R.L.; software, S.L. and N.G.; validation, S.L.; formal analysis, S.L. and R.L.; investigation, S.L. and R.L.; resources, S.L., R.L. and L.G.; data curation, S.L.; writing—original draft preparation, S.L.; writing—review and editing, R.L., L.G. and N.G.; visualization, S.L. and R.L.; supervision, R.L. and L.G.; project administration, S.L. and L.G.; funding acquisition, R.L. and L.G. All authors have read and agreed to the published version of the manuscript.

Funding

This research was funded by the National Natural Science Foundation of China, (grant number 52106053, U2241249, 51790512), the National Science and Technology Major Project of China (No. J2019-II-0016-0037), the foundation of the National Key Laboratory of Science and Technology on Aerodynamic Design and Research (No. 614220121050309) and Young Talent Fund of the Association for Science and Technology in Shaanxi China (No. 20220404).

Data Availability Statement

The data that support the findings of this study are available from the corresponding author upon reasonable request.

Conflicts of Interest

The authors declare no conflicts of interest.

Abbreviations

The following abbreviations are used in this manuscript:
DESDetached eddy simulation
DDESDelay detached eddy simulation
EDDESEnhanced detached eddy simulation
GISGrid induced separation
IVInduced vortex
IV1Induced vortex branch 1
IV2Induced vortex branch 2
LESLarge eddy simulation
SLDSlow LES development
SPODSpectral proper orthogonal decomposition
STLVSecondary tip leakage vortex
TKETurbulence kinetic energy
TLVTip leakage vortex
ZDESZonal detached eddy simulation

References

  1. Wisler, D.C. Loss reduction in axial-flow compressors through low-speed model testing. J. Eng. Gas Turbines Power 1985, 107, 354–363. [Google Scholar] [CrossRef]
  2. Yamada, K.; Kikuta, H.; Furukawa, M.; Gunjishima, S.; Hara, Y. Effects of tip clearance on the stall inception process in an axial compressor Rotor. In Proceedings of the Turbo Expo: Power for Land, Sea, and Air, San Antonio, TX, USA, 3–7 June 2013; American Society of Mechanical Engineers: New York, NY, USA, 2013. [Google Scholar]
  3. Fukano, T.; Jang, C.M. Tip clearance noise of axial flow fans operating at design and off-design condition. J. Sound Vib. 2004, 275, 1027–1050. [Google Scholar] [CrossRef]
  4. Wilke, I.; Kau, H.P. A Numerical Investigation of the flow mechanisms in a high pressure compressor front stage with axial slots. J. Turbomach. 2004, 126, 339–349. [Google Scholar] [CrossRef]
  5. Mao, X.; Liu, B.; Tang, T.F. Control of Tip Leakage Flow in Axial Flow Compressor Cascade by Suction on the Blade Tip. J. Appl. Fluid Mech. 2018, 11, 137–149. [Google Scholar] [CrossRef]
  6. Li, J.; Du, J.; Nie, C.; Zhang, H. Review of tip air injection to improve stall margin in axial compressors. Prog. Aerosp. Sci. 2019, 106, 15–31. [Google Scholar] [CrossRef]
  7. Zhang, H.; Wu, Y.; Li, Y.; Yu, X.; Liu, B. Control of compressor tip leakage flow using plasma actuation. Aerosp. Sci. Technol. 2019, 86, 244–255. [Google Scholar] [CrossRef]
  8. Inoue, M.; Kuroumaru, M.; Fukuhara, M. Behavior of Tip Leakage Flow Behind an Axial Compressor Rotor J. Eng. Gas Turbines Power 1997, 108, 7–14. [Google Scholar] [CrossRef]
  9. Kang, S.; Hirsch, C. Experimental study on the three-dimensional flow within a compressor cascade with tip clearance: Part II–The tip leakage vortex. J. Turbomach. 1992, 115, 444–450. [Google Scholar] [CrossRef]
  10. Kang, S.; Hirsch, C. Tip Leakage Flow in Linear Compressor Cascade. J. Turbomach. 1994, 116, 657–664. [Google Scholar] [CrossRef]
  11. Garnier, V.H. Rotating waves as a stall inception indication in axial compressors. J. Turbomach. 1991, 113, 1098–1102. [Google Scholar] [CrossRef]
  12. Day, I.J. Stall inception in an axial flow compressor. J. Turbomach. 1993, 115, 1–9. [Google Scholar] [CrossRef]
  13. Liu, Y.; Zhong, L.; Lu, L. Comparison of DDES and URANS for Unsteady Tip Leakage Flow in an Axial Compressor Rotor. J. Fluids Eng. 2019, 141, 121405. [Google Scholar] [CrossRef]
  14. Geng, S.; Zhang, H.; Chen, J.; Huang, W. Numerical Study on the Response of Tip Leakage Flow Unsteadiness to Micro Tip Injection in a Low-Speed Isolated Compressor Rotor. In Proceedings of the Turbo Expo: Power for Land, Sea, and Air, Montreal, QC, Canada, 14–17 May 2007. [Google Scholar]
  15. Zhang, H.; Deng, X.; Chen, J.; Huang, W. Unsteady Tip leakage Flow in an Isolated Axial Compressor Rotor. J. Therm. Sci. 2005, 14, 211–219. [Google Scholar] [CrossRef]
  16. You, D.; Wang, M.; Moin, P. Large-eddy simulation analysis of mechanisms for viscous losses in a turbomachinery tip-clearance flow. J. Fluid Mech. 2007, 586, 177–204. [Google Scholar] [CrossRef]
  17. Tucker, P.G. Computation of Unsteady Turbomachinery Flows: Part 2—LES and Hybrids. Prog. Aerosp. Sci. 2011, 47, 546–569. [Google Scholar] [CrossRef]
  18. Jagadeesh, M.; Dimitrios, P.; Stéphane, H. Assessment of Wall Modelling for Large Eddy Simulations of Turbomachinery. In Proceedings of the ASME Turbo Expo 2018: Turbomachinery Technical Conference and Exposition, Oslo, Norway, 11–15 June 2018. [Google Scholar]
  19. Spalart, P.R. Comments on the feasibility of les for wings, and on a hybrid rans/les approach. In Proceedings of the First Afosr International Conference on Dns/Les, Greden Press 1997. pp. 137–147. Available online: https://www.researchgate.net/publication/236888805_Comments_on_the_Feasibility_of_LES_for_Wings_and_on_a_Hybrid_RANSLES_Approach (accessed on 20 November 2023).
  20. Li, R.; Gao, L.; Ma, C.; Lin, S.; Zhao, L. Corner separation dynamics in a high-speed compressor cascade based on detached-eddy simulation. Aerosp. Sci. Technol. 2020, 99, 105730. [Google Scholar] [CrossRef]
  21. Li, R.; Gao, L.; Zhao, L. Dominating unsteadiness flow structures in corner separation under high mach number. AIAA J. 2019, 57, 2923–2932. [Google Scholar]
  22. Ma, W.; Ottavy, X.; Lu, L. Intermittent corner separation in a linear compressor cascade. Exp. Fluids 2013, 54, 1546. [Google Scholar]
  23. Yan, H.; Liu, Y.; Lu, L. Turbulence anisotropy analysis in a highly loaded linear compressor cascade. Aerosp. Sci. Technol. 2019, 91, 241–254. [Google Scholar] [CrossRef]
  24. Yamada, Y.; Furukawa, M.; Nakakido, S. Large-scale des analysis of unsteady flow field in a multi-stage axial flow. In Proceedings of the ASME Turbo Expo 2015: Turbine Technical Conference and Exposition, Montréal, QC, Canada, 15–19 June 2015. [Google Scholar]
  25. Spalart, P.R.; Deck, S.; Shur, M.L.; Squires, K.D.; Strelets, M.K.; Travin, A. A New Version of Detached-eddy Simulation, Resistant to Ambiguous Grid Densities. Theor. Comput. Fluid Dyn. 2006, 20, 181–195. [Google Scholar] [CrossRef]
  26. Menter, F.R.; Kuntz, M. Adaptation of eddy-viscosity turbulence models to unsteady separated flow behind vehicles. In The Aerodynamics of Heavy Vehicles: Trucks, Buses, and Trains; Springer: Berlin, Germany, 2004; pp. 339–352. [Google Scholar]
  27. Shur, M.L.; Spalart, P.R.; Strelets, M.K.; Travin, A.K. An enhanced version of DES with rapid transition from RANS to LES in separated flows. Flow Turbul. Combust. 2015, 95, 709–737. [Google Scholar] [CrossRef]
  28. Biollo, R.; Benini, E. Shock/Boundary-Layer/Tip-Clearance Interaction in a Transonic Rotor Blade. J. Propuls. Power 2009, 25, 668–677. [Google Scholar] [CrossRef]
  29. Fang, J.; Gao, Y.; Liu, Y.; Lu, L.; Yao, Y.; Le Ribault, C. Direct numerical simulation of a tip-leakage flow in a planar duct with a longitudinal slit. Phys. Fluids 2019, 31, 125108. [Google Scholar] [CrossRef]
  30. Deck, S. Recent improvements in the Zonal Detached eddy simulation (ZDES) formulation. Theor. Comput. Fluid Dyn. 2012, 26, 523–550. [Google Scholar] [CrossRef]
  31. Su, X.; Ren, X.; Li, X.; Gu, C. Unsteadiness of tip leakage flow in the detached-eddy simulation on a transonic rotor with vortex breakdown phenomenon. Energies 2019, 12, 954. [Google Scholar] [CrossRef]
  32. Wu, J. Improved delayed detached eddy simulation of compressor cascade tip leakage flow. Int. J. Aeronaut. Space Sci. 2020, 22, 17–32. [Google Scholar] [CrossRef]
  33. Riéra, W.; Marty, J.; Castillon, L.; Deck, S. Zonal detached-eddy simulation applied to the tip-clearance flow in an axial compressor. AIAA J. 2016, 54, 2377–2391. [Google Scholar] [CrossRef]
  34. He, X.; Zhao, F.; Vahdati, M. Detached Eddy Simulation: Recent Development and Application to Compressor Tip Leakage Flow. J. Turbomach. 2022, 144, 011009. [Google Scholar] [CrossRef]
  35. Gao, L.; Lin, S.; Li, R.; Zhao, L. Research on the Vortex Structure Near the Tip Clearance in a Highly Loaded Compressor Cascade Based on Oil Flow Pattern. J. Aerosp. Power 2023, 38, 2473–2482. [Google Scholar]
  36. Yu, X.; Liu, B.; Jiang, H. Three-Dimensional Flows Near Rotor Tip in an Axial Compressor I—Experimental and Theoretical Studies. Acta Astronaut. Astronaut. Sin. 2010, 31, 48–57. [Google Scholar]
  37. Yu, X.; Liu, B.; Jiang, H. Three-Dimensional Flows Near Rotor Tip in an Axial Compressor II—Numerical Simulation Study. Acta Astronaut. Astronaut. Sin. 2010, 31, 58–69. [Google Scholar]
  38. Lilly, D.K. A proposed modification of the Germano subgrid-scale closure method. Phys. Fluids Fluid Dyn. 1992, 4, 633–635. [Google Scholar] [CrossRef]
  39. Schmidt, O.T.; Colonius, T. Guide to Spectral Proper Orthogonal Decomposition. AIAA J. 2020, 58, 1023–1033. [Google Scholar] [CrossRef]
  40. He, X.; Fang, Z.; Rigas, G.; Vahdati, M. Spectral Proper Orthogonal Decomposition of Compressor Tip Leakage Flow. Phys. Fluids 2021, 33, 105105. [Google Scholar] [CrossRef]
  41. Heinzel, G.; Rüdiger, A.; Schilling, R. Spectrum and Spectral Density Estimation by the Discrete Fourier Transform (DFT), Including a Comprehensive List of Window Functions and Some New At-Top Windows. 2002. Available online: https://www.researchgate.net/publication/267956210_Spectrum_and_spectral_density_estimation_by_the_Discrete_Fourier_transform_DFT_including_a_comprehensive_list_of_window_functions_and_some_new_flat-top_windows (accessed on 20 November 2023).
  42. Nekkanti, A.; Schmidt, O.T. Frequency-time Analysis, Low-rank Reconstruction and Denoising of Turbulent Flows using SPOD. J. Fluid Mech. 2021, 926, A26. [Google Scholar] [CrossRef]
  43. Kay, S.M.; Marple, S.L. Spectrum Analysis—A Modern Perspective. Proc. IEEE 1981, 69, 1380–1419. [Google Scholar] [CrossRef]
  44. Liu, C. Liutex and Third Generation of Vortex Identification Methods. In Liutex and Third Generation of Vortex Definition and Identification; Liu, C., Wang, Y., Eds.; Springer International Publishing: Berlin/Heidelberg, Germany, 2021; pp. 3–36. [Google Scholar]
  45. Wang, Y.; Gao, Y.; Liu, C. Letter: Galilean Invariance of Rortex. Phys. Fluids 2018, 30, 111701. [Google Scholar] [CrossRef]
  46. Celik, I.B.; Cehreli, Z.N.; Yavuz, I. Index of Resolution Quality for Large Eddy Simulations. J. Fluids Eng. 2005, 127, 949–958. [Google Scholar] [CrossRef]
  47. Hoying, A.; Tan, C.S.; Vo, H.D.; Greitzer, E.M. Role of Blade Passage Flow Structures in Axial Compressor Rotating Stall Inception. J. Turbomach. 1999, 121, 735–742. [Google Scholar] [CrossRef]
  48. Furukawa, M.; Inoue, M.; Saiki, K.; Yamada, K. The role of tip leakage vortex breakdown in compressor rotor aerodynamics. J. Turbomach. 1999, 121, 469–480. [Google Scholar] [CrossRef]
  49. Tan, D.; Li, Y.; Wilkes, I.; Miorini, R.L.; Katz, J. Visualization and Time-Resolved Particle Image Velocimetry Measurements of the Flow in the Tip Region of a Subsonic Compressor Rotor. J. Turbomach. 2015, 137, 041007. [Google Scholar] [CrossRef]
  50. Mailach, R.; Lehmann, I.; Vogeler, K. Rotating Instabilities in an Axial Compressor Originating From the Fluctuating Blade Tip Vortex. J. Turbomach. 2001, 123, 453–460. [Google Scholar] [CrossRef]
  51. Chu, B.T. On the Energy Transfer to Small Disturbances in Fluid Flow (Part I). Acta Mech. 1965, 1, 215–234. [Google Scholar] [CrossRef]
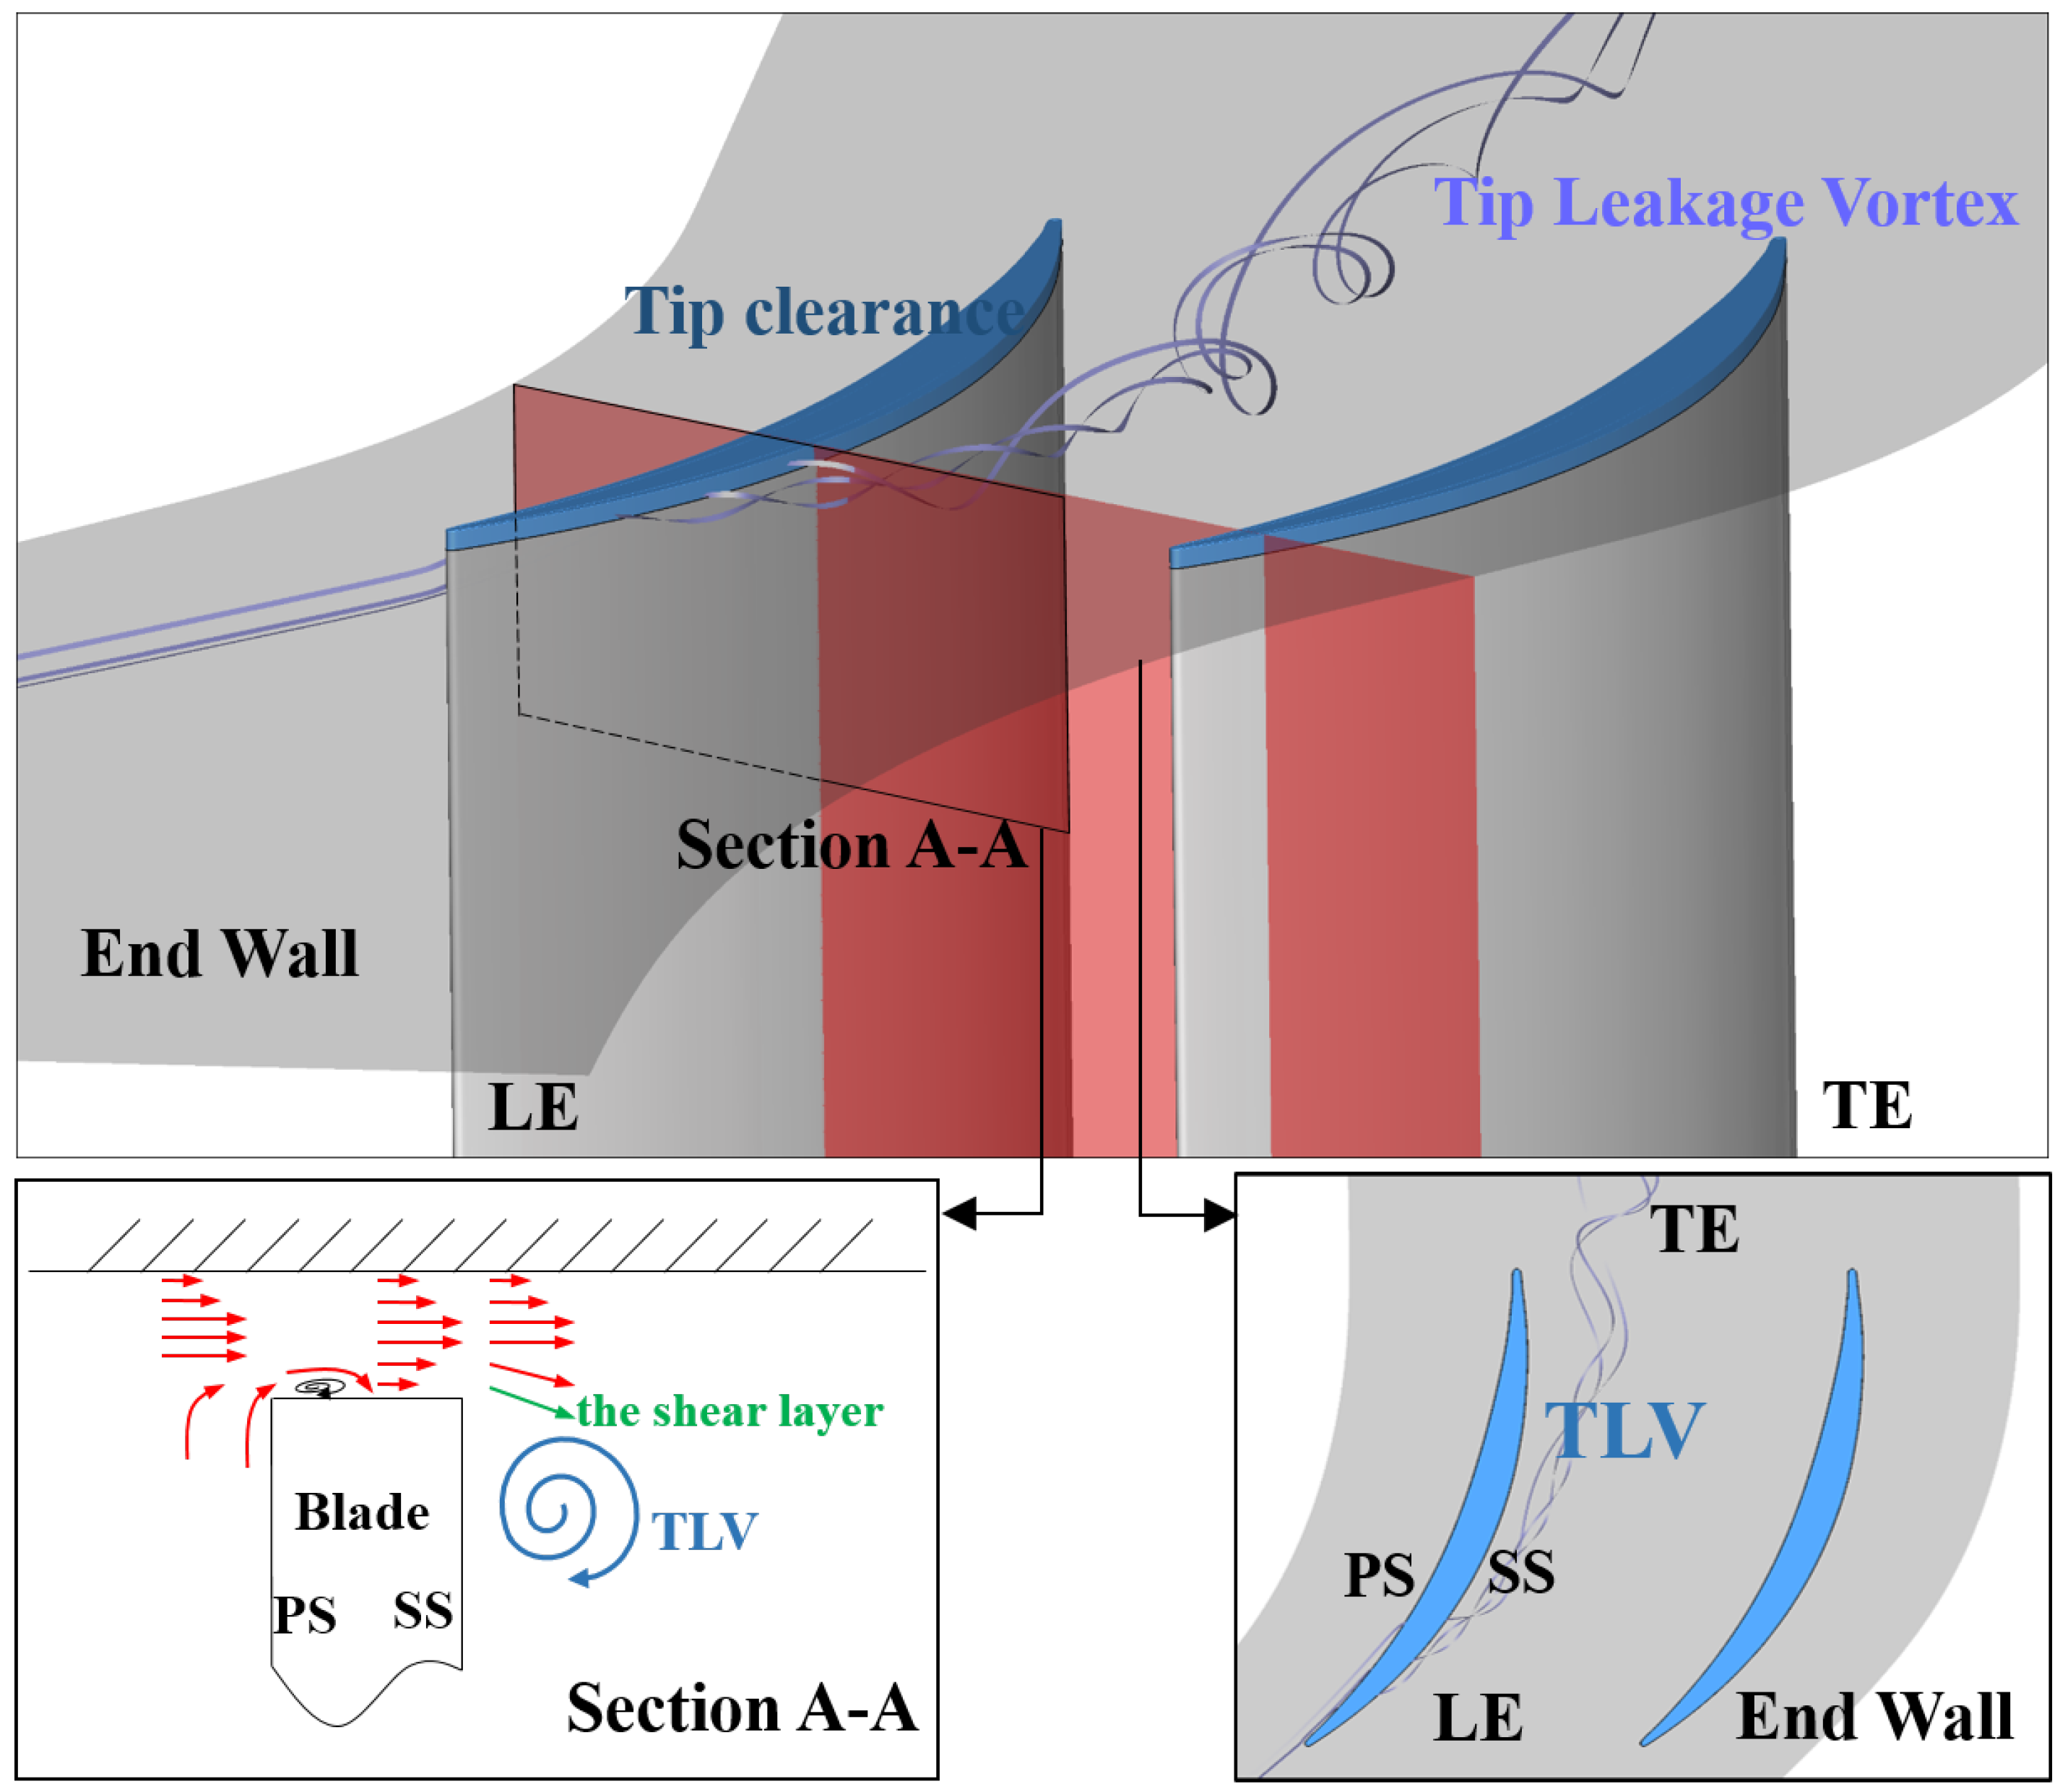
Figure 1. Geometric and flow field characteristics of the tip clearance region.
Aerospace 11 00029 g001
Figure 2. The diagram of the simplified model.
Aerospace 11 00029 g002
Figure 3. The grid of the simplified model.
Aerospace 11 00029 g003
Figure 4. Power spectral density distribution of the static pressure at monitoring points.
Aerospace 11 00029 g004
Figure 5. The contour of the F D E S function of DES method ( X N corresponding to each monitoring point).
Aerospace 11 00029 g005
Figure 6. The iso-surface of Liutex mag = 30,000 (contouerd by I Q v ).
Aerospace 11 00029 g006
Figure 7. The time-averaged leakage vortex trajectories base on LES and DES methods.
Aerospace 11 00029 g007
Figure 8. The time-averaged leakage vortex trajectories based on LES and DES methods.
Aerospace 11 00029 g008
Figure 9. The transient vortex structure of LES and DES method ( L i u t e x mag = 10,000 iso-surface).
Aerospace 11 00029 g009
Figure 10. The three-dimensional data selection range of the SPOD decomposition.
Aerospace 11 00029 g010
Figure 11. The energy spectrum of the first five modes of SPOD decomposition.
Aerospace 11 00029 g011
Figure 12. The reconstruction field of the specific frequency band based on LES and DES results.
Aerospace 11 00029 g012
Figure 13. The diagram of the force direction on the TLV.
Aerospace 11 00029 g013
Figure 14. The multi-parameter fluctuation SPOD energy spectrum of the X N = 0.67 section.
Aerospace 11 00029 g014
Figure 15. Flow field reconstruction of high-energy band based on multi-parameters ( X N = 0.67 section).
Aerospace 11 00029 g015
Figure 16. The reconstruction results of the high-energy band at X N = 0.34 section.
Aerospace 11 00029 g016
Figure 17. The logic diagram of the influence of the DES method gray area on the microstructure and macrostructure of the flow field.
Aerospace 11 00029 g017
Table 1. The parameters of the simplified model.
ParameterValue
L x 4 h
L y 0.63 h
L z 0.67 h
L 0 h
L t i p h
L t 0.083 h
τ 0.003 h
α 90
Table 2. The reconstructed frequency band.
LESDES
LES_rec1LES_rec2LES_rec3DES_rec4
700–1000 Hz2000–3000 Hz10,500–11,500 Hz8000–9000 Hz
Disclaimer/Publisher’s Note: The statements, opinions and data contained in all publications are solely those of the individual author(s) and contributor(s) and not of MDPI and/or the editor(s). MDPI and/or the editor(s) disclaim responsibility for any injury to people or property resulting from any ideas, methods, instructions or products referred to in the content.