Abstract
This study presents a numerical investigation of suction control in an aggressive S-shaped air intake with large boundary ingestion. The results show that the variation of suction control parameters such as suction location, suction pipe diameter, and suction angle all have an impact on the effectiveness of the flow control. In general, further upstream suction, such as near the throat, is favorable for the decrease of the second flow intensity and the area of the low-energy fluid region at the exit of the S-shaped inlet. However, it is bad for the total pressure recovery and the circumferential total pressure uniform distribution. From the perspective of the uniformity of the total pressure distribution at the air intake exit, there is an optimal location for suction between the throat and the separation start point. A bigger suction pipe diameter brings better effects as the suction location and suction angle keep constant, due to more low-energy fluid being sucked out. But this doesn’t mean the largest mass flow suction results in the biggest improvement. Overall, sucking at the 1st bend, with suction angle and suction pipe diameter equaling 15 degrees and 12 mm, respectively, is the optimal suction scheme here. Since the change rule of the cross-section area along the centerline has not changed during suction control, the second flow and complex surface streamline at the air intake exit cannot be eliminated, though they can be decreased a lot with reasonable suction control. Similarly, owing to large boundary ingestion, the remarkable low-energy fluid region always exists despite the significant reduction of the separation and second flow, which is very different from the results of this kind of micro-suction executed in the non-BLI S-duct. To pursue a higher improvement, suction combined with vortex generator vanes has been further studied. Corresponding results analysis shows that the hybrid flow control method has great potential and should be investigated in detail in the future.
1. Introduction
Half flush-mounted S-shaped air intake with large boundary layer ingestion (BLI) has been a research hotspot in recent years and has received wide attention thanks to its favorable stealth, small frontal area, and compact structure [1]. As the gas supply apparatus of the future Blended-Wing-Body (BWB) transport aircraft, except for the common benefits mentioned above, numerous studies about it have shown that the boundary layer ingesting propulsor has the potential to improve aircraft fuel efficiency [2,3,4,5,6,7,8]. However, challenges also exist. The inherent S-shaped diffuser geometry combined with a thick ingested boundary layer results in severe flow distortions (mainly including total pressure distortion and swirl distortion) at the inlet of the turbofan engine, which is very bad for the aerodynamic performance of downstream components [9,10,11,12,13,14]. The swirl distortion component of these inlet flow profiles changes the incidence angle of air entering the fan which alters the amount of flow turning and work performed by the fan [15,16]. In fan geometries researched by Gunn and Hall [17], BLI was found to reduce the fan-stage efficiency by around 1–2% relative to operation with uniform inlet flow. In the presence of BLI-type (NASA’s Inlet A) distortion, both a 15.5% decrease in stream thrust and a 14% increase in thrust-specific fuel consumption occur [12]. Therefore, obtaining the benefits of BLI from a system level requires that acceptable pressure recovery and distortion levels be maintained for engine operation [1]. As a result, flow control or optimization that is used for improving the air quality at the aerodynamic interface plane (AIP) of the BLI S-shaped air intake is more necessary compared to the conventional pylon-mounted engine inlet or other non-BLI inlets.
With the development of flow control methods [18] and experimental techniques for physical measurements, large amounts of work for coping with the S-shaped air intake exit distortion have been performed in recent years. It is noteworthy that most of them achieve their aims with passive or active flow control methods because geometry optimization is not effective for distortion control [19,20,21]. Among various flow control methods [22,23,24,25,26,27,28,29,30,31], blowing and suction are two kinds of active flow control techniques with effectiveness. By blowing net high-energy fluid in, the power of the low-energy fluid to overcome the adverse pressure gradient is strengthened; then, the serious flow separation and secondary flow that originally occurred in the serpentine duct weakens or disappears, making the interior flow more fluent. As to suction, its role is to eliminate or reduce the flow separation in the S-shaped air intake by sucking out the low-energy fluid in the boundary layer.
In 2014, Harouni et al. [32] studied the effect of blowing and suction control on the engine-face distortion of a half flush-mounted S-shaped inlet and concluded that the secondary flows occurring in the diffuser could be more efficiently managed by keeping the jet flows separate and distinct. However, in this study, neither a detailed analysis of the flow field in the BLI S-shaped inlet with flow control nor the deep exploration of the influence discipline of flow-control parameters (such as the actuation location, angle, and so on) variation on the flow control effect has proceeded. Subsequently, Vaccaro et al. [30] paid their attention to the experimental and numerical investigation of steady-blowing control in a compact inlet duct in 2015. The results show that not only did the two-dimensional tangential control jet improve the time-averaged pressure recovery at the air intake exit, but it also essentially eliminated the energy content of the distinct unsteady fluctuations that characterized the baseline flow field. Though both the time-averaged flow field and the unsteady flow field have been analyzed in this work, the inlet is a short, rectangular, diffusing S-shape duct without boundary layer ingestion.
In summary, there are many achievements in interior blowing or suction control in the S-shaped inlet. However, most of them focus on the positive or negative effects caused by flow control, and few of them tend to pay attention to the detailed effect of flow control parameters variation on the S-shaped inlet’s aerodynamic performance, not to mention the adoption of supplementary measures. On the other hand, the flow field in the S-shaped inlet has big differences from the flow field in the S-shaped inlet with large boundary layer ingestion. Correspondingly, the flow control method and the underlying mechanism should be different. So, with respect to this reality, quantities of compressible Reynolds-averaged Navier-Stokes computations for a half flush-mounted S-shaped inlet with a series of suction schemes have been conducted. Furthermore, the complex 3D interior flow details under different schemes have been analyzed and compared.
2. Computational Setup
2.1. Model in Study
The S-shaped inlet studied here is a half flush-mounted inlet with large boundary layer ingestion, with a Mach number at the inlet of about 0.37. The diameter of its exit section, D, equals 280.4 mm, and the design mass flow of it, mdesign, equals 8.997 kg/s. The suction control devices are comprised of 12 pipes with suction pipe diameters d equaling 8 mm, 10 mm, or 12 mm, as shown in Figure 1b. All suction pipes are installed at the same acute angle (β = 15°, 30°, 45°) with the local tangent line. The arrangement of these suction pipes was chosen based on the conclusion obtained by Harouni that the most practically effective flow control scheme was the circumferential ejector scheme [32]. Furthermore, the position near the throat section, just at the 1st bend, and near the separation point are selected as three typical suction locations, as shown in Figure 1c, which is an additional variable relative to the previous research [32].
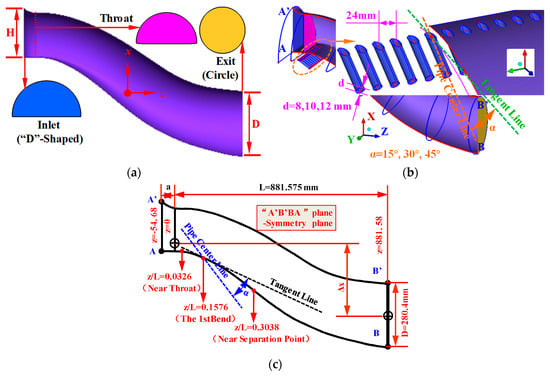
Figure 1.
Schematic of the suction control device. (a) The S-shaped inlet. (b) Local map of the suction control device. (c) Schematic of the suction location and angle.
2.2. Numerical Methods
With the rapid development of computational fluid mechanics (CFD) in recent years, more accurate numerical simulation methods such as LES and DNS have been put forward and applied in some simple or simplified models [33,34,35]. However, as concluded in Yang’s research paper, LES is likely to become used for a broader range of flow problems and more complex problems, including more multi-disciplinary applications, in the future. Nevertheless, there are still significant challenges (such as the big shortcoming in implicit filtering, and time cost) remaining before LES can become a reliable, robust engineering analysis tool that can be used as an alternative to RANS [33]. As to DNS, the challenges for its wide application are greater, such as the economic and time costs. So, the numerical simulation in this study uses the commercial software ANSYS CFX 18.0 to solve steady viscous Reynolds-Averaged Navier-Stokes (RANS) equations with a time-perusing finite volume method. The Shear Stress Transport (SST) turbulence model is employed for this research as it is the highest fidelity working turbulence model and is well established for its separated flow modeling ability [36,37]. The spatial discretization uses a second-order upwind scheme. To reduce the effect of the artificial outlet boundary on the internal flow field, the calculation domain has been obtained after the extension of the original serpentine diffuser. As shown in Figure 2a, the extensive section is about 1.5 times the diameter of the diffuser exit.

Figure 2.
Mesh for the numerical simulation of the flow in the S-shaped air intake with and without suction control. (a) S-shaped inlet without suction control (Prototype). (b) S-shaped inlet with suction control.
An O-type grid topology is used in the main channel of the diffuser and the suction pipes. Meshes near the air intake wall and the pipe wall, as well as at the junctions of the air intake and the suction pipes, are all locally refined. To avoid the numerical discrepancy caused by different meshing methods, the same grid topology is used for all schemes. The wall distance of the first mesh cell is set to 0.002 mm, and the calculated y+ is about 1.0. Both grid independence and computational efficiency are considered to determine the appropriate mesh number. As a result, the number of grid points in the whole calculation domain is about 2,000,000 in total.
The boundary conditions of the suction control cases are shown in Figure 3. Clearly, total pressure, P*, and total temperature, T*, of 288 K are set at the inlet of the S-shaped air intake as the inlet boundary conditions. Because of large boundary layer ingestion, the total pressure distribution at the air intake inlet is not uniform, as shown in Figure 3b,c. The thickness of the boundary layer δ equals 20 percent of the height of the air intake inlet (δ = 0.2 H). The total pressure distribution in the normal direction of the boundary layer—in other words, the first section of the function (P* = P*(x)) is obtained through the previous experimental data fitting. Psuction is the external environmental pressure given at the exit of the suction pipes, which acts as a throttle valve. As to the schemes without suction control, this setting is not available here. What should be noticed is that the suction mass flow is not controlled by changing the value of Psuction; it is controlled by changing the diameter of the suction pipes. The usage of this method is because the suction pipes are treated as a simple bleed valve. Static pressure, Pexit, is set at the exit of the S-shaped inlet as the outlet boundary condition. All the wall faces are set as adiabatic with no slip.
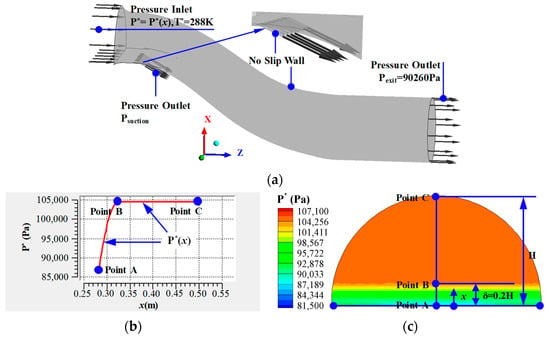
Figure 3.
Boundary condition settings and total pressure distribution at the inlet of the S-shaped inlet. (a) Boundary conditions. (b) Total pressure distribution function at the inlet. (c) Total pressure distribution contour at the inlet.
Finally, all numerical simulations were performed on a computing cluster with a total of 128 Intel® Xeon® scalable processors.
2.3. Evaluation Parameters
When comparing the aerodynamic performance of the air intake as well as the distortion at its exit in different schemes, the total pressure recovery coefficient (σ), the circumferential total pressure distortion coefficient (DC120), the swirl distortion coefficient (SC120), and the occupation ratio of low-energy fluid (AR) at the exit of the S-shaped inlet are all available here, as shown below. Obviously, these four descriptors generally fall into two categories. The first one characterizes the total pressure recovery, while the other three characterize distortion at the exit of the S-shaped inlet:
In upper definitions, P*FAV is the mean total pressure at the exit of the S-shaped air intake, (P*120)FAV,min is the minimum area average total pressure in a series of 120-degree sectors at the exit of the S-shaped inlet, and qFAV is the area average dynamic pressure. (Vxy,120)FAV,max is the maximum area average velocity of secondary flow in a series of 120-degree sectors. Correspondingly, (Vxy,120)FAV,min is the minimum area average velocity of secondary flow in a series of 120-degree sectors, and VFAV is the area average velocity. In addition to parameter DC120, DA is also an evaluation parameter for total pressure distortion, but it is simpler and more direct.
2.4. Validation of the Simulation Method
To verify the accuracy of the calculation method used in this work, the numerical simulation of the S-duct [37,38,39] was carried out as shown in Figure 4. The static pressure coefficient Cp and the total pressure recovery coefficient σ are chosen for the comparison, which is defined by:
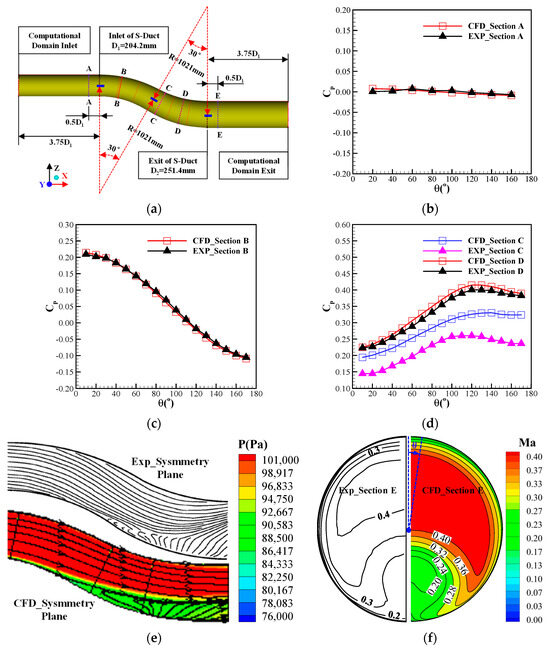
Figure 4.
Comparisons between the numerical results of the S-duct for validation and the experimental data given in the references [37,38,39]. (a) S-duct for validation [37,38,39]. (b) Static pressure coefficient at Section A. (c) Static pressure coefficient at Section B. (d) Static pressure coefficient at Section C and Section D. (e) Streamline distribution on the symmetry plane of the S-duct. (f) Mach number distribution at the S-duct exit.
The numerical results of the static pressure coefficient in Section A and Section B fit the experimental data well. But in Section C, where serve separation occurs (Figure 4d), there is a relatively larger error. We also compared our results with some other comparable data (such as in the work of Fiola [37]), and a similar phenomenon that a relatively greater error between the CFD result and experimental data in section C can be found. With detailed analysis, we found it can be attributed to the fact that neither RANS turbulence model can adequately account for strong flows with separation recently. The distribution of the streamline on the symmetry plane of the S-duct and the Mach number at section E is basically consistent with the experimental contours.
In general, the simulated results are in reasonable agreement with the experiment results. Although this validation is a compromise, the diffuser studied in this validation also has a typical S-shaped structure with complex second flow and flow separation in it, which is similar to the half flush-mounted S-shaped inlet simulated in this paper. So, to some extent, it is still meaningful to the simulation research here.
3. Results and Discussion
3.1. Research Schemes of the Suction Flow Control
As mentioned above, suction location, installing angle of suction pipes, and suction pipe diameter are three suction control parameters, each of which has three items for choosing. As shown in Table 1, the schemes have been named after the same rule. With detailed analysis and comparison, suction control law and characteristics can be obtained. Besides, the optimal suction scheme selected from these schemes is available.

Table 1.
Suction control parameters and naming rule of suction schemes.
3.2. The Change in Aerodynamic Performance and Interior Flow Details
Figure 5 shows the suction mass flow change trend with the variation of the suction pipe’s diameter. Clearly, suction mass flow increases significantly with the increase of the suction pipes’ diameter as the suction location and angle are fixed. Likewise, the suction location and angle can directly influence the amount of suction mass flow. It can be easily found that suction further upstream means more suction mass flow if the installing angle and the diameter of the suction pipes remain constant.
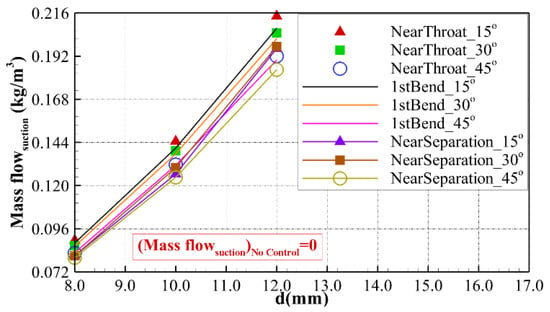
Figure 5.
The suction mass flow changes with the variation of the suction pipe’s diameter.
This phenomenon can be interpreted as the velocity of the suctioned low-energy fluid at the upstream location being relatively larger than the velocity downstream, as shown in Figure 6a. The installing angle is also a remarkable affecting factor: a smaller install angle brings more suction mass flow as both the suction location and the size of the suction pipes remain unchanged. The contours given in Figure 6b,c account for this phenomenon well. The smaller installation angle means a larger speed component in the suction pipe direction, as portrayed visually in Figure 6b. Therefore, a smaller installation angle is good for more mass flow suction. Besides, from Figure 6b, it can be found that most of the mass flow that is suctioned out is low-energy flow in the boundary layer, only when the installation angle is small, such as 15°. On the contrary, with the installation angle increasing, more and more main flow with higher energy has been sucked out. Undoubtedly, this is bad for the aerodynamic performance of the air intake, which can be verified by the curves given in Figure 7. On the other hand, a bigger installation angle means a bigger turning angle for the sucked fluid. As a result, the possibility of flow separation occurring in the suction pipes is increased, as shown in Figure 6b,c.
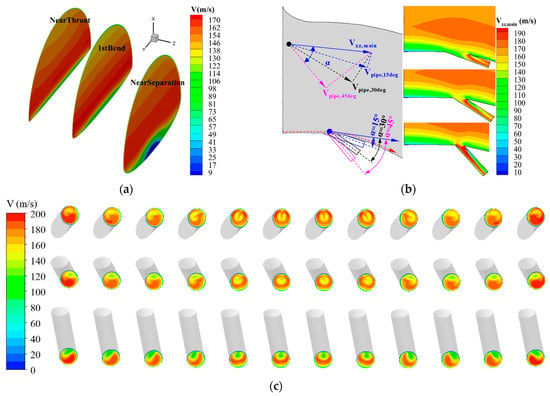
Figure 6.
The velocity contour at 3 suction sections, the intersection of the suction pipe and the air intake, and the exit of the suction pipes. (a) Velocity contour at 3 suction sections. (b) Local velocity at the intersection of the suction pipe and the air intake. (c) Velocity contour at the exit of the suction pipes (Top: Throat_15°_10mm; Throat_30°_10mm; Throat_45°_10mm).
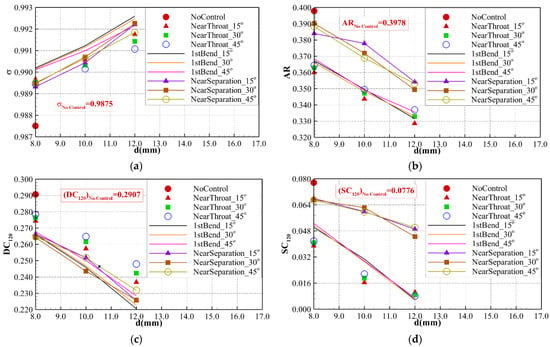
Figure 7.
The change of aerodynamic performance parameters with the variation of suction control parameters. (a) The total pressure recovery coefficient (σ). (b) The occupation ratio of low-energy fluid (AR). (c) The circumferential total pressure distortion coefficient (DC120). (d) The swirl distortion coefficient (SC120).
In general, whether from the view of the total pressure recovery (σ) or the distortion (AR, DC120, SC120) at the air intake exit, there is the same change tendency that the aerodynamic performance of the air intake becomes better and better as the diameter of the suction pipes increases from 8 mm to 12 mm, as shown in Figure 7. On the other hand, in the schemes studied here, this tendency does not change with the variation of the suction pipe diameter and suction location. Namely, a bigger suction pipe diameter brings a better flow control effect, no matter which suction location or suction angle is selected. However, the optimal suction angle is significantly correlated with the suction location and the suction pipe diameter. Only when the suction location is near the throat and the diameter of the suction pipes is relatively small, the aerodynamic performance of the air intake simply increases with the decrease of the suction angle. The influence discipline of suction location variation is also very complex. For the reduction of the low-energy fluid region characterized by parameter AR and the swirl distortion (SC120) at the AIP, further upstream suction leads to a better effect. But for the total pressure recovery σ and the circumferential total pressure distortion (DC120), as given in Figure 7a,c, there is a completely different result. Further upstream suction seems to lead to a worse total pressure distortion at the exit of the air intake, and the 1st bend, located between the throat and the separation section, seems to be the optimal one.
The change of the parameter AR with the variation of the suction location may be interpreted as follows. First, under the combined effects of large boundary layer ingestion, strong adverse and cross pressure gradient, the boundary layer becomes thicker and thicker streamwise. As a result, the area of the low energy-fluid region on the streamwise sections becomes larger and larger, as shown in Figure 8. There is no question that suction is effective both to the upstream flow field and the flow field downstream of the place where suction control proceeded. But certainly, the latter one is more influenced. Because the upstream location is closer to the inlet low-energy fluid source, further upstream suction will lead to larger downstream regions affected. Then, smaller regions covered by low-energy fluid appeared at the exit of the S-shaped inlet, namely the lower value of parameter AR, as shown in Figure 7b. Besides, due to the adverse pressure gradient that has been overcome in time by further upstream suction, the flow separation in the air intake has been weakened or even eliminated, and, at last, lower swirl distortion (SC120) occurred at the exit of the air intake.
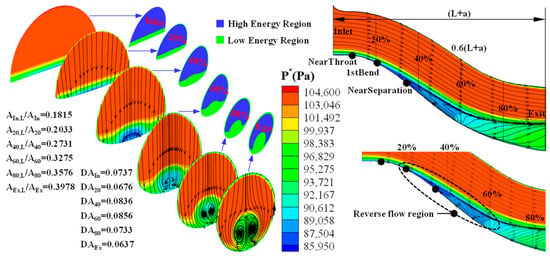
Figure 8.
Total pressure distribution and surface streamline on equidistant streamwise sections in the prototype scheme.
As to the total pressure recovery (σ) and the circumferential total pressure distortion (DC120), a basic fact that should be mentioned first is that there are two direct effects caused by suction control. The first one is the energy loss of the whole aerodynamic system. Though the fluid sucked out is low-energy, there is also an energy loss from the perspective of the whole system. Moreover, further upstream suction means more energy loss due to more fluid being sucked out, as illustrated in Figure 5, except for the further upstream fluid carrying more energy with itself relative to the downstream fluid. So, from this point of view, suction further upstream with larger-sized pipes and, simultaneously, bigger installation-angles is bad for system energy. On the other hand, with suction control, the severe separation has decreased a lot, and the interior passage of the air intake becomes more fluent. As a result, more fluid will be sucked into the air intake through its inlet. Thus, from this viewpoint, further upstream and more low-energy fluid suction is of benefit to the system-level energy. Overall, the total pressure is a characteristic parameter of fluid energy to some extent; its decrease or increase depends on the integration of the effects of the two aspects mentioned above. When the former one is in the dominant position, there are worse total pressure recovery and larger circumferential distortion coefficients, such as the scheme of suction near the throat, with suction pipe diameter and installation angle respectively equaling 12 mm and 45°, as shown in Figure 7a,c. Although suction at a downstream location, such as near the separation point, is good for system energy maintenance, it is very harmful to the separation decrease, as verified by Figure 7b,d. At last, as a compromise, the location between the upstream throat and the downstream separation point shows the biggest potentiality in improving total pressure recovery and decreasing the circumferential total pressure distortion coefficient, especially as a big-size suction pipe with a smaller suction angle has been selected, as shown in Figure 7a,c. At last, with the consideration of the synthetical effect of four main parameters (σ, AR, DC120, SC120) given in Figure 7, the scheme of sucking at the 1st bend with a suction angle and suction pipe diameter respectively equaling 15° and 12 mm is the best one among the 27 schemes listed here.
Nonuniform total pressure has been directly given at the inlet of the S-shaped air intake. Consequently, as shown in the left image of Figure 8, the obvious high total pressure region and the significant low total pressure region always coexist in all sections, and the area ratio between them has been affected by the intensity of the second flow, the variation of the cross-section area, and shape. In addition, the embryo of the “counter vortex” formed at the cross-section just between the 0.2(L + a) location and the “NearSeparation” point. The shape of the region covered by the low-energy fluid at the lower part of the sections is obviously affected by the intensity and size of the “counter vortex” once it is formed. Finally, the shape of the low-energy region at the exit of the air intake is mainly characterized by the approximately circular shape of the “counter vortex”. From the total pressure contour and surface streamline on the symmetry plane of the air intake given on the right side of Figure 8, it can be easily found that severe separation occurs just around the separation point at the bottom wall. At the same time, severe adverse flow appeared in this separation region and the total pressure in the adverse flow region was relatively lower.
In order to further explore the mechanism of why the value of σ or DC120 has a completely different variation tendency compared to parameters SC120 and AR, as discussed above, the variation of circumferential total pressure distortion on the cross-sections along the streamline direction in the prototype air intake without flow control has been discussed. Considering the shape of the cross-sections keeps changing and only the final section (namely the exit of the S-shaped air intake) is a perfect circle, another parameter DA characterizing the circumferential total pressure distortion has been given and defined by Formula (5). As shown in Figure 8 above, the value of DA decreases firstly along the streamline direction and to the first local minimum point, and then it gradually increases to the maximum point. Subsequently, it begins to decrease along the streamline direction until arriving at the exit of the S-shaped air intake. With detailed analyses, it can be found that the first local minimum point is located a little downstream of the 0.2(L + a) location (namely the position around the “counter vortex” embryo point), while the maximum point is located a bit upstream of the place (around the 0.6(L + a) location), where the adverse flow begins to change their direction back to the original main flow direction. The reason for this phenomenon is complicated. There is not only the influence of the shape variation of the sections along the streamwise direction but also the effect of the flow separation. For the former reason, the mix between the low-energy fluid and high-energy fluid has been strengthened, since the width of the air intake (Y direction) decreases along the main flow direction. On the other hand, once the flow separation occurs, the pressure in the back-flow region is much lower than the value in the non-back-flow region. So, because of these reasons, the value of DA firstly decreases and then increases gradually to the maximum point; subsequently, it decreases gradually until the air intake outlet. In addition, we find that the “counter vortex” can not only affect the shape of the low-energy fluid region at the lower part of sections but also strengthen the mix of the flow in the low-energy fluid region itself. So, to some extent, the “counter vortex” is good for decreasing the minimum total pressure value at the sections along the flow direction.
Figure 9 is the total pressure distribution and surface streamline on a group of equidistant streamwise sections in different schemes with and without suction control. From the view of flow field details, the conclusion obtained above from the aerodynamic parameter curves can be verified again, as the aerodynamic performance of the S-shaped inlet improves with the increase of the suction pipe diameter. Besides, another conclusion is that suction control with a smaller suction angle (such as 15°) and a further upstream suction location (such as the “Throat” location) can result in a bigger improvement. With suction control, the low-energy region at the lower part of the cross-sections along the main flow direction decreases a lot, especially as suction at the upstream location with a larger pipe diameter, such as suction near the throat with a suction pipe diameter and suction angle respectively equaling 12 mm and 15 degrees. Meanwhile, the size of the “counter vortex” structure decreases a lot but always exists, as shown in Figure 9c. Except for the amount of the low-energy fluid, the upward salient total pressure distribution has also decreased gradually with a decrease in the size of the “counter vortex” structure.
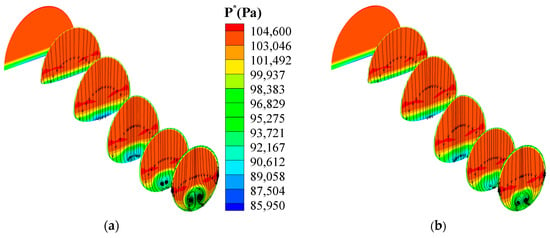
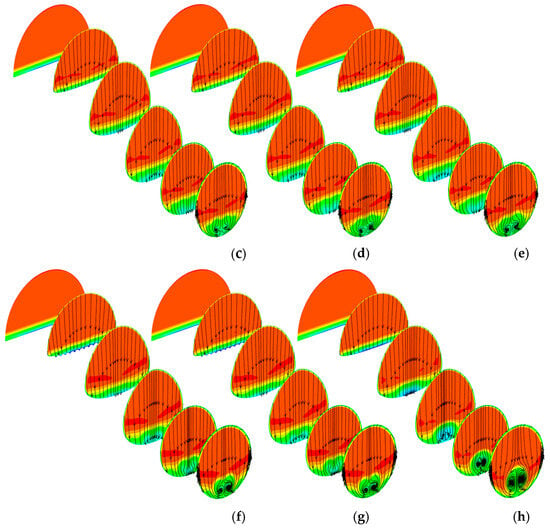
Figure 9.
Total pressure distribution and surface streamline on equidistant streamwise sections in different schemes with suction. (a) NearThroat_15°_8mm. (b) NearThroat_15°_10mm. (c) NearThroat_15°_12mm. (d) NearThroat_30°_12mm. (e) NearThroat_45°_12mm. (f) 1stBend_15°_12mm. (g) 1stBend_30°_12mm. (h) NearSeparation_15°_12mm.
A comparison of surface streamline and total pressure contour on the symmetry plane in different schemes has been put forward. With the suction pipe diameter increasing, the separation on the bottom wall decreases gradually. It can be clearly found that the separation originally reflected on the symmetry plane nearly disappeared during suction at the throat with a suction angle equaling 15 degrees and a suction pipe diameter finally increasing to 12 mm. Furthermore, some more striking low-energy fluid appeared at the back-flow region of the whole low-energy zone, as shown in Figure 10a,h. Except for the suction pipe diameter, the suction location is also a significant influence factor for the flow characters on the symmetry plane. As suction pipes move from the upstream location to the downstream position without changing their diameter and installation angle, the flow field improvement decreases a lot, such as from the throat (Figure 10c) to the position near the separation point, as illustrated in Figure 10h. Compared with suction location, suction angle variation leads to a relatively lower impact on the flow separation, though its influence indeed exists. Also, the area of the region covered by the low-energy fluid decreases a lot after suction control. However, it always exists, even in the optimal suction scheme, due to the comprehensive effect of the large boundary ingestion, strong adverse pressure gradient, and cross-second flow. As the low-energy fluid arrives at the exit of the S-shaped inlet, it covers about 40% of the baseline exit and decreases a lot with suction control.
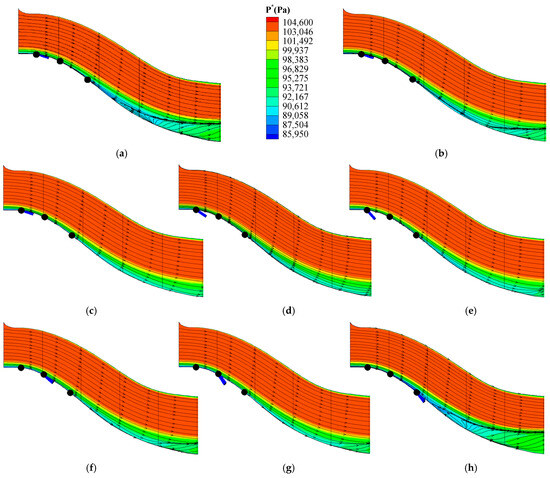
Figure 10.
Surface streamline and total pressure contour on the symmetry plane of the calculation domain in different schemes. (a) NearThroat_15°_8mm. (b) NearThroat_15°_10mm. (c) NearThroat_15°_12mm. (d) NearThroat_30°_12mm. (e) NearThroat_45°_12mm. (f) 1stBend_15°_12mm. (g) 1stBend_30°_12mm. (h) NearSeparation_15°_12mm.
For the sake of a more direct aerodynamic performance comparison between the 27 schemes studied here, the distributions of total pressure, second flow, and surface streamline on the exit of the air intake in these schemes have been given in Figure 11 and Figure 12. Firstly, this comparison visually verified a new conclusion that can be obtained from a simple analysis of the aerodynamic performance curves given in Figure 7. In particular, sucking at the throat with a suction pipe diameter and suction angle equaling 12 mm and 15 degrees (Figure 11d and Figure 12d), respectively, is the best scheme for decreasing the size and intensity of the second flow at the exit of the air intake among all the schemes studied here. In addition, as illustrated in Figure 5, this scheme is also of the largest suction mass flow. However, the data given in Figure 7 shows that this largest mass-flow suction control does not produce the biggest improvement. Moreover, though the initial boundary layer flow distortion given at the entrance of the air intake is followed by the influence of the circumferential pressure gradients that shape the low momentum boundary layer fluid into a central core of low total pressure fluid [32], both the size of the typical exit “counter vortex” structure and the intensity of the second flow at the AIP decrease a lot with reasonable suction. There is no doubt that the causes of the occurrence of the big-size “counter vortex” and the large low-energy region at the exit of the BLI S-shaped air intake are more complex. Relative to the conventional S-shaped air intake, it has something to do with the boundary layer ingestion. So, the low-energy region always exists, though the “counter vortex” nearly disappears, as shown in Figure 11d and Figure 12d, which is very different from previous research results of suction in non-BLI S-ducts [40].
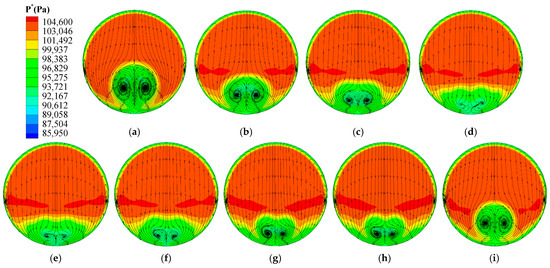
Figure 11.
Total pressure distribution and surface streamline on the exit of the air intake in different schemes. (a) NoContorl. (b) NearThroat_15°_8mm. (c) NearThroat_15°_10mm. (d) NearThroat_15°_12mm. (e) NearThroat_30°_12mm. (f) NearThroat_45°_12mm. (g) 1stBend_15°_12mm. (h) 1stBend_30°_12mm. (i) NearSeparation_15°_12mm.
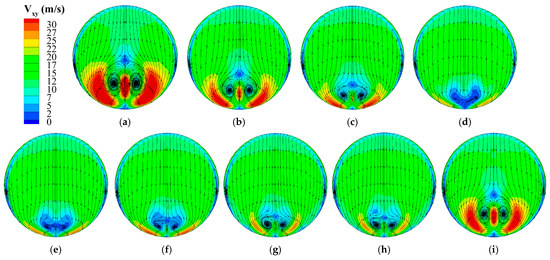
Figure 12.
Second flow distribution and surface streamline on the exit of the air intake in different schemes. (a) NoContorl. (b) NearThroat_15°_8mm. (c) NearThroat_15°_10mm. (d) NearThroat_15°_12mm. (e) NearThroat_30°_12mm. (f) NearThroat_45°_12mm. (g) 1stBend_15°_12mm. (h) 1stBend_30°_12mm. (i) NearSeparation_15°_12mm.
Figure 13 offers the wall limit streamlines which indicate the route of the massless particles attached to the bottom wall and released downstream from the air intake inlet. As shown in Figure 13a, without suction control, an obvious “counter vortex” limit streamline begins to form, a bit downstream of the 1st bend suction location but upstream of the “Near Separation” point in the prototype scheme. With the increase of the suction pipe diameter, the size of the “counter vortex” limit streamline decreases gradually until it disappears as the suction pipe diameter increases to 12 mm and the location selected for suction is near the throat coupling with suction angle equaling 15 degrees (Figure 13b–d). Additionally, the suction angle has an important influence on the bottom wall limit streamline distribution. From Figure 13d–f, it can be concluded that the wall limit streamlines structure changes a lot as the suction angle increases from 15 degrees to 45 degrees while the suction pipe size and suction location remain constant. Specifically, a smaller suction angle results in a smaller “counter vortex” structure on the bottom wall of the S-shaped air intake. In fact, this means less separation and a smaller “counter vortex” at the exit of the S-shaped inlet, as shown in Figure 11d–f and Figure 12d–f. Furthermore, from the perspective of the bottom wall limit streamline, suction further upstream results in a better effect. As the suction location moves from the position near the throat to the location near the separation point while the suction pipe diameter and the suction angle respectively keep equaling 12 mm and 15 degrees, not only does the size of the wall limit streamline “counter vortex” increase, but also its location moves further upstream, as illustrated in Figure 13d,g,i.
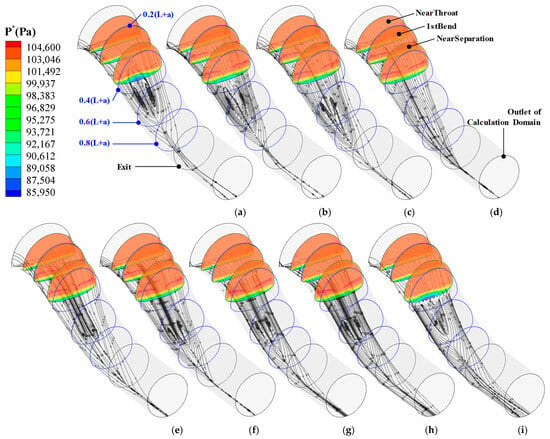
Figure 13.
Limit streamline on the bottom wall and total pressure distribution at 3 suction streamwise sections in different schemes. (a) NoContorl. (b) NearThroat_15°_8mm. (c) NearThroat_15°_10mm. (d) NearThroat_15°_12mm. (e) NearThroat_30°_12mm. (f) NearThroat_45°_12mm. (g) 1stBend_15°_12mm. (h) 1stBend_30°_12mm. (i) NearSeparation_15°_12mm.
3.3. Additional Improvement for the Original Suction Control
As stated earlier, the remarkable low-energy fluid region and the velocity nonuniformity always exist on the AIP, though the second flow can be decreased a lot with reasonable suction control. This phenomenon is very different from the results as this kind of micro-suction has been executed in the S-shaped air intake without boundary layer ingestion. It is clear that the flow separation occurring in the air intake studied here is mainly due to the large ingested boundary layer fluid having not enough energy to overcome the strong adverse pressure gradient, and it is not a problem mainly about flow stability. So, to cope with this problem, the main attention should be focused on the further reduction of the low-energy fluid via increasing the suction mass flow or supplying energy via blowing in high-energy fluid or reinforcing the mix between the high energy mainstream and the secondary flow. Based on the fact that blowing high-energy fluid can effectively avoid flow separation, but because the source of the blown fluid is a big problem, the other two methods seem to be more applicable.
On the other hand, hybrid systems can have an additional benefit on performance parameters, compared to passive or active flow control alone [41]. As to mixing the mainstream and the secondary flow, some passive flow control technology, such as the vortex generator, shows great potential [42,43,44,45,46,47]. So, in this additional suction supplementary method research section, large mass flow suction control has been researched first, and then the combination of the micro-suction control and the vortex generator control. As for comparison, complementary flow control with vortex generator vanes alone has also been studied. The instruments corresponding to large mass flow suction and the active-passive combinational flow control are respectively shown in Figure 14a,b. What should be noted is that the air rectification vanes always coexist with the vortex generator vanes. The suction pipes are installed at the 1st bend with installation angle and pipe diameter respectively equaling 15 degrees and 12 mm. In other words, the model of the best micro-suction scheme concluded above is taken as the prototype here.

Figure 14.
The instruments for additional flow control to the suction flow control. (a) Large mass flow suction. (b) Suction combined with vanes.
The aerodynamic parameters of the 3 additional schemes are offered in Table 2, as shown below. It is quite clear that the circumferential total pressure distortion coefficient decreases a lot under the effect of the vortex generators or large mass flow suction. In the active-passive combinational flow control scheme, the decrement is about 90.84% as compared to the single-suction scheme. The decrements corresponding to the large mass flow suction scheme and the single VGs flow control scheme are about 93.11% and 60.77%, respectively. From the view of the swirl distortion coefficient, effects that were somewhat worse appeared in all three additional schemes when contrasted with the original single-suction scheme. However, all of these deceased a lot relative to the no flow control scheme. This is because a slightly stronger second flow has been produced as VGs or large mass flow suction has been taken, as shown in Figure 15f–h. As to the total pressure recovery, there is nearly no difference between the combination flow control scheme and the single-suction scheme. Likewise, the total pressure recovery of the single VGs scheme is approximately equal to the value in the no-control scheme. These are not particularly surprising, since the main effect of the vanes is merely to redistribute the low-energy fluid to create a more uniform flow at the air intake exit.

Table 2.
Aerodynamic parameters corresponding to the additional improvement schemes.
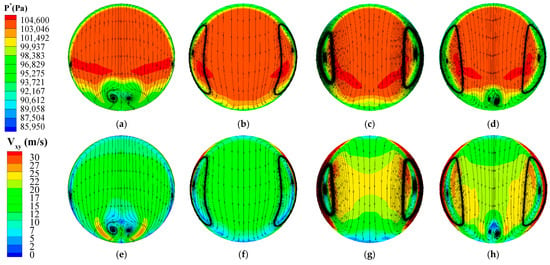
Figure 15.
Total pressure, surface streamline, and second flow distribution on the exit of the air intake in the improvement schemes. (a) P*_1stBend_15°_12mm. (b) P*_Large massflow suction. (c) P*_1stBend_15°_12mm_Vanes. (d) P*_No scution_Vanes. (e) Vxy_1stBend_15°_12mm. (f) Vxy_Large massflow suction. (g) Vxy_1stBend_15°_12mm_Vanes. (h) Vxy_No scution_Vanes.
The most special and attractive scheme is the large mass flow suction scheme, in which the value of the total pressure recovery coefficient is larger than 1. This phenomenon is mainly because about 9% of the mass flow at the inlet of the air intake has been sucked out. Furthermore, this sucked fluid is mainly low-energy fluid. With large mass flow suction, the fluency of the fluid in the S-shaped air intake improves a lot. As a result, the mass flow rate at the exit of the air intake increases by about 5.27% relative to the no-control condition. It is not difficult to find that the suction of the low-energy fluid is good for increasing the mass flow at the air intake exit, while the vortex generators and fluid rectification vanes are bad for it. As to the low-energy region, the large mass flow suction scheme brings the best effect, though all four flow control schemes listed in Table 2 can decrease it.
Figure 15 gives the total pressure, second flow distribution, and surface streamline on the exit of the air intake in the improvement schemes. It is obvious that the low-energy region at the exit of the air intake dropped to different extents in different improvement schemes. Furthermore, the pictures illustrate that the large mass flow suction scheme brings the biggest low-energy fluid region decrease; next is the combinational scheme, and last is the single VGs scheme. In addition, as the swirl distortion coefficient given in Table 2 shows, the second flow increases to some extent, relative to the single-suction scheme, and the apparent “counter vortex” originally appearing at the core of the air intake-exit lower part disappears during the large mass flow suction or combinational flow control scheme (Figure 15f,g). Overall, except for the total pressure recovery efficiency being larger than 1, the large mass flow suction scheme seems to produce the best flow control effect. However, some previous research shows that boundary layer ingestion can result in decreases in fuel burn by several percentage points [2,5,48]. Hence, from a more comprehensive perspective, large suction out of the low-energy fluid is not completely good for the overall performance of the propulsion system. Mixing the main flow with low-energy fluid may be a better choice. Although the second flow intensity and the swirl distortion coefficient at the air intake exit increase a bit, the combinational scheme is still thought to be the best potential method here because both the swirl distribution and the second flow can be further decreased if the suction active flow control and the VGs passive flow control match better. In fact, there are many influence factors and further research about the combinational flow control that combines suction and vortex generator vanes will proceed in the following study in the near future.
4. Conclusions
Numerical simulations of suction control in a boundary layer ingestion S-shaped inlet have been conducted. For exploring the effect of suction parameters, variation in the aerodynamic performance of the air intake, suction pipe diameter, suction location, and angle have been selected as variables. After CFD method validation, a series of suction control schemes have been researched. Then, some improvement measures have also been taken and simulated as a supplementary for the effect-limited conventional micro mass flow suction. With detailed comparisons of the results, some meaningful conclusions have been obtained, as shown below.
(I) With the comprehensive effects of large boundary ingestion, strong adverse pressure gradient, and cross second flow, serve flow separation and second flow occur in the S-shaped inlet. Finally, the serve circumferential total pressure distortion and swirl distortion appeared at the air intake exit. With suction control, the whole aerodynamic performance improves, and all three variables listed here can significantly affect the suction effect. What should be noted is that one suction parameter variation results in different impacts on different aerodynamic performance assessment parameters. For example, further upstream suction is good for the decrease of the second flow intensity and the low-energy fluid region at the exit of the S-shaped inlet but is harmful to the total pressure recovery and the circumferential total pressure distortion.
(II) As the suction angle and suction location keep constant, a bigger suction pipe diameter brings a better effect due to the more low-energy fluid being sucked out. However, this does not mean the largest suction mass flow creates the biggest improvement. Among the 27 schemes investigated here, the scheme that sucks at the throat with suction angle and suction pipe diameter respectively equaling 15 degrees and 12 mm produces the most suction mass flow, but the aerodynamic performance of the air intake with this suction scheme is not the best. From the perspective of the uniformity of total pressure at the S-shaped inlet exit, there is an optimal location for suction between the throat and the separation start point.
(III) In general, a smaller suction angle with an upper stream suction location is better for the improvement of the diffuser’s aerodynamic performance. The angle of 15 degrees is the best one for suction control among the three suction angles researched here. Overall, sucking at the 1st bend with suction angle and suction pipe diameter equaling 15 degrees and 12 mm, respectively, is the optimal scheme. The cross-second flow intensity and the surface streamline structure at the air intake exit have a great impact on the total pressure distribution on this exit.
(IV) Since the shape of cross-sections along the main flow direction can influence the cross-second flow, it can affect the second flow and the surface streamline on the air intake exit. Indeed, the change rule of the cross-section area along the centerline has not changed during suction control. So, the second flow and complex surface streamline at the exit of the diffuser cannot be eliminated, though they can be decreased a lot with reasonable suction control. Similarly, the remarkable low-energy fluid region at the air intake exit always exists because of large boundary ingestion, though the separation and second flow have been reduced significantly. This is very different from the results of micro-suction in non-BLI S-shaped air intake.
(V) To pursue a higher improvement, suction combined with a vortex generator has been further studied. Corresponding results analysis shows that this kind of hybrid flow control has great potential, which should be investigated in detail in the future.
Author Contributions
Conceptualization, L.L. and G.L.; methodology, L.L.; software, S.W.; validation, B.W. and L.L.; formal analysis, L.L.; investigation, L.L.; resources, L.L.; data curation, B.W.; writing—original draft preparation, L.L.; writing—review and editing, L.L.; visualization, B.W.; supervision, G.L.; project administration, G.L.; funding acquisition, L.L., G.L. and B.W. All authors have read and agreed to the published version of the manuscript.
Funding
This research was funded by China Postdoctoral Science Foundation (Grant No. 2020M671717), the Open Project of State Key Laboratory of Clean Energy Utilization, Zhejiang University (Grant No.ZJUCEU2011002), the National Natural Science Foundation of China (Grant No. 12002335 and Grant No. 51805124), and the Zhejiang Provincial Natural Science Foundation of China (Grant No. LZY22E050001).
Data Availability Statement
The data presented in this study are available on request from the corresponding author and the 1st author.
Conflicts of Interest
Authors declare that this investigation was conducted in the absence of any commercial or financial relationships that could be construed as a potential conflict of interest.
Nomenclature
| AL | the area of the low-energy fluid at the air intake exit |
| AExit | the area of the air intake exit |
| AR | the ratio of AL/AExit |
| Cp | static pressure coefficient |
| BLI | boundary layer ingestion |
| d | the diameter of the suction pipes |
| D | the diameter of the air intake exit |
| DC120 | the circumferential total pressure distortion coefficient at the exit of the air intake |
| H | the height of the air intake inlet |
| mdesign | design mass flow rate of the air intake |
| mexit | mass flow rate at the air intake exit |
| minlet | mass flow rate at the air intake inlet |
| msuction | the mass flow that has been sucked out |
| P | static pressure |
| Pexit | the static pressure at the air intake exit |
| Psuction | the backpressure at the exit of the suction pipes |
| P*(x) | the total pressure at the air intake inlet |
| P* | total pressure |
| q | the average dynamic pressure |
| R | the curvature radius of the S-duct for validation |
| SC120 | the swirl distortion coefficient at the air intake exit |
| T* | total temperature |
| VFAV | area average velocity |
| Vpipe,15deg | the velocity of the main flow in the suction pipes with an installation angle equaling 15 degrees |
| Vxy,120 | second flow velocity in a circular sector of 120° |
| Vxz,main | resultant velocity in the X and Z direction of the main flow |
| x | the height from the bottom wall at the air intake inlet |
| θ | cross-stream polar angle |
| α | the installation angle of the suction pipe |
| σ | total pressure recovery of the S-shaped air intake |
| δ | boundary layer thickness |
| Δx | the distance between the throat centroid of the air intake and the exit centroid |
| Subscripts | |
| design | the design condition |
| exit | the exit of the S-shaped inlet |
| FAV | the area average value |
| H | high-energy region |
| L | low-energy region |
| max | maximum value |
| min | minimum value |
| no control | condition without flow control |
| pipe | the suction pipes |
| section A | the A-A cross-section of the S-duct for validation |
| section E | the E-E cross-section of the S-duct for validation |
| suction | suction control |
| wall valid | the wall of the S-duct for validation |
| 120 | circular sector whose angle is 120 |
| 15 deg | suction pipe with a 15-degree installation angle |
| Superscripts | |
| * | total condition |
References
- Berrier, B.L.; Carter, M.B.; Brian, G.A. High Reynolds Number Investigation of a Flush-Mounted, S-Duct Inlet with Large Amounts of Boundary Layer Ingestion; NASA/TP-2005-213766; Langley Research Center, NASA: Hampton, VA, USA, 2005.
- Plas, A.P.; Sargeant, M.A.; Madani, V.; Crichton, D.; Greitzer, E.M.; Hynes, T.P.; Hall, C.A. Performance of a Boundary Layer Ingesting (BLI) Propulsion System. In Proceedings of the 45th AIAA Aerospace Sciences Meeting and Exhibit, Reno, NV, USA, 8–11 January 2007. [Google Scholar]
- Sabo, K.M.; Drela, M. Benefits of Boundary Layer Ingestion Propulsion. In Proceedings of the AIAA SciTech, 53rd AIAA Aerospace Sciences Meeting, Kissimmee, FL, USA, 5–9 January 2015. [Google Scholar]
- Ochs, S.S.; Tillman, G.; Joo, J.; Voytovych, D. CFD-based Analysis of Boundary Layer Ingesting Propulsion. In Proceedings of the Propulsion and Energy Forum, 51st AIAA/SAE/ASEE Joint Propulsion Conference, Orlando, FL, USA, 27–29 July 2015. [Google Scholar]
- Uranga, A.; Drela, M.; Greitzer, E.M.; Hall, D.K.; Titchener, N.A.; Lieu, M.K.; Siu, N.M.; Casses, C.; Huang, A.C.; Gatlin, G.M.; et al. Boundary Layer Ingestion Benefit of the D8 Transport Aircraft. AIAA J. 2017, 55, 3693–3708. [Google Scholar] [CrossRef]
- Hall, D.K.; Huang, A.C.; Uranga, A.; Greitzer, E.M.; Drela, M.; Sato, S. Boundary Layer Ingestion Propulsion Benefit for Transport Aircraft. J. Propuls. Power 2017, 33, 1118–1129. [Google Scholar] [CrossRef]
- Arend, D.J.; Wolter, J.D.; Hirt, S.M.; Provenza, A.; Gazzaniga, J.A.; Cousins, W.T.; Hardin, L.W.; Sharma, O. Experimental Evaluation of an Embedded Boundary Layer Ingesting Propulsor for Highly Efficient Subsonic Cruise Aircraft. In Proceedings of the AIAA Propulsion and Energy Forum, 53rd AIAA/SAE/ASEE Joint Propulsion Conference, Atlanta, GA, USA, 10–12 July 2017. [Google Scholar]
- Rademakers, R.P.M.; Bindl, S.; Niehuis, R. Effects of flow distortions as they occur in s-duct inlets on the performance and stability of a jet engine. In Proceedings of the ASME Turbo Expo 2015: Turbine Technical Conference and Exposition, Montréal, QC, Canada, 15–19 June 2015. [Google Scholar]
- Liu, L.; Chen, F.; Luo, K.; Pan, H.; Qin, H.; Wang, F.; Zhou, M.; Tian, X. Blowing-suction control in s-shaped inlet and its impact on fan-stage performance. AIAA J. 2019, 57, 3954–3968. [Google Scholar] [CrossRef]
- Laskaridis, P.; Singh, R.; Pachidis, V.; Pilidis, P. Opportunities and challenges for distributed propulsion and boundary layer ingestion. Aircr. Eng. Aerosp. Technol. 2014, 86, 451–458. [Google Scholar] [CrossRef]
- Perovic, D.; Hall, C.A.; Gunn, E.J. Stall inception in a boundary layer ingesting fan. In Proceedings of the ASME Turbo Expo 2015: Turbine Technical Conference and Exposition GT2015, Montréal, QC, Canada, 15–19 June 2015. [Google Scholar]
- Lucas, J.R.; O’Brien, W.F.; Ferrar, A.M. Effect of BLI–type inlet distortion on turbofan engine performance. In Proceedings of the ASME Turbo Expo 2014: Turbine Technical Conference and Exposition, Düsseldorf, Germany, 16–20 June 2014. [Google Scholar]
- Romani, G.; Ye, Q.; Avallone, F.; Ragni, D.; Casalino, D. Numerical analysis of fan noise for the NOVA boundary-layer ingestion configuration. Aerosp. Sci. Technol. 2020, 96, 105532. [Google Scholar] [CrossRef]
- Zhang, W.; Stapelfeldt, S.; Vahdati, M. Influence of the inlet distortion on fan stall margin at different rotational speeds. Aerosp. Sci. Technol. 2020, 98, 105668. [Google Scholar] [CrossRef]
- Frohnapfel, D.J.; O’Brien, W.F. Fan Response to Inlet Swirl Distortions Produced by Boundary Layer Ingesting Aircraft Configurations. In Proceedings of the Propulsion and Energy Forum, 51st AIAA/SAE/ASEE Joint Propulsion Conference, Orlando, FL, USA, 27–29 July 2015. [Google Scholar]
- Lu, H.; Yang, Z.; Pan, T.; Li, Q. Non-uniform stator loss reduction design strategy in a transonic axial-flow compressor stage under inflow distortion. Aerosp. Sci. Technol. 2019, 92, 347–362. [Google Scholar] [CrossRef]
- Gunn, E.J.; Hall, C.A. Aerodynamics of Boundary Layer Ingesting Fans. In Proceedings of the ASME Turbo Expo 2014: Turbine Technical Conference and Exposition, Düsseldorf, Germany, 16–20 June 2014. [Google Scholar]
- Zhu, H.; Hao, W.; Li, C.; Ding, Q.; Wu, B. Application of flow control strategy of blowing, synthetic and plasma jet actuators in vertical axis wind turbines. Aerosp. Sci. Technol. 2019, 88, 468–480. [Google Scholar] [CrossRef]
- Lee, B.J.; Liou, M.S.; Kim, C. Optimizing a Boundary-Layer-Ingestion Offset Inlet by Discrete Adjoint Approach. AIAA J. 2010, 48, 2008–2016. [Google Scholar] [CrossRef]
- Rodriguez, D.L. Multidisciplinary Optimization Method for Designing Boundary-Layer-Ingesting Inlets. J. Aircr. 2009, 46, 883–894. [Google Scholar] [CrossRef]
- Zenkner, S.; Trost, M.; Becker, R.; Voß, C. Preliminary engine design and inlet optimization of the MULDICON concept. Aerosp. Sci. Technol. 2019, 93, 105318. [Google Scholar] [CrossRef]
- Lima, L.S.M.; Huebner, R.; Tobaldini, L. Numerical Investigations of S-Shaped Air Inlet for Embedded Engines. J. Propuls. Power 2019, 35, 475–489. [Google Scholar] [CrossRef]
- Rudin, I.; Arad, E.; Cohen, J. Performance enhancement of boundary layer ingesting inlet using active flow control methods. In Proceedings of the AIAA AVIATION Forum, 2018 Applied Aerodynamics Conference, Atlanta, GA, USA, 25–29 June 2018. [Google Scholar]
- Asghar, A.; Sidhu, S.; Allan, W.D.E.; Ingram, G.; Hickling, T.M.; Stowe, R. Investigation of a passive flow control device in an s-duct inlet of a propulsion system with high subsonic flow. In Proceedings of the ASME Turbo Expo 2018, Turbomachinery Technical Conference and Exposition, Oslo, Norway, 11–15 June 2018. [Google Scholar]
- Tanguy, G.; MacManus, D.G.; Zachos, P.; Gil-Prieto, D.; Garnier, E. Passive Flow Control Study in an S-Duct Using Stereo Particle Image Velocimetry. AIAA J. 2017, 55, 1862–1877. [Google Scholar] [CrossRef]
- Selvanayagam, J.; Aliaga, C.; Stokes, J.; Sasanapuri, B. Numerical Simulation of an Aircraft Engine Intake S-Duct Diffuser. In Proceedings of the AIAA Propulsion and Energy Forum, 53rd AIAA/SAE/ASEE Joint Propulsion Conference, Atlanta, GA, USA, 10–12 July 2017. [Google Scholar]
- Sakidin, H.; Jessam, R.A.; Al-Kayiem, H.H.; Nasif, M.S.; Yusof, M.H.; Sa’ad, N.; Ling Chuan Ching, D.; Abdul Karim, S.A. Flow control in s-shaped air intake diffuser of gas turbine using proposed energy promoters. MATEC Web Conf. 2017, 131, 02006. [Google Scholar] [CrossRef][Green Version]
- Lakebrink, M.T.; Mani, M.; Winkler, C. Numerical investigation of fluidic oscillator flow control in an s-duct diffuser. In Proceedings of the AIAA SciTech Forum, 55th AIAA Aerospace Sciences Meeting, Grapevine, TX, USA, 9–13 January 2017. [Google Scholar]
- Keerthi, M.C.; Kushari, A.; Somasundaram, V. Experimental study of suction flow control effectiveness in a serpentine intake. J. Fluids Eng. 2017, 139, 101104. [Google Scholar] [CrossRef]
- Vaccaro, J.C.; Elimelech, Y.; Chen, Y.; Sahni, O.; Jansen, K.E.; Amitay, M. Experimental and numerical investigation on steady blowing flow control within a compact inlet duct. Int. J. Heat Fluid Flow 2015, 54, 143–152. [Google Scholar] [CrossRef]
- Gu, J.W.; Ren, J.; Wu, N.; Li, M.; Hu, Q.; Liu, H.; Chen, X.L.; Liu, E.H. Numerical Analysis of Effect of Boundary Layer Characteristics on the Flow Field in S-shaped Inlet. MATEC Web Conf. 2015, 25, 01011. [Google Scholar] [CrossRef][Green Version]
- Ghaedamini Harouni, A. Flow control of a boundary layer ingesting serpentine diffuser via blowing and suction. Aerosp. Sci. Technol. 2014, 39, 472–480. [Google Scholar] [CrossRef]
- Zhiyin, Y. Large-eddy simulation: Past, present and the future. Chin. J. Aeronaut. 2015, 28, 11–24. [Google Scholar] [CrossRef]
- De Vanna, F.; Bernardini, M.; Picano, F.; Benini, E. Wall-modeled LES of shock-wave/boundary layer interaction. Int. J. Heat Fluid Flow 2022, 98, 109071. [Google Scholar] [CrossRef]
- Schlatter, P.; ÖRlÜ, R. Assessment of direct numerical simulation data of turbulent boundary layers. J. Fluid Mech. 2010, 659, 116–126. [Google Scholar] [CrossRef]
- Fiola, C.; Agarwal, R.K. Simulation of Secondary and Separated Flow in Diffusing S Ducts. J. Propuls. Power 2015, 31, 180–191. [Google Scholar] [CrossRef]
- Fiola, C.; Agarwal, R.K. Simulation of secondary and separated flow in a diffusing S-duct using four different turbulence models. Proc. Inst. Mech. Eng. Part G J. Aerosp. Eng. 2013, 228, 1954–1963. [Google Scholar] [CrossRef]
- Wellborn, S.; Reichert, B.; Okiishi, T. An experimental investigation of the flow in a diffusing S-duct. In Proceedings of the 28th Joint Propulsion Conference and Exhibit, Nashville, TN, USA, 6–8 July 1992. [Google Scholar]
- Gan, W.; Zhang, X. Design optimization of a three-dimensional diffusing S-duct using a modified SST turbulent model. Aerosp. Sci. Technol. 2017, 63, 63–72. [Google Scholar] [CrossRef]
- Debiasi, M.; Herberg, M.; Zeng, Y.; Tsai, H.M.; Dhanabalan, S. Control of Flow Separation in S-Ducts via Flow Injection and Suction. In Proceedings of the 46th AIAA Aerospace Sciences Meeting and Exhibit, Reno, NV, USA, 7–10 January 2008. [Google Scholar]
- Wojewodka, M.M.; White, C.; Shahpar, S.; Kontis, K. A review of flow control techniques and optimization in s-shaped ducts. Int. J. Heat Fluid Flow 2018, 74, 223–235. [Google Scholar] [CrossRef]
- Keerthi, M.C.; Kushari, A. Effectiveness of Vortex Generator Jets and Wall Suction on Separated Flows in Serpentine-Duct Diffuser. Aerosp. Sci. Technol. 2014, 34, 12–19. [Google Scholar] [CrossRef]
- Paul, A.R.; Ranjan, P.; Patel, V.K.; Jain, A. Comparative studies on flow control in rectangular S-duct diffuser using submerged-vortex generators. Aerosp. Sci. Technol. 2013, 28, 332–343. [Google Scholar] [CrossRef]
- Yi, J.; Kim, C.; Lee, B.J. Adjoint-based design optimization of vortex generator in an s-shaped subsonic inlet. AIAA J. 2012, 50, 2492–2507. [Google Scholar] [CrossRef]
- Yi, J.; Lee, B.J.; Kim, C. Efficient Design Optimization of Vortex Generators in Subsonic Offset Inlet by Discrete Adjoint Approach. In Proceedings of the 20th AIAA Computational Fluid Dynamics Conference, Honolulu, HI, USA, 27–30 June 2011. [Google Scholar]
- Annbtawi, A.J.; Blackweldeq, R.F.; Lissnmnn, P.B.S.; Liebeck, R.H. An Experimental Study of Vortex Generators in Boundary Layer Ingesting Diffusers with a Centerline Offset. In Proceedings of the 35th AIAA/ASME/SAE/ASEE Joint Propulsion Conference and Exhibit, Los Angeles, CA, USA, 20–24 June 1999. [Google Scholar]
- Aref, P.; Ghoreyshi, M.; Jirasek, A.; Satchell, M.J. CFD Validation and Flow Control of RAE-M2129 S-Duct Diffuser Using CREATETM-AV Kestrel Simulation Tools. Aerospace 2018, 5, 31. [Google Scholar] [CrossRef]
- Webster, R.; Sreenivas, K.; Hyams, D.; Hilbert, B.; Briley, W.; Whitfield, D. Demonstration of Sub-system Level Simulations: A Coupled Inlet and Turbofan Stage. In Proceedings of the 48th AIAA/ASME/SAE/ASEE Joint Propulsion Conference & Exhibit, Atlanta, GA, USA, 30 July–1 August 2012. [Google Scholar]
Disclaimer/Publisher’s Note: The statements, opinions and data contained in all publications are solely those of the individual author(s) and contributor(s) and not of MDPI and/or the editor(s). MDPI and/or the editor(s) disclaim responsibility for any injury to people or property resulting from any ideas, methods, instructions or products referred to in the content. |
© 2023 by the authors. Licensee MDPI, Basel, Switzerland. This article is an open access article distributed under the terms and conditions of the Creative Commons Attribution (CC BY) license (https://creativecommons.org/licenses/by/4.0/).