1. Introduction
The space radiation environment represents a multifaceted milieu profoundly influenced by solar activity, demonstrating temporal variability and distinct spatial patterns. While a spacecraft orbits, it becomes susceptible to energetic charged particles from space that permeate the structural shielding. These particles give rise to ionizing or non-ionizing interactions with the spacecraft’s surface materials and communication equipment. Consequently, energy and charge are transferred to the spacecraft’s components, leading to the cumulative effects of ionization, displacement, or single-event effects [
1,
2]. This radiation-induced effect varies the material properties of the spacecraft, ultimately diminishing its reliability and operational lifespan and potentially resulting in catastrophic damage [
3,
4,
5].
In this study, we assessed the radiation doses experienced in geostationary earth orbit (GEO), medium earth orbit (MEO), and low earth orbit (LEO) based on radiation data collected by three key satellites: FY4-A (positioned in GEO, launched in December 2016), BD3-M15 (positioned in MEO, launched in October 2018), and YH1-01A (positioned in LEO, launched in November 2016). Additionally, we investigated the disparities in radiation levels across distinct orbital environments and the underlying mechanisms and characteristics governing radiation dose variations in the context of space environment disturbances. This study provides crucial insights into the fluctuations of the radiation doses on Earth during the 25th solar cycle.
2. PMOS Dose Detectors and Their Host Satellites
The National Space Science Center of the Chinese Academy of Sciences has conceived positive channel Metal Oxide Semiconductor (PMOS) radiation dose detectors, purposefully designed for monitoring radiation levels across diverse orbital trajectories. These detectors comprise an electronic control unit and multiple dose probes, with the flexibility to adjust probe direction and positioning according to the mission requirements dictated by various orbits [
6,
7,
8,
9]. A consolidated block diagram illustrating the structural configuration is shown in
Figure 1. The PMOS detector measures the accumulated radiation dose and transmits the detection data to the electric control unit (ECU) for processing. After digitization by the Remote Terminal Unit (RTU), the data are packaged and transmitted to the satellite platform. Notably, PMOS radiation dose detectors, developed by the National Space Science Center of the Chinese Academy of Sciences, are integral components of the space environment monitoring subsystem for payloads on FY4-A, BD3M15, and YH1-01A. For our data collection, we selected and utilized the total radiation doses recorded by these three satellites during the period spanning November 2018 to November 2022. This monitoring duration straddles the transition from the 24th to the 25th solar cycle.
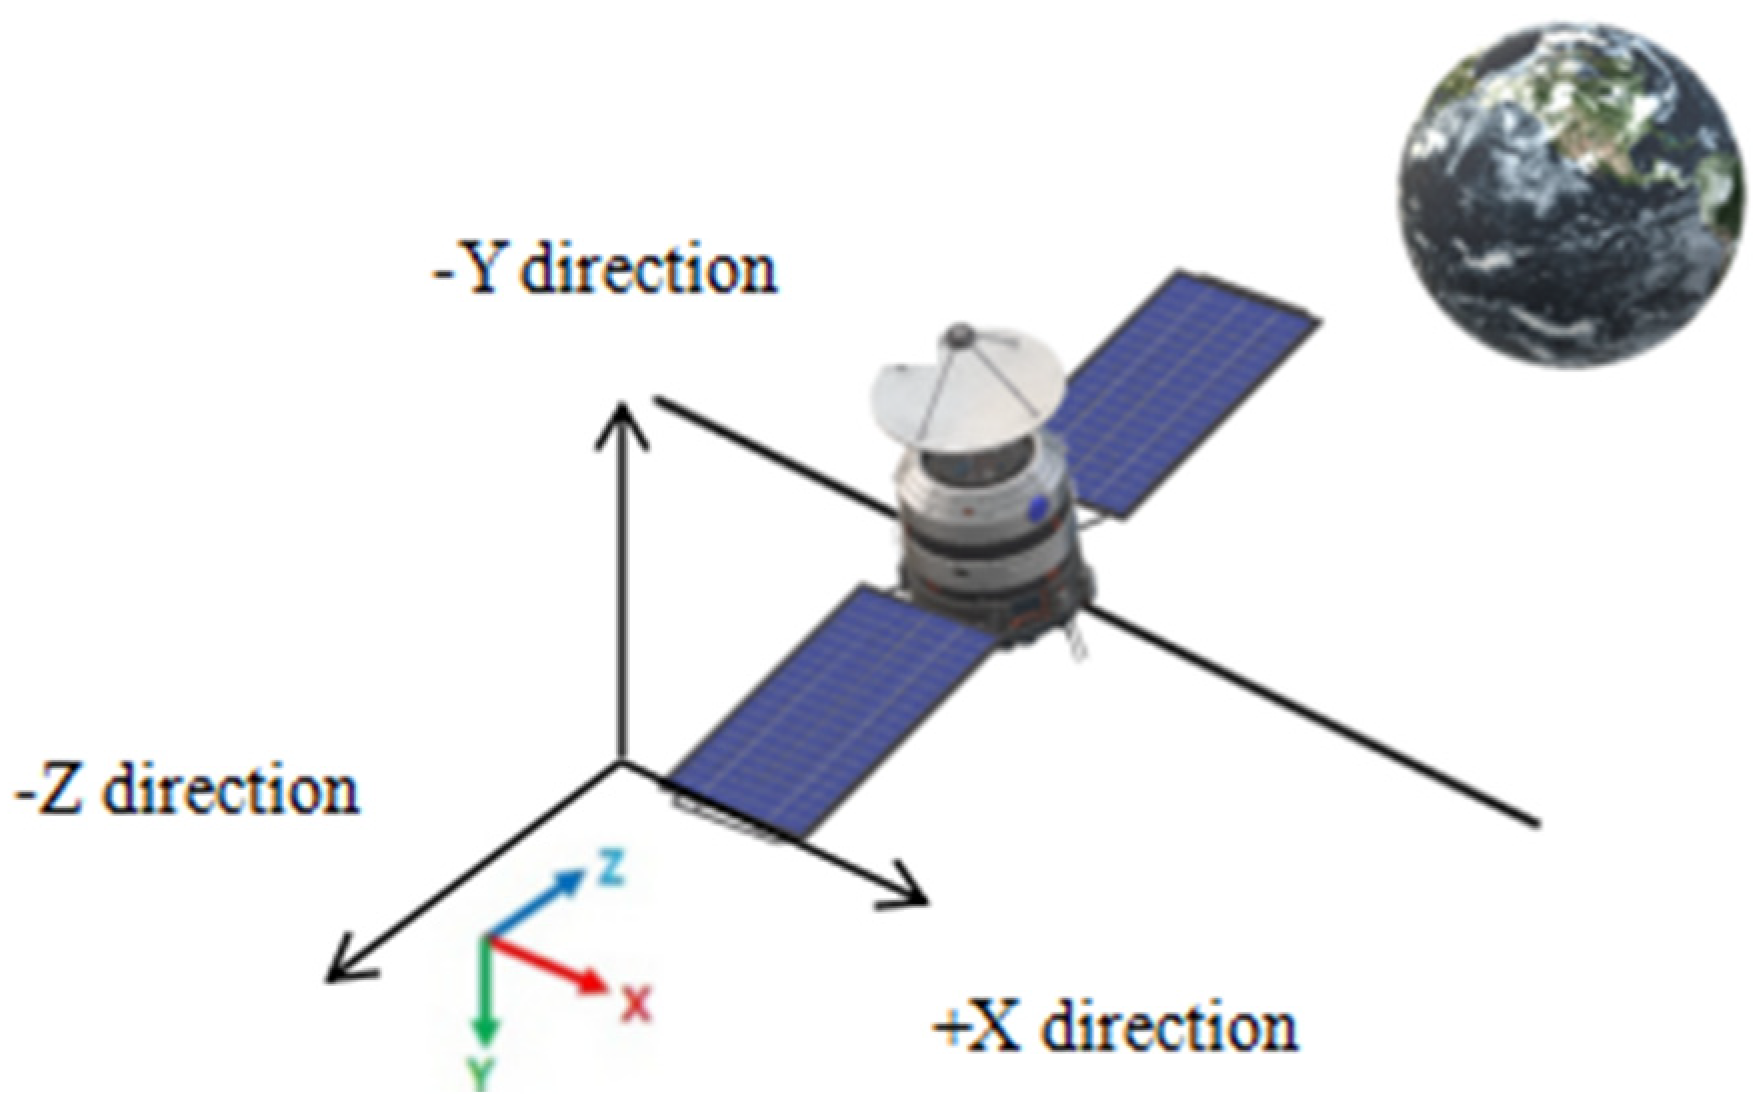
Within the satellite’s orbital orientation, the X direction signifies its flight path, while the Z direction corresponds to the Earth’s orientation.
Figure 2 schematically illustrates the satellite’s positioning relative to Earth during its orbital trajectory and the directional focus of different PMOS radiation dose detectors.
FY4-A, a geosynchronous orbit satellite launched from Xichang, China, in December 2016, is equipped with eight PMOS radiation dose probes. Specifically, we harnessed data pertaining to total doses measured along the +X, −Y, and −Z axes. BD3-M15, an MEO satellite, commenced its orbital journey in October 2018, maintaining an approximate altitude of 21,500 km. It incorporates three radiation dose detectors, responsible for gauging total radiation doses along the +X, −Y, and −Z axes, respectively. Lastly, YH1-01A, positioned in LEO and launched in November 2016, carries out the monitoring of atmospheric and marine environmental factors while concurrently capturing data on the space environment. The radiation dose detectors onboard YH1-01A assess total doses along the −X, −Y, and +Z axes.
Since the PMOS radiation dose detectors on these three satellites all use open detection, there is only the satellite’s skin shield, which is 1 mm thick Al. Therefore, when we analyze the radiation dose data, we have unified the shielding environment of the detector.
In some extremely low dose rate environments in space, the enhanced low dose rate sensitivity (ELDRS) effect is difficult to avoid, and we have established relevant evaluation methods for the ELDRS effect. In this study, the radiation dose data we obtained have been evaluated and processed for ELDRS.
3. Detected Radiation Doses
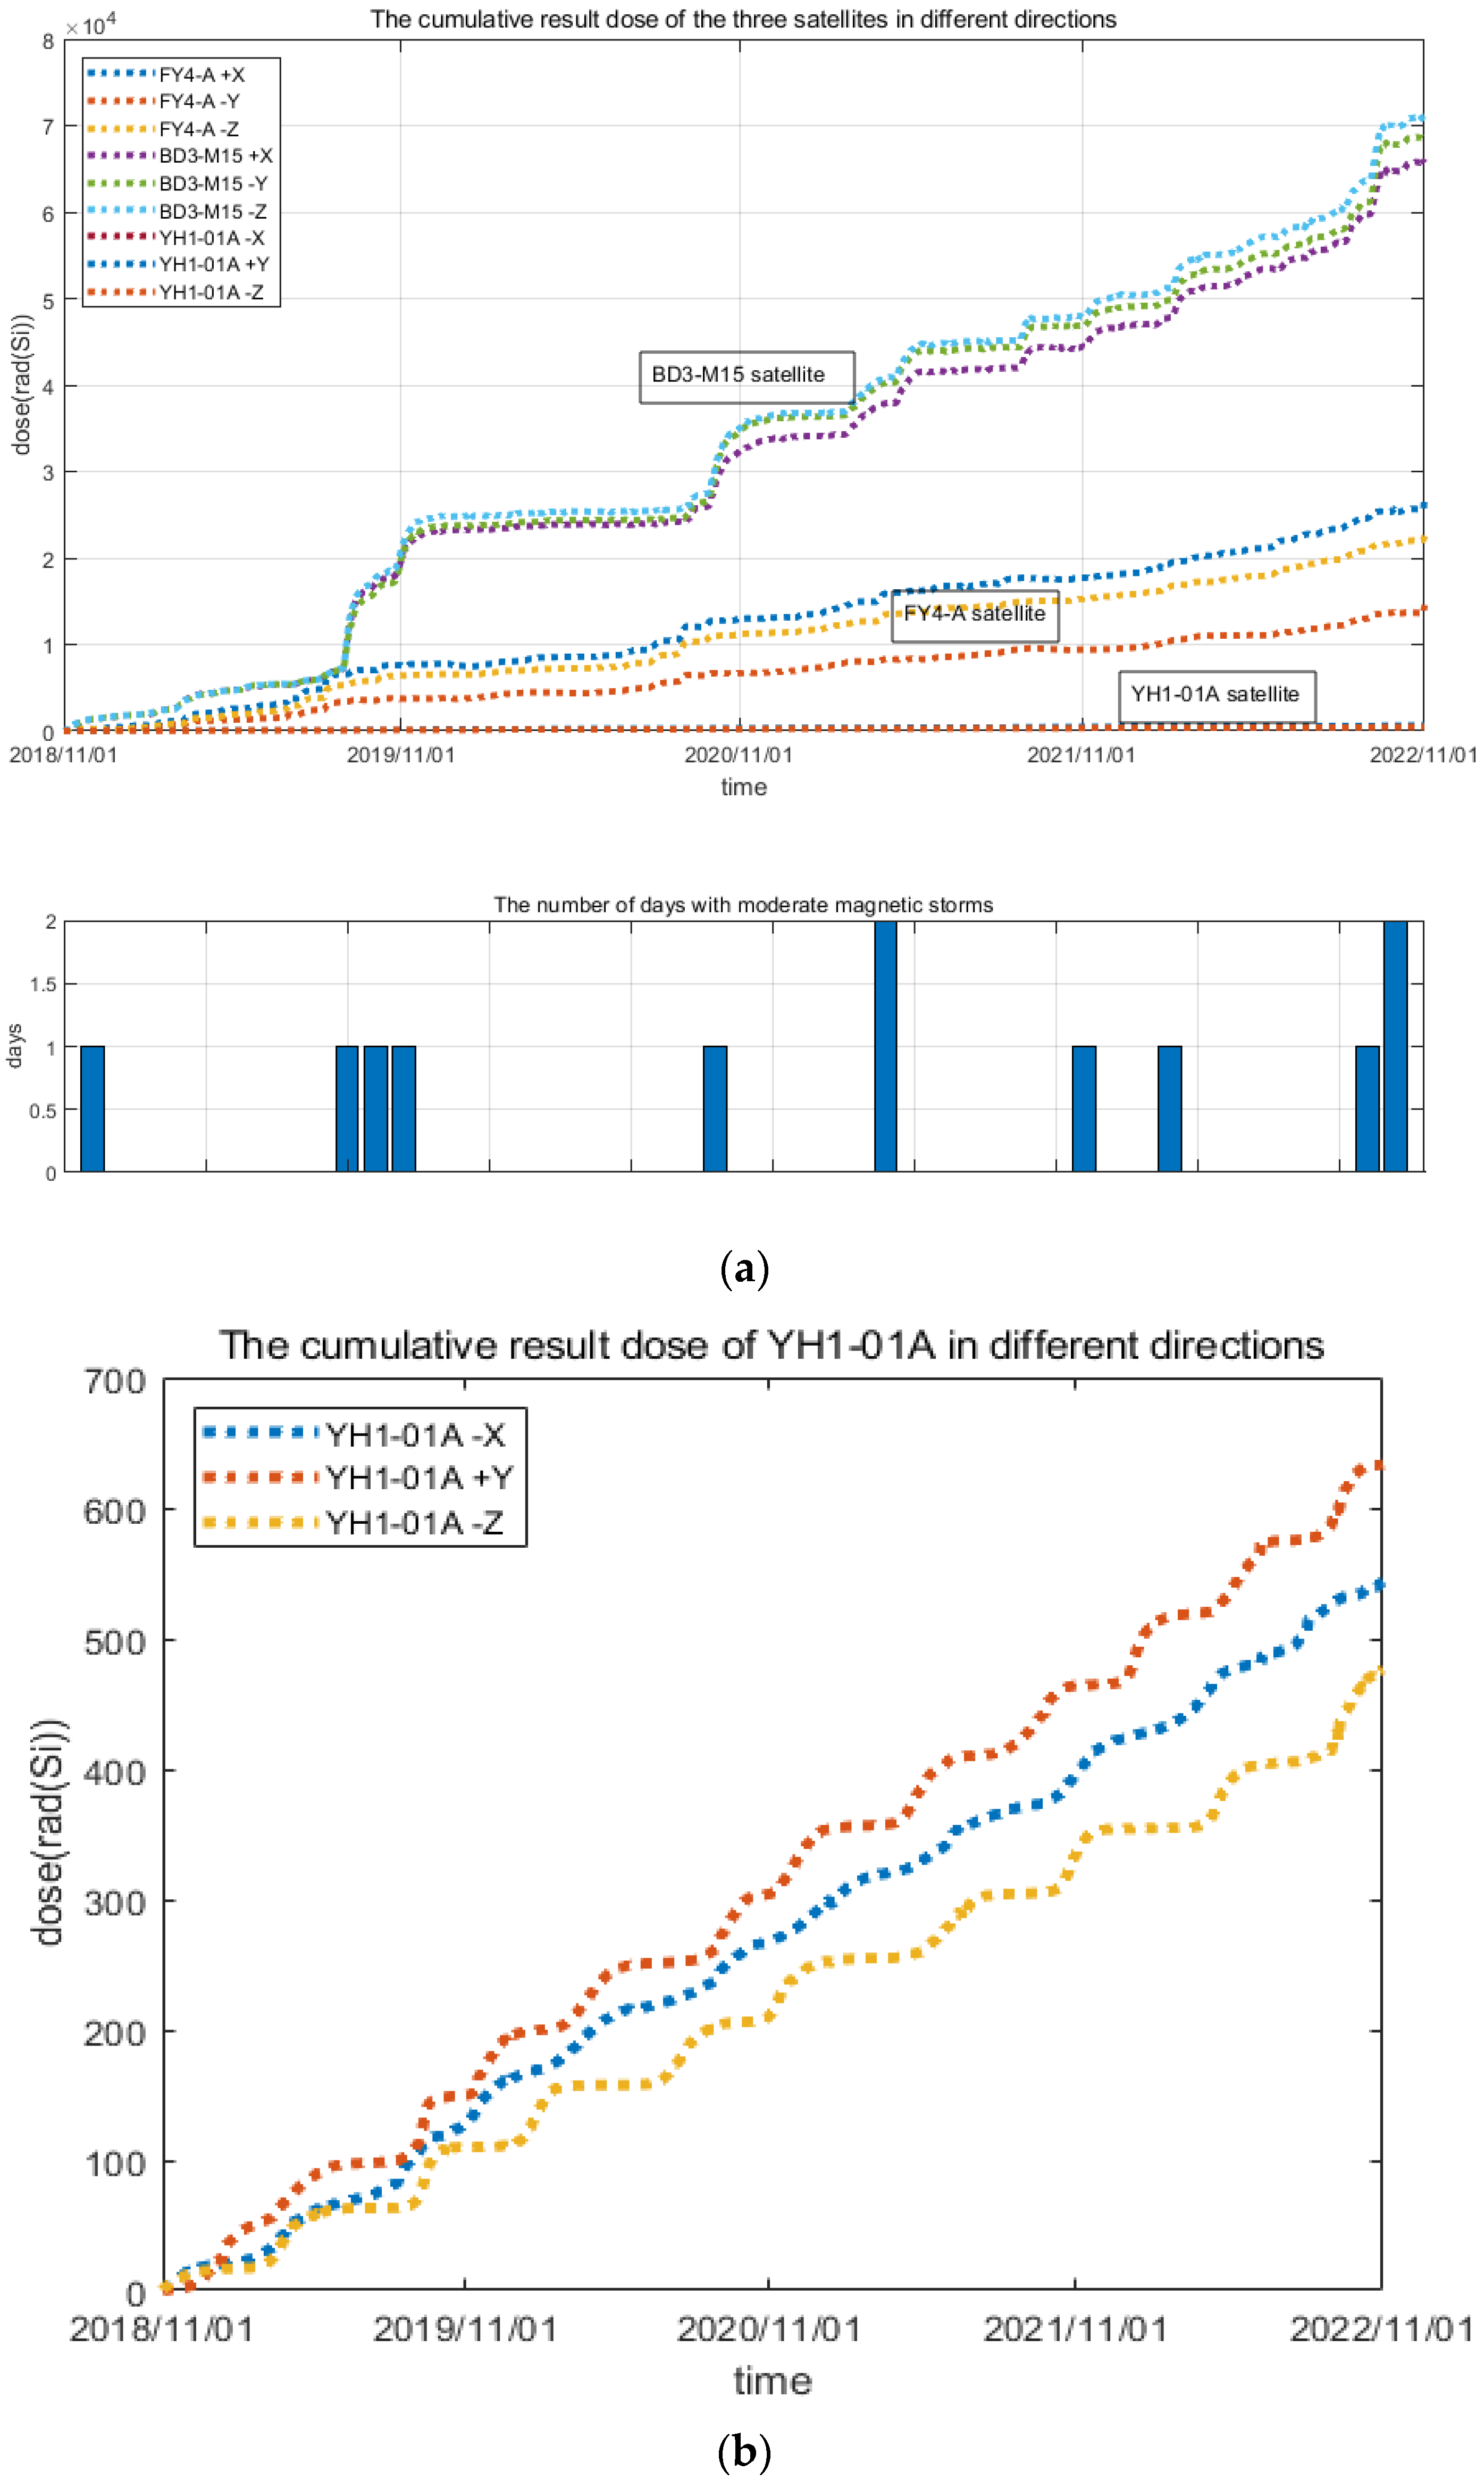
By the end of 2022, the PMOS radiation dose detectors, hosted by FY4-A, BD3-M15, and YH1-01A, had accumulated five years’ worth of total dose data. For the purpose of comparing radiation doses among satellites in diverse orbits, the dataset selected encompasses a period spanning 1 November 2018 to 1 November 2022, totaling 1462 days of data. Following the elimination of background data, the radiation doses detected by the three satellites along various directions were computed and are presented in
Figure 3. Additionally,
Figure 3 provides a summary of the frequency of moderate or above geomagnetic storms occurring in the corresponding months throughout the monitoring period (According to the National Oceanic and Atmospheric Administration (NOAA) in the definition of the Users Guide to The Preliminary Report and Forecast of Solar Geophysical Data, Ap ≥ 60 is a moderate or above geomagnetic storm).
As depicted in
Figure 3a, the cumulative radiation doses accrued by the three satellites exhibited an upward trajectory over the past four years, revealing observable directional disparities. This phenomenon can be attributed to geomagnetic storms. Additionally, BD3-M15, situated in the MEO orbit, experienced a more substantial dose increase compared to the other two satellites.
Specifically, the total doses recorded by FY4-A along the +X, −Y, and −Z directions amounted to 2.68 × 10
4, 1.53 × 10
4, and 2.26 × 10
4 rads, respectively. Upon normalizing these values based on the X direction, the dose ratio along the +X, −Y, and −Z directions was 1:0.57:0.84, indicating noteworthy directional distinctions. Conversely, BD3-M15 registered the total radiation doses of 6.57 × 10
4 (Si), 6.86 × 10
4 (Si), and 7.12 × 10
4 rads (Si) along the +X, −Y, and −Z directions, respectively. The difference in doses between the +X and −Y directions amounted to 4.4% ((6.86 − 6.57)/6.57), while the disparity between +X and −Z directions was 8.4% ((7.12 − 6.57)/6.57). These findings suggest diminished directional disparities in comparison to FY4-A in the GEO orbit. YH1-01A, in LEO, recorded the cumulative radiation doses along the−X, +Y, and −Z directions of 540, 630, and 470 rad, respectively, with directional variations falling between those observed in the other two satellites. Additionally, the directional distinctions among the three satellites followed the sequence FY4-A > YH1-01A > BD3-M15. Detailed calculations of the total dose and the directional differences for the three satellites during the period spanning November 2018 to November 2022 are presented in
Table 1.
4. Analysis and Discussion
This section discusses the characteristics and mechanisms underlying the variation in the radiation dose observed across the three distinct orbits. The selected detection results from 1 November 2018 to 1 November 2022 revealed patterns of radiation dose growth and variation, as well as the distribution of particles among satellites orbiting in three different trajectories. The influence of geomagnetic storms, high-energy electron storms, and other factors that contribute to disturbances in the space environment were investigated.
4.1. Relationship between Three-Track Monthly Radiation Dose Rate and AP and F107
Radiation dose accumulation is a multifaceted physical process; its formation mechanism is related to the environmental disturbance in the space. In the long four years of data statistics (November 2018–November 2022), the accumulation of daily radiation dose is too subtle, resulting in the change in daily radiation dose rate being difficult to observe and count. The response relationship between the daily radiation dose rate and the space environment disturbance is not corresponding. In addition, due to the accuracy of the PMOS detection period and the temperature compensation of the hardware, daily changes in radiation dose rates often exhibit uncertainty due to sporadic events, be they equipment-related or weather-induced, during the extended 4-year monitoring duration [
10,
11,
12]. This study introduces the concept of monthly radiation dose rate measurements over a longer time span. This approach elucidates the fluctuation patterns in the increase in measured doses over an extended period. Such insight is valuable in establishing the relationship between radiation dose changes and disturbances in the space environment. The monthly radiation dose rate is quantified as the monthly cumulative increase in radiation dose, expressed in rad (Si)/month (The detailed calculation of the monthly radiation dose rate can be found in
Appendix A).
In this study, we compared the monthly radiation dose rates of FY4-A in GEO orbit, BD3-M15 in MEO orbit, and YH1-01A in LEO orbit to analyze the trends and underlying causes of the radiation dose variations among these three satellites.
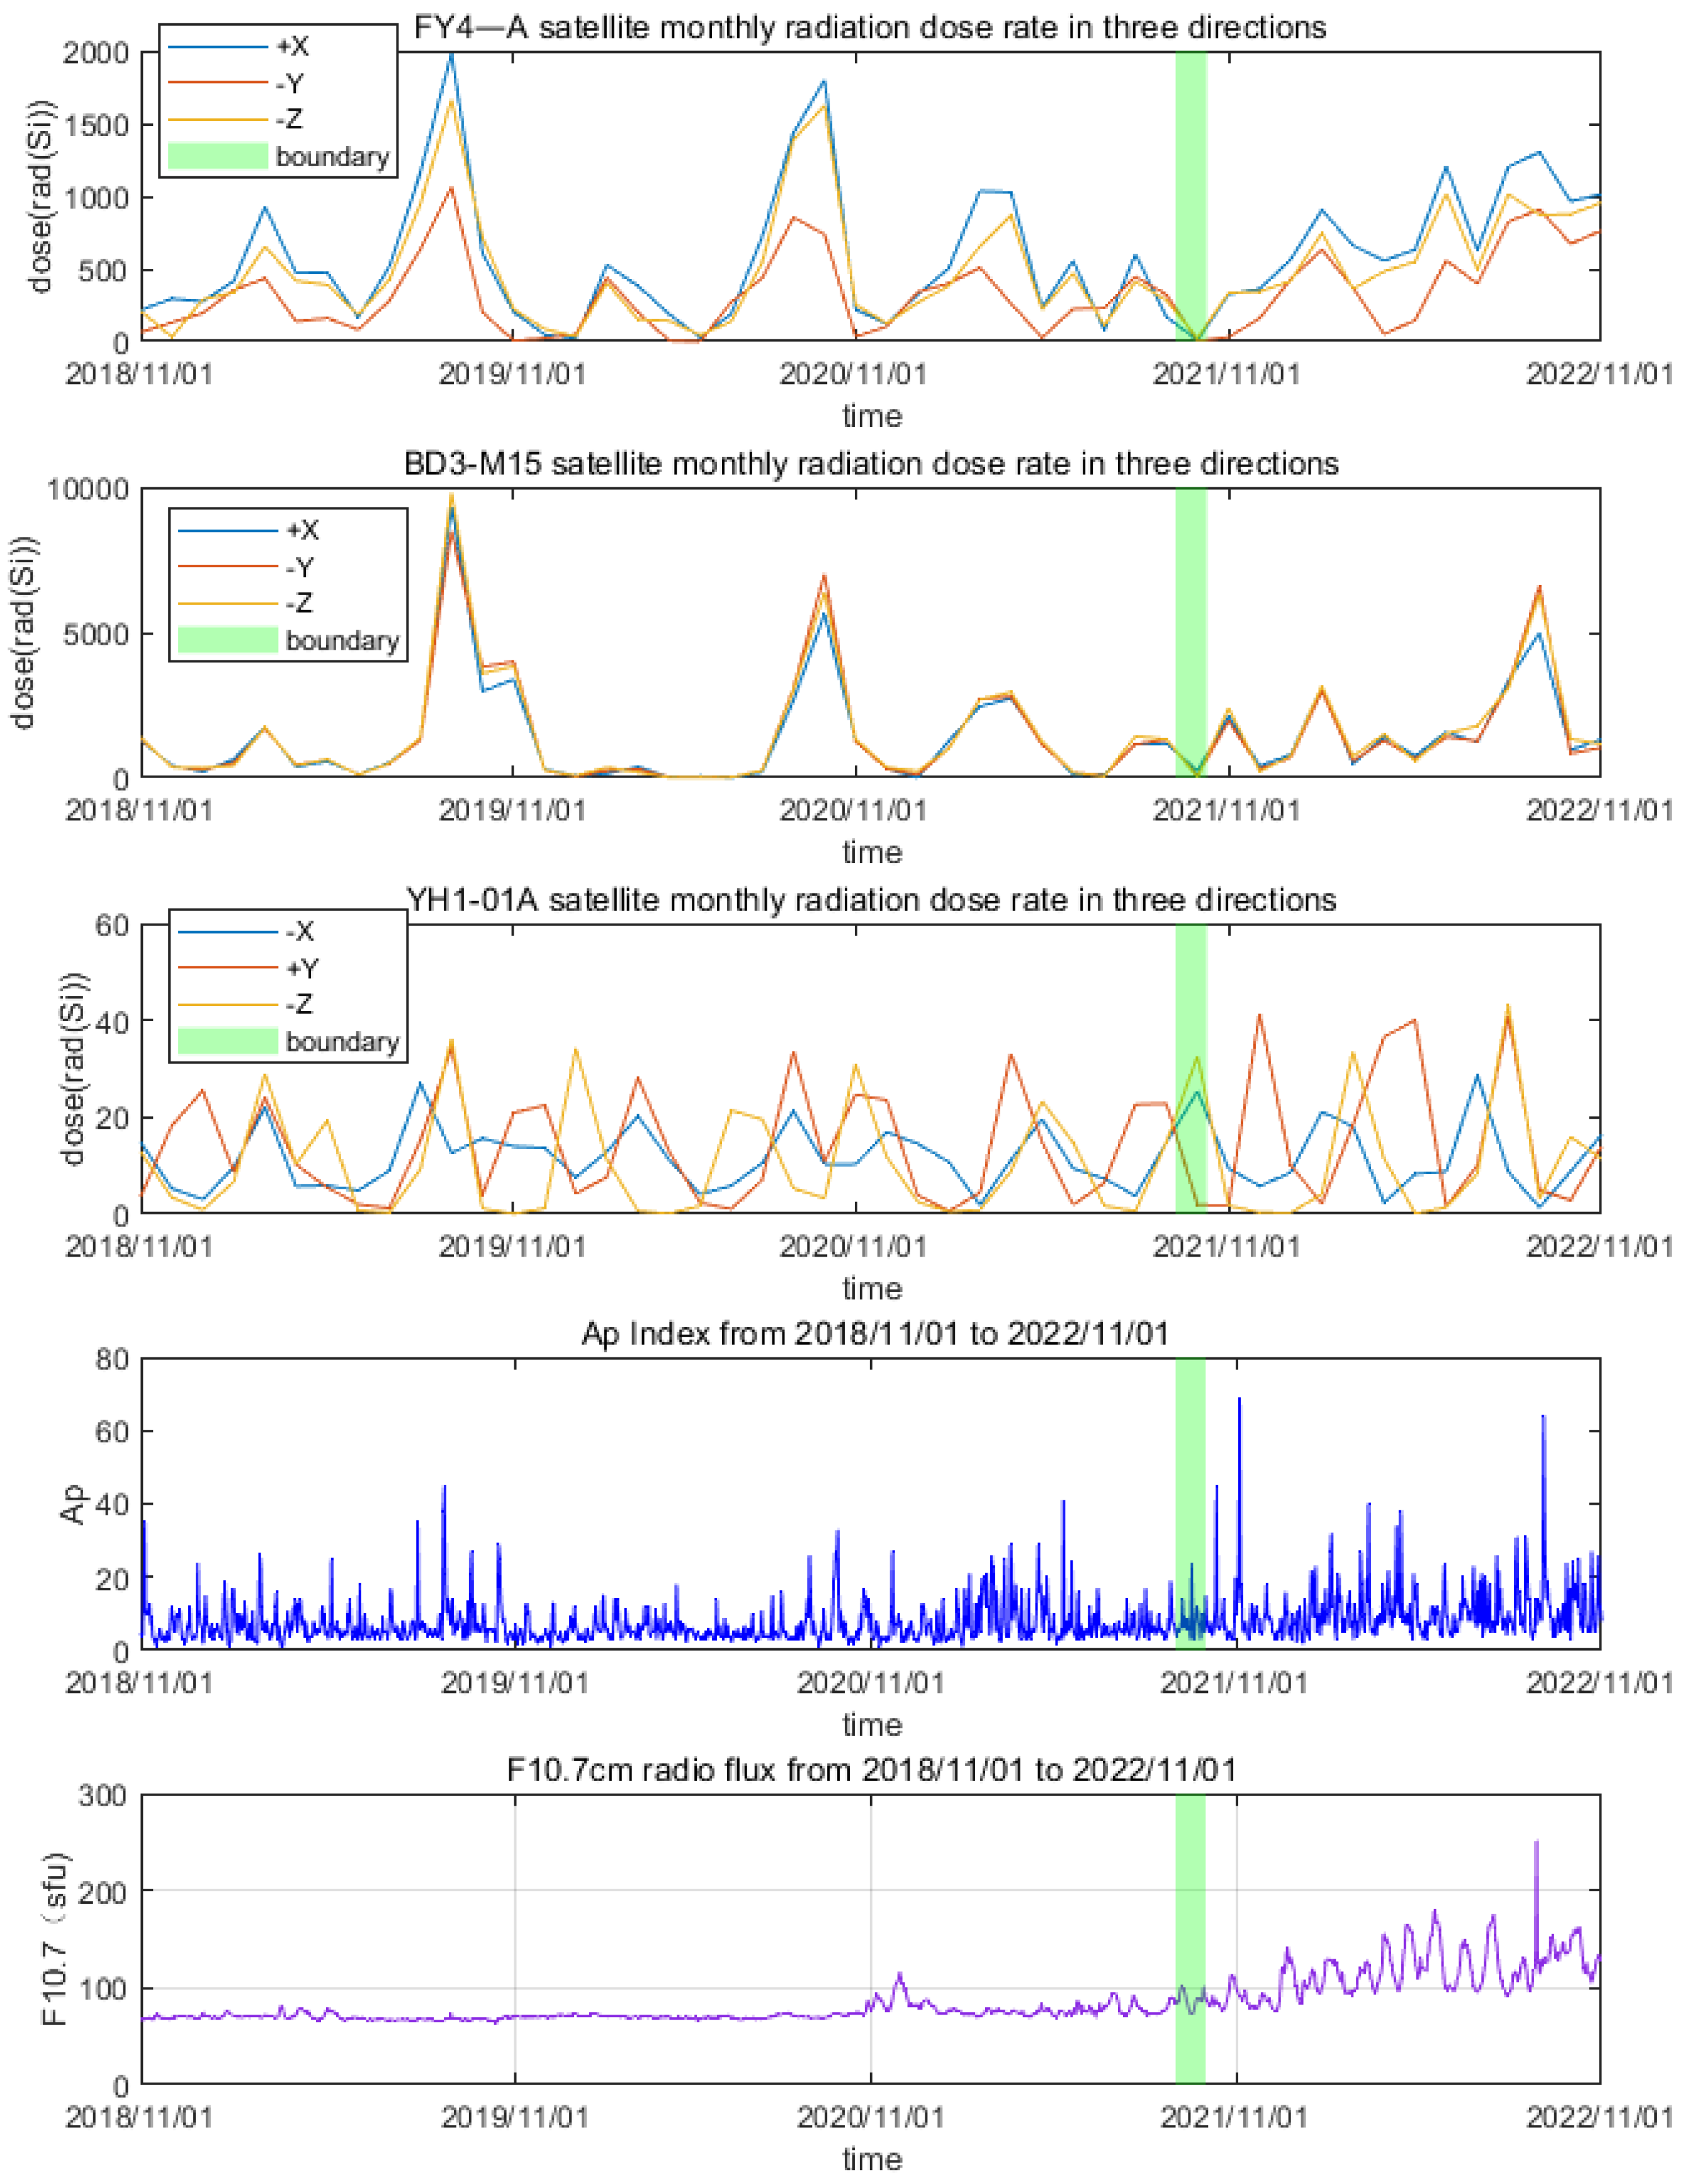
Figure 4 presents the monthly radiation dose rates alongside the corresponding geomagnetic AP and 10.7-cm solar radio flux data for the three satellites in various directions. As indicated in
Figure 4, the monthly radiation dose rate curve and the AP index image increased and decreased in the same period. By contrast, the monthly radiation dose rate of YH1-01A did not indicate synchronous changes with AP or F107.
Therefore, geomagnetic activity affects the rate of the radiation dose growth in GEO (FY4-A) and MEO (BD3-M15) orbital spaces. When geomagnetic activity intensifies, the resulting radiation dose increases more rapidly. However, this influence of geomagnetic activity on the radiation dose growth is less pronounced in the case of LEO (YH1-01A). Notably, a delineated green timeline marks the period following October 2021, during which F107 values increased, which is indicative of enhanced solar activity. This temporal span witnessed a continuous rise in the monthly radiation dose rates of FY4-A and BD3-M15.
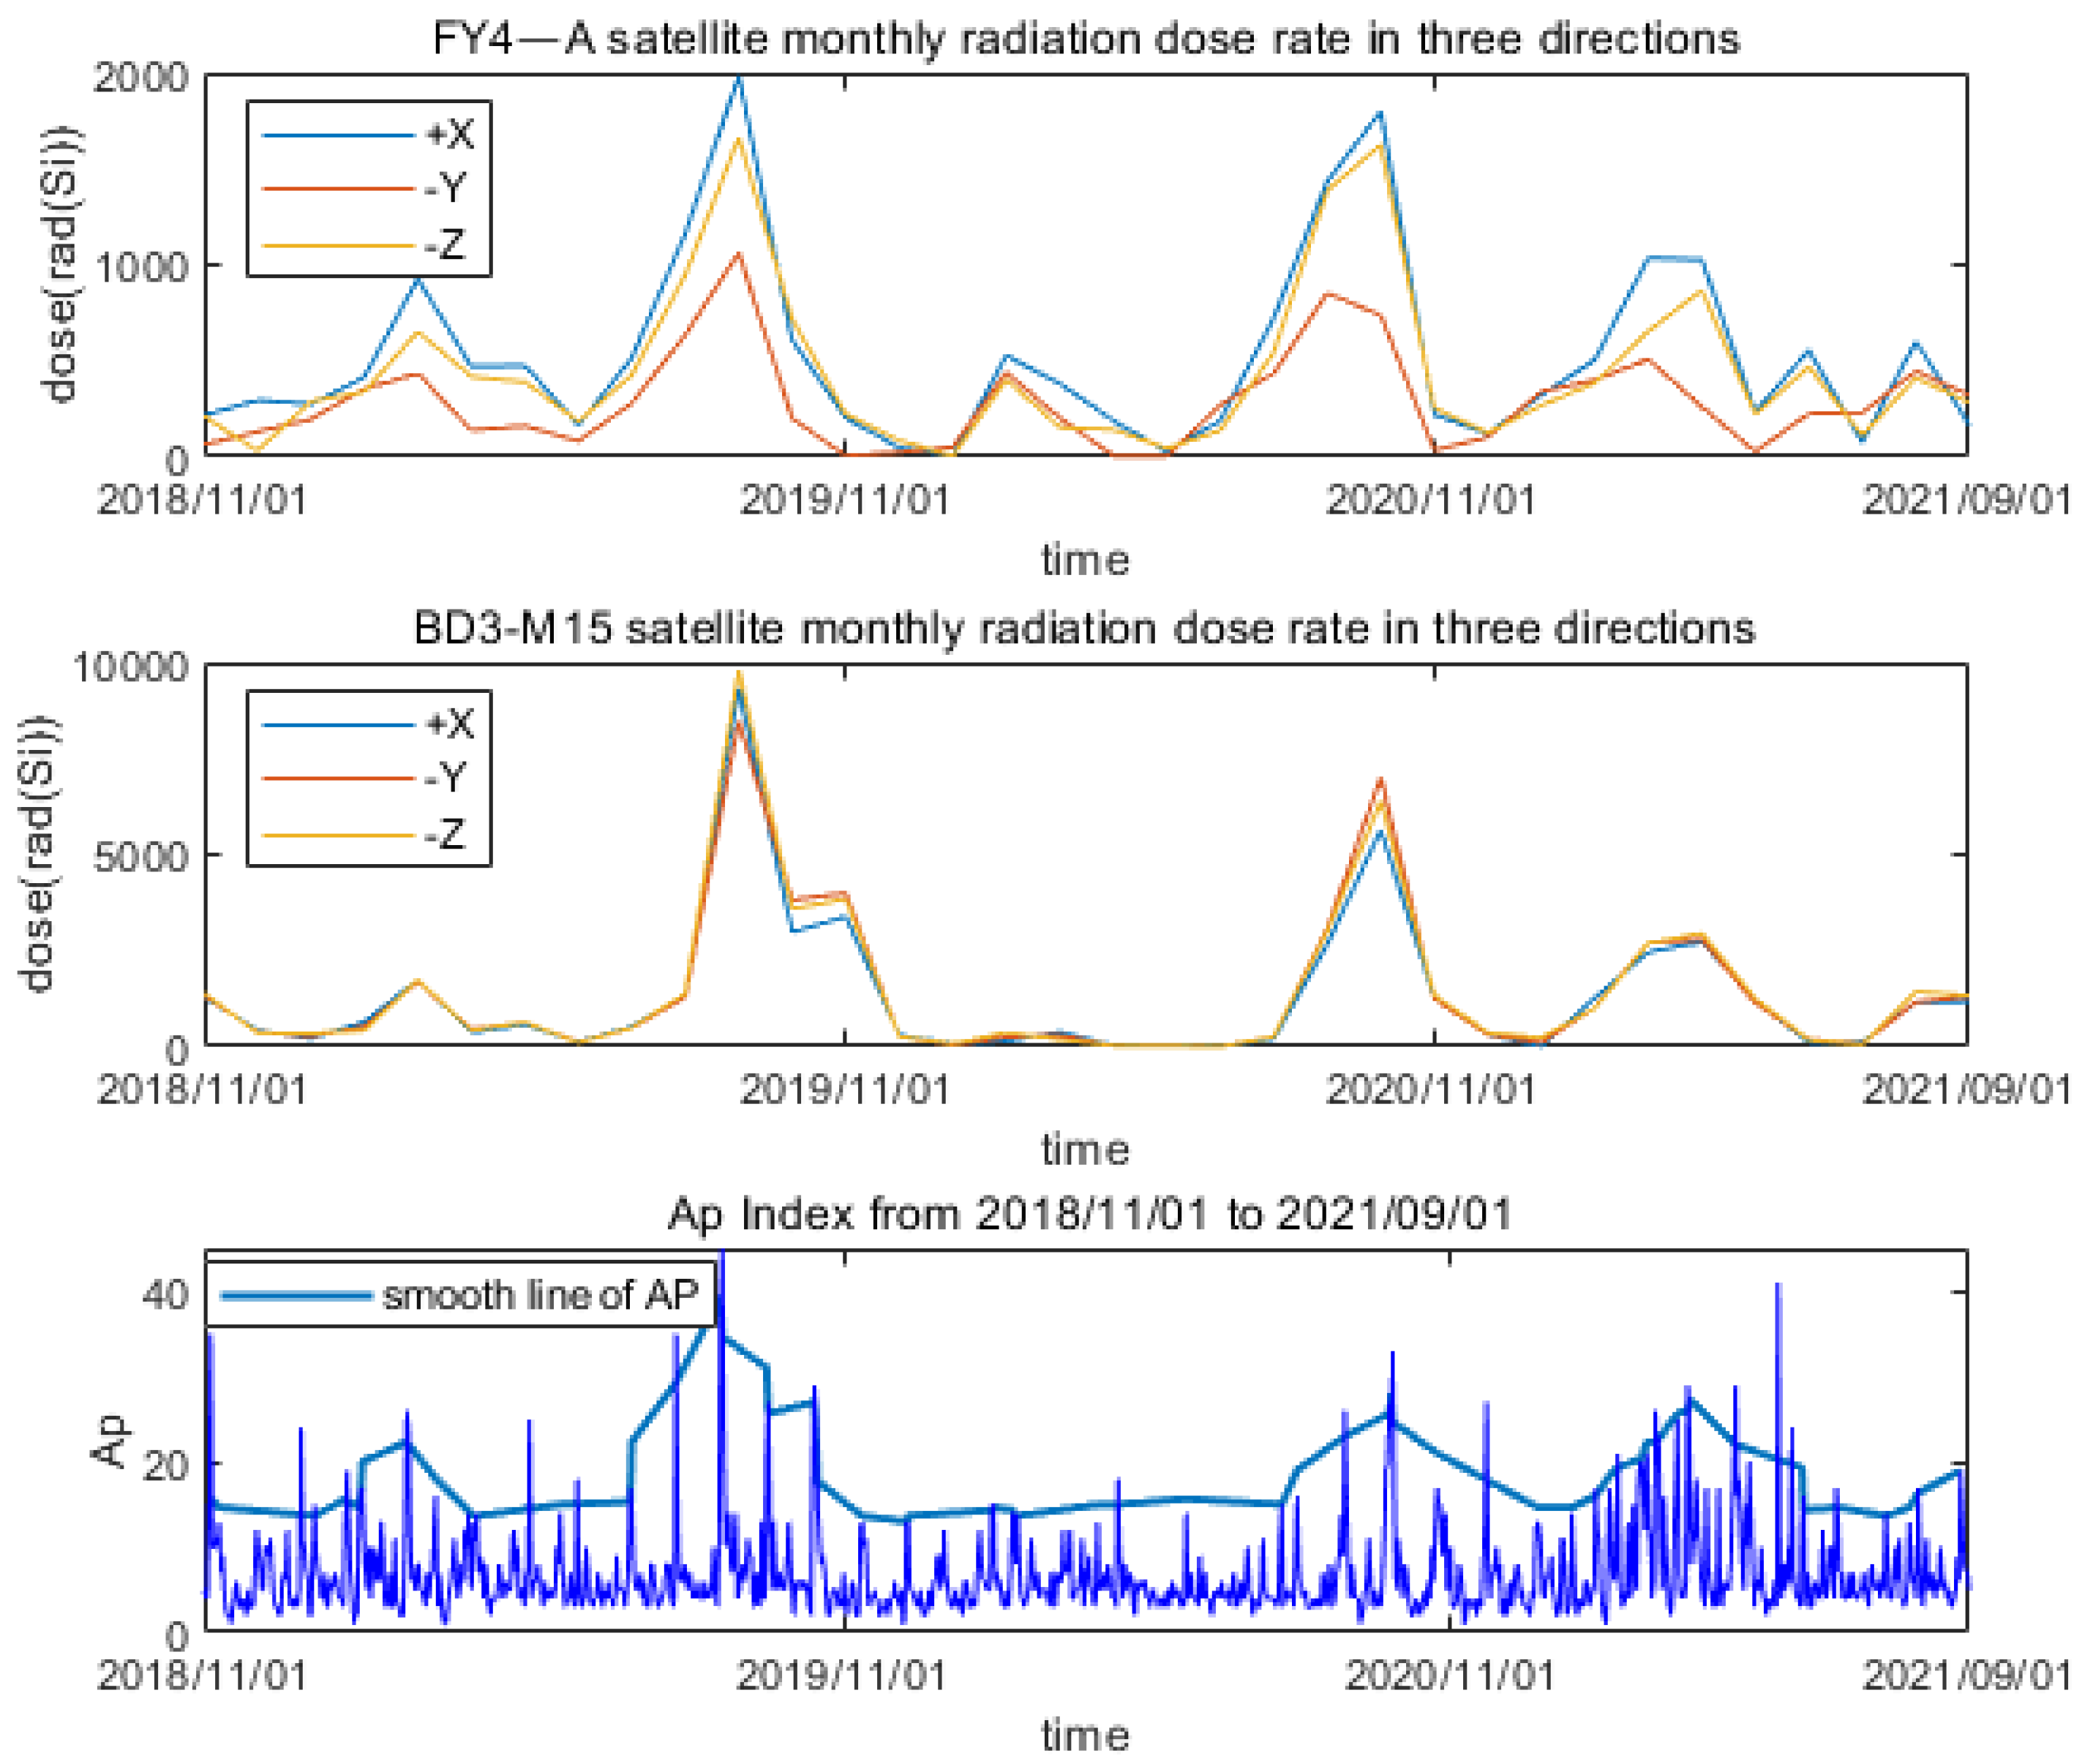
As illustrated in
Figure 5, the monthly radiation dose rates of FY4-A and BD3-M15 were exhibited to be synchronous between November 2018 and September 2021. During this period, the rates increased or decreased in tandem with fluctuations in the AP values. This synchronization was evident in the concurrent peaks and troughs observed in both the monthly radiation dose rate and the AP data during this period. Furthermore, a Pearson correlation coefficient (PCC) analysis was conducted to discuss the linear correlation between the monthly radiation dose rate and the Ap index.
The Pearson correlation coefficient here is calculated as follows:
The d and the ap are the two selected sets of reference data, representing the monthly radiation dose rate and ap index respectively; cov(d,ap) represents the covariance of d and ap,
d and ap series respectively, and i represents the time series, each of which corresponds to an actual value.
is the correlation coefficient between d and ap. The Pearson correlation coefficient, also referred to as the Pearson rank correlation, is a widely employed method for analyzing correlations. It is commonly used to assess the linear relationship between two variables [
13,
14], and the range is generally {−1, 1}.
The Pearson correlation coefficient between the monthly radiation dose rates of satellites FY4-A and BD3-M15 in three directions and the ap index from November 2018 to September 2021 is shown in
Table 2.
According to the data in
Table 3, the PCC in the +X direction of FY4-A, the −Z direction of FY4-A, and the three directions of BD3-M15 are all greater than 0.6. This indicates a strong linear correlation (0.6–0.8) between the monthly radiation dose rates of these and the AP index. Additionally, the PCC in the −Y direction of FY4-A is 0.5908, reflecting a moderate linear correlation (0.4–0.6) with the AP index.
In addition, the monthly radiation dose rates of BD3-M15 exhibited even smaller directional differences compared with FY4-A. The convergence of the three-monthly radiation dose rate curves indicated that the growth of the radiation dose in GEO and MEO orbits during the 24th solar cycle minimum was notably influenced by geomagnetic activity, with the directional disparities in GEO orbits being more pronounced than those in MEO orbits.
4.2. Dose Variation in the Three Orbital Satellites during the Geomagnetic Quiet Period and Geomagnetic Disturbed Period of Space Environment
Figure 5 illustrates the disparity in radiation dose increases between FY4-A and BD3-M15 during both the geomagnetic quiet periods and the disturbed periods within the space environment. Geomagnetic storms were conspicuously absent from December 2019 to January 2020 and from April 2020 to June 2020, coinciding with the 10.7-cm solar radio flux values below 80 sfu. These periods are classified as the quiet period of the space environment, characterized by low geomagnetic and solar activity levels.
Table 3 compiles data on the average monthly radiation dose rates, maximum monthly radiation dose rates, and their corresponding geomagnetic AP values for various directions concerning FY4-A from December 2019 to January 2020 and from April 2020 to June 2020. This data facilitates an understanding of the radiation dose growth during these quiet space environment periods.
From August 2019 to October 2019, from August 2020 to October 2020, and from February 2021 to April 2021, the monthly radiation dose rates exhibited discernible peaks and sustained increases, possibly because of disturbances in the spatial environment induced by geomagnetic activity.
Table 4 presents a summary of these incidents, detailing the average monthly radiation dose rates, the maximum monthly radiation dose rates, and the associated geomagnetic AP values during the quiet period of space environment.
Table 3 and
Table 4 collectively emphasize that the monthly radiation dose rates during the disturbed space environment periods can be one order of magnitude higher compared to those during the quieter phases of the space environment.
Table (Annotation: The AP index table means the number of days to reach a certain AP index).
4.3. Effects of Geomagnetic Storm and High-Energy Electron Storm on Radiation Dose Increase of MEO and GEO Orbital Satellites
Figure 5 presents a comprehensive overview of the multiple radiation dose increase incidents that occurred during the monitoring period spanning from November 2018 to September 2021. Two instances of radiation dose increase incidents were examined, one from August to October of 2019 and another from August to October of 2020. The comparative data depicting the monthly radiation dose rates of the three orbital satellites during these radiation dose increase incidents are presented in
Table 5.
Table 5 presents data showing that the average monthly radiation dose rate of BD3-M15 exceeds that of FY4-A. Remarkably, the average monthly radiation dose rate of both BD3-M15 and FY4-A is greater than that of YH1-01A by two orders of magnitude. During this period, solar activity remained remarkably low, devoid of class C or higher flares and solar proton events. This period coincided with a solar minimum, albeit punctuated by recurring coronal holes.
Figure 6 depicts the contours of a reproducible coronal hole as it traversed the solar plane center on specific dates in 2019, namely 2 August, 29 August, 24 September, and 22 October, as provided by the Space Environment Prediction Center of the Chinese Academy of Sciences. These reproducible coronal holes extended into space near the Earth, triggering a total of 23 instances of medium and small geomagnetic storms during early August, late August, late September, and late October. Medium-sized geomagnetic storms lasted for approximately 2 days, while small geomagnetic storms persisted for 7 days. During these geomagnetic storms, both FY4-A and BD3-M15 orbited within the outer radiation belt, resulting in significant fluctuations in high-energy electrons under the influence of geomagnetic activity. Energetic charged particles in space progressively gathered along the magnetic field lines within the orbital space of FY4-A and BD3-M15, consequently increasing the energetic charged particle flux in this region and raising the radiation dose. The monthly radiation dose rate during a geomagnetic storm reached 2000 rad for FY4-A and 10,000 rad for BD3-M15. However, the LEO-orbit-based YH1-01A exhibited minimal radiation dose rate fluctuations. This data highlighted the pronounced impact of geomagnetic storms on radiation doses, particularly in the MEO orbits, followed by the GEO orbits, while the LEO orbits demonstrated no substantial correlation.
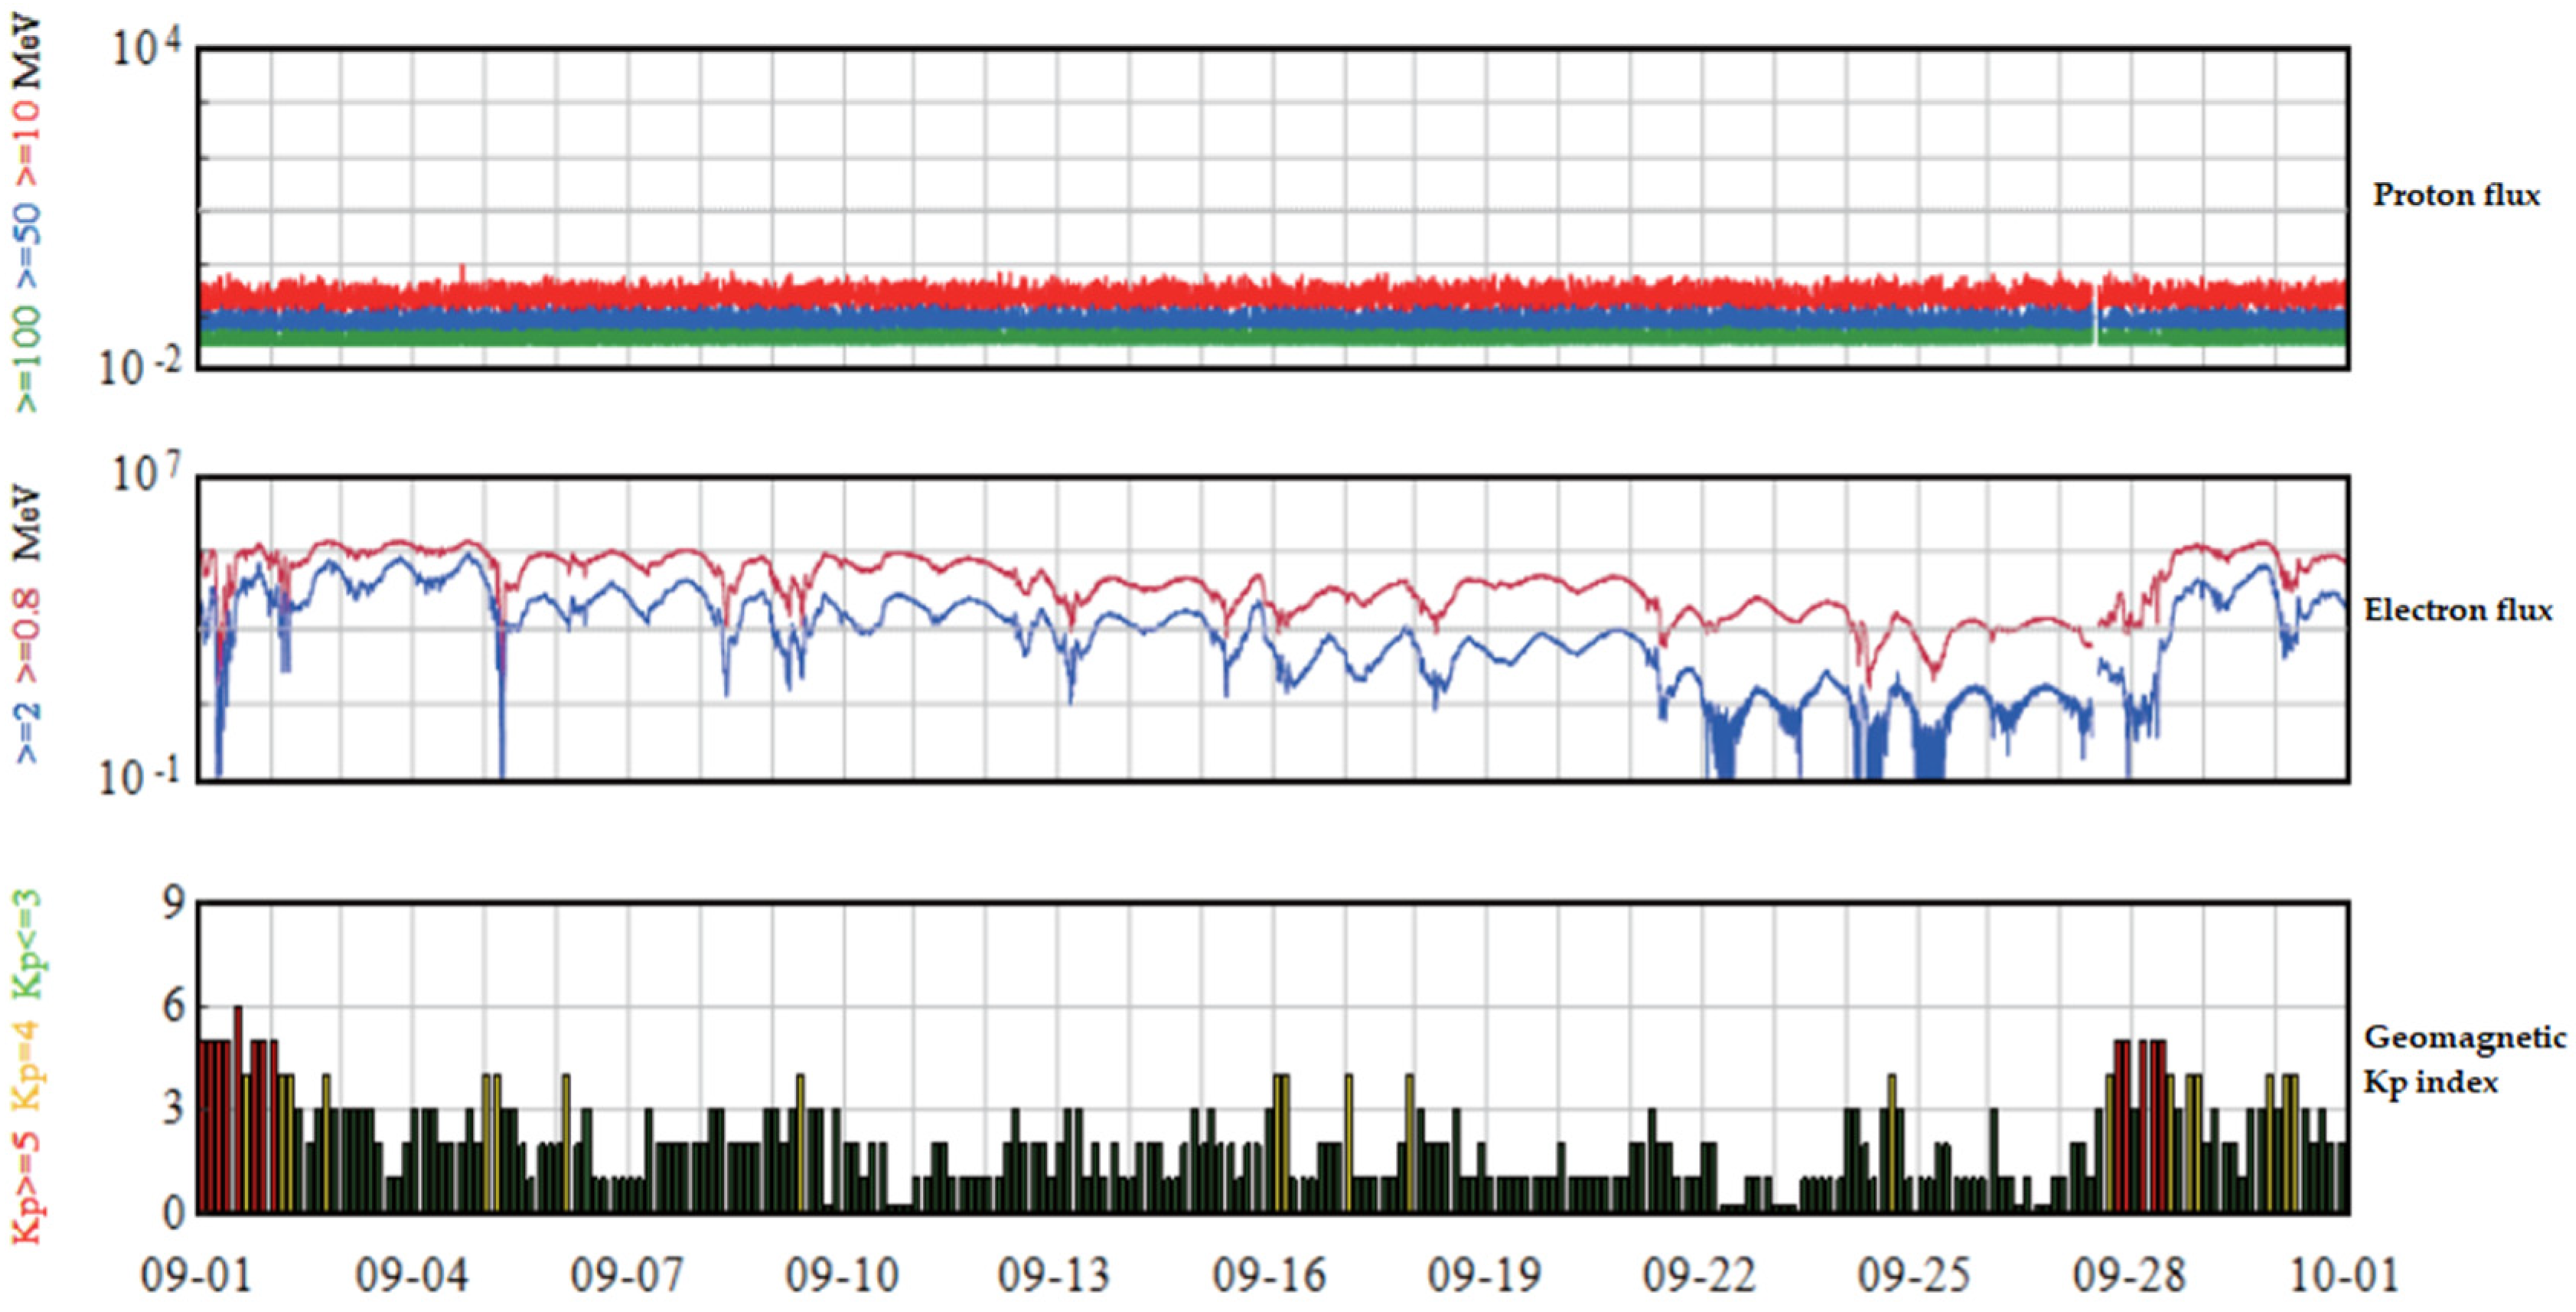
The high-speed flows within the coronal holes triggered a moderate high-energy electron storm lasting 8 days during the period of increasing monthly radiation dose rates (August 2019 to October 2019), along with a 31-day mini-high-energy electron storm. For example,
Figure 7 illustrates the high-energy proton flux, the high-energy electron flux, and the geomagnetic Kp index detected by GOES in the United States for September 2019. Notably, during 2 to 4 September and 29 September, the high-energy electron flux in geosynchronous orbit, exceeding 2 MeV, reached moderate high-energy electron storm levels. Additionally, from 1 to 5, 12, 14 to 15, 28, and 30 September, the high-energy electron flux greater than 2 MeV in geosynchronous orbit reached small high-energy electron storm levels. This intriguing pattern reveals that, despite the solar minimum in 2019, high-energy electron storms, akin to killer electrons, became recurrent in select months.
Table 6 presents an overview of the high-energy electron storm occurrences throughout the entirety of 2019, using data sourced from the Space Environment Prediction Center of the Chinese Academy of Sciences. In 2019, there were 66 instances of minor high-energy electron storms and 10 occurrences of moderate high-energy electron storms, while no high-energy electron storms were recorded. During the specific monthly radiation dose rate peak period, spanning from August to October, there were 31 days marked by minor high-energy electron storms and an additional 8 days characterized by moderate high-energy electron storms. This combined total of 39 days of electron storms accounted for 59% of the overall count of electron storm days in 2019. This observation offers a compelling explanation for the direct impact of the high-speed solar wind streams originating from the reproducible coronal holes, which manifested between August and October, on the formation of the high-energy electron storms. These storms, in turn, played a pivotal role in the increase of the radiation dose experienced by FY4-A and BD3-M15 during this period.
In summary, the growth of the radiation dose in MEO and GEO orbital satellites was notably influenced by geomagnetic storms during the monitoring period. However, the high-energy electron storms not only influenced the space radiation environment of these two orbits but also contributed to the elevation of the radiation dose. This phenomenon gave rise to the presence of so-called “killer electrons” which are capable of penetrating even lunar surfaces. Moreover, these killer electrons deposit charge within the medium, introducing a certain likelihood of charge-discharge effects that pose a threat to satellite safety and the overall reliability of space missions [
15,
16,
17,
18].
4.4. Comparison between the Measured Results and the Simulations of SPENVIS System
Taking FY4-A as an example, the cumulative radiation dose was simulated using SPENVIS, the space environment information system provided by ESA. The particle radiation model was selected as AP8/AE8, and the task’s start and end time was set as the monitoring period selected in this study: 1 November 2018 to 1 November 2022.
The dose curve of 0.05 mm~20 mmAl was obtained after simulation.
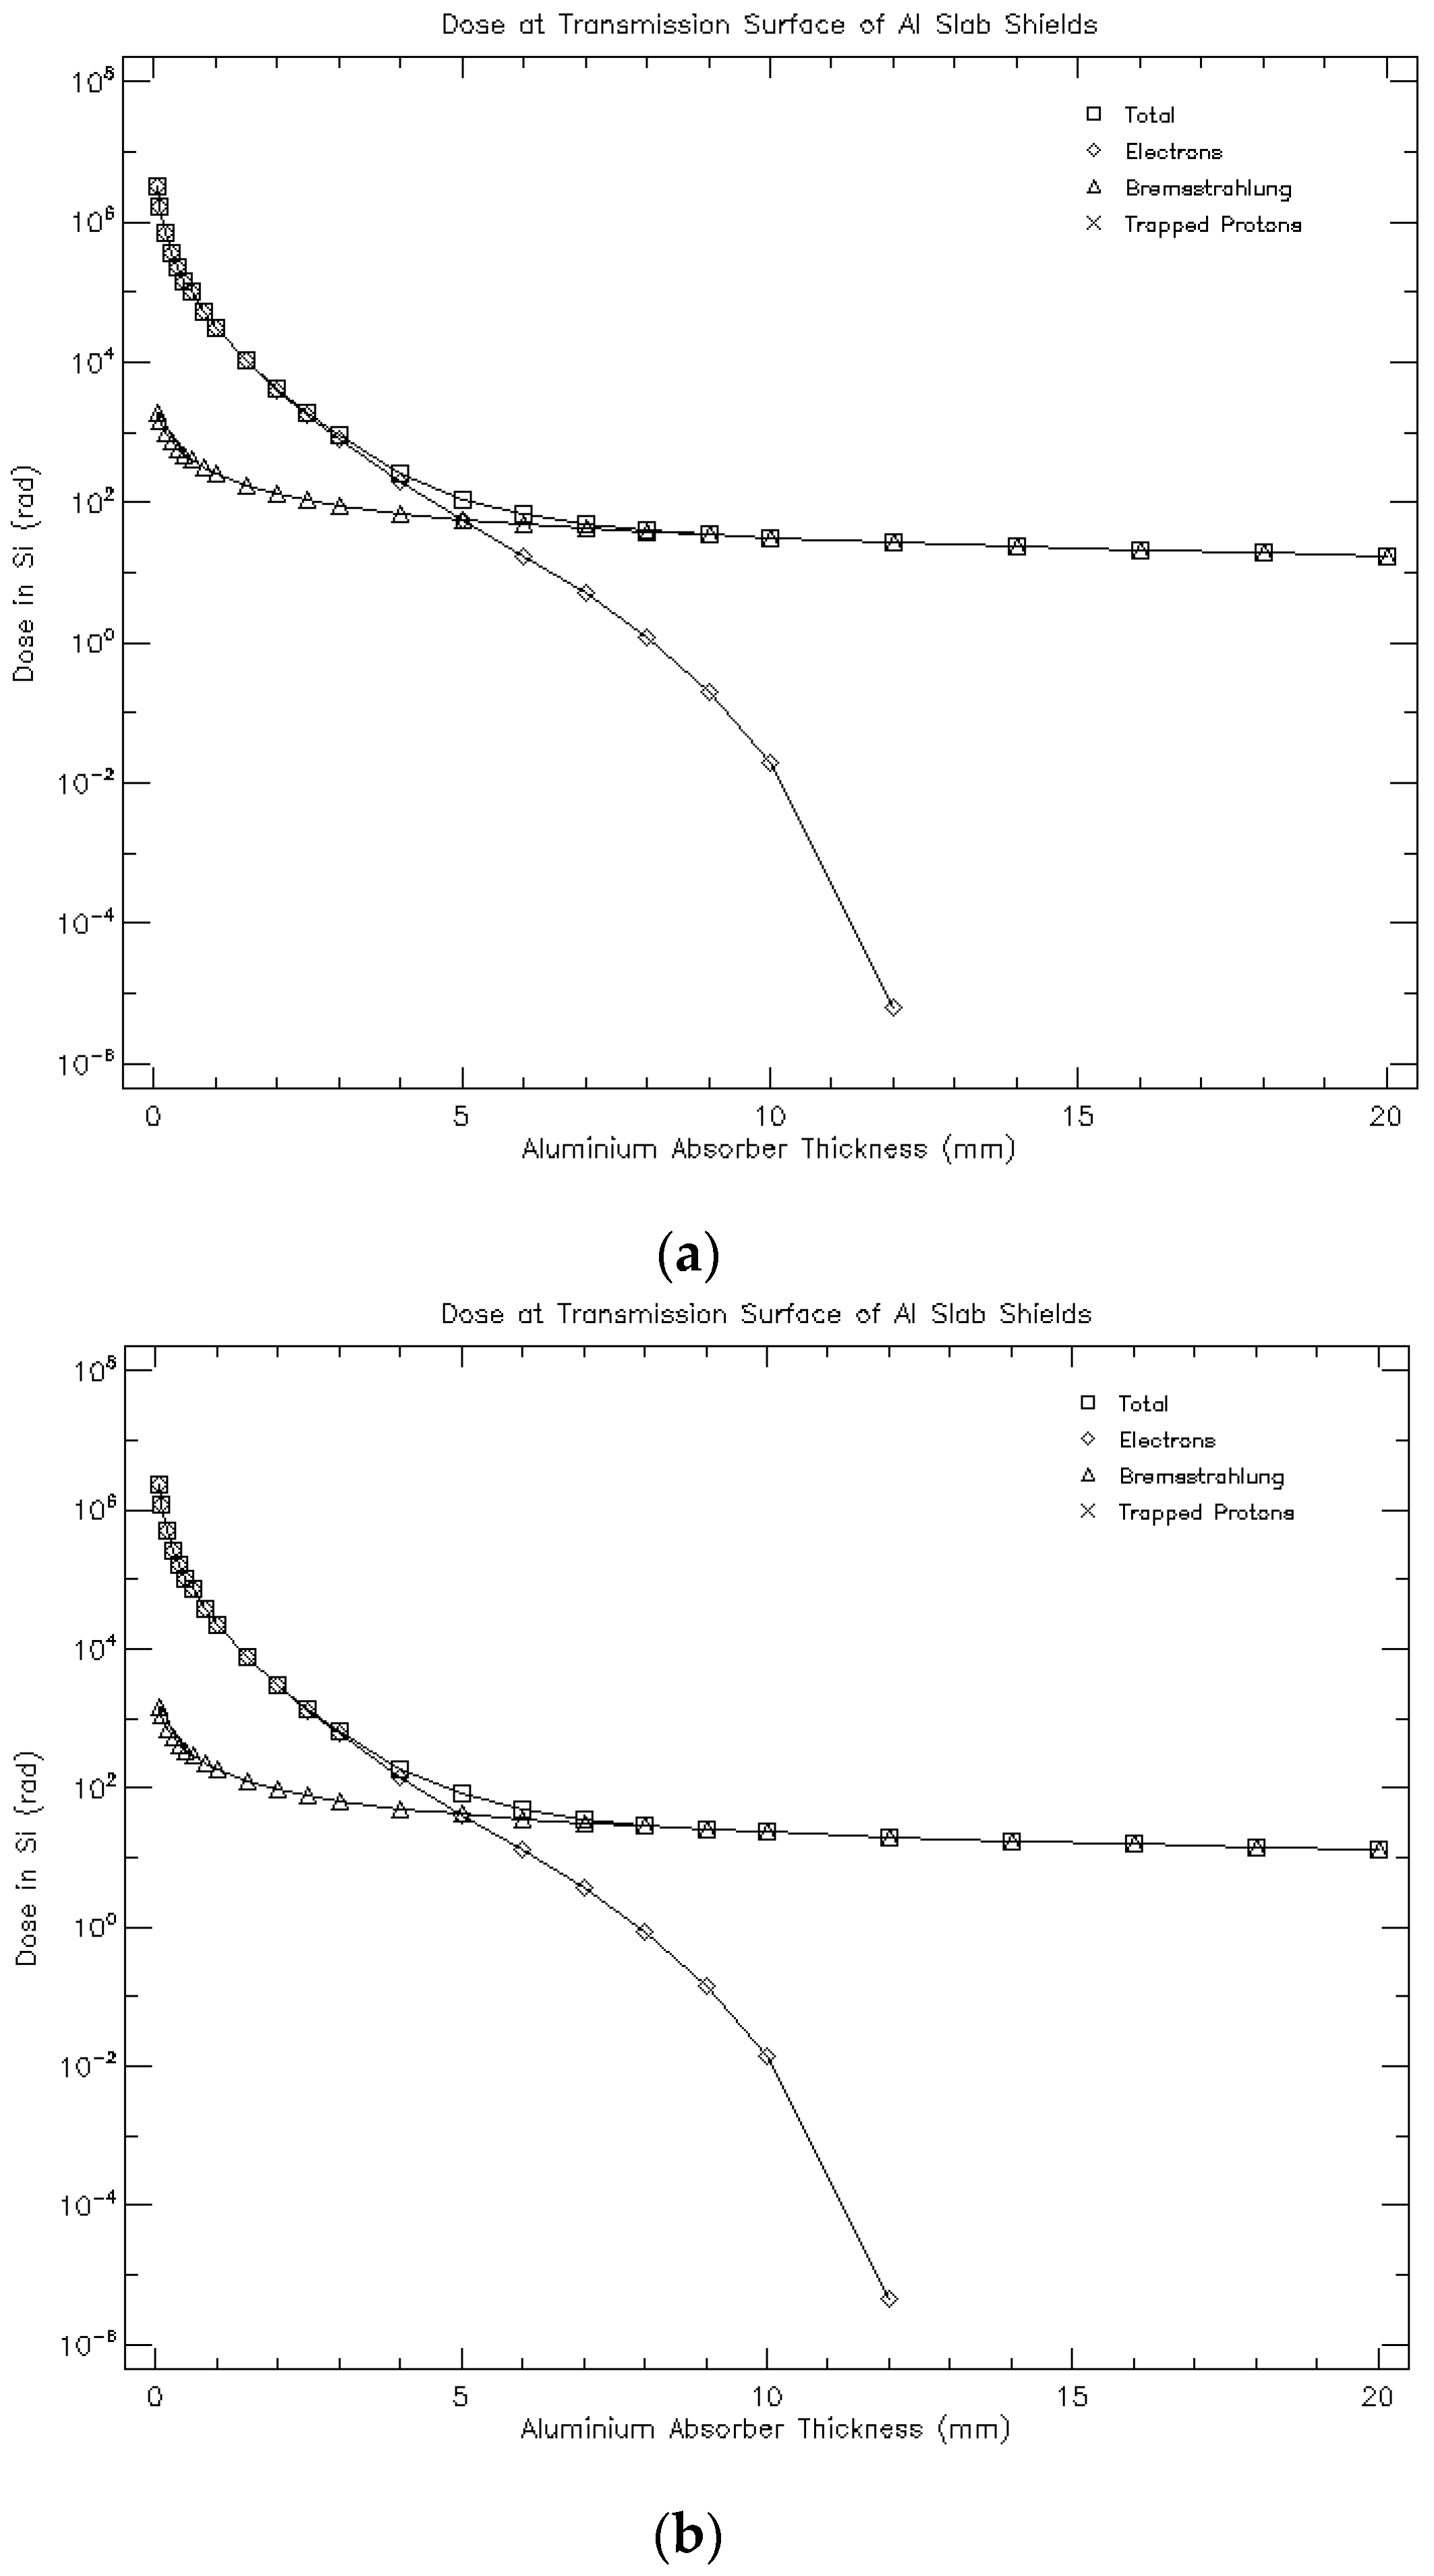
Figure 8 shows the radiation dose of the FY4-A star with different aluminum shield thicknesses under two states of the solar activity peak year and trough year calculated by SPENVIS.
From
Figure 8, the simulated total radiation dose of FY4-A satellite under 1 mmAl equivalent shielding is 31,300 rad at the solar maximum and 22,800 rad at the solar maximum. Since the AP8AE8 model used for particle radiation input only provides omnidirectional particle flux, this system cannot differentiate the radiation doses in different directions on the satellite and its calculation results are only for omnidirectional radiation doses.
Table 7 compares the measured results with the SPENVIS simulation results. It can be observed from the table that the measured results of the satellite reflect differences in the radiation doses in various directions, while the SPENVIS system’s calculation results cannot distinguish these differences. Additionally, under a 1 mmAl equivalent shielding, there is a difference between the measured and simulated total radiation doses; however, this difference does not exceed an order of magnitude. The calculation results from the SPENVIS system can only provide values for total radiation doses during the solar activity peak and valley years as well as long-term average dose variations but cannot effectively assess short-term increases in radiation dose caused by particle motion-induced space environment disturbances. On the other hand, measured results from satellites can provide more accurate dynamic information about radiation doses, which is more instructive for carrying out space missions.
5. Conclusions
In this study, comprehensive data on total radiation doses within the GEO, MEO, and LEO orbits were collected using PMOS radiation dose detectors aboard FY4-A, BD3-M15, and YH1-01A, respectively, between November 2018 and November 2022, at the juncture of the 24th and 25th solar cycles. The following conclusions can be drawn from this study:
(1) The cumulative total radiation doses along the +X, −Y, and −Z directions for FY4-A were found to be lower than those of BD3-M15. Furthermore, the total doses for both FY4-A and BD3-M15 exceeded that of YH1-01A by two orders of magnitude, as illustrated in
Table 1. Consequently, the radiation dose hierarchy can be summarized as follows: BD3-M15 > FY4-A > YH1-01A.
(2) FY4-A registered radiation doses exceeding 26,000, 15,000, and 22,000 rad along the +X, −Y, and −Z directions, respectively, demonstrating notable directional disparities. In contrast, BD3-M15 reported total radiation doses of 65,000, 68,000, and 71,000 rad along the +X, −Y, and −Z directions, respectively, suggesting minimal directional variations and a trend toward convergence over time. YH1-01A reported comparatively low cumulative radiation doses, albeit with observable directional distinctions.
(3) Disturbances in the space environment, triggered by geomagnetic and solar activities, played a significant role in influencing the radiation dose increases among orbital satellites within the GEO and MEO orbits. In the case of GEO and MEO orbital satellites, there was a strong positive linear correlation between the monthly radiation dose rate and the Ap index during solar minimum periods. For FY4-A, instances of space environment disruption associated with heightened geomagnetic activity led to radiation dose increases exceeding one order of magnitude when compared to periods of geomagnetic tranquility. Notably, the growth in the radiation dose observed in YH1-01A did not exhibit a clear correlation with the Ap index.
(4) During the solar minimum phase of the 24th solar cycle, the escalation of the radiation dose in MEO and GEO orbits was significantly influenced by geomagnetic storms. Reproducible coronal holes, generated during small and medium-sized high-energy electron storms, were identified as contributing factors to the increased radiation dose levels observed in FY4-A and BD3-M15.
(5) By comparing the measured results and the simulation results of SPENVIS, taking FY4-A as an example, the simulation results of SPENVIS are the long-term average value and the simulation results of the omnidirectional radiation dose, which cannot distinguish the directional difference of the satellite from the dynamic information of the short-term dose, and the short-term data evaluation and analysis of the satellite directivity are insufficient. The measured results of the PMOS dose detector in all directions of the satellites discussed in this study make up for the shortcomings of the SPENVIS simulation. It can provide more accurate data support for space missions and effectively guide spacecraft layout and shielding design, thereby reducing losses caused by radiation effects in space missions.
Based on the 4-year data collected from FY4-A, BD3-M15, and YH1-01A, this study has yielded insightful findings regarding the variations in the total dose and the radiation dose increase across the three orbital regions. The dynamic nature of the space environment underscores the need for continued measurements using higher-precision PMOS dose detectors. Establishing correlation models between daily, weekly, and monthly dose rate data and the integrated flux of high-energy particles can offer a reliable means to assess short- to medium-term radiation dose fluctuations within the complex space environment. Given that this observational mission was conducted at the intersection of the solar minimum and the peak of solar activity, future efforts may focus on refining particle radiation source models through multi-orbit particle measurements during the transition from the 24th to the 25th solar cycle, thereby enhancing the existing radiation dose calculation models.
Author Contributions
Conceptualization, J.W. and S.Z.; methodology, J.W., S.Z. and G.S.; software, Z.C. and C.W.; validation, Y.S. and B.Z.; formal analysis, J.W.; investigation, S.Z. and G.S.; resources, Y.S.; data curation, J.W., D.H. and Z.Y.; writing—original draft preparation J.W. and S.Z.; writing—review and editing, J.W.; supervision, Y.S.; project administration, Y.S.; funding acquisition, S.Z. and G.S. All authors have read and agreed to the published version of the manuscript.
Funding
This research was funded by Civil space technology advance research project, grant number CNSA D050103.
Institutional Review Board Statement
Not applicable.
Informed Consent Statement
Not applicable.
Data Availability Statement
No new data were created or analyzed in this study. Data sharing is not applicable to this article.
Acknowledgments
Thanks to Zhiliang Zhang and Bin Zhang of the Beijing Key Laboratory of Space Environment Exploration for their discussions and software applications in this study.
Conflicts of Interest
The authors declare no conflict of interest.
Appendix A
Based on the physical principle of PMOS detectors, the monthly radiation dose rate cannot be directly measured. The monthly radiation dose rate is quantified as the monthly cumulative increase in radiation dose. Its calculation formula is:
nDn indicates the radiation dose rate of the month, expressed in rad(Si)/month.
Tn+1 indicates the total radiation dose detected by the PMOS on the satellite on the first of the next month.
Tn indicates the total radiation dose detected by the PMOS on the satellite on the first of the month.
The above data has been smoothed and temperature-compensated by the detector.
References
- Bhat, B.; Upadhyaya, N.; Kulkarni, R. Total radiation dose at geostationary orbit. In IEEE Transactions on Nuclear Science; IEEE: Piscataway, NJ, USA, 2005; Volume 52, pp. 530–534. [Google Scholar] [CrossRef]
- Williams, A.; McEwen, M.; DuSautoy, A. Radiation testing for space applications at the National Physical Laboratory. In 1998 IEEE Radiation Effects Data Workshop, NSREC 98, Workshop Record, Held in conjunction with IEEE Nuclear and Space Radiation Effects Conference (Cat. No.98TH8385), Newport Beach, CA, USA, 24 July 1998; IEEE: Piscataway, NJ, USA, 1998; pp. 148–151. [Google Scholar] [CrossRef]
- Dyer, C.; Sims, A.; Truscott, P.; Farren, J.; Underwood, C. Radiation environment measurements on Shuttle missions using the CREAM experiment. In IEEE Transactions on Nuclear Science; IEEE: Piscataway, NJ, USA, 1992; Volume 39, pp. 1809–1816. [Google Scholar] [CrossRef]
- Johnston, A.H. Space Radiation Effects and Reliability Considerations for Micro- and Optoelectronic Devices. In IEEE Transactions on Device and Materials Reliability; IEEE: Piscataway, NJ, USA, 2010; Volume 10, pp. 449–459. [Google Scholar] [CrossRef]
- Lyubomudrov, A.A. Radiation potentials generated by space radiation. Sol. Syst. Res. 2013, 47, 561–563. [Google Scholar] [CrossRef]
- Sun, Y.; Zhang, B.Q.; Zhang, X.; Shen, G.; Jing, T.; Zhang, S.Y.; Zhang, X.G.; Huang, C.; Li, J.W.; Zong, W.G.; et al. Radiation Dose Detection on FY-4B Satellite. Aerospace 2023, 10, 325. [Google Scholar] [CrossRef]
- Zhang, S.Y.; Zhang, X.G.; Wang, C.Q.; Shen, G.H.; Jing, T.; Zhang, B.Q.; Sun, Y.Q.; Zhu, G.W.; Liang, J.B.; Zhang, X.X. Calculation of geometric factors of space high-energy proton detector of FY-3 satellite. Sci. Sin. 2014, 44, 2479–2486. [Google Scholar]
- Ying, S.U.; Binquan, Z.H.; Xiaoxin, Z.H.; Xin, Z.H.; Shenyi, Z.H.; Guohong, S.H.; Zheng, C.H.; Chunqin, W.A.; Yueqiang, S.U.; Weiguo, Z.O.; et al. Design spaceborne of radiation dosimeter in depth. Chin. J. Space Sci. 2021, 41, 793–799. [Google Scholar]
- MacKay, G.; Thomson, I.; Ng, A.; Sultan, N. Applications of MOSFET dosimeters on MIR and BION satellites. In IEEE Transactions on Nuclear Science; IEEE: Piscataway, NJ, USA, 1997; Volume 44, pp. 2048–2051. [Google Scholar] [CrossRef]
- Schimmerling, W. Space and radiation protection: Scientific requirements for space research. Radiat. Environ. Biophys. 1995, 34, 133–137. [Google Scholar] [CrossRef] [PubMed]
- Schwadron, N.A.; Cooper, J.F.; Desai, M.; Downs, C.; Gorby, M.; Jordan, A.P.; Joyce, C.J.; Kozarev, K.; Linker, J.A.; Mikíc, Z.; et al. Particle Radiation Sources, Propagation and Interactions in Deep Space, at Earth, the Moon, Mars, and Beyond: Examples of Radiation Interactions and Effects. Space Sci. Rev. 2017, 212, 1069–1106. [Google Scholar] [CrossRef]
- Sukita, D.; Koshiishi, H.; Kimoto, Y. Studies of correction methods for influences from space environment on observation of radiation dose in space. In Proceedings of the 2013 14th European Conference on Radiation and Its Effects on Components and Systems (RADECS), Oxford, UK, 23–27 September 2013; pp. 1–3. [Google Scholar] [CrossRef]
- Mei, K.; Tan, M.; Yang, Z.; Shi, S. Modeling of Feature Selection Based on Random Forest Algorithm and Pearson Correlation Coefficient. J. Phys. Conf. Ser. 2022, 2219, 012046. [Google Scholar] [CrossRef]
- Li, G.; Zhang, A.; Zhang, Q.; Wu, D.; Zhan, C. Pearson Correlation Coefficient-Based Performance Enhancement of Broad Learning System for Stock Price Prediction. IEEE Trans. Circuits Syst. II Express Briefs 2022, 69, 2413–2417. [Google Scholar] [CrossRef]
- Lazaro, D.; Sicard, A.; Caron, P.; Falguere, D.; Ecoffet, R.; Standarovski, D.; Balcon, N.; Mekki, J.; Thakur, V.; Timmerman, P.; et al. Infer Electron Space Environment Along EOR Mission Profile From LEO Measurements: Application to EUTELSAT 7C. In IEEE Transactions on Nuclear Science; IEEE: Piscataway, NJ, USA, 2022; Volume 69, pp. 1565–1573. [Google Scholar] [CrossRef]
- Baker, D.N. Earth’s Magnetosphere: A Cosmic Wave-Particle Laboratory. In Proceedings of the 2021 International Conference on Electromagnetics in Advanced Applications (ICEAA), Honolulu, HI, USA, 9–13 August 2021; p. 001. [Google Scholar] [CrossRef]
- Ersmark, T.; Carlson, P.; Daly, E.; Fuglesang, C.; Gudowska, I.; Lund-Jensen, B.; Nieminen, P.; Pearce, M.; Santin, G. Geant4 Monte Carlo Simulations of the Belt Proton Radiation Environment On Board the International Space Station/Columbus. In IEEE Transactions on Nuclear Science; IEEE: Piscataway, NJ, USA, 2007; Volume 54, pp. 1444–1453. [Google Scholar] [CrossRef]
- Zolotarev, I.A.; Benghin, V.V.; Yushkov, B.Y.; Nechaev, O.Y.; Petrov, V.L.; Yashin, I.V. Planetary Distribution of the Space Radiation Dose Rate Based on Results of the DEPRON Experiment Onboard the Lomonosov Satellite. Cosm. Res. 2022, 60, 73–78. [Google Scholar] [CrossRef]
Figure 1.
Structure block diagram of the PMOS radiation dose detector.
Figure 1.
Structure block diagram of the PMOS radiation dose detector.
Figure 2.
Satellite position relative to the Earth and the detection directions of the different dose detectors.
Figure 2.
Satellite position relative to the Earth and the detection directions of the different dose detectors.
Figure 3.
(a) Cumulative dose of the three satellites in the different directions and the number of days with moderate geomagnetic storms from 1 November 2018 to 1 November 2022. (b) The cumulative result dose of YH1-01A in the different directions from 1 November 2018 to 1 November 2022.
Figure 3.
(a) Cumulative dose of the three satellites in the different directions and the number of days with moderate geomagnetic storms from 1 November 2018 to 1 November 2022. (b) The cumulative result dose of YH1-01A in the different directions from 1 November 2018 to 1 November 2022.
Figure 4.
Data of the monthly radiation dose rate in different directions: AP and 10.7-cm solar radio flux of the three satellites from 1 November 2018–1 November 2022 (The green boundary is used to distinguish the growth period of the F107 index, after which the F107 index increases).
Figure 4.
Data of the monthly radiation dose rate in different directions: AP and 10.7-cm solar radio flux of the three satellites from 1 November 2018–1 November 2022 (The green boundary is used to distinguish the growth period of the F107 index, after which the F107 index increases).
Figure 5.
Data of the average monthly radiation dose rate of FY4-A and BD3-M15 in three directions and the AP of FY4-A and BD3-M15 from November 2018 to September 2021.
Figure 5.
Data of the average monthly radiation dose rate of FY4-A and BD3-M15 in three directions and the AP of FY4-A and BD3-M15 from November 2018 to September 2021.
Figure 6.
Coronal hole passing through the center of the solar plane on 2 August, 29 August, 24 September, and 22 October, 2019.
Figure 6.
Coronal hole passing through the center of the solar plane on 2 August, 29 August, 24 September, and 22 October, 2019.
Figure 7.
High-energy proton flux, high-energy electron flux, and the geomagnetic Kp index in geosynchronous orbit in September.
Figure 7.
High-energy proton flux, high-energy electron flux, and the geomagnetic Kp index in geosynchronous orbit in September.
Figure 8.
(a) SPENVIS calculated the radiation dose of the FY4-A satellite at the solar maximum. (b) SPENVIS calculated the radiation dose of the FY4-A satellite at solar minimum.
Figure 8.
(a) SPENVIS calculated the radiation dose of the FY4-A satellite at the solar maximum. (b) SPENVIS calculated the radiation dose of the FY4-A satellite at solar minimum.
Table 1.
Total dose and calculation of the directional differences of the three satellites in different directions.
Table 1.
Total dose and calculation of the directional differences of the three satellites in different directions.
| Satellite | Orbital Altitude | Direction | Total Dose (rad) | Directional Differences after Normalization (In the X Direction) | Average Daily Dose Rate (rad/d) |
|---|
| FY4-A | 36,000 km | +X | 26,800 | 1 | 18.33 |
| −Y | 15,320 | 0.57 (−43%) | 10.48 |
| −Z | 22,550 | 0.84 (−16%) | 15.42 |
| BD3-M15 | 21,500 km | +X | 65,700 | 1 | 44.94 |
| −Y | 68,600 | 1.04 (+4%) | 46.92 |
| −Z | 71,200 | 1.08 (+8%) | 48.70 |
| YH1-01A | 800 km | −X | 540 | 1 | 0.37 |
| +Y | 630 | 1.16 (+16%) | 0.43 |
| −Z | 470 | 0.87 (−13%) | 0.33 |
Table 2.
Pearson correlation coefficient between the monthly radiation dose rate of satellites FY4-A and BD3-M15 and the AP index.
Table 2.
Pearson correlation coefficient between the monthly radiation dose rate of satellites FY4-A and BD3-M15 and the AP index.
| Satellite | PCC | Satellite | PCC |
|---|
| FY4-A +X | 0.7010 | BD3-M15 +X | 0.7481 |
| FY4-A −Y | 0.5908 | BD3-M15 −Y | 0.7235 |
| FY4-A −Z | 0.7227 | BD3-M15 −Z | 0.7455 |
Table 3.
Variation of radiation of the FY4-A dose in different directions during the quiet period of space environment.
Table 3.
Variation of radiation of the FY4-A dose in different directions during the quiet period of space environment.
| Date | Average Monthly Dose Rate (Rad/Month) | Maximum Monthly Dose Rate (Rad/Month) | AP Index |
|---|
| 1 December 2019 to 31 January 2020 | +X direction: 25.69 | +X direction: 47.42 | More than 20 days: 0 |
| −Y direction: 37.45 | −Y direction: 50.84 | More than 40 days: 0 |
| −Z direction: 53.42 | −Z direction: 85.68 | Maximum: 13 |
| 1 April 2020 to 30 June 2020 | +X direction: 135.34 | +X direction: 190.10 | More than 20 days: 0 |
| −Y direction: 115.31 | −Y direction: 271.26 | More than 40 days: 0 |
| −Z direction: 108.80 | −Z direction: 142.01 | Maximum: 18 |
Table 4.
Variation in radiation dose of FY4-A in different directions during the disturbed period of space environment.
Table 4.
Variation in radiation dose of FY4-A in different directions during the disturbed period of space environment.
| Date | Average Monthly Dose Rate (Rad/Month) | Maximum Monthly Dose Rate (Rad/Month) | AP Index |
|---|
| 1 August 2019 to 31 October 2019 | +X direction: 1249.9
−Y direction: 632.5
−Z direction: 1108.0 | +X direction: 1982.8
−Y direction: 1063.1
−Z direction: 1662.3 | More than 20
days: 7
More than 40
days: 1
maximum: 45 |
| 1 August 2020 to 31 October 2020 | +X direction: 1318.3
−Y direction: 675.4
−Z direction: 1185.6 | +X direction: 1799.4
−Y direction: 852.9
−Z direction: 1624.5 | More than 20
days: 6
More than 40
days: 0
maximum: 33 |
| 1 February 2021 to 30 April 2021 | +X direction: 855.6
−Y direction: 389.7
−Z direction: 635.5 | +X direction: 1035.5
−Y direction: 508.3
−Z direction: 866.5 | More than 20
days: 12
More than 40
days: 0
maximum: 29 |
Table 5.
Monthly radiation dose rates of the three orbiting satellites during the dose increase events.
Table 5.
Monthly radiation dose rates of the three orbiting satellites during the dose increase events.
| Date | FY4-A | BD3-M15 | YH1-01A |
|---|
2019-8 to 2019-10
Average monthly radiation dose rate (rad/month) | +X: 1249.9 | +X: 4551.7 | −X: 18.4 |
| −Y: 632.5 | −Y: 4530.9 | +Y: 17.8 |
| −Z: 1108.0 | −Z: 4924.2 | −Z: 15.6 |
2020-8 to 2020-10
Average monthly radiation dose rate (rad/month) | +X direction: 1318.3 | +X: 2833.7 | −X: 14.0 |
| −Y direction: 675.4 | −Y: 3447.2 | +Y: 23.0 |
| −Z direction: 1185.6 | −Z: 3212.0 | −Z: 13.2 |
Table 6.
The number of days of high-energy electron storms in 2019.
Table 6.
The number of days of high-energy electron storms in 2019.
| Month | Days of Minor High Energy Electron Storm | Days of Moderate High Energy Electron Storm | Days of High-Energy Electron Storm |
|---|
| 1 | 1 | | |
| 2 | 5 | | |
| 3 | 8 | 2 | |
| 4 | 7 | | |
| 5 | 4 | | |
| 6 | 2 | | |
| 7 | 5 | | |
| 8 | 11 | 1 | |
| 9 | 13 | 4 | |
| 10 | 7 | 3 | |
| 11 | 3 | | |
| 12 | | | |
| Total | 66 | 10 | |
Table 7.
Comparison between the measured results and the simulation results of SPENVIS for FY4-A.
Table 7.
Comparison between the measured results and the simulation results of SPENVIS for FY4-A.
| Equivalent Shield 1 mmAl | Equivalent Shield 1 mmAl | Total Radiation Dose
(Rad(Si)) | Average Radiation Dose Rate
(Rad(Si)/Monthly) | Maximum Radiation Dose Rate
(Rad(Si)/Monthly) |
|---|
| FY4-A satellite | AE8/AP8 model | solar maximum: 31,300 | 665.9 | 665.9 |
| solar minimum: 22,800 | 485.1 |
| measured value | +X: 26,800 | 570.2 | 1982.8 |
| −Y: 15,320 | 326.0 | 1063.1 |
| −Z: 22,550 | 479.8 | 1662.3 |
| Disclaimer/Publisher’s Note: The statements, opinions and data contained in all publications are solely those of the individual author(s) and contributor(s) and not of MDPI and/or the editor(s). MDPI and/or the editor(s) disclaim responsibility for any injury to people or property resulting from any ideas, methods, instructions or products referred to in the content. |
© 2023 by the authors. Licensee MDPI, Basel, Switzerland. This article is an open access article distributed under the terms and conditions of the Creative Commons Attribution (CC BY) license (https://creativecommons.org/licenses/by/4.0/).


 ,
, 


