1. Introduction
Adapting to climate change and mitigating its negative effects is today one of the most important challenges for humankind [
1,
2]. The Intergovernmental Panel on Climate Change (IPCC) has confirmed that human influence on the climate system is evident and increasing, and its adverse effects can be witnessed in every continent and every ocean. Additionally, the Panel states that the larger the human-related disturbance on climate, the higher the risks of serious, generalized, and irreversible impacts on people and ecosystems and the longer lasting the changes in each of the components of the climate system [
3].
Climate change refers to “a change in the state of the climate that can be identified (e.g., by using statistical tests) by changes in the mean and/or the variability of its properties, and that persists for an extended period, typically decades or longer” [
4]. Climate change can be a consequence of nature’s internal processes or the effect of external forces, such as modulations associated with solar cycles, volcanic eruptions, or persistent anthropogenic changes affecting atmospheric composition or soil use [
5,
6,
7,
8].
The successful implementation of adaptation strategies depends to a large extent on the accurate and timely detection of changes in climate at the regional and local levels in different parts of the world [
2,
9]. Changes in many extreme weather and climate events have been observed since approximately 1950, some of which have been associated with human activity, such as the decrease in extreme cold temperatures, the increase in extreme warm temperatures, the increase in maximum sea levels, and the larger number of intense precipitation events in different regions [
3,
4,
10,
11].
According to the IPCC, extreme precipitation is likely to become more intense and frequent by the end of the century in most mid-latitude continental masses, and tropical humid regions as global mean and surface temperatures increase; the frequency of extreme hot temperatures is practically certain to increase, while the frequency of extreme cold temperatures will most likely decrease in most continents as global mean temperatures rise at both the daily and seasonal scales [
3]. These climatic changes produce chain reactions in the Earth system and have profound effects on human and environmental systems [
8], and they represent an adaptation challenge for climate-sensitive sectors such as agriculture [
12], hence the need to develop management practices and systems intended to maintain agricultural productivity and avoid food security problems [
13]. Although most societies and agricultural and environmental systems have historically adapted to climate extremes, they may not easily adapt to the changes represented by the tails of daily data distributions because extreme climate events often have very direct and nonlinear impacts [
14]. Moreover, the adaptive capacity of some areas is limited by financial, human, and physical capital, as well as by people’s lifestyle and cultural barriers.
In this context, and due to their importance and implications for physical, human, and environmental processes, analyzing the trends of recent changes in temperature and precipitation extremes has been the focus of different studies [
11,
15,
16]; many of the tools used in these studies to monitor changes in climate extremes have been developed using indices. These analyses are essential for a comprehensive appraisal of changes in climate extremes in specific regions or places [
17].
Although there is no unambiguous definition of climate extreme, the use of a common theoretical basis to define extreme events allows for their systematic study [
18]. In this regard, the Expert Team on Climate Change Detection and Indices (ETCCDI), sponsored by the Commission for Climatology (CCI) of the World Meteorological Organization (WMO), the Climate Predictability and Variability (CLIVAR) project, and the Joint Technical Commission for Oceanography and Marine Meteorology (JCOMM), developed a set of 27 indices (16 associated with temperature and 11 with precipitation) to detect changes in the behavior of climate extremes [
19]. This set of indices was defined in order to calculate changes in climate extremes in exactly the same way throughout the world with the purpose of having a common global baseline [
20,
21]; this baseline makes it possible to compare studies carried out anywhere on the planet and encourages further research of this kind, especially in less developed countries [
22].
This set of indices was used to examine changes in climate extremes in five areas of the world where regional workshops on climate change were held [
23,
24,
25,
26,
27,
28], and a global analysis incorporating the indices calculated in the regional workshops was also conducted [
29]. Although results varied from region to region, evidence of significant changes in extreme temperatures consistent with global warming was generally found after 1950, i.e., increased maximum temperature events and decreased minimum temperature events. Precipitation-related changes showed a general and significant increase in some regions, but these changes were much less spatially coherent in comparison with temperature-related changes.
These indices have also been used in different countries to search for evidence of climate change (e.g., [
30,
31,
32,
33], among others), and results are broadly consistent with increasing trends in mean global temperature. However, precipitation-related trends are unclear, and there are significant differences from one country to another, which indicates that global changes in this climate variable are not homogeneous throughout the world, but vary from one place to another [
34,
35]; therefore, subnational and local studies need to be conducted in order to detect and better understand the changes taking place at a small scale, not only concerning precipitation extremes, but also temperature extremes. In the specific case of Mexico, the indices created by the ETCCDI have been used at the local level to detect possible changes in climate in a number of watersheds, states, or cities [
36,
37,
38,
39,
40,
41]; results are generally consistent when analyzing adjacent places or areas with similar climatic conditions, but they can differ for remote watersheds or regions with different climatic conditions. For example, in a study carried out in the state of Veracruz [
36], located on the Gulf of Mexico (in the country’s southeast), results showed evidence of warmer conditions in recent years (increased frequency of hot days and decreased frequency of cool days), and precipitation was found to occur over shorter periods. These data are consistent with those obtained by another, more recent study, carried out in the cities of Xalapa and Coatepec (in the state of Veracruz), reporting that temperatures were found to be less extreme (less difference between high and low temperatures) and that total annual precipitation has increased, but it also occurs over shorter periods [
39]. However, these results differ from those obtained for the Conchos river basin, located in the north of the country, in the state of Chihuahua, where results clearly indicate a significant increase in the duration of dry periods over the past years [
40]. Hence the importance of carrying out local studies on extreme climate trends. Increasing the accuracy with which we detect changes taking place in different regions of the country will produce information that can be used to make sound decisions concerning the implementation of relevant adaptation and mitigation measures.
In this regard, the purpose of the present study was to analyze trends in eight climate indices proposed by the ETCCDI (four temperature indices and four precipitation indices) in the state of Zacatecas, Mexico, to detect changes in climate extremes over a 40-year period (1976–2015). The state of Zacatecas, located in a semi-arid region of importance to national agriculture, is vulnerable to the effects of extreme hydro-meteorological and climate events, such as cold fronts, heat waves, droughts, frosts, or torrential rains. The results of this study will help to determine the areas of the state that have been affected the most by climate change and to create an image of the spatio-temporal distribution of extreme temperature and precipitation events. These data will support the adaptation or development of technologies and production systems to address the present conditions.
2. Materials and Methods
2.1. Description of Study Area
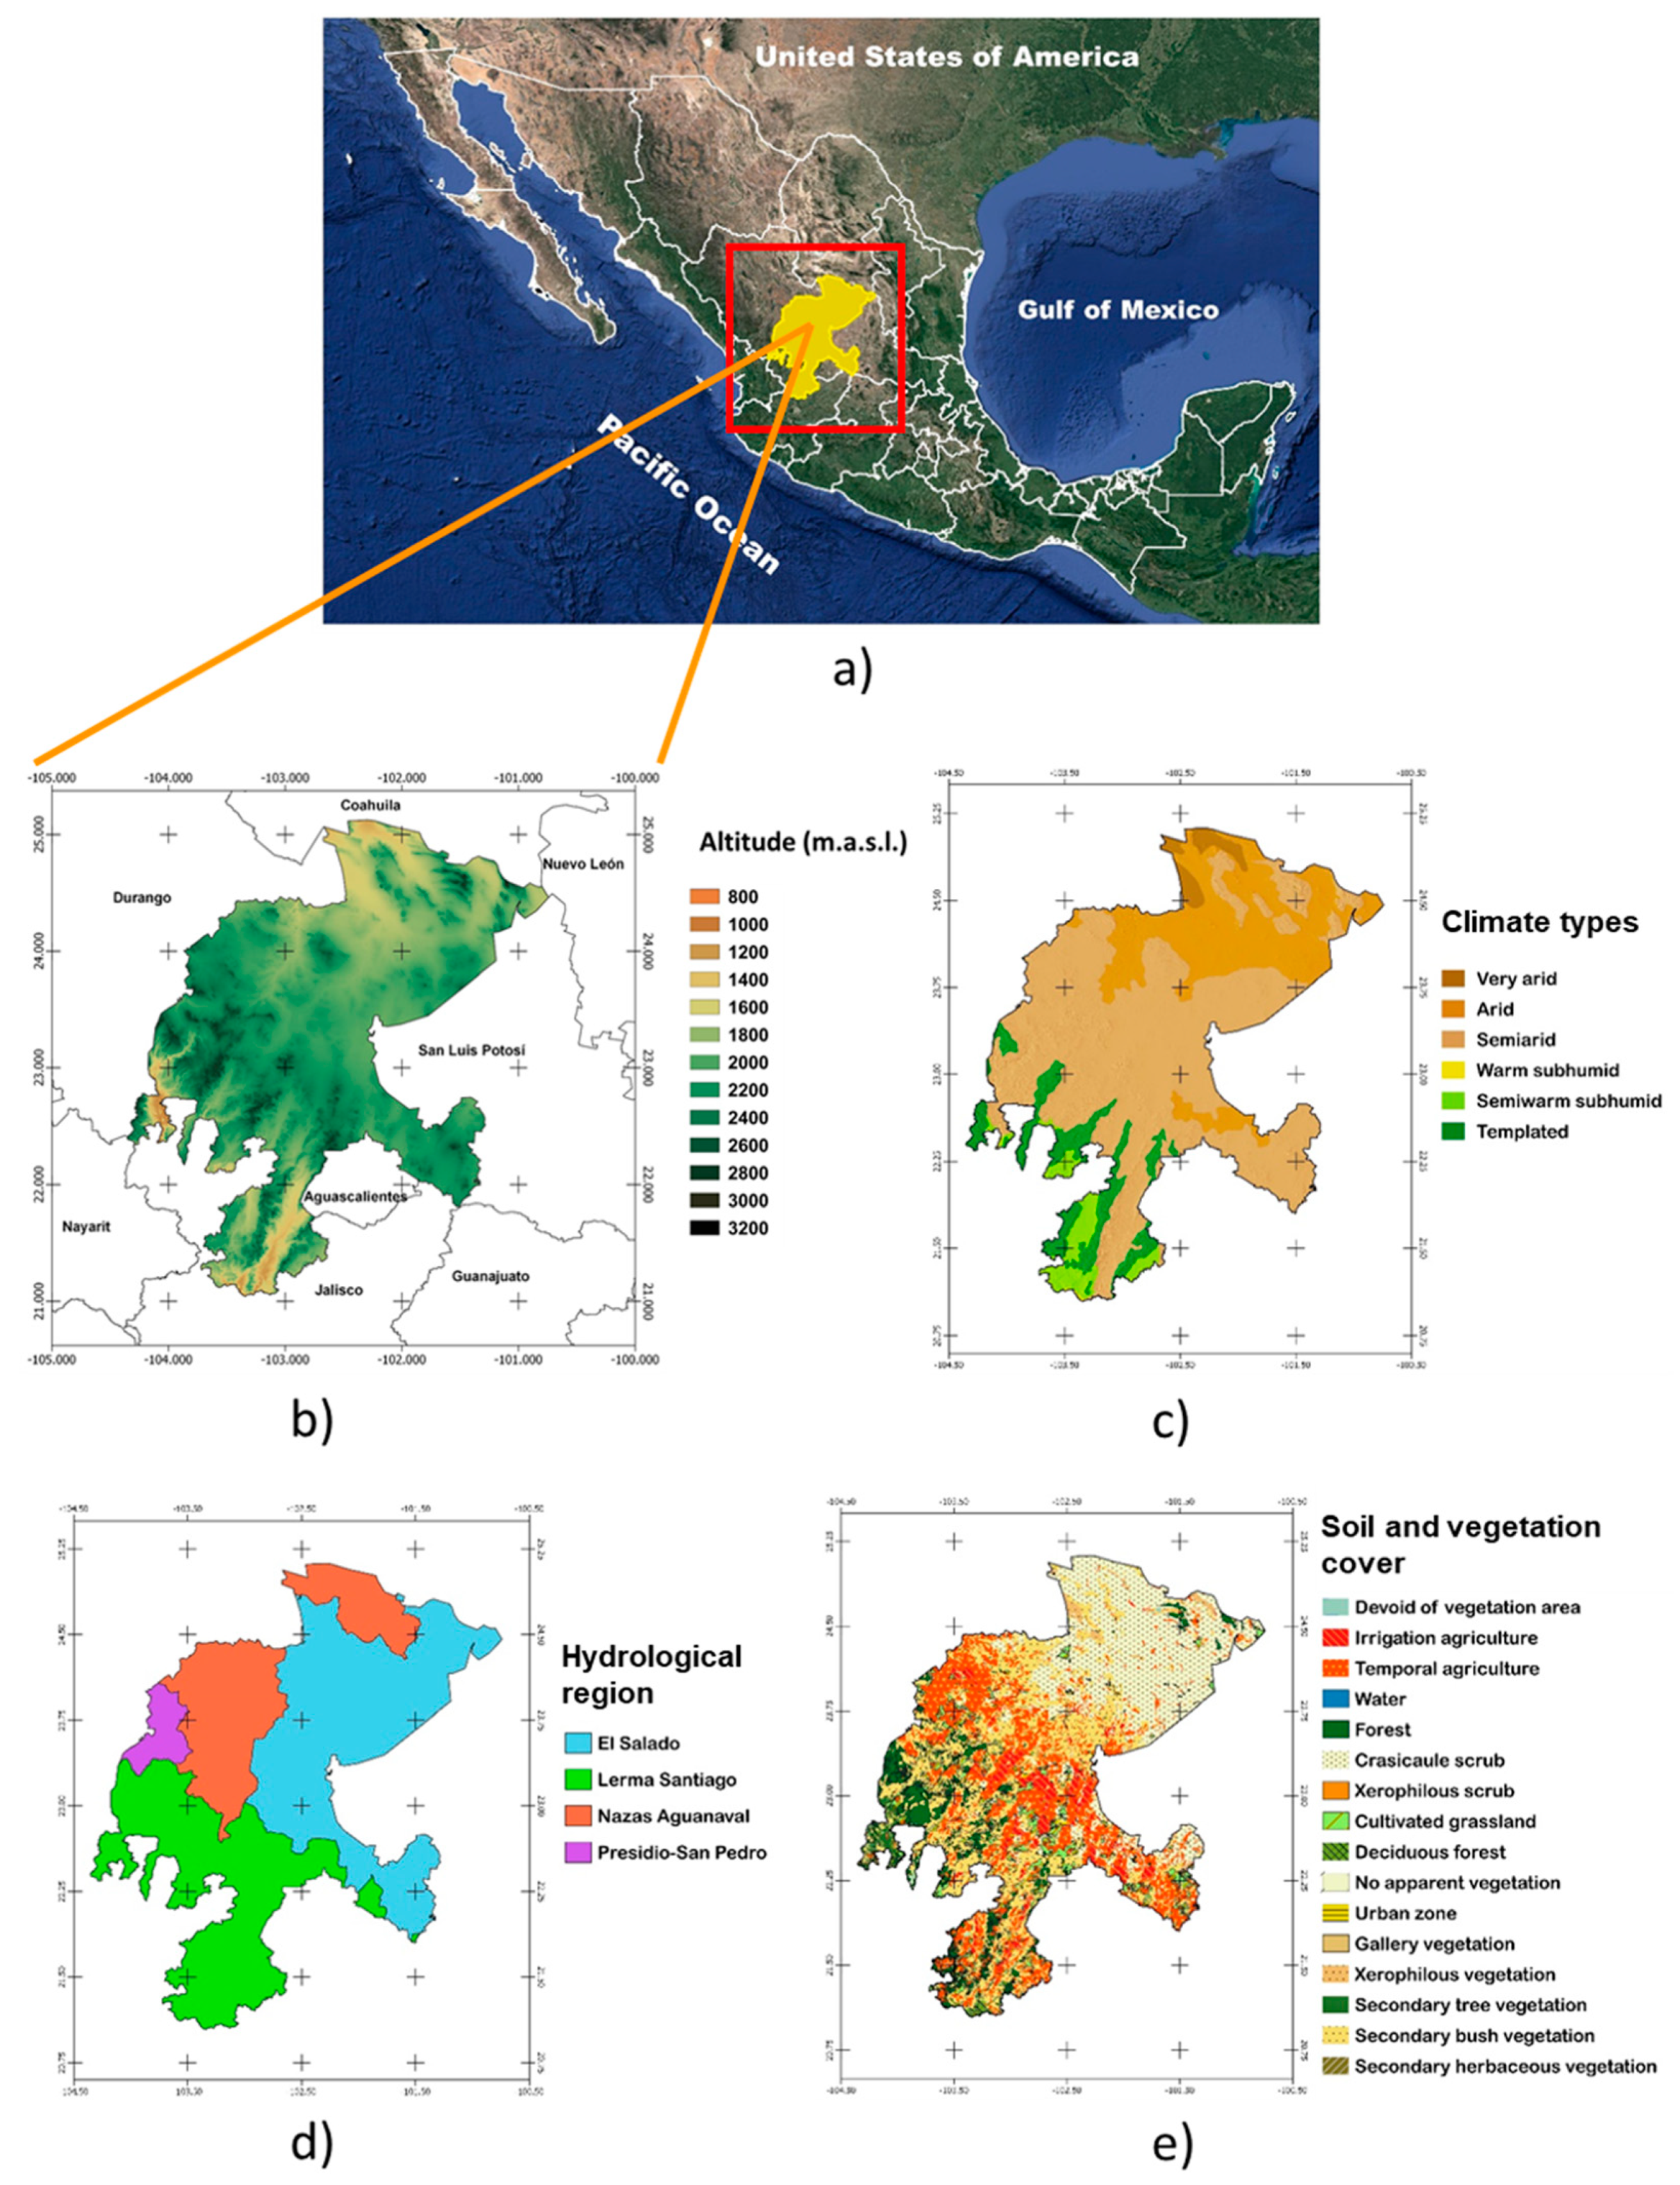
The state of Zacatecas is located in the north-central region of Mexico, between coordinates 21.016 and 25.116 N and 100.716 and 104.366 W; it has a surface area of 75,284 km
2, which represents 3.8% of the national territory. Its northern borders are shared with the states of Durango and Coahuila; to the east with the states of Coahuila, Nuevo León, and San Luis Potosí; to the west with Jalisco, Nayarit, and Durango; and to the south with Guanajuato, Jalisco, and Aguascalientes (
Figure 1a,b). It has a population of 1.5 million inhabitants, most of whom (59%) live in urban areas, whereas the rest (41%) live in rural communities [
42] (
Figure 1).
The state’s topography is quite variable, including mountains, valleys, plains, and plateaus, because it is part of three different physiographic provinces: the Sierra Madre Occidental (located in the north of the state), the Sierra Madre Oriental (center and southeast), and the Central Mexican Plateau (south of the state). The minimum altitude in the state, in the Juchipila river canyon, is 840 m above sea level (masl), whereas the highest point is located on the Cerro de los Pelones, with an altitude of 3160 masl. The city of Zacatecas, the state capital, has an average altitude of 2450 masl (
Figure 1b).
The predominant climate in most of Zacatecas is dry and semi-dry (73%); 17% of the territory, in the east of the state, is temperate subhumid; in 6% of the territory, mainly the north and northeast regions, the climate is very dry, and the remaining 4% of the state, in the south and southwest, presents subhumid warm climate (
Figure 1c). Mean annual temperature is 17 °C, with a maximum mean temperature of 30 °C in the month of May and a minimum mean temperature of 3 °C in the month of January. Average annual precipitation is 510 mm, although the value is 300 mm in the northern part of the state and 860 mm in the south; the rainy season is in the summer (June to September). The dry and semi-dry climate of the state is a limitation for agriculture, which is irrigated and seasonal and is one of the main economic activities in the state [
47].
Most of Zacatecas is located in the hydrological regions of El Salado and Lerma-Santiago (39.9% and 32.7% of the territory, respectively). These regions are located in the central and southern portions of the state, and they are characterized by their high availability of surface water and groundwater. In contrast, the Nazas-Aguanaval hydrological region, comprising a large portion of the state’s north (23.6%), is characterized by its very dry climate, which makes it most vulnerable to water scarcity. The rest of the state (3.8%) is located in the hydrological region of the Presidio-San Pedro rivers and has little influence on the state’s hydrological system (
Figure 1d).
Concerning soil use and vegetation, the northern part of Zacatecas is dominated by scrubland and grassland, while the central part and small portions in the south are dominated by rainfed and irrigated agriculture. The southwestern region has a variety of vegetation types, such as forest and secondary vegetation, and gallery forest in areas close to surface currents. The use of land for urban development is still minimal in the state; the largest urbanized areas are the cities of Zacatecas and Fresnillo (
Figure 1e).
2.2. Selection of Weather Stations
Weather stations from the CLImate COMputing (CLICOM) system, operated by the Mexican Meteorological Service [
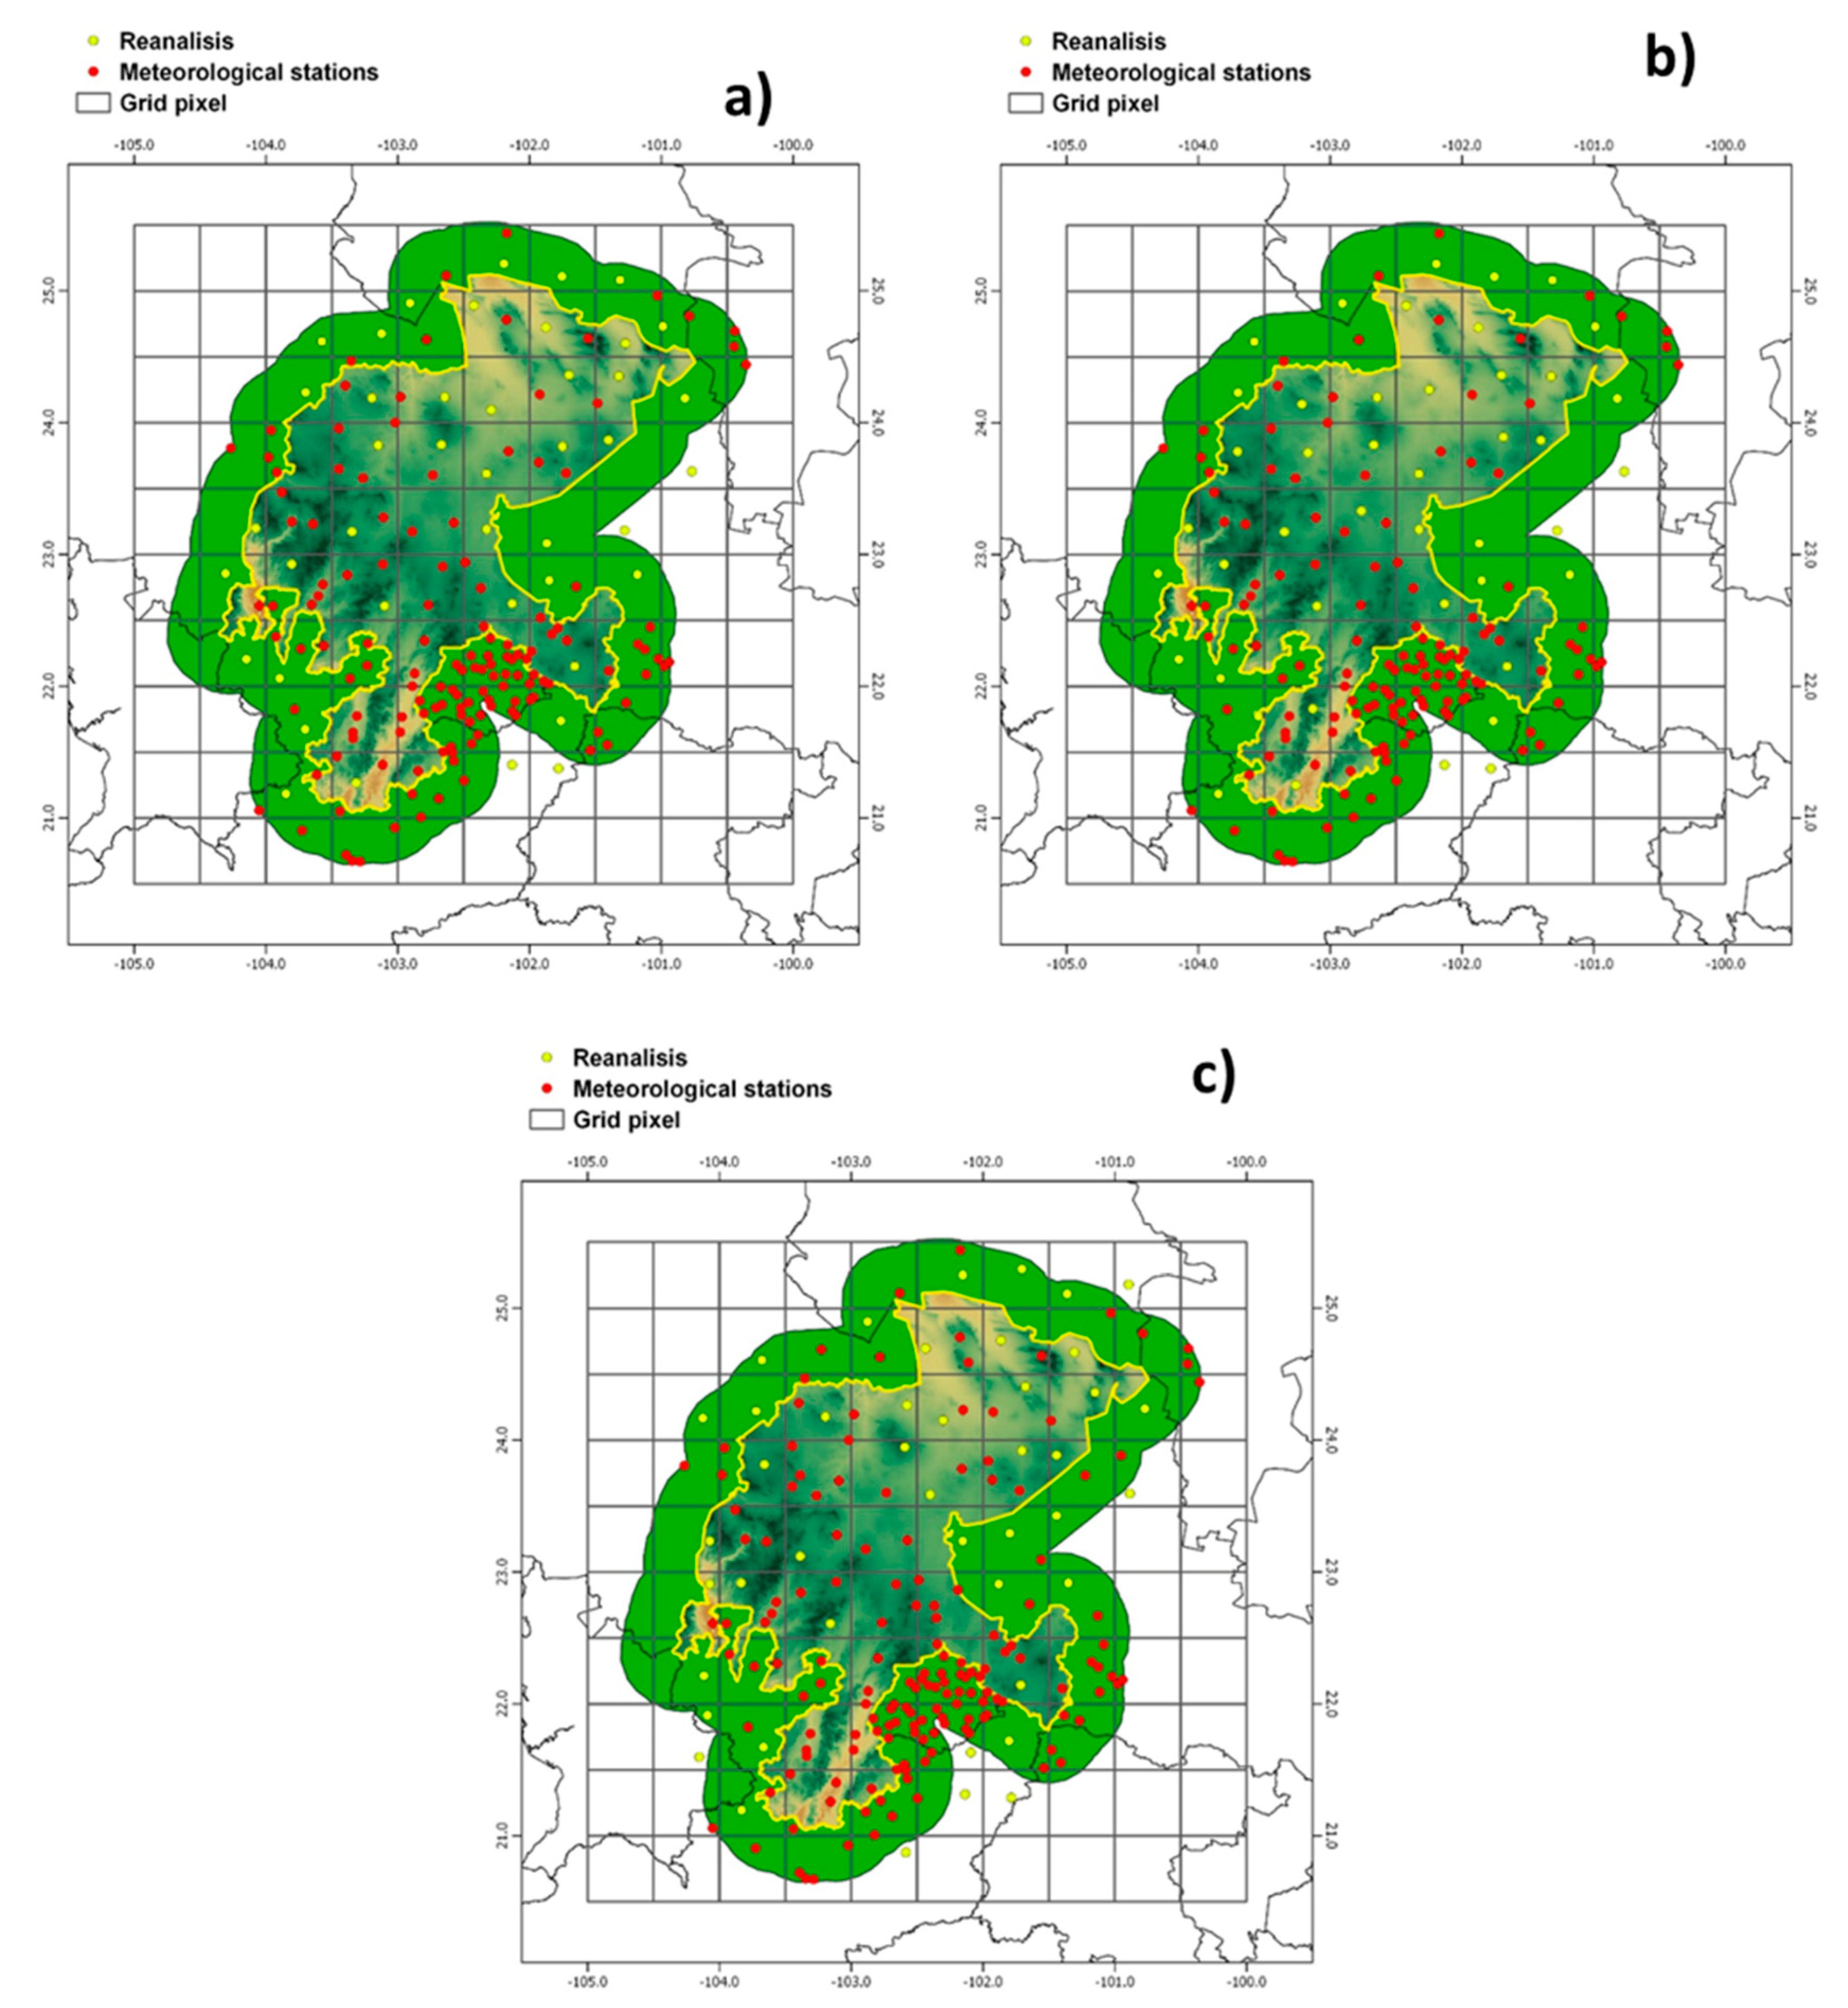
48], were selected to obtain data on maximum temperature (TMAX), minimum temperature (TMIN), and precipitation (PP). Selection criteria were based on recommendations by the World Meteorological Organization (WMO); thus, selected stations were those having 80% or more data available for the analysis period (1976–2015) and being located in the state of Zacatecas or within a 40-km range beyond its border in neighboring states. However, given that weather stations are scarce in some parts of the state, estimations for these areas are complicated due to the lack of data. Therefore, it was decided to use monthly reanalysis series and data (TMAX, TMIN and PP) from CRU TS (Climate Research Unit) databases (version 4.03) [
49], with a resolution of 0.5° latitude by 0.5° longitude, as reference series for areas affected by information gaps. The interpolation process used was angular-distance weighting (ADW); this method provides an improvement in the plot between each grid value and the input observations.
Table 1 shows the number of weather and reanalysis stations used in the data homogenization process for each variable, and the geographical location of the stations is shown in
Figure 2.
2.3. Quality Control, Homogenization, and Filling of Missing Data
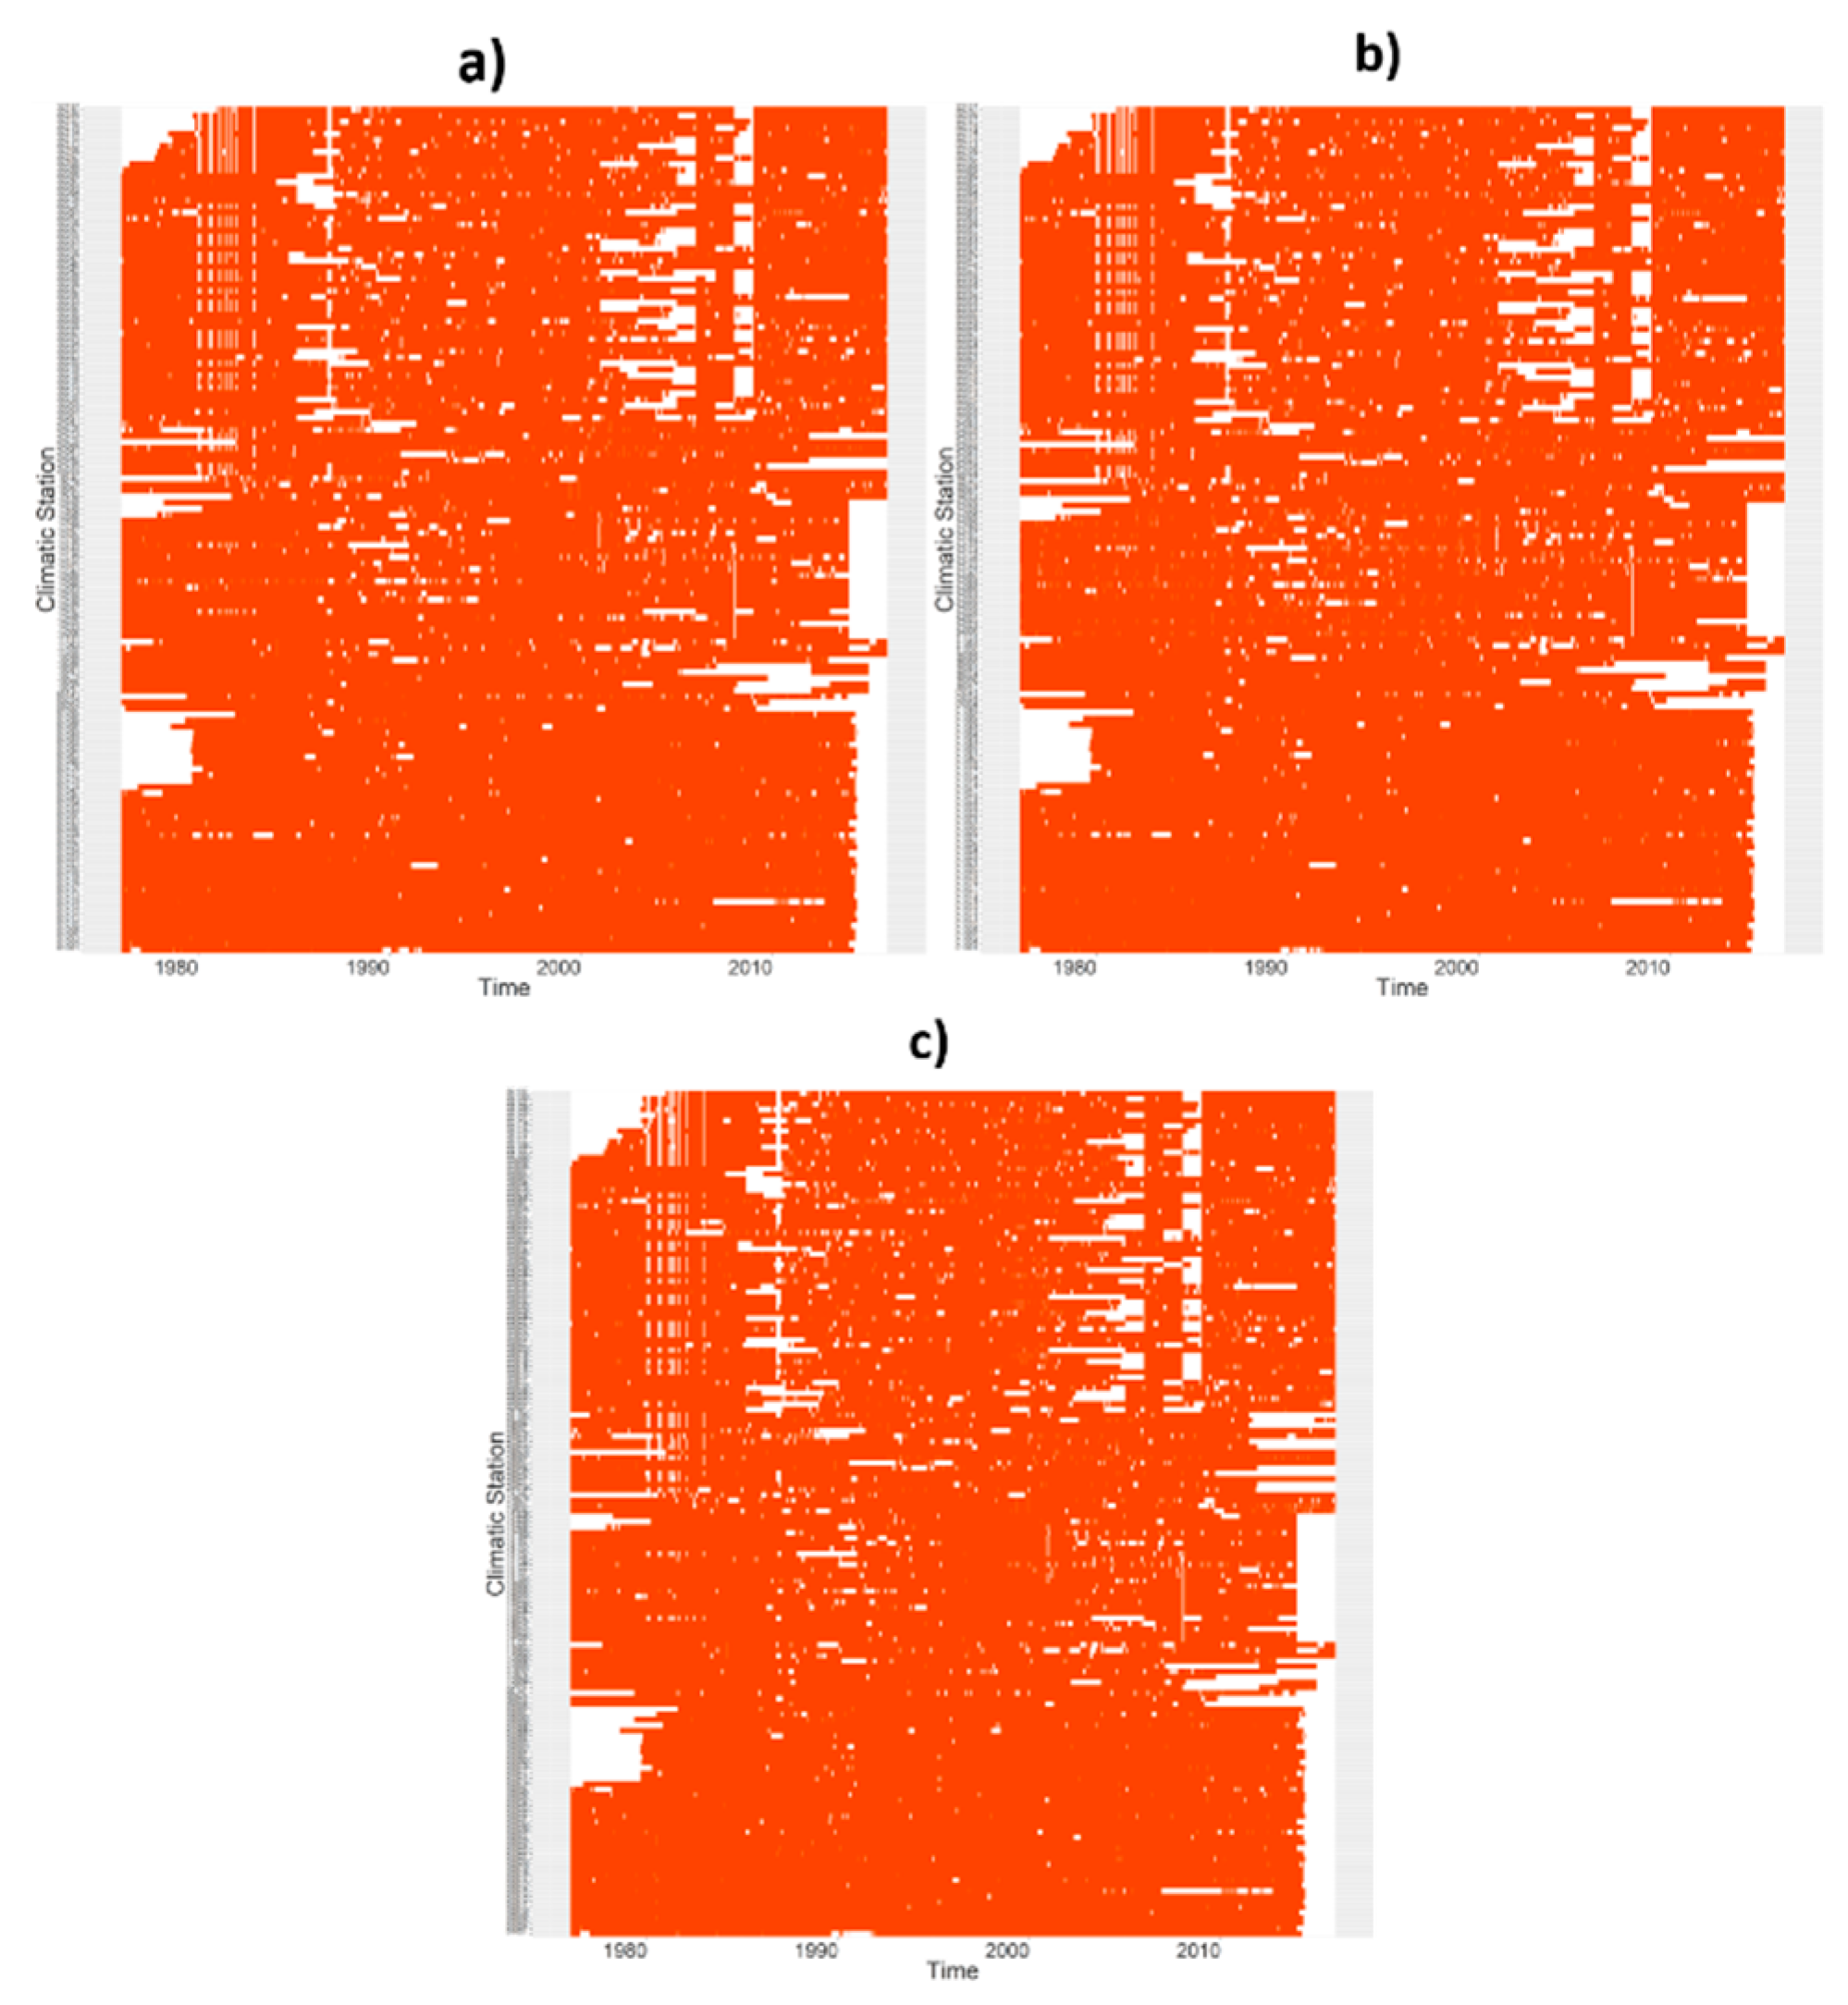
Changes in the observing conditions or the environment around climatological stations introduce anomalous perturbations in the data series (inhomogeneities). Therefore, homogenization is of paramount importance for a reliable analysis of the variability of the climatological series, and plenty of literature and software focus on the different methodologies applied so far [
50,
51,
52]. Different types of homogenization methods may lead to different types of results. However, it has been proven that relative homogenization is the best option; in recent times, pairwise approaches have been predominant, and absolute methods are the last resort [
51,
52]. Therefore, among all the available options, we decided to use the relative homogenization tool called Climatol (version 3.1) [
53], which runs in the R programming language. Thus, quality control, homogenization, and the filling of data missing from climate databases, was carried out using this software, which is used to fill gaps in climate series and allows for the detection of anomalous values that can be due to data capture errors. Climatol has the option of using reanalysis series as a reference to nearby stations, and the software is compatible with the Paulhus and Kohler method [
54], in which daily series are filled with spatially close average values. The tool normalizes data by dividing it by its mean values and subtracting the means or by complete standardization. Nevertheless, the main problem with this method is that the means of the series over the study period cannot be known if the series are incomplete, which is common with real-world data series. To solve this problem, Climatol calculates these parameters using the data available for each series, fills missing data using provisional means and standard deviations, and recalculates with the already filled series; subsequently, the data initially absent are recalculated to obtain new means and standard deviations, and the process iterates until none of the means change when data are rounded to their initial accuracy [
53]. The series estimated based on the rest of the series serve as references for their corresponding observed series; thus, the next step is to determine series of anomalies by subtracting estimated values from observed values; these series are used to control the quality of the series, to eliminate anomalies exceeding a predefined threshold, and to test their homogeneity by using the standard normal homogeneity test (SNHT) [
55].
2.4. Creation of An Interpolated Grid
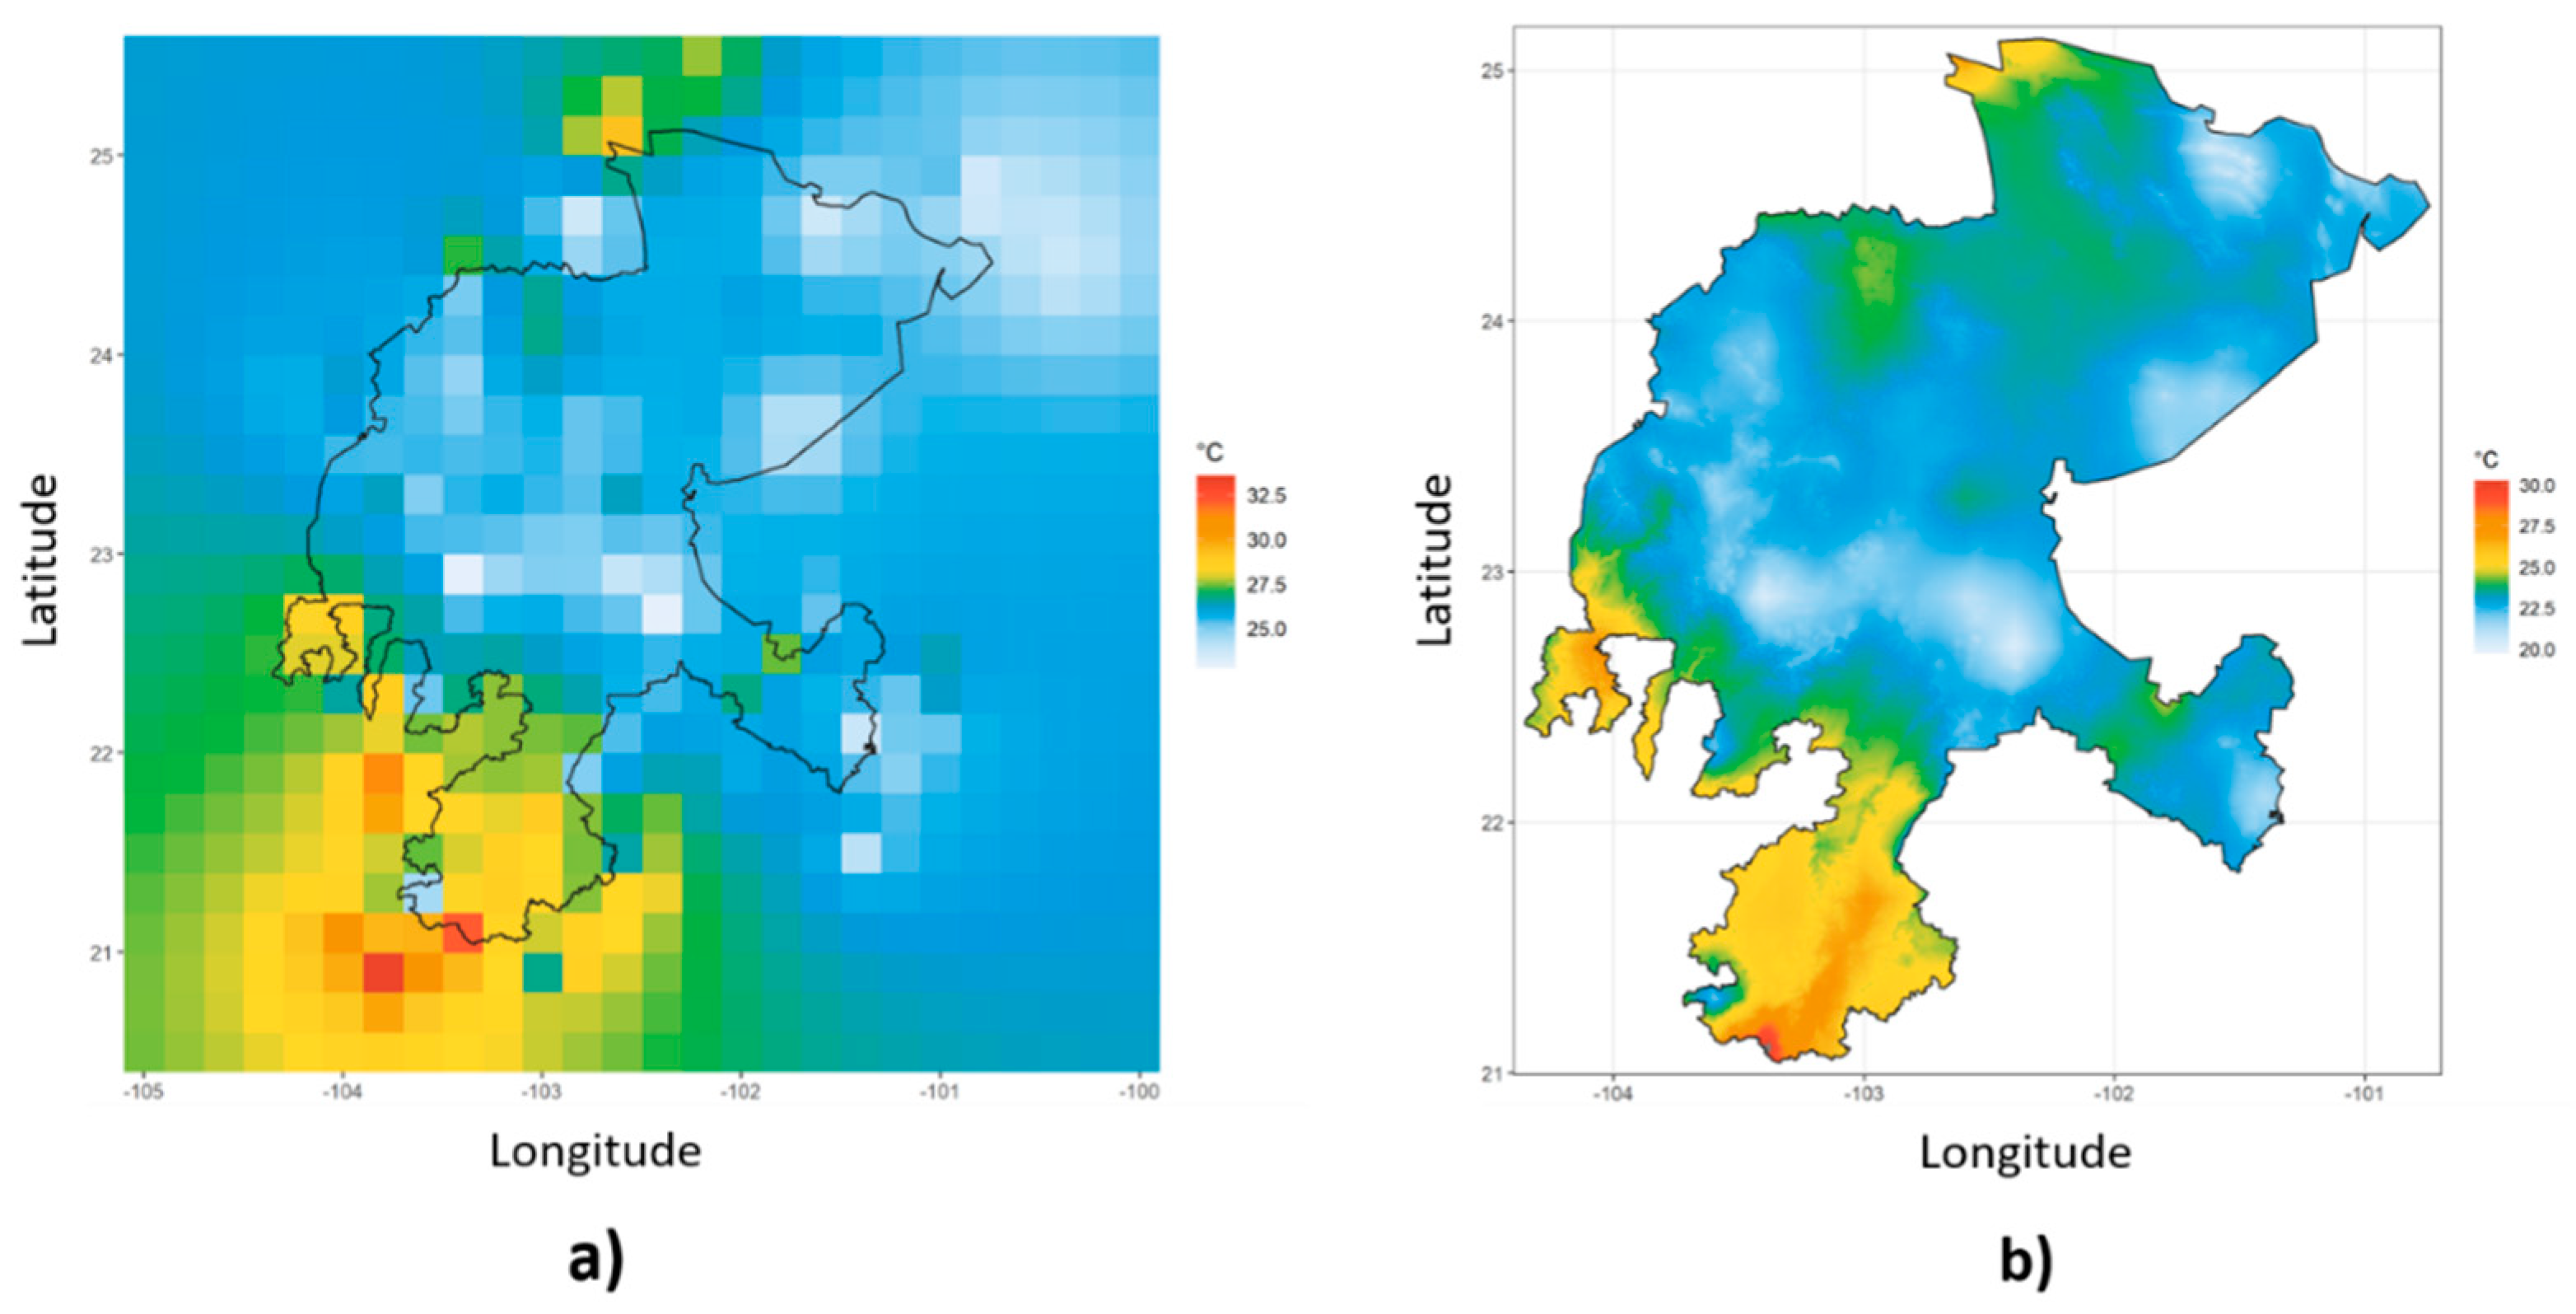
Based on the homogenized data series, an interpolated grid was created using the
dahgrid function in Climatol, which uses the inverse distance weighted (IDW) method [
53]. This function generates daily grids for the user to define spatial limits and spatial resolution. In the present study, the selected spatial resolution was 0.2° (approximately 20 km). This initial resolution is relatively low when compared to the spatial surface of the state of Zacatecas, whose topography is irregular. Therefore, it was decided to create a second grid, in high resolution, using the base level temperature method [
56]; this method attempts to fit the initial grid to a digital elevation model (DEM) by simply matching grid points at a unique altitude (i.e., 0 m, the average altitude of the studied region, or an altitude value defined by the user); in the present study, based on the elevation model, we used the average altitude of the state (2000 masl). The determined temperature
is calculated using the following equation:
where
is the daily temperature of each grid point;
is the correlation coefficient between the elevation and temperature of each grid;
is the determined altitude, and
is the altitude of each grid point. The result is the temperature value of each grid point if it were at a certain altitude (in this case, 2000 masl). Subsequently, another calculation is performed to determine the new value of each grid point using the resolution of the digital elevation model:
where
is the new temperature value assigned to the new resolution;
is the same correlation coefficient previously used, and
is the value of each pixel in the digital elevation model.
The result was a new, NetCDF-format grid adjusted to the topography of the study area, which allowed for a more detailed observation of the distribution of temperature in the state of Zacatecas.
2.5. Calculation of Climate Change Indices
Climate change indices were calculated using the high-resolution homogenized grid and the Climdex.pcic.ncdf software [
57] at the annual and seasonal scales. Of the 27 indices proposed by the ETCCDI [
58], eight (four related to temperature and four to precipitation) were selected. These indices are the most representative of the climatology of the study area; they are presented in
Table 2 and described below:
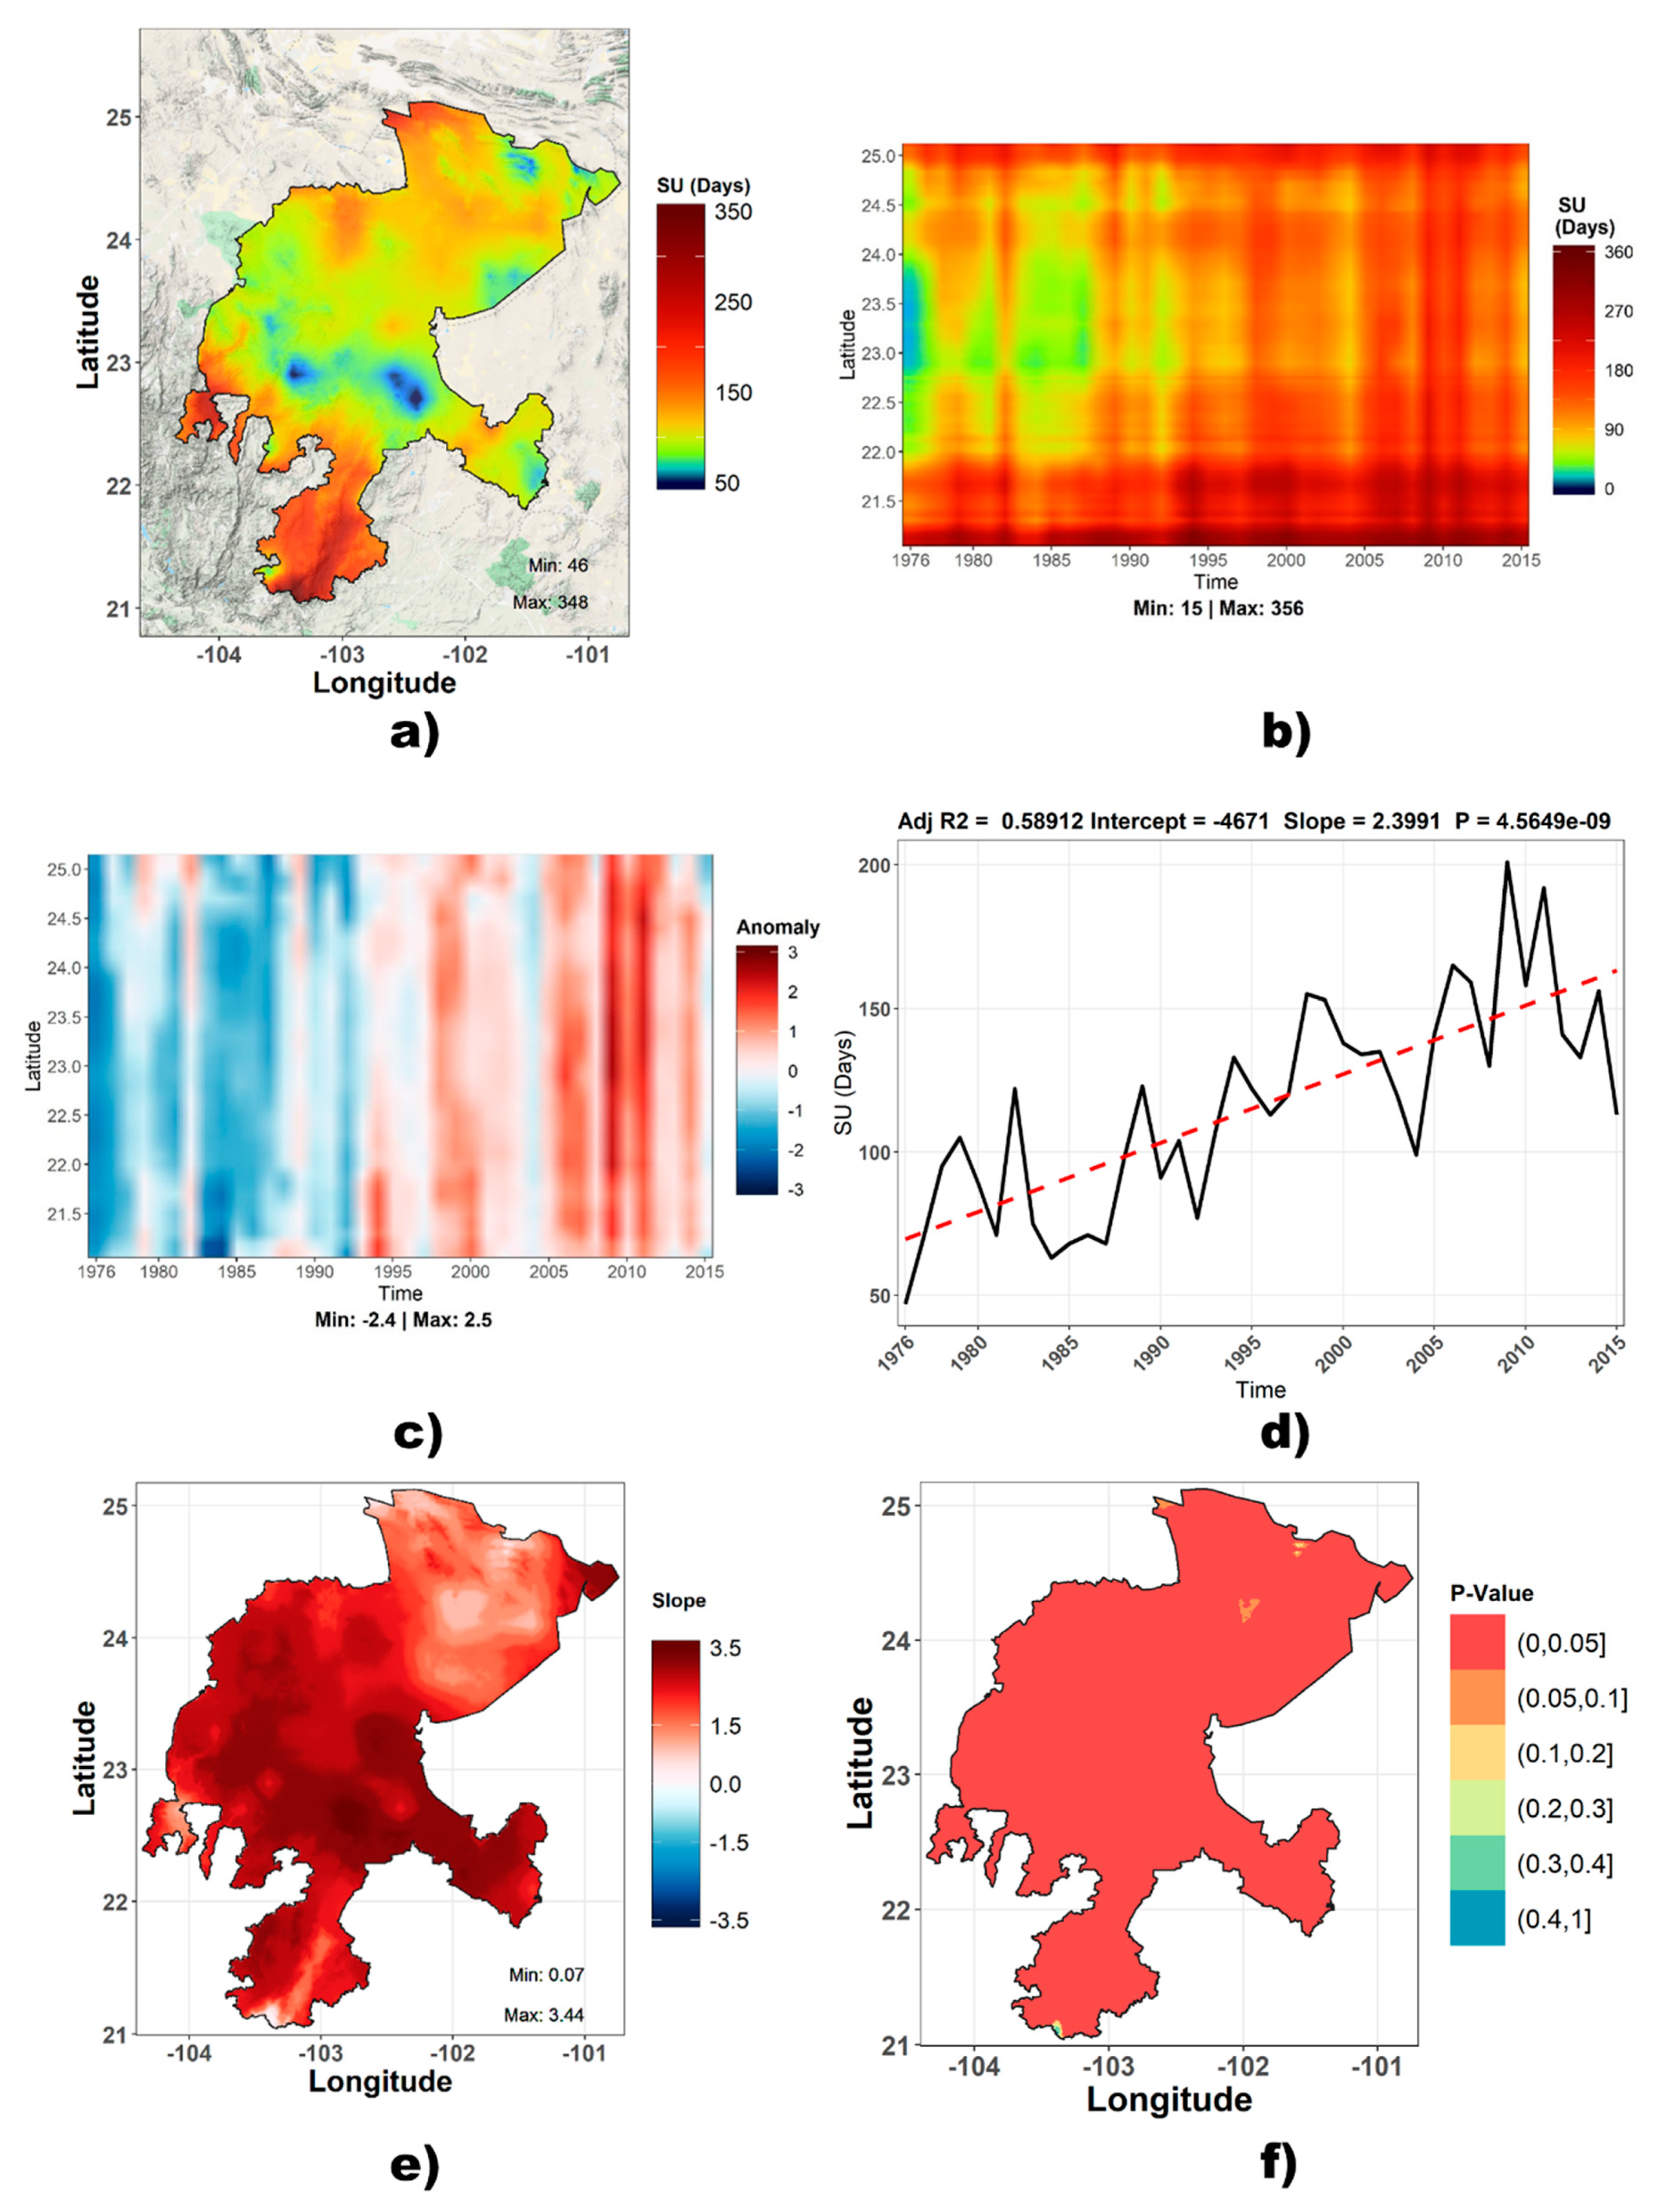
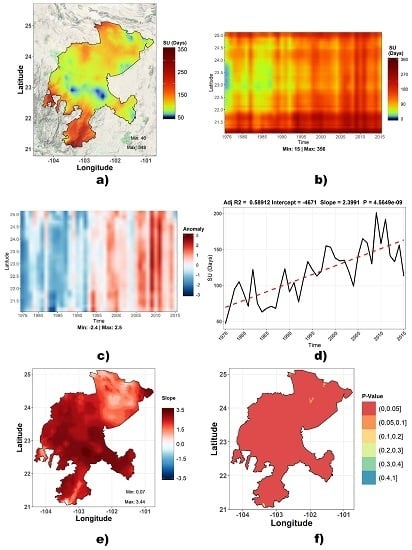
1 Summer days (SU)
Annual count of days when maximum temperature (
TX) is higher than 25 °C. Where
TXij is the maximum temperature on day
i in period
j, the number of days in a year is counted when:
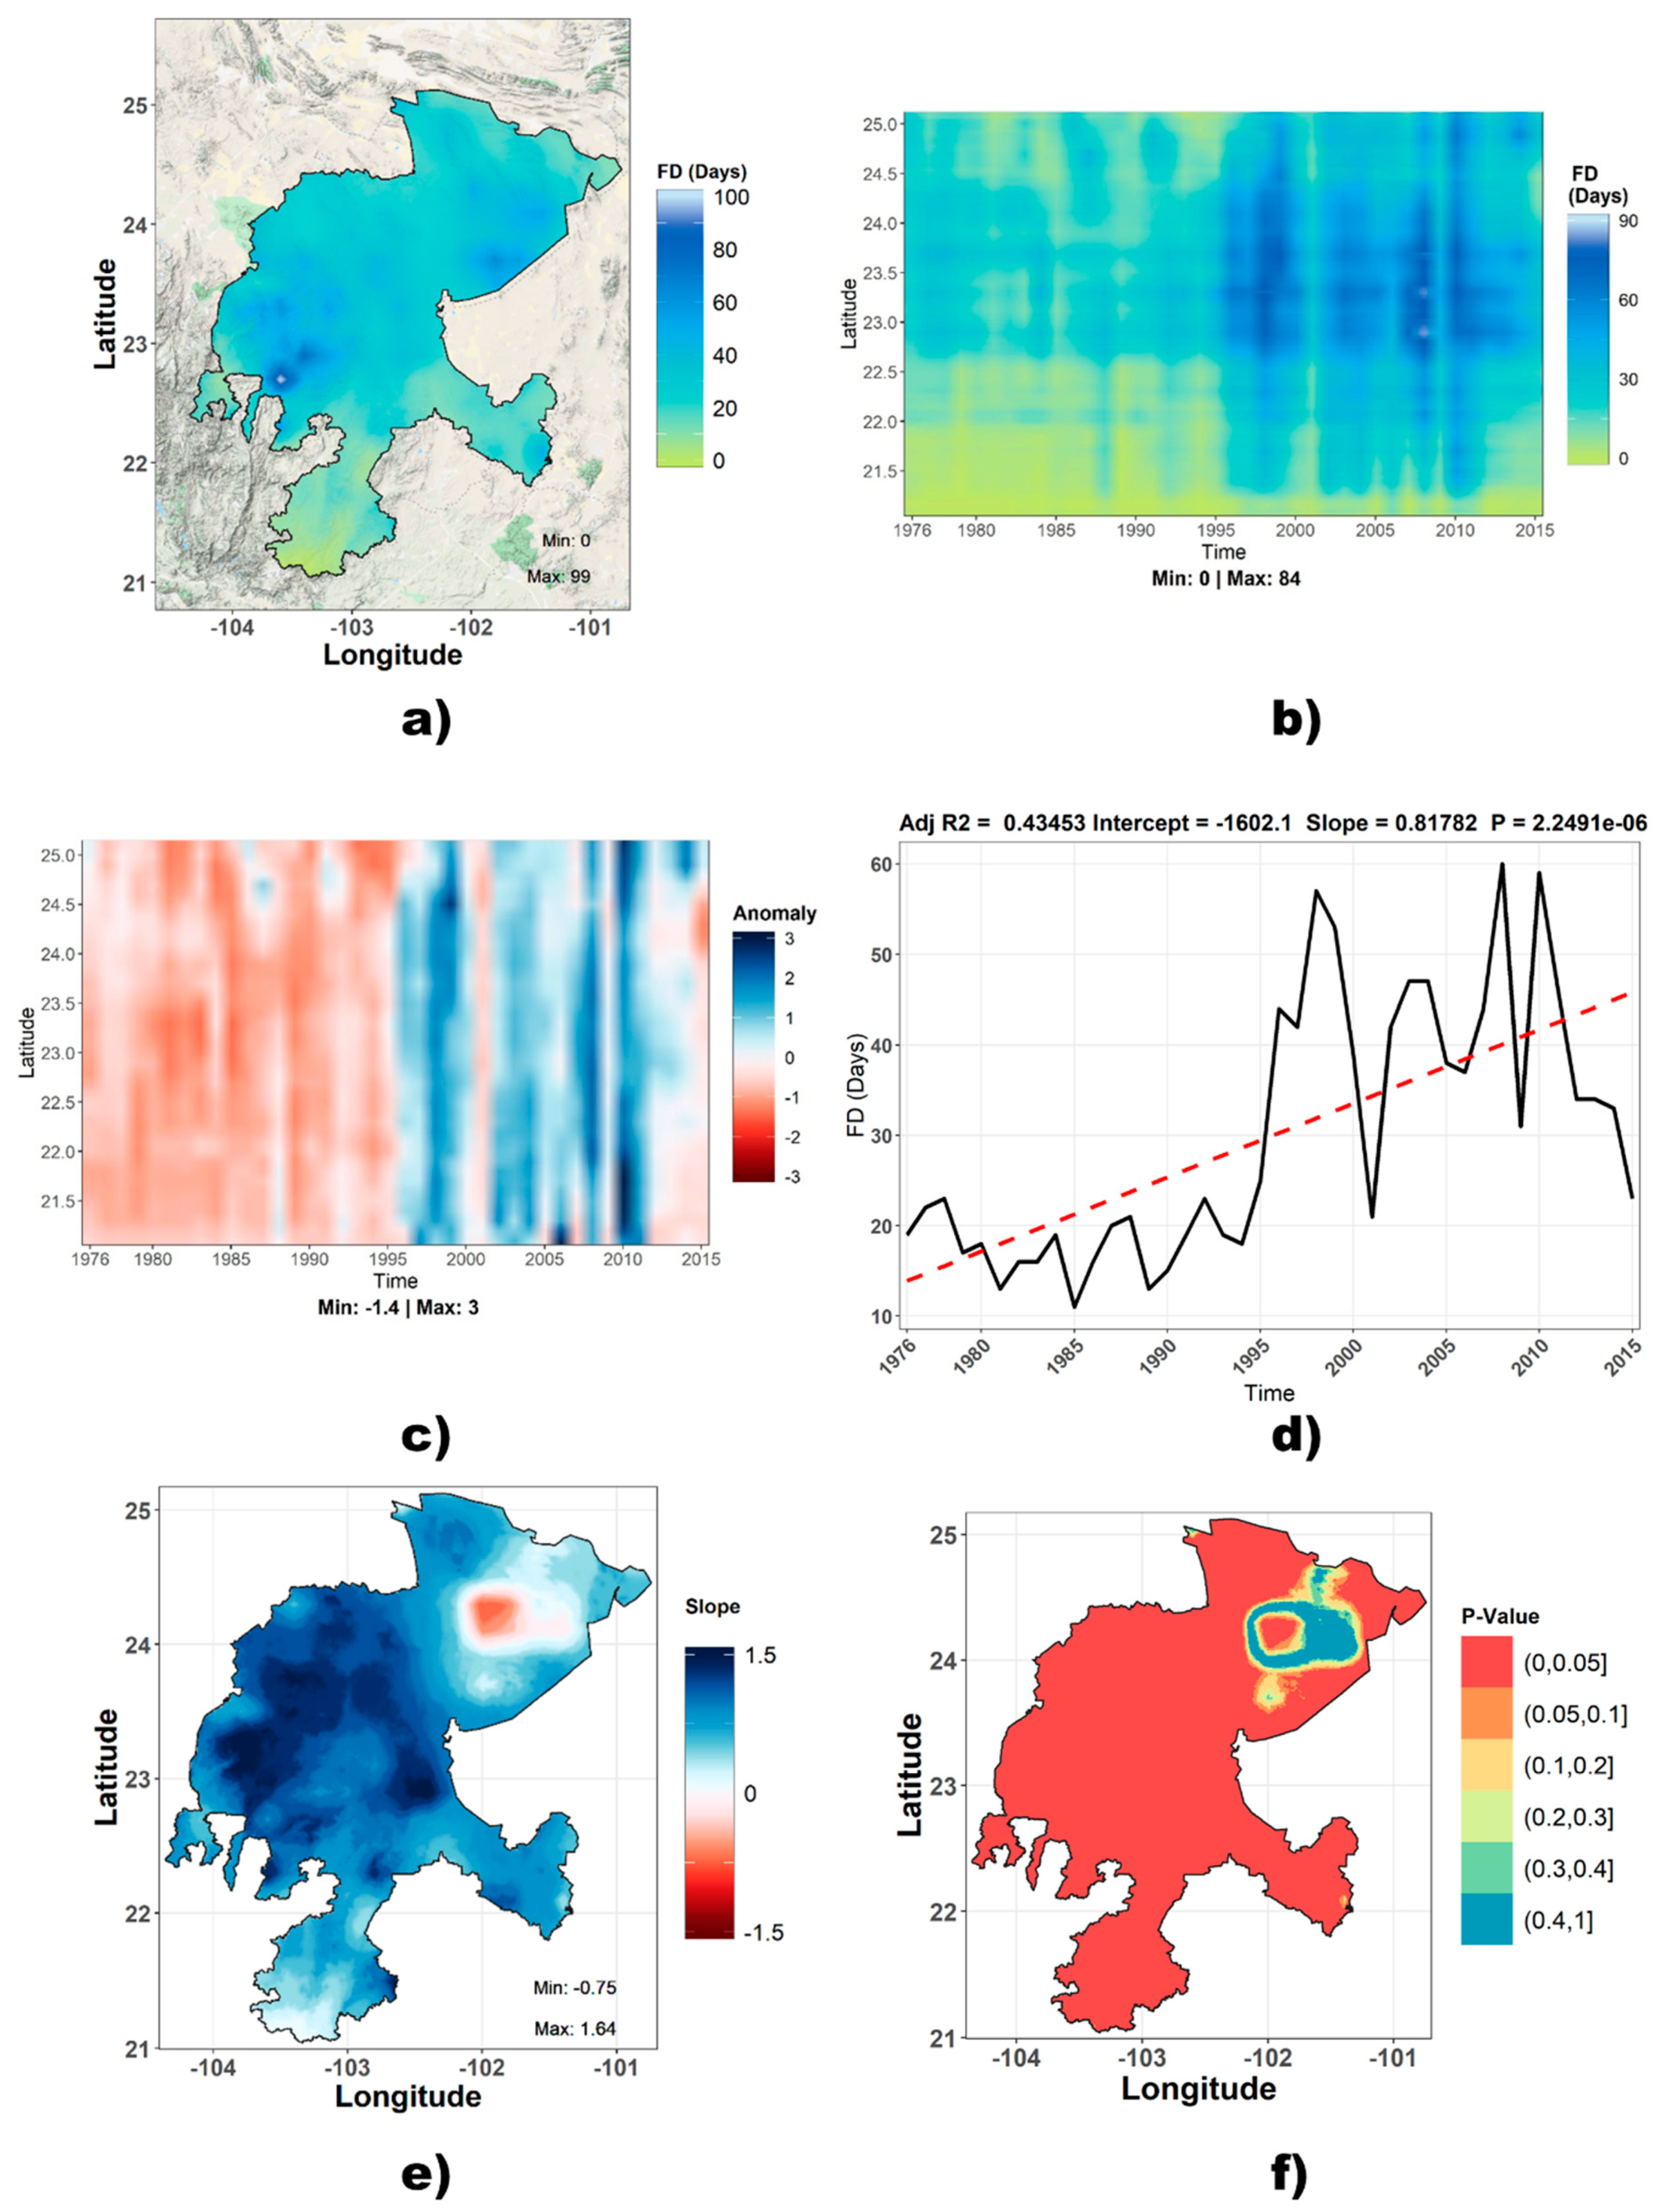
2 Frost days (FD)
Annual count of days when minimum temperature (
TN) is lower than 0 °C. Where
TNij is the minimum temperature on day
i in period
j, the number of days in a year is counted when:
3 Extreme maximum temperature (TXx)
Maximum seasonal value of maximum daily temperature. Where
is the maximum daily temperature
from station
, the maximum seasonal extreme temperature is:
4 Extreme Minimum Temperature (TNn)
Minimum seasonal value of minimum daily temperature. Where
is the minimum temperature on day
from station
, the minimum extreme seasonal temperature is:
5 Total precipitation on humid days (PRCPTOT)
Where
is the amount of precipitation on day
in period
. If
represents the number of days in
, then:
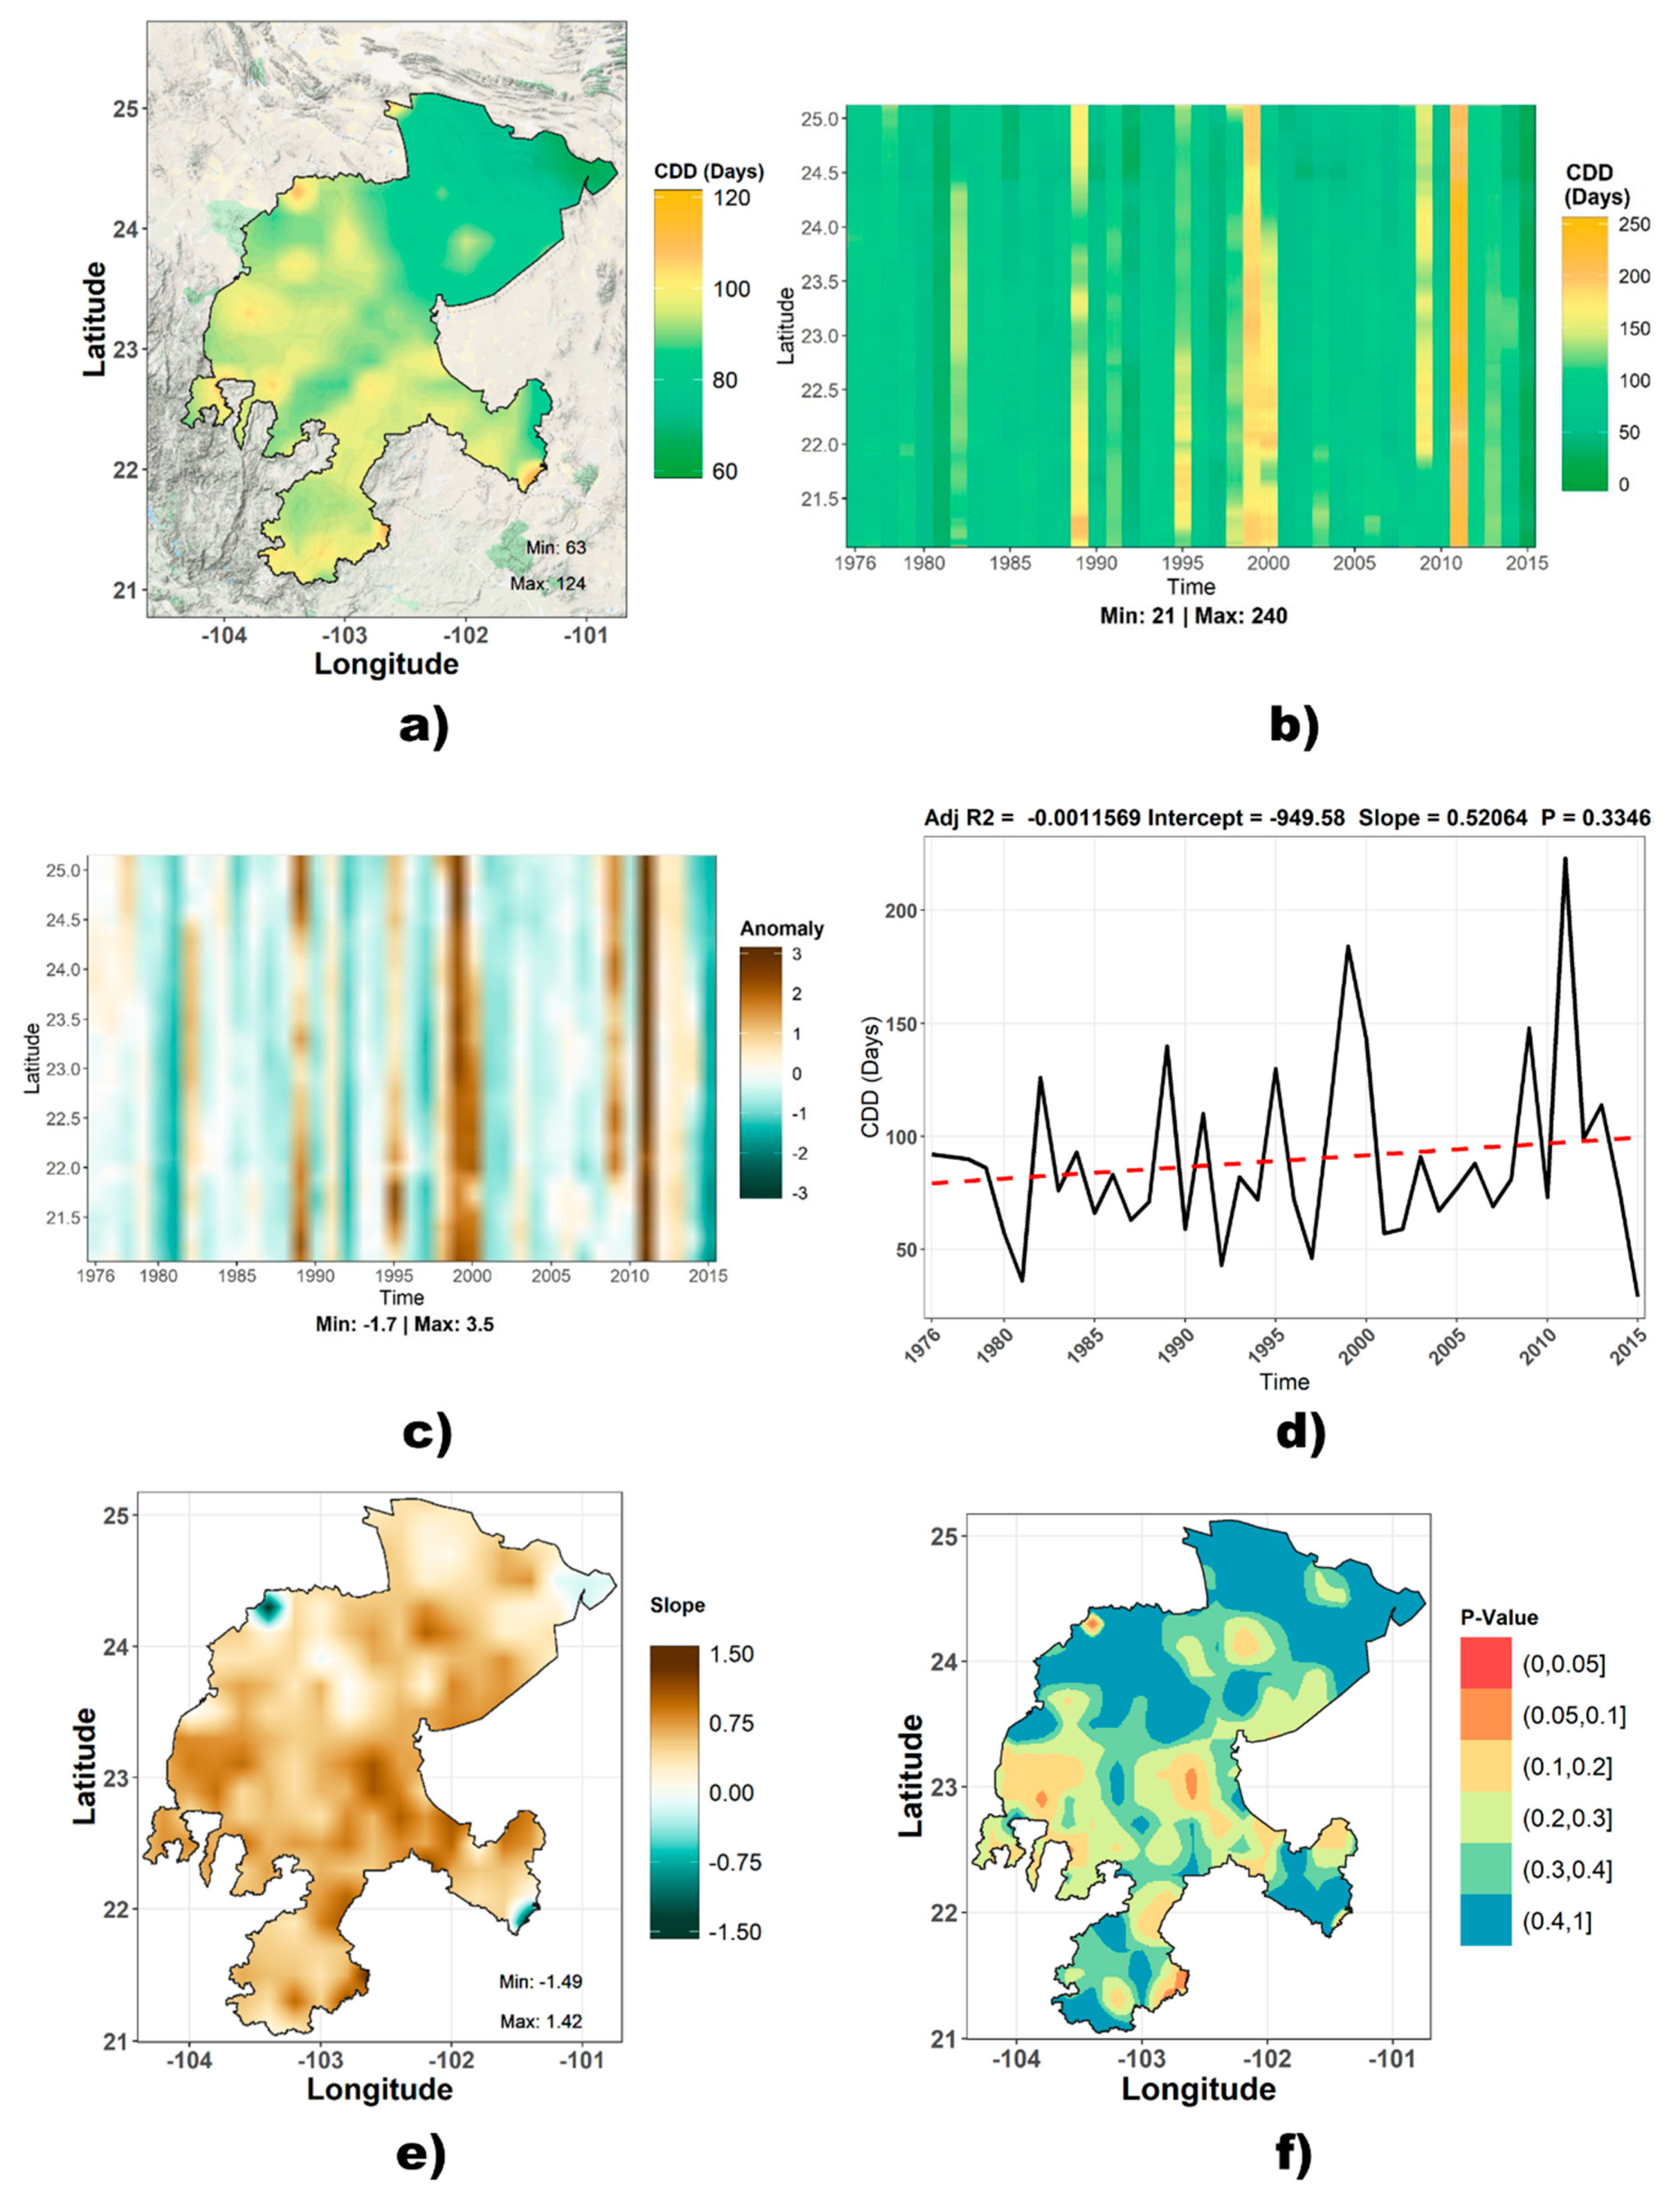
6 Consecutive dry days (CDD)
Where
is the daily amount of precipitation on day
in period
, the largest number of consecutive days is counted when:
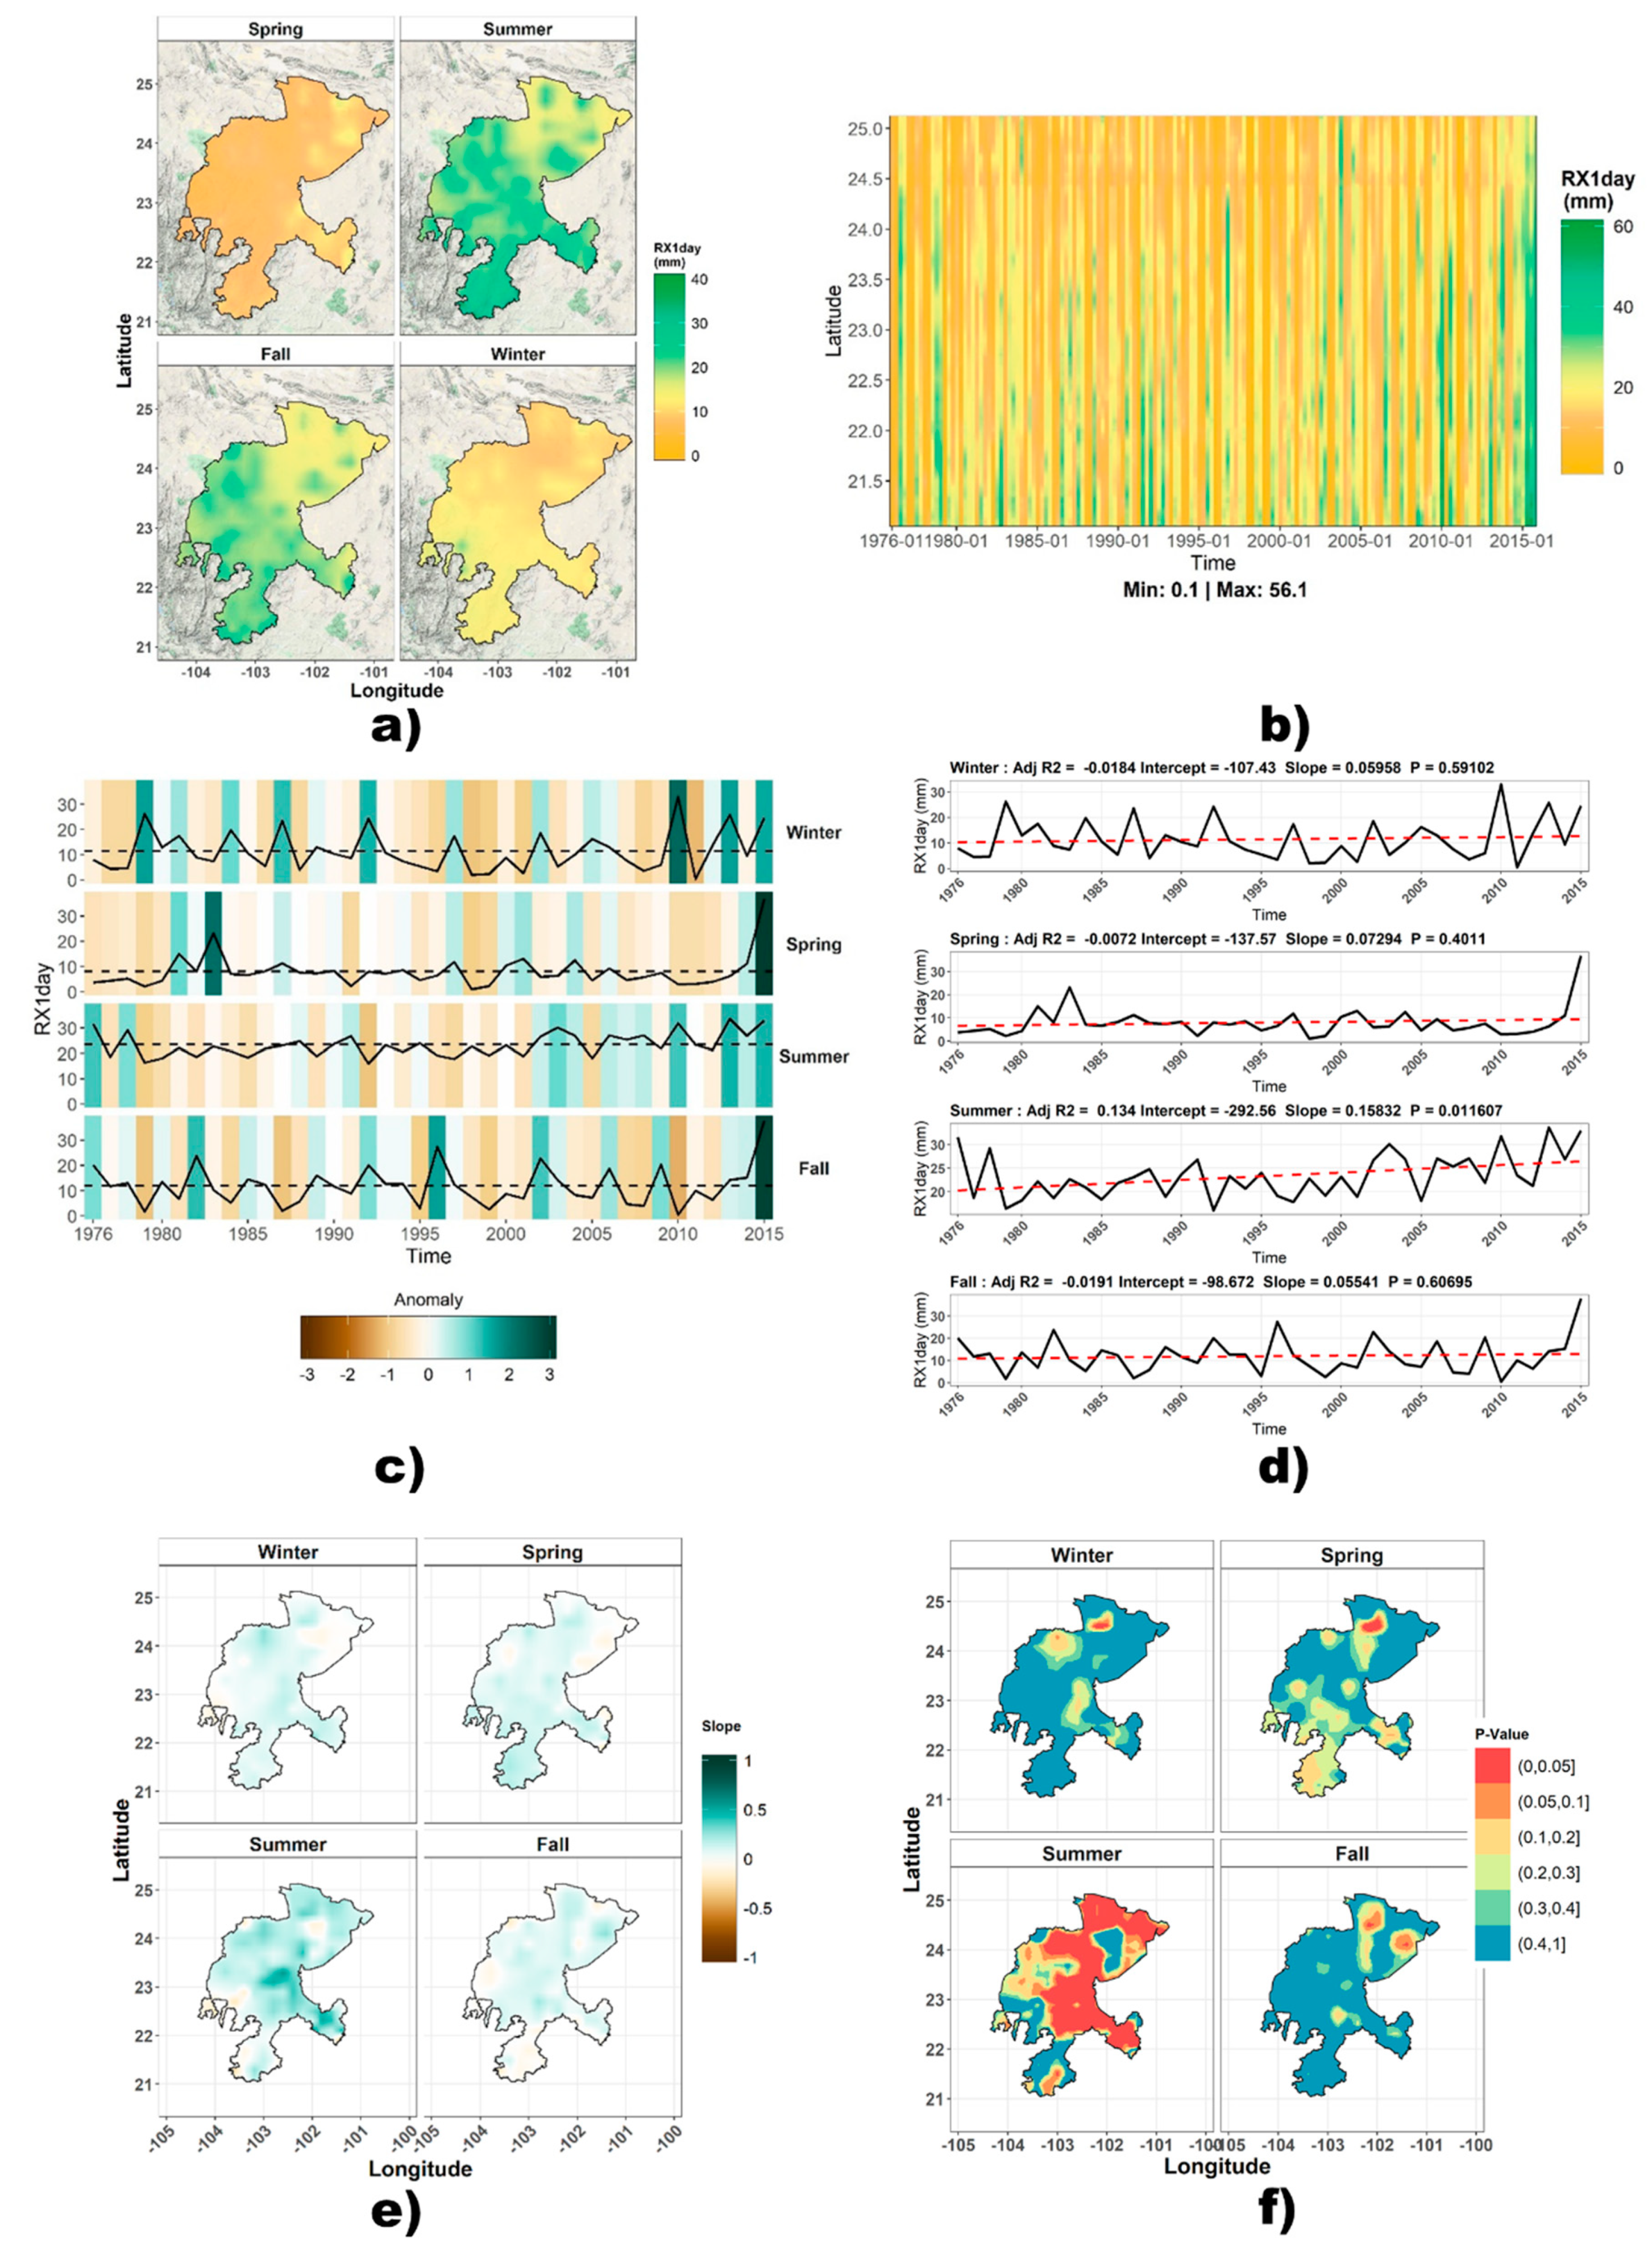
7 Daily maximum precipitation (Rx1day)
Where
is total precipitation on day
in period
, the maximum values of one day for period
are:
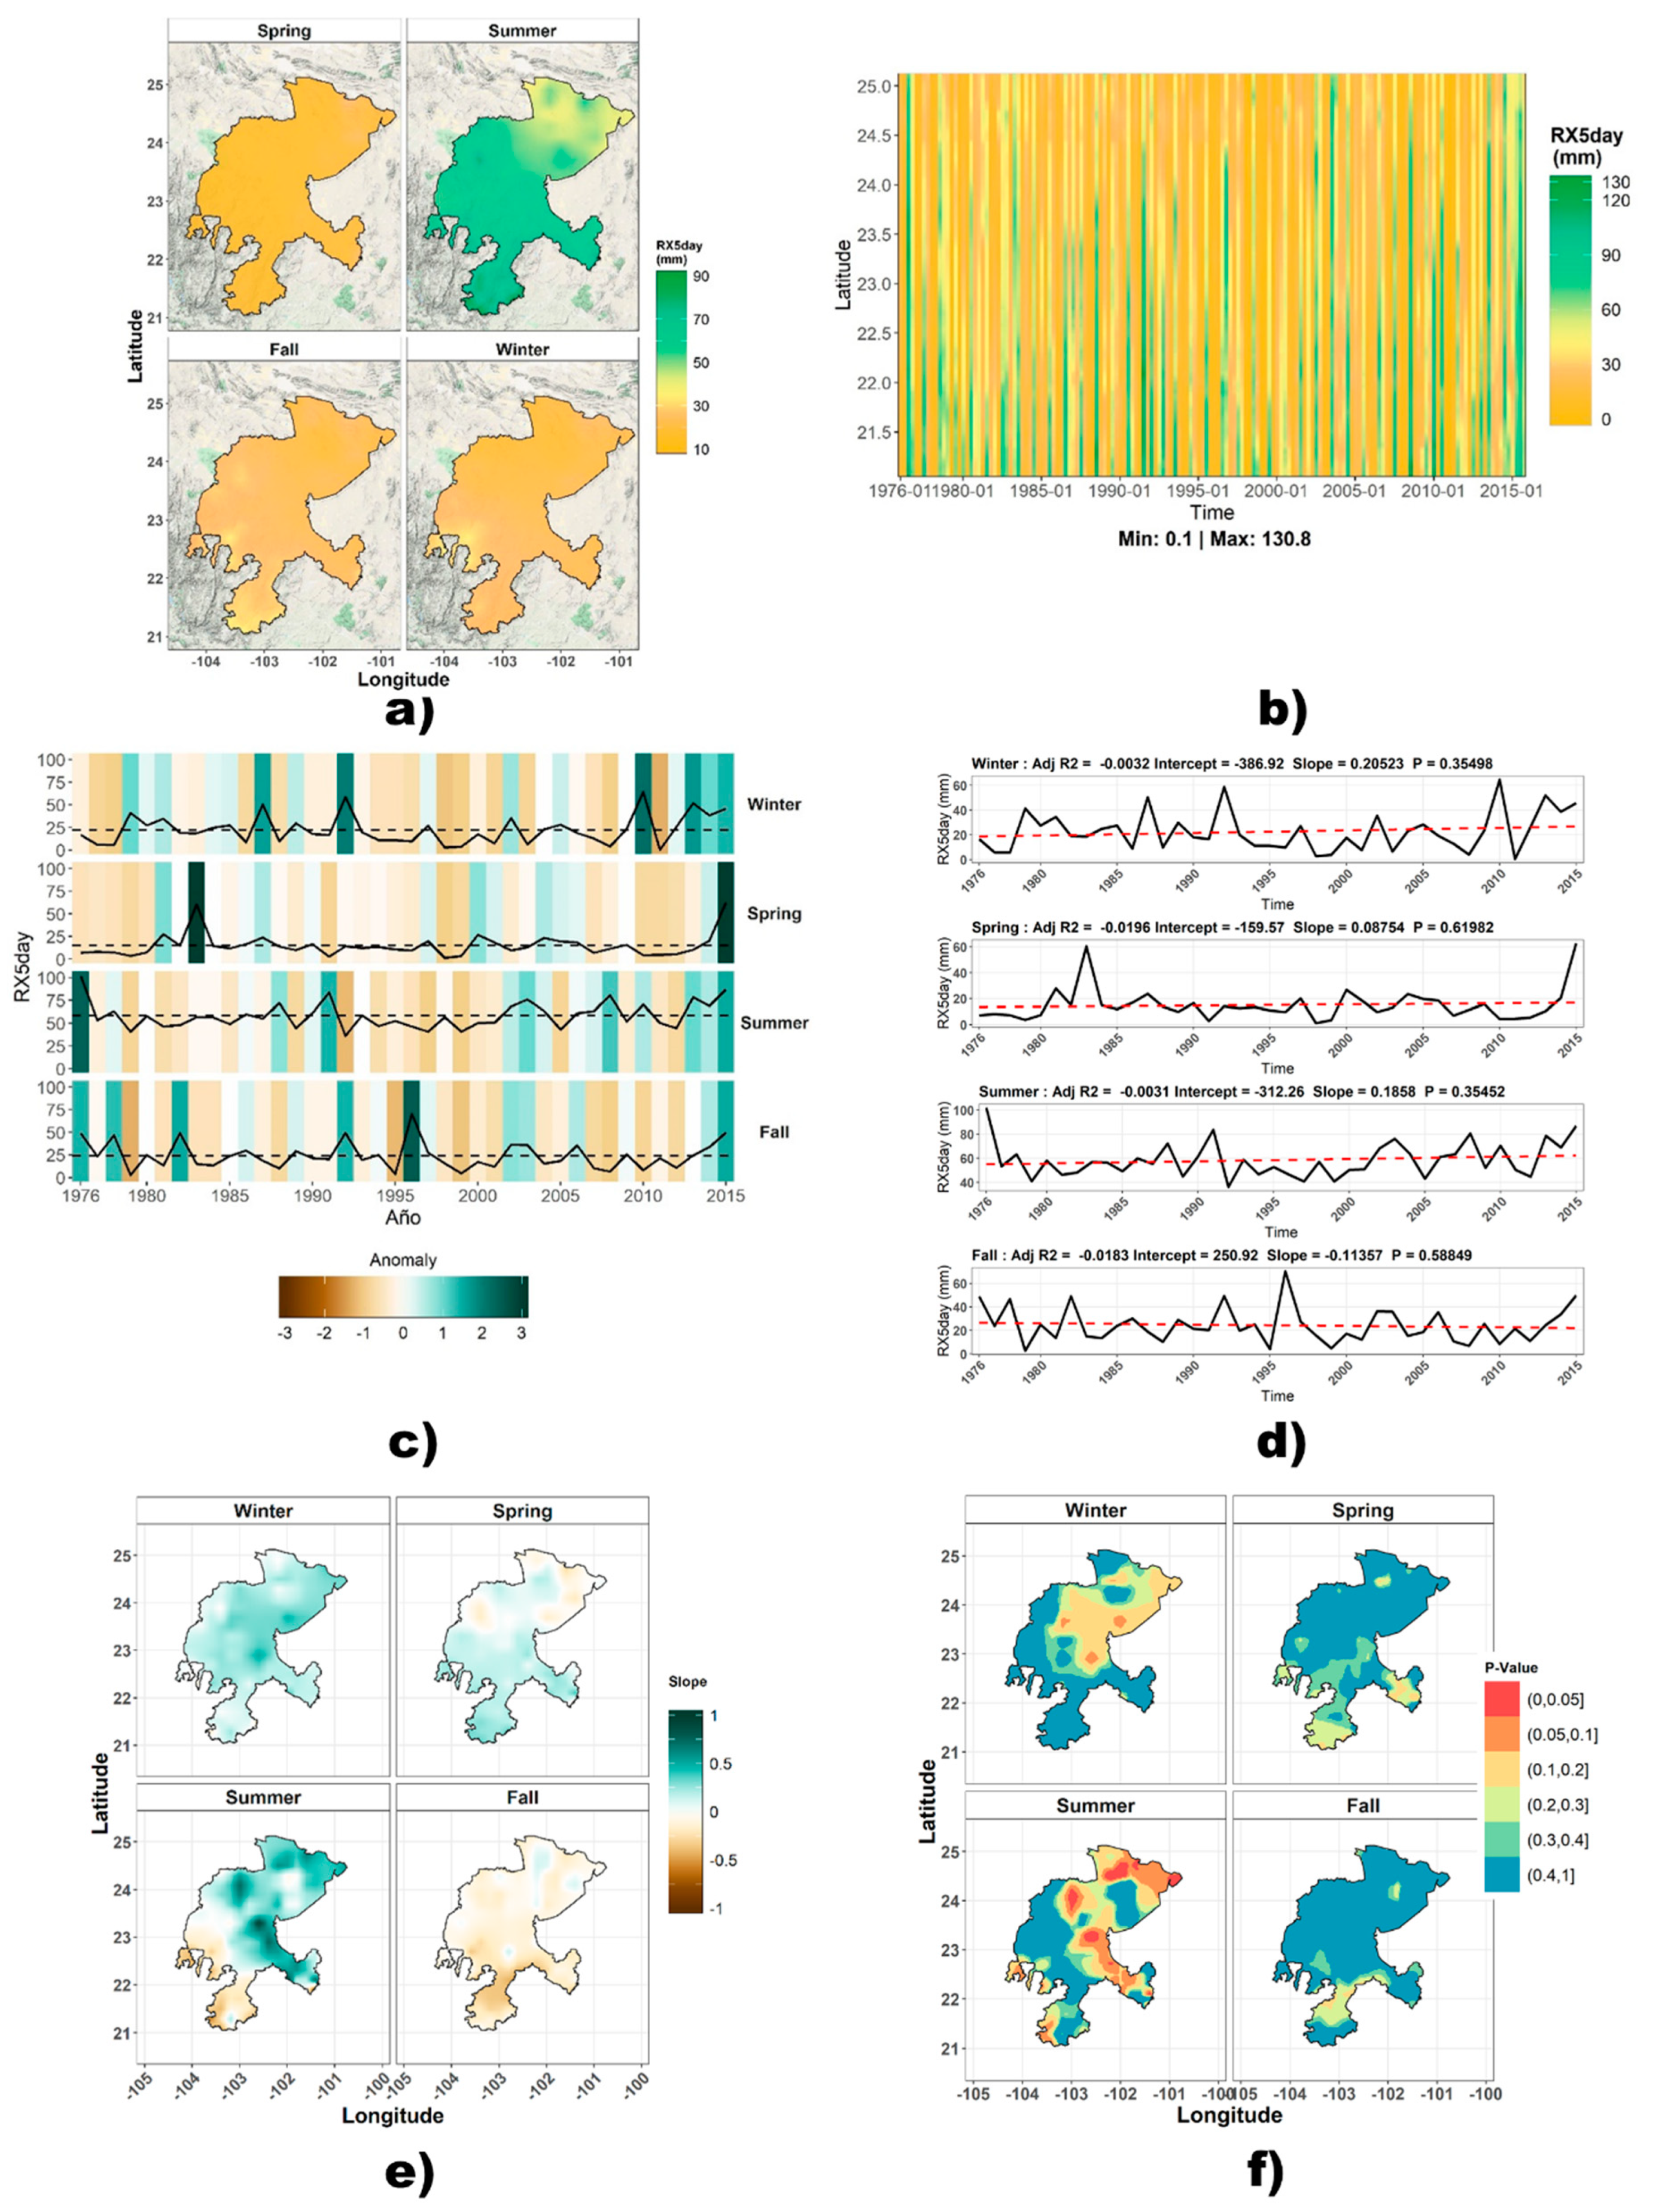
8 Maximum consecutive 5-day precipitation (Rx5day)
Where
is the amount of precipitation for the five-day interval ending in
, period
, the maximum 5-day values for period
are:
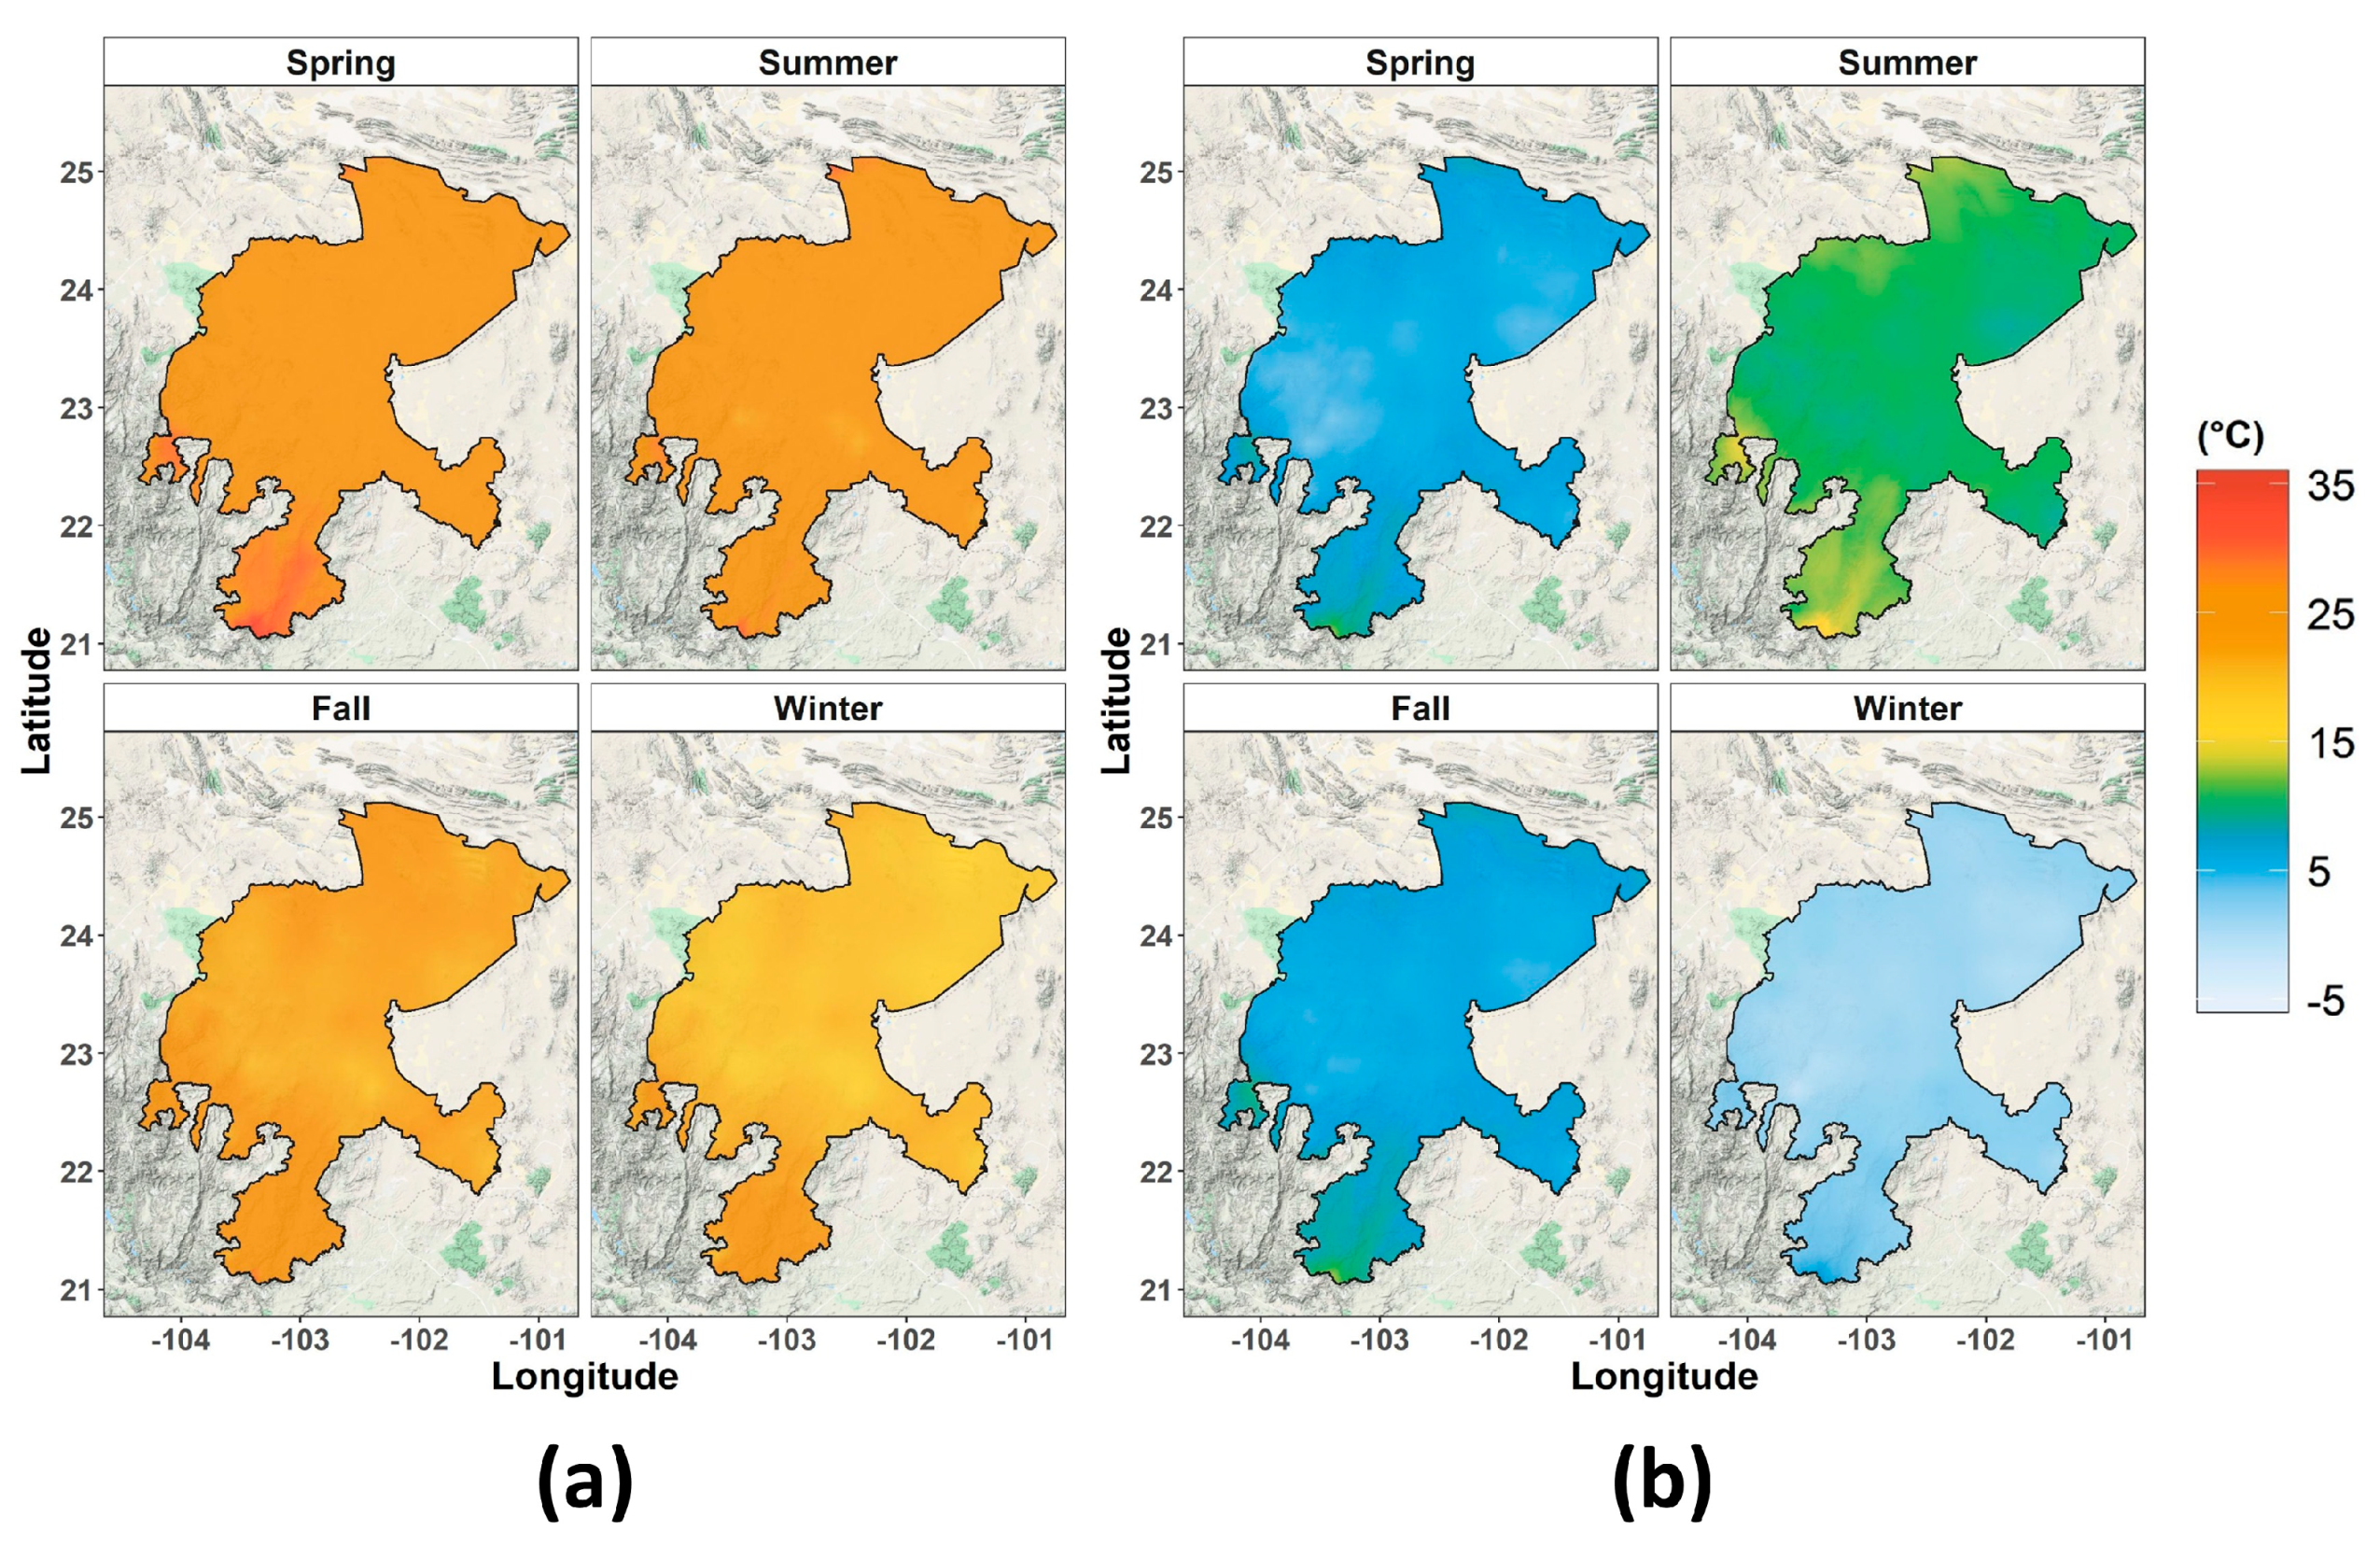
The ETCCDI has established indices based on monthly analyses (TXx, TNn, Rx1day, Rx5day, among others). In the present study, monthly series data were grouped into seasonal series (winter, spring, summer, and fall) to identify seasons responding to variations in climate change indices concerning their input variable. For indices TXx and TNn, the months of December, January, and February (DJF) corresponded to the winter; the months of March, April, and May (MAM) to the spring; the months of June, July, and August (JJA) to the summer, and the months of September, October, and November (SON) corresponded to the fall. Precipitation indices (Rx1day and Rx5day) used a different by-month grouping for the summer and fall seasons: the months of June, July, August, and September (JJAS) corresponded to the summer, and only the months of October and November (ON) corresponded to the fall. This change was introduced with the purpose of analyzing time-related variations in precipitation patterns over the four-month period (JJAS), which accounts for approximately 80% of cumulative annual precipitation. Winter and spring months were grouped as in the case of the temperature indices (DEF and MMA).
2.6. Analysis of Indices using Hovmöller Diagrams
Hovmöller diagrams are used to represent the spatio-temporal evolution of a specific variable on two axes: time is plotted on the abscissa axis and latitude on the ordinate axis [
59]. Results were also analyzed using warming stripes diagrams [
60], which depict the time series and its standardized anomaly in the form of colored bars; these diagrams help to discern normal values from unusual values. Standardized anomalies (
X) are defined as the difference between the recorded value (x) and the mean of the data (
) divided by the standard deviation of data (σ). These are dimensionless numbers; when their value is 0, they are equivalent to the mean, and when their value is 1, they are equivalent to the standard deviation of the data:
2.7. Trend Analysis by Mann–Kendall Non-parametric Rank Correlation Tests
These tests identify the presence of changes and describe whether such trends are statistically significant [
61]. The level to accept a change as statistically significant was established at
. Values for
below this parameter were considered to be statistically significant.
The R package greenbrown is a collection of functions that can be used to analyze trends, changes in trends, and phenological events (e.g., satellite observations or climate model simulations) in time series organized as a grid [
62,
63]. The present study used this algorithm to understand trends and values
of indices calculated from homogenized grids.
It is important to mention that the trends could be affected if serial autocorrelation is present in the time series. However, we assumed the absence of autocorrelation in the analyzed time series, although this should be verified in future studies.
4. Discussion
The results of the present study provide evidence of changing climate over the past decades. Our results confirm those reported by [
64], who describe statistically significant positive trends in maximum temperature measured by weather stations in the state of Zacatecas and indicate that eight weather stations measured a decreasing trend in minimum temperature. Therefore, thermal oscillation amplitude has increased in the study region. Additionally, a study by [
67] presents results in which maximum temperature was observed to increase in the southeast, and minimum temperature was found to decrease in the south and north regions. The behavior of these two variables has also been observed in regions close to the study area, such as the neighboring state of Aguascalientes, where the authors of [
68] found a positive trend in maximum temperature and a negative trend in minimum temperature. Nation-wide research such as the study by [
41] reports on a trend of increased number of summer days, increased extreme maximum temperature, and lower extreme minimum temperature. Similar studies focused on Zacatecas and other Mexican states confirm the increase in maximum temperature; however, the same result is not true with respect to minimum temperature, since an increasing trend in minimum temperature has also been found in parts of Chihuahua, Veracruz, Chiapas, and Zacatecas [
37,
38,
39,
40,
65,
66]. Trends are therefore observed to vary depending on geographical location, time of the year, and type of temperature (maximum or minimum) [
68]; these results are not unlike other findings from studies throughout the globe and are evidence that local and regional trends can be representative of planetary climate [
64]. Concerning precipitation, the results obtained in the present study were closely related to other investigations [
72,
74,
76] in which precipitation patterns were found to be largely due to oscillations such as PDO and ENSO. Different regions in the center and north of the country present positive precipitation trends, but their statistical significance is very low, and studies such as [
40,
41] and [
77] show that certain areas in northern Mexico have become more humid over the past decades. On the other hand, in states such as Chiapas and Veracruz, located in the country’s south, research [
36,
37,
38,
39] has reported decreasing precipitation trends, with values of zero precipitation in some cases. The changes in precipitation patterns in Mexico are an expression of adverse conditions that can be detrimental to agricultural activities; in recent years, even though precipitation is not expected to decrease, rainy days have become fewer but more intense, and warmer conditions prevail, which can have a severe impact on rainfed crop production.
5. Conclusions
Changes in the extreme values of variables such as temperature and precipitation in the state of Zacatecas were identified using observations of climate change indices and standardized anomalies, and the trends of these indices were analyzed. In the case of maximum temperature, the identified changes highlight an increase in the number of summer days and higher extreme maximum temperatures, especially in the spring and summer. Changes in minimum temperature suggest a cooling process in the fall and winter, especially since the number of frost days was observed to increase over the last 20 years of the study period, and the minimum extreme temperature decreased considerably in these two seasons. The analyzed trends and their statistical significance show that, as pointed out by the IPCC [
73], maximum temperature will likely continue to increase, and minimum temperature values will become more extreme. In view of these maximum and minimum temperature trends, a study by [
67] indicates that the clear skies in the study region allow for a high degree of heat absorption by the surface. The increased clarity of the skies at night could also explain the decreasing trend of minimum temperature as a result of the loss of heat via radiation. In the same study [
67], the authors hypothesize that certain atmospheric phenomena in parts of Zacatecas, such as the north, can be explained by opposite conditions, such as cloudy skies and dry and warm conditions, which are more frequent in the south due to its higher pressure, and humid and temperate conditions in the northern region, resulting from low pressures.
In the case of precipitation, recent studies [
72,
74,
75] have shown that rainfall is influenced by low-frequency oscillations such as the PDO and ENSO; due to its geographical location, Zacatecas is located between these two oscillations, both of which are closely related to precipitation behavior in most of the Mexican territory. PDO affects winter precipitation, whereas ENSO affects summer precipitation [
72] and is associated with dry and wet years. Although precipitation trends were found to increase, the possibility of moisture events occurring in the near future is uncertain. Nevertheless, the increased frequency of drought and humidity events in the following years cannot be ruled out, as can be inferred from the last five years of the analysis, when the most extreme events of drought (2011) and humidity (2015) were measured. Future research should address the influence of low frequency oscillations to determine whether these variations are due to climate change.
The possible impact of temperature changes and irregular precipitation would certainly impact the agricultural sector and adversely affect the state of Zacatecas, the country’s main producer of rainfed bean. The increases in overall temperature, frequency of frosts, precipitation accumulated over five days in the summer (JJAS), as well as the increase in consecutive dry days could affect the phenological cycle of the crops, increasing the risk of losing production and compromising food safety [
76]. The most important short-term problem will be the difficulty of adapting to these fast-paced changes in the face of a new climate scenario, which will pose new challenges in the future.
