Article

Performance Evaluation of Satellite-Based Rainfall Products over Nigeria

by
Kingsley N. Ogbu
1,*,†,
Nina Rholan Hounguè
2,
Imoleayo E. Gbode
3 and
Bernhard Tischbein
1
1
Center for Development Research, University of Bonn, Genscherallee 3, D-53113 Bonn, Germany
2
Geography Institute, University of Bonn, Meckenheimer Allee 166, 53115 Bonn, Germany
3
Department of Meteorology and Climate Science, Federal University of Technology, 340252 Akure, Nigeria
*
Author to whom correspondence should be addressed.
Current address: Department of Agricultural and Bioresources Engineering, Faculty of Engineering, Nnamdi Azikiwe University, 420221 Awka, Nigeria.
Climate 2020, 8(10), 103; https://doi.org/10.3390/cli8100103
Submission received: 15 August 2020 / Revised: 20 September 2020 / Accepted: 22 September 2020 / Published: 24 September 2020
(This article belongs to the Section Climate and Environment)

Abstract

:
Understanding the variability of rainfall is important for sustaining rain-dependent agriculture and driving the local economy of Nigeria. Paucity and inadequate rain gauge network across Nigeria has made satellite-based rainfall products (SRPs), which offer a complete spatial and consistent temporal coverage, a better alternative. However, the accuracy of these products must be ascertained before use in water resource developments and planning. In this study, the performances of Climate Hazards Group Infrared Precipitation with Station data (CHIRPS), Precipitation estimation from Remotely Sensed Information using Artificial Neural Networks–Climate Data Record (PERSIANN-CDR), and Tropical Applications of Meteorology using SATellite data and ground-based observations (TAMSAT), were evaluated to investigate their ability to reproduce long term (1983–2013) observed rainfall characteristics derived from twenty-four (24) gauges in Nigeria. Results show that all products performed well in terms of capturing the observed annual cycle and spatial trends in all selected stations. Statistical evaluation of the SRPs performance show that CHIRPS agree more with observations in all climatic zones by reproducing the local rainfall characteristics. The performance of PERSIANN and TAMSAT, however, varies with season and across the climatic zones. Findings from this study highlight the benefits of using SRPs to augment or fill gaps in the distribution of local rainfall data, which is critical for water resources planning, agricultural development, and policy making.

1. Introduction

Over the last decades, occurrences of hydrologic extremes, such as flooding and droughts, have increased, as a result of human-induced climate change in West Africa. These impacts have led to tremendous socioeconomic losses in already vulnerable communities, and, most often, resulted in the deaths of human beings and livestock [1,2]. The economies of local agrarian communities have largely been affected because of their dependence on rain-fed agriculture [3,4]. Sustaining water resources development for improved agricultural production under varying climatic conditions and extreme climatic events has proved more challenging due to paucity of recorded climate data [5]. Consequently, sparse gauge networks do not allow for realistic temporal and spatial climate characteristics, as is evident in scientific literature from this region. Funding issues and lack of serious efforts have limited installation and maintenance of adequate gauge networks below the standard recommended by the World Meteorological Organization [6].
The advent of satellite and remote sensing technologies has resulted in the availability of high quality satellite-based rainfall products. Its use and applications is beginning to gain popularity in Africa due to scarcity of ground-based climate stations [7]. These authors noted that several limitations inherent in the use of rain gauge data, including incomplete datasets, lack of spatial and temporal representation, have made satellite-based rainfall data more attractive, especially in un-gauged regions. Studies [4,7,8] in many parts of Africa have shown that these products can reproduce local rainfall characteristics and could be an alternative in areas with paucity of observed weather records. However, there is still need to properly evaluate these products across different climatic situations to ascertain their accuracy and to provide valuable results to end-users and model developers.
In 1997, the Tropical Rainfall Measuring Mission (TRMM), jointly established by the National Aeronautics and Space Administration (NASA) and the Japan Aerospace Exploration Agency (JAXA) became the first-generation satellite rainfall product [9]. The Climate Hazards Group InfraRed Precipitation with Station data (CHIRPS) [10], Precipitation Estimation from Remotely Sensed Information using Artificial Neural Networks–Climate Data Record (PERSIANN-CDR) [11] and Tropical Applications of Meteorology Using SATellite and ground-based observations (TAMSAT) [12,13] were modified from the TRMM and other satellite rainfall missions to deliver rainfall estimates with high spatial and temporal resolution and quality. The recent rainfall estimates from CHIRPS, PERSIANN, and TAMSAT consist of rainfall datasets from the early 1980s to the present; covering a larger time period than the first generation satellite rainfall products. Satellite-based rainfall estimates are obtained though indirect measurements from microwave (MW) or infrared (IR) radiation, from low-orbiting and geostationary satellites, respectively [14]. The MW approach uses an empirical relationship to directly detect atmospheric liquid water content by penetrating clouds, while the IR method utilizes an indirect relationship to estimate atmospheric liquid water content from the top of the cloud temperature [14,15]. These authors noted that most satellite-based rainfall products combine MW and IR approaches in others to reduce their inherent limitations, and to produce representative results, which are highly acceptable for applications in hydrologic modeling and drought simulations. The satellite rainfall products considered in this study produce rainfall estimates using a combination of both MW and IR approaches.
Recently, there has been an increase in the assessment of the quality of gridded rainfall datasets in Africa. Larbi et al. [16] evaluated the ability of the CHIRPS gridded rainfall data in reproducing the climatology of the Vea Catchment in Ghana. In Burkina Faso, a study [1] investigated the performance of CHIPRS, PERSIANN, TAMSAT, TRMM, Africa Rainfall estimate Climatology (ARC 2.0), African Rainfall Estimation (RFE 2.0), and African Rainfall Climatology, and Time-Series using synoptic station data for the period 2001–2014. Due to the high uncertainty associated with these interpolated datasets, it is important to evaluate the characteristics and pattern of the satellite rainfall datasets at the local scale [17]. The mean annual and seasonal rain cycle is necessary to check the performance of gridded datasets in estimating the amount of rainfall [1]. Information on the standardized precipitation index (SPI) is used to assess the frequency of wet and dry days and is important for water resources management [16,17]. The trend analysis of rainfall is important to understand its pattern in the past and to be able to infer future patterns.
Over the years, there has been a reduction in the number of ground-based meteorological stations in Sub-Saharan Africa due to political and financial instability [4,18]. In Nigeria, 70% of the total number of rain gauges within the River Niger basin became non-functional between 1985 and 2004 [19]. This deterioration of existing gauge networks also exist in other parts of the country and poses severe challenge to water resources development and climate change research in Africa’s most populous nation. The use of remotely sensed rainfall data is beginning to gain popularity to either supplement existing (or replace missing) climate data, and/or support solving water resource-related problems and policy making. However, studies showing which satellite-based rainfall products best suit the heterogeneous topography and multi-climate regions of Nigeria are still lacking in literature. Local evaluation of remotely sensed-data is necessary before utilization by government agencies because of their inherent uncertainties and limitations, especially in developing countries riddled with paucity of ground-truth data for adequate calibration and bias reductions [7,14]. Few studies [4,7,17] have attempted to validate the capability of some satellite-based rainfall products in Nigeria. However, these studies are region-specific with no study in literature showcasing satellite rainfall evaluation over the whole of Nigeria stretching over different climatic settings. In the northeastern part of Nigeria, the ability of satellite rainfall products to reproduce rainfall trends from 1981–2015 showed satisfactory results at decadal, monthly, and seasonal time scale [4]. In southwestern Nigeria, comparison of satellite and observed rainfall datasets from 1998 to 2016 also gave encouraging results [7]. However, owing to the inadequate state of climate gauge networks in Nigeria, assessing the performances of many of the existing satellite rainfall products for Nigerian conditions are lacking grossly in literature.
This study attempts to complement to the aforementioned few studies on satellite rainfall products evaluation in Nigeria by evaluating the performance of three products using twenty-four (24) ground-based stations located all over Nigeria. The selected products were based on rainfall datasets, which use a combination of MW and IR methods, and bias- corrected with rain gauge data. The objective of this study is to evaluate the capability of three satellite rainfall products (CHIRPS, PERSIANN–CDR, and TAMSAT) to reproduce local rainfall characteristic (seasonal and annual climatology) in Nigeria. We also aim to assess the utility of the gridded datasets in reproducing inter-annual variability of rainfall for the period 1983–2013. The Pearson coefficient of correlation (r), root mean square error (RMSE), and percent bias (PBIAS) were used to evaluate the performance of these satellite products over Nigeria. The remaining part of this study is structured as follows: Section 2 describes the data and methods, the findings are presented and discussed in Section 3, and the conclusions are made in Section 4.

2. Materials and Methods

Nigeria, the most populous country in West Africa has a land area of about 923,770 km2 and is situated between Latitudes 4°–14° N and Longitudes 4°–14° E, as shown in Figure 1. The widely varying climatic pattern experienced in Nigeria is partly influenced by the presence of the Atlantic Ocean to the southern part, and the Sahara Desert to the northern part [20]. The climate pattern is also affected by distinct relief systems, such as lowlands, highlands, and plateau, as depicted in Figure 1. The major climatic zones divided latitudinally are Guinea (4°–8° N), Savannah (8°–11° N), and Sahel (11°–14° N) [21]. The spatial variability of Nigeria’s climate is greatly influenced by the movement of the Inter-tropical Discontinuity (ITD), a narrow zone of trade-wind confluence between the southwest trade wind from the Atlantic Ocean and northeast trade wind from the Sahara Desert [22].
The Guinea region experiences a mean annual rainfall of about 1575–2533 mm, and the Savannah region is characterized by a mean annual rainfall of about 897–1535 mm while the Sahel region receives a mean annual rainfall of about 434–969 mm [23]. These authors noted that the Guinea and Savannah regions are characterized by a bimodal rainy season as a result of the abrupt non-linear latitudinal shift of rainfall band from a quasi-stationary position of 5° N to about 10° N. This process paves the way for the unimodal rainy season in Sahel during the period June–October, with the climatological peak in August. The Guinea and Savannah regions experience rainy seasons during March–May (MAM), June–August (JJA), and September–November (SON) seasons while the Sahel is majorly characterized by a peak rainfall during the July–August (JAS) season. However, all of the regions experience wide spread rainfall events during the period June–September (JJAS) as a result of more active convective activities that accompany the deep monsoon flow defined by the northward migration and surface position of the ITD.

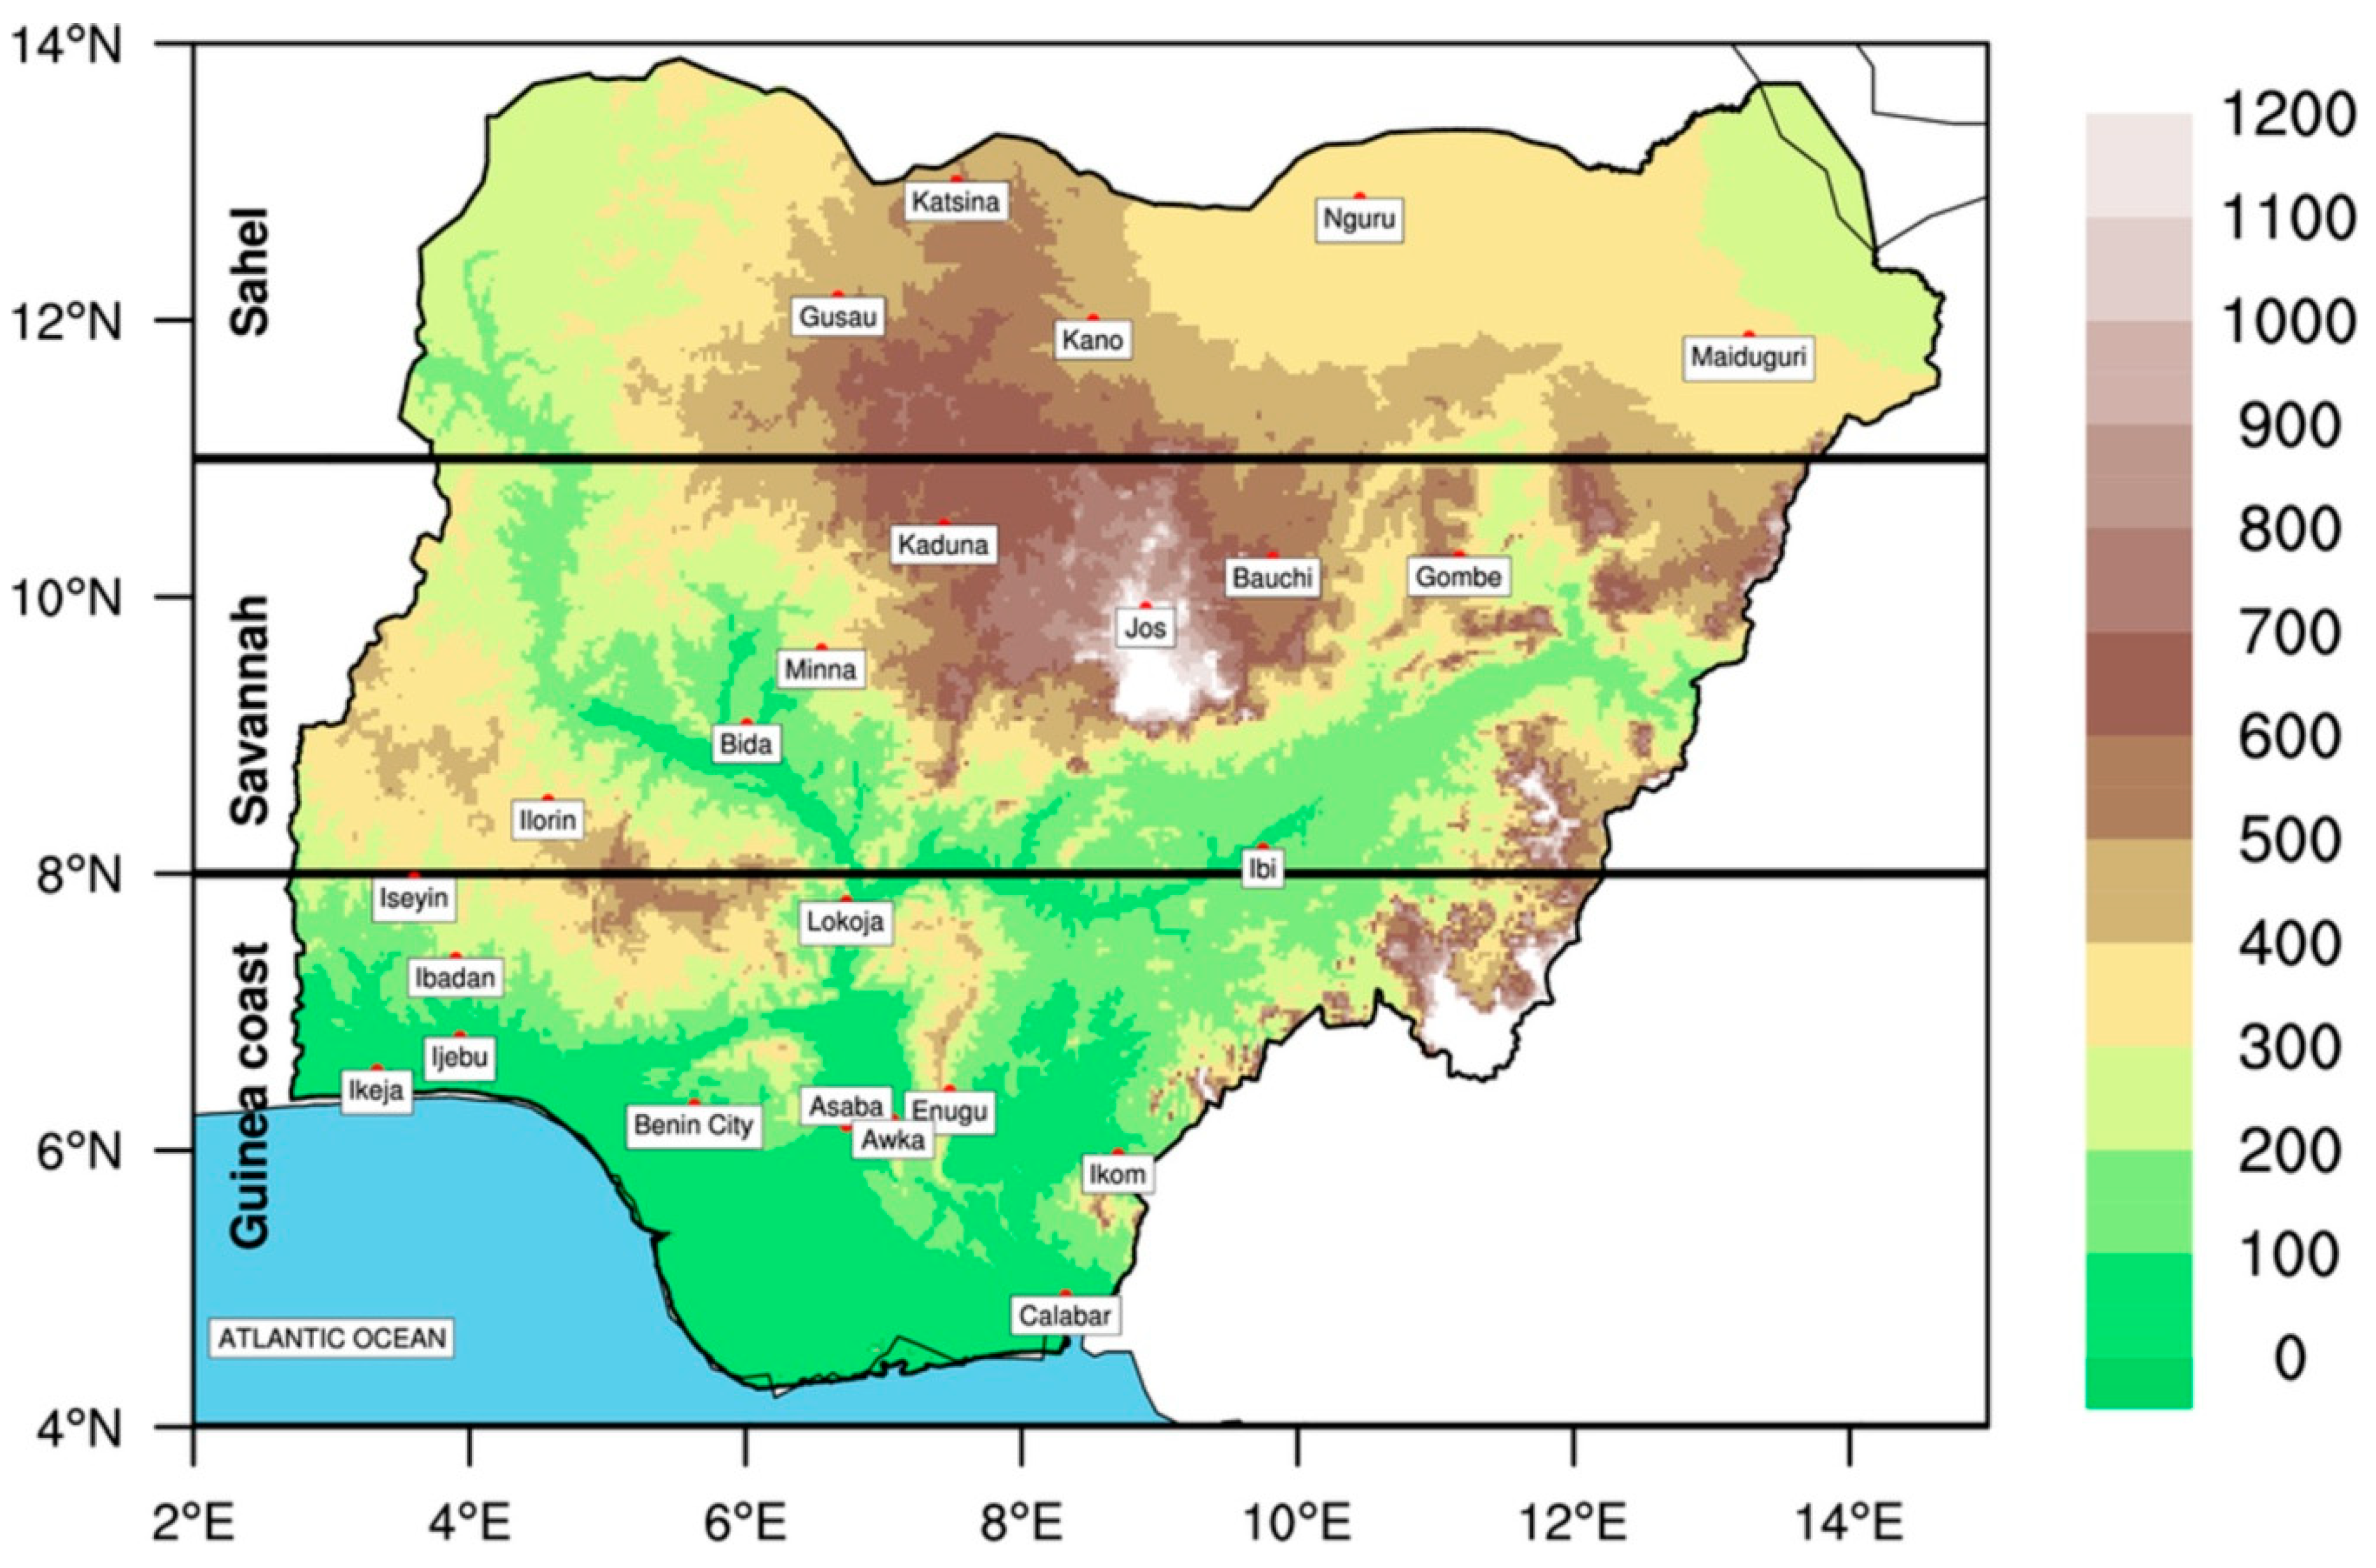
2.1. Rainfall Data Description

2.1.1. Gauge Rainfall

This study used twenty-four (24) synoptic rainfall stations distributed across Nigeria as shown in Figure 1 and Table 1. Daily observed rainfall data for the period 1983–2013 for these synoptic stations, located across the three climatic regions, were obtained from the database of the Nigeria Meteorological Agency (NiMet) and used for evaluating the performance of the satellite rainfall products. However, the climatic stations are not evenly distributed within the three climatic zones. Five stations are found within the Sahel, eight stations within the savannah, while eleven stations are located within the Guinea climatic zone. The altitudes of the stations vary from about 40 m to 1160 m above sea level [23].

2.1.2. Satellite Rainfall

The advent of satellite observing platforms in the late twentieth century has brought lots of benefits by providing more spatially complete datasets that helps to advance our knowledge in atmospheric science and other environmental-related disciplines. Improved spatiotemporal resolution of satellite rainfall products is useful as input in hydrologic modeling, especially in developing nations and data-scarce regions such as Nigeria. Table 2 shows an overview of the three gridded satellite rainfall products, which are freely available on the internet, and were assessed against gauged rainfall data in this study. These three (3) products under consideration in this study showed satisfactory results out of a total of ten (10) products, which were evaluated in a large-scale regional study in West Africa [24].
Climate Hazards Group InfraRed Precipitation with Station data (CHIRPS) data [10] was developed by scientists from the Climate Hazard Group at the University of California, Santa Barbara, in conjunction with the United States Geological Survey (USGS), specifically for monitoring droughts or to analyze shifts in rainfall in the data sparse African continent. Information on the data inputs used in developing CHIRPS is extensively reported on in literature [10].
Precipitation Estimation from Remotely Sensed Information using Artificial Neural Networks–Climate Data Record (PERSIANN–CDR; hereafter PERSIANN) was developed by the Center for Hydrometeorology and Remote Sensing group of the University of California, Irvine, in conjunction with National Oceanic and Atmospheric Administration (NOAA) [1].
Tropical Applications of Meteorology using SATellite data and ground based observations (TAMSAT) was developed at the University of Reading, and integrates about four thousand (4000) stations across Africa [24]. Information on its development is well documented in several studies [12,13].

2.2. Quality Control

Quality control and homogeneity tests were performed on all observed datasets using RClimDex and RHtestssoftware packages in a previous study by Gbode et al. [23]. Quality control was performed in other to remove erroneous values in the data series, such as negative rainfall values or days with daily rainfall values greater than 200 mm, and replaced with −999. A homogeneity test is important in order to correct anomalies that might result from a change in station location and faulty gauging equipment [25,26]. Quality control checks were also performed on all of the satellite rainfall datasets using RClimDex software. The permission to use this software package was obtained upon request from the model developers (http//:www.etccdi.pacificclimate.org). Missing and/or erroneous values within these data sets were replaced with −99 before use in this study.

2.3. Methodology

Daily rainfall data (1983–2013) were extracted from three satellite rainfall products using geographic coordinates of the twenty-four (24) synoptic stations (see Table 1) and processed for comparison with observed data. The satellite data were all extracted at grid points closest to the location of each synoptic station. The rainfall amounts were characterized into mean seasonal, annual, and inter-annual variations in order to evaluate how well the selected remotely sensed rainfall datasets reproduced observed rainfall characteristics from 1983 to 2013. Daily values were aggregated to monthly values for all datasets under study. Aggregated rainfall values for March–May (early rainfall season), June–August (mid rainfall season), and September–November (late rainfall season) were processed, and their mean determined to represent mean seasonal rainfall for the different seasons. Consequently, rainfall amounts for June–September were also aggregated and the mean for this period obtained to represent the JJAS season. The JJAS season is the only period in Nigeria when all climatic zones receive rainfall and it is highly influenced by the Intertropical Convergence Zone (ITCZ) oscillations.
Climatological and statistical evaluations of CHIRPS, PERSIANN, and TAMSAT were carried out against observed datasets. Spatial rainfall pattern representing seasonal climatology (MAM, JJA, and SON) of satellite products were assessed against observed datasets. Annual cycle and inter-annual variability for all locations (Figure 1) were also evaluated against observed (gauged) data. The ability of the satellite rainfall products to reproduce observed extreme events (wet and dry spells) at the selected twenty-four climate stations were evaluated using the standardized precipitation index (SPI) [27].The SPI is based on the probability of rainfall for a given time period and applied in hydro-meteorological studies for monitoring of drought conditions. The SPI is calculated by fitting a rainfall time series to a probability distribution, which is then normalized so that the mean SPI for that location is zero [27]. These authors further stated that positive SPI values implies greater than median rainfall while negative values signifies lower than median rainfall.
Comparison of monthly rainfall cumulative distribution frequency (CDF) for all satellite product datasets against gauged datasets were performed at all stations to evaluate their deviations from observed/gauged patterns. Furthermore, trend analysis was performed using the Mann–Kendall (MK) test statistic [28] to detect monotonic changes in the rainfall time series at 5% significance level. This statistic tests whether to accept that there is a monotonic trend (alternative hypothesis, Ha) or to reject the null hypothesis (Ho), which states that no trend is present in the time series data [29]. The MK statistic has been used extensively in hydro-meteorological studies [29,30,31] for analyzing monotonic changes in time series data. The MK statistic is stated as [30]:
S = n = 1 n j = i + 1 n S g n ( x j x i )
where, xj and xi are sequential data values; n is length of datasets. The Signum (Sgn) function is given as:
S g n ( x j x i ) = { 1   if   x j > x i 0   if   x j = x i 1   if   x j < x i
The statistics (S), the mean E(S), and the variance V(S) can be estimated as [29]:
E ( S ) = 0
V ( S ) = 1 18 { n ( n 1 ) ( 2 n 1 ) i 1 n t i [ ( t i 1 ) ( 2 t i + 5 ) ] }
where, ti is the extent of any given tie. The standardized test statistic, Z is stated as:
Z = { S 1 V ( S )   if   S > 0 0   if   S > 0 S + 1 V ( S )   if   S < 0
The remotely sensed rainfall datasets were validated for mean seasonal (for JJAS regime) and annual rainfall using the Pearson correlation coefficient (r), root mean square error (RMSE), and percent bias (PBIAS), and were presented by showing their spatial patterns. The equations representing these statistical models are shown below, as reported in other studies [1,24,32,33,34].
r = i = 1 n ( O i O ¯ ) ( M i M ¯ ) i = 1 n ( O i O ¯ ) 2 i = 1 n ( M i M ¯ ) 2
R M S E = 1 n i = 1 n ( M i O i ) 2
P B I A S = i = 1 n ( O i M i ) × ( 100 ) i = 1 n ( O i )
where, O and M are rain gauge and model values, respectively, O ¯ and M ¯ are mean rain gauge and model values respectively, n = number of data pairs, α = measure of flow variability error, β = bias term.
The spatial distribution of climate variables is important for understanding hydrological processes [35]. The inverse weighting distance (IDW) interpolation method was used in presenting spatial distribution of rainfall characteristics in this study. This method was adopted due to its popularity and wide applications in hydrology [36,37]. The IDW interpolation technique assumes that the weight between an observed point and unobserved point decreases exponentially as their distance increases. The characteristics of the interpolated cells were controlled by applying the variable search radius and adopting the default number of input points in the ArcMap window. The IDW function in ArcMap version 10.3 was used in this study and is implemented as follows [36]:
Y ( X o ) = i = 1 n λ i Y ( X i )
λ i = d i o P i = 1 n d i o P , i = 1 n λ i = 1
where, Y(Xo) = interpolated value at point Xo; Y(Xi) = observed value at point Xi; n = number of observations; λ = weight; P = power; dio = distance between unknown point and known point.

3. Results and Discussions

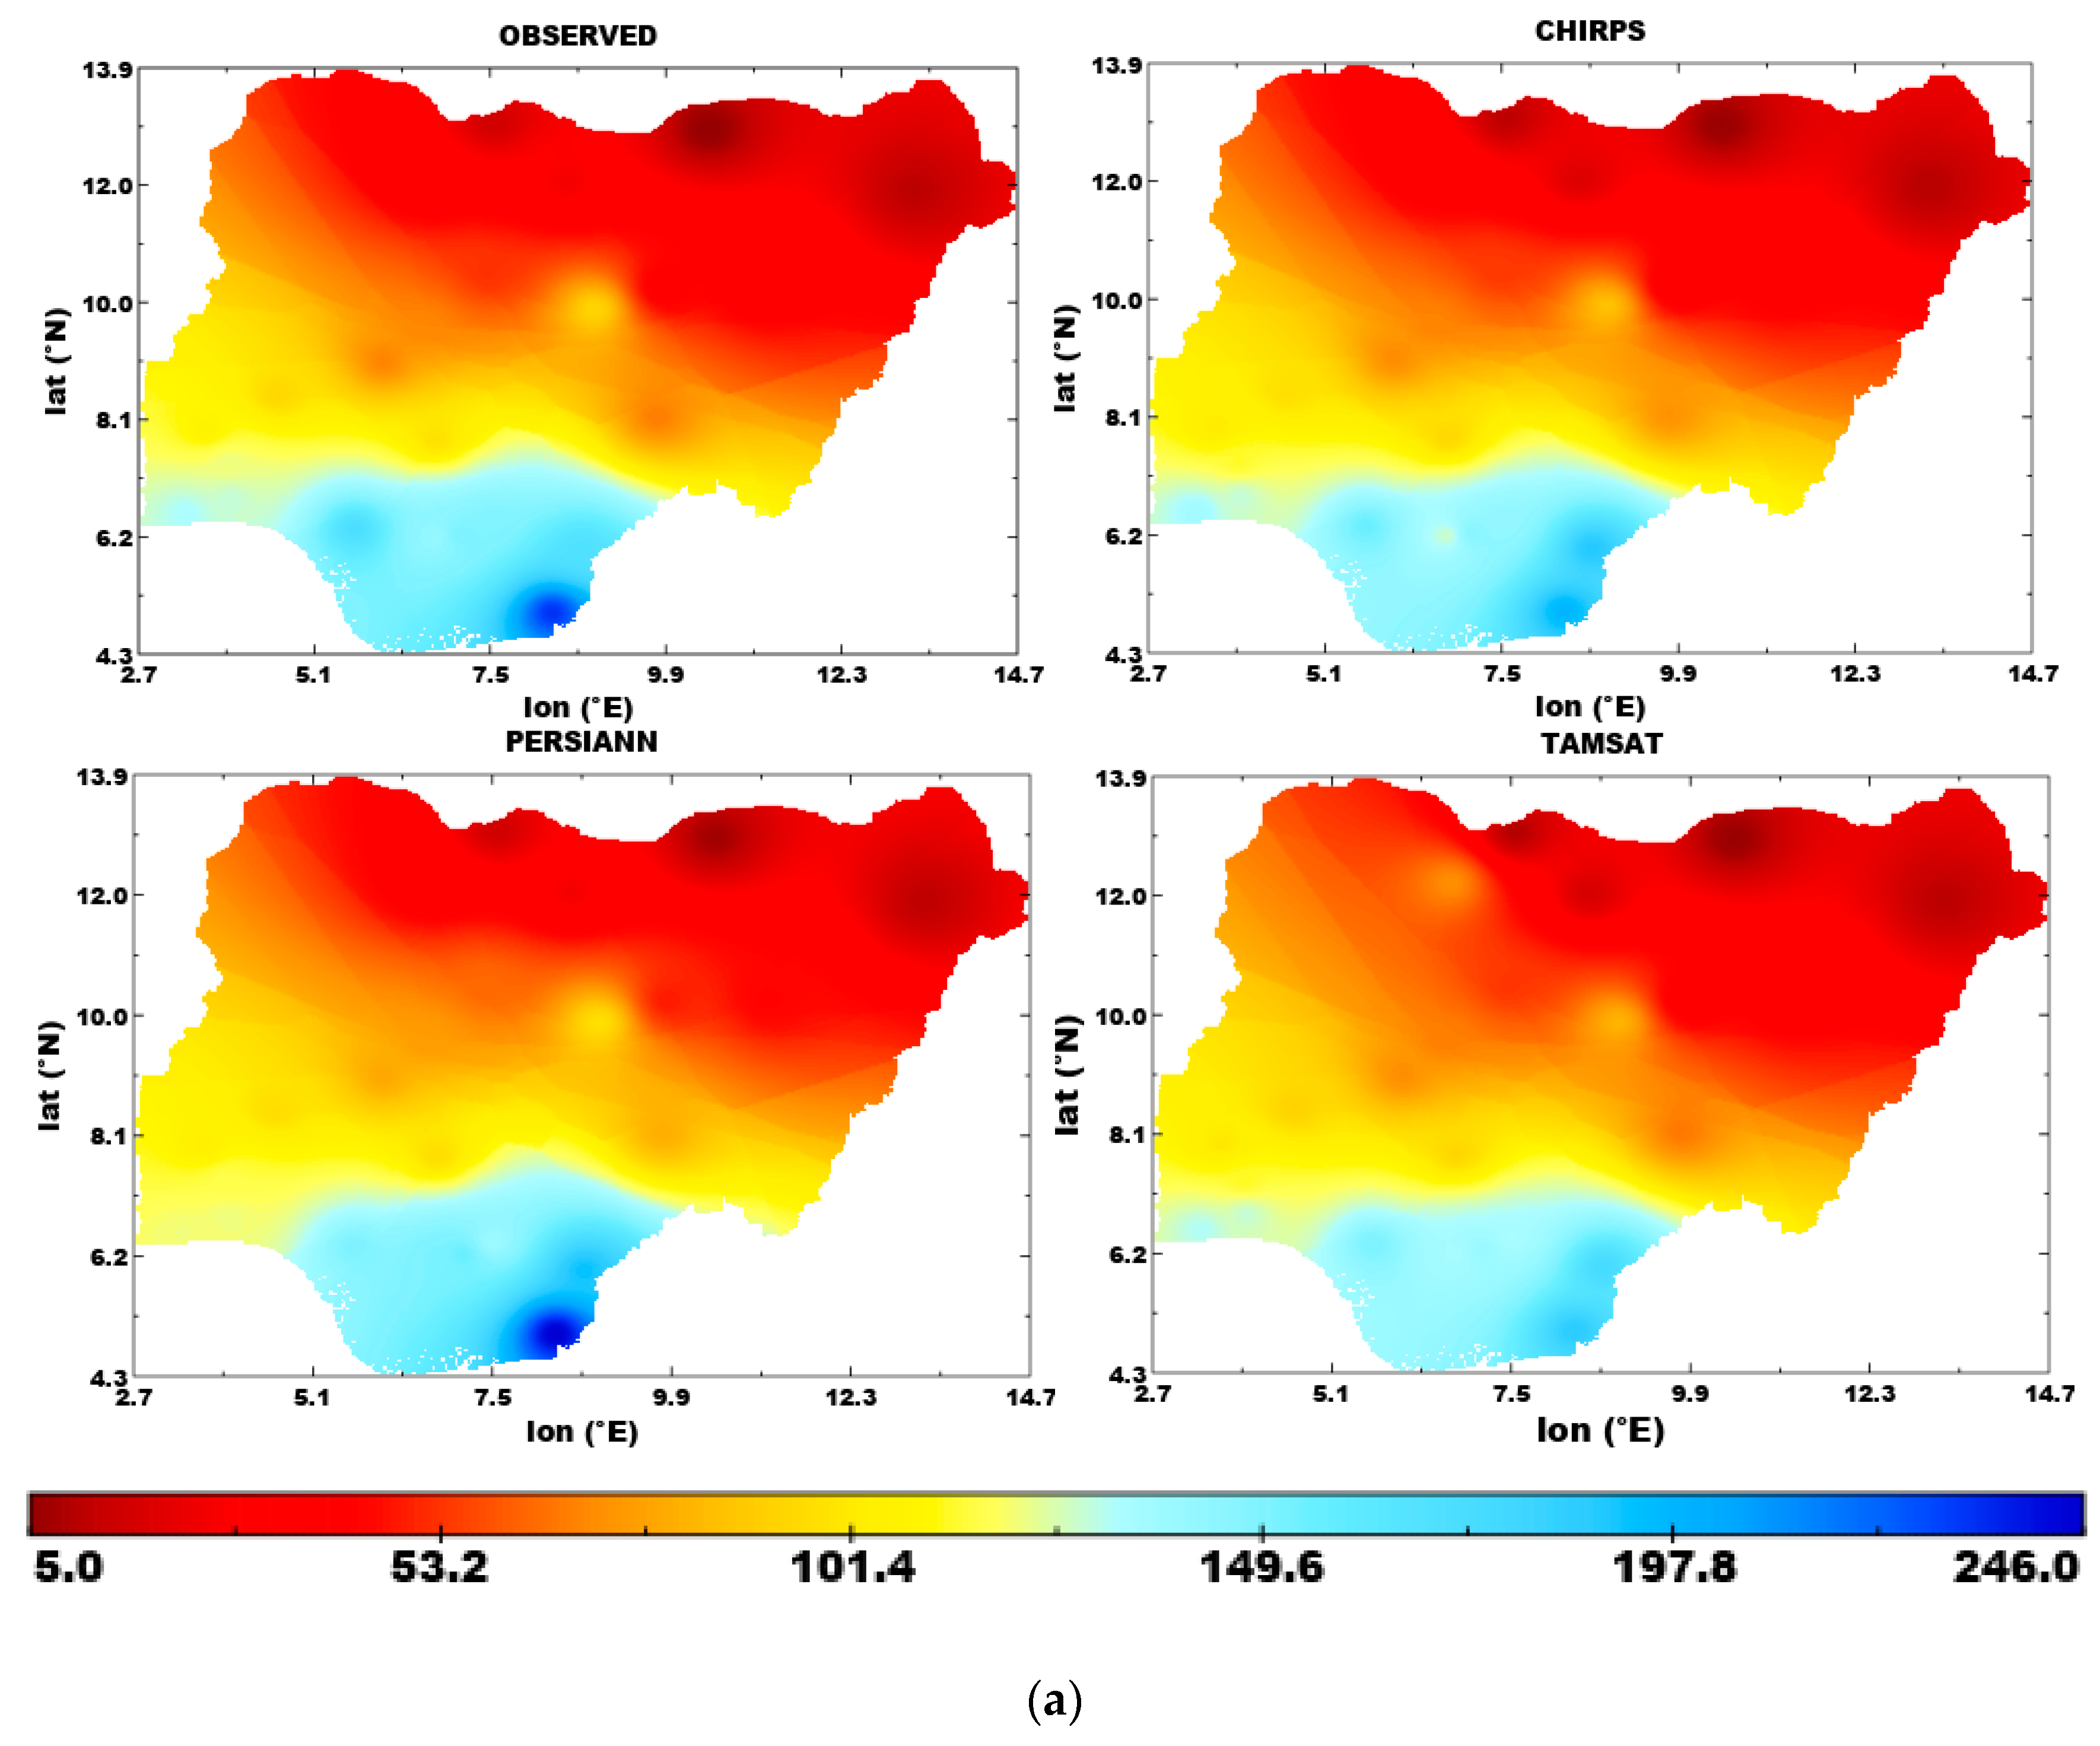
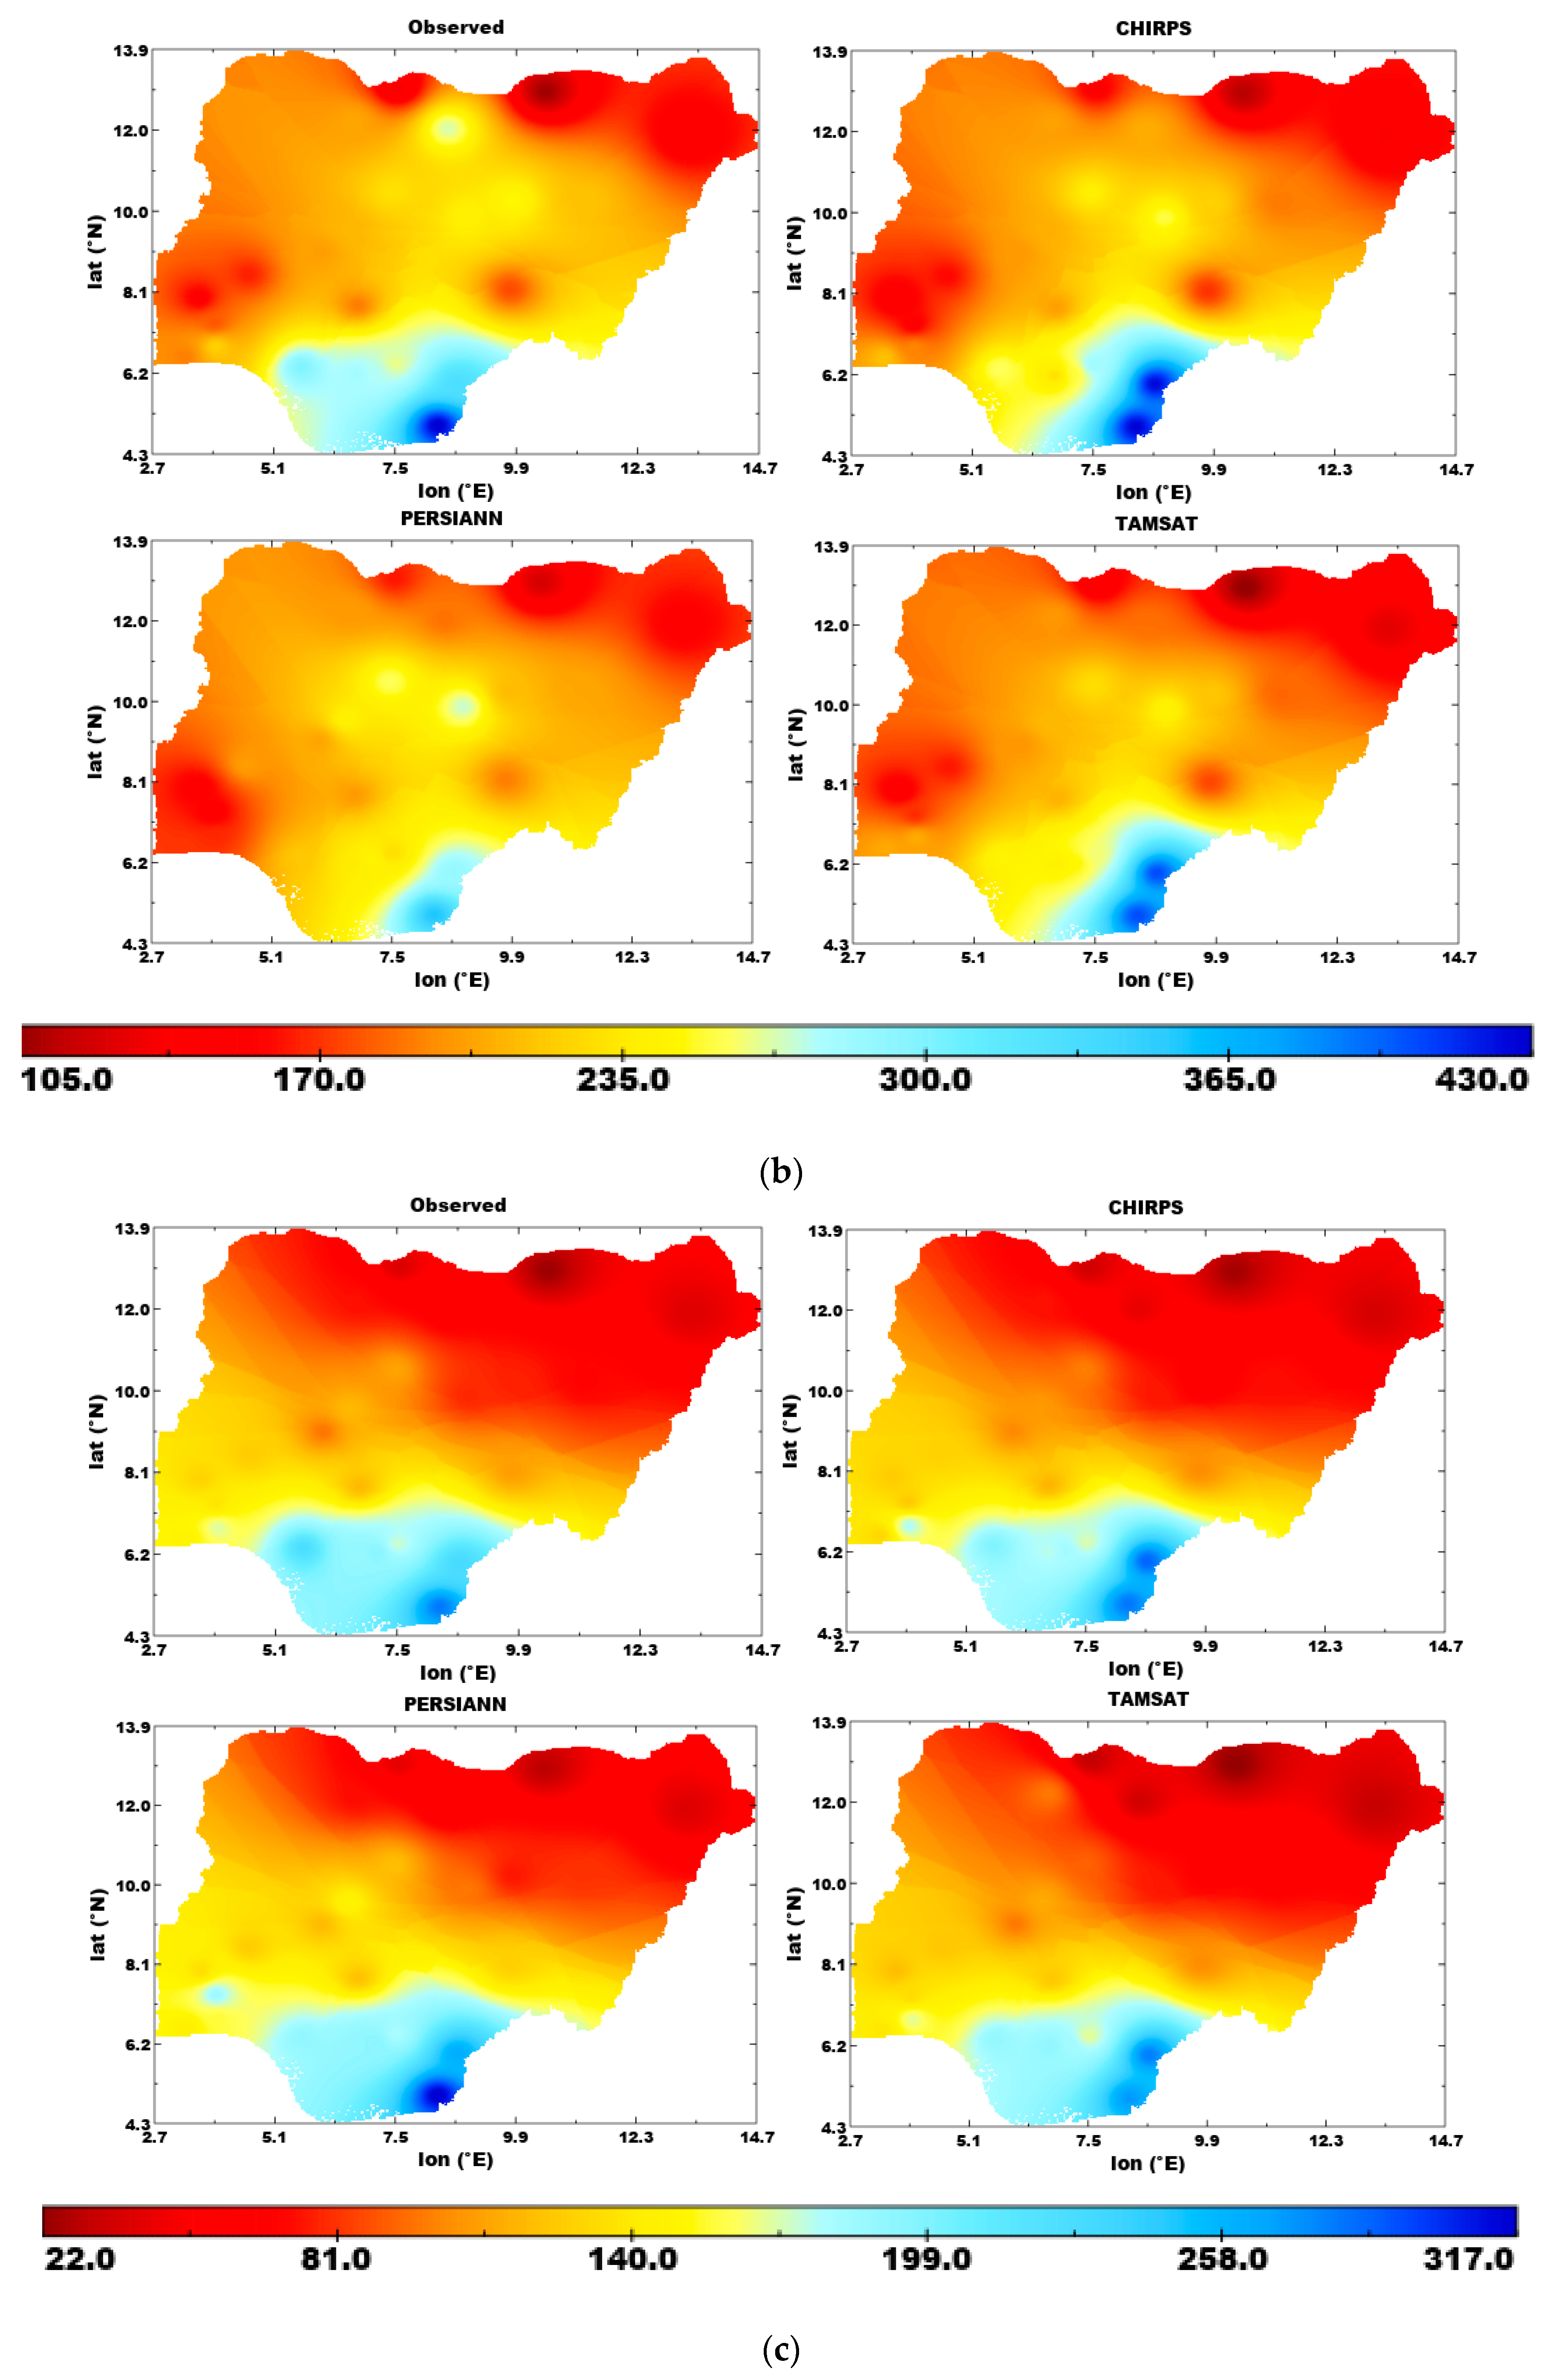
3.1. Seasonal Climatology

The mean seasonal climatology results for March to May (MAM), June to August (JJA), and from September to November (SON), as well as the June to September (JJAS) period, during which the monsoon and associated rainfall widely dominates the West African region, are presented in this section. Evaluation of the JJAS period is important because about 60% of the West African population depends on rain-fed agriculture for their source of livelihood [18]. These classifications were computed using datasets from 1983 to 2013 for gauge data in comparison to CHIRPS, PERSIANN, and TAMSAT datasets for locations, as shown in Figure 1. These comparisons were performed in order to assess the difference between observed and remotely-sensed rainfall datasets.
The spatial distribution of mean MAM, JJA, and SON seasons for observed (gauged), CHIRPS, PERSIANN, and TAMSAT data are presented in Figure 2a–c. As seen in Figure 2a (MAM season), all of the products captured the high rainfall in the south and the low rainfall in the northeast of Nigeria. The lowest gauged seasonal rainfall for this period was about 5 mm at Nguru, while the highest amount of 232 mm was in Calabar, which is expected, as the latter station is located in the Guinea coast closer to the Atlantic Ocean, while the former is situated in the Sahel. Though the products performed reasonably well in capturing the seasonal amount of rainfall within the Savannah and Sahel regions, they poorly reproduced observed amounts in the Guinea coast region. All products overestimated MAM seasonal amounts by 1–23 mm for Guinea coast (Ikom), Savannah (Bida and Kaduna), and Sahel (Nguru) while underestimations occurred within the range of 2–52 mm in Guinea (Benin, Calabar, Enugu, Ibadan, Iseyin), Savannah (Bauchi), and Sahel (Kano, Katsina, Lokoja).
During the JJA (Figure 2b), the seasonal spatial pattern of rainfall amount for all products was consistent with observed datasets. All of the products recorded low seasonal rainfall amounts in Nguru and high amount in Calabar. Specifically, all of the models showed underestimations in Guinea (Asaba, Awka, Benin, Ibadan, and Ijebu), Savannah (Bauchi and Bida), and Sahel (Gombe and Kano). The CHIRPS product agrees more with the observed data than PERSIANN and TAMSAT datasets in terms of capturing the spatial distribution pattern during the JJA season.
During the SON season (Figure 2c), all of the products were also able to reproduce the spatial and seasonal pattern of rainfall over Nigeria with the highest rainfall recorded in the south and lowest in the north. The observed seasonal amount was overestimated in many of the locations across the three climatic zones.
Generally, the spatial and seasonal patterns of all the rainfall products were consistent with the gauge (observed) dataset for all considered seasons. This revealed that all of the products captured the seasonal south–north rainfall oscillations, which are tightly coupled with the ITCZ latitudinal migration.

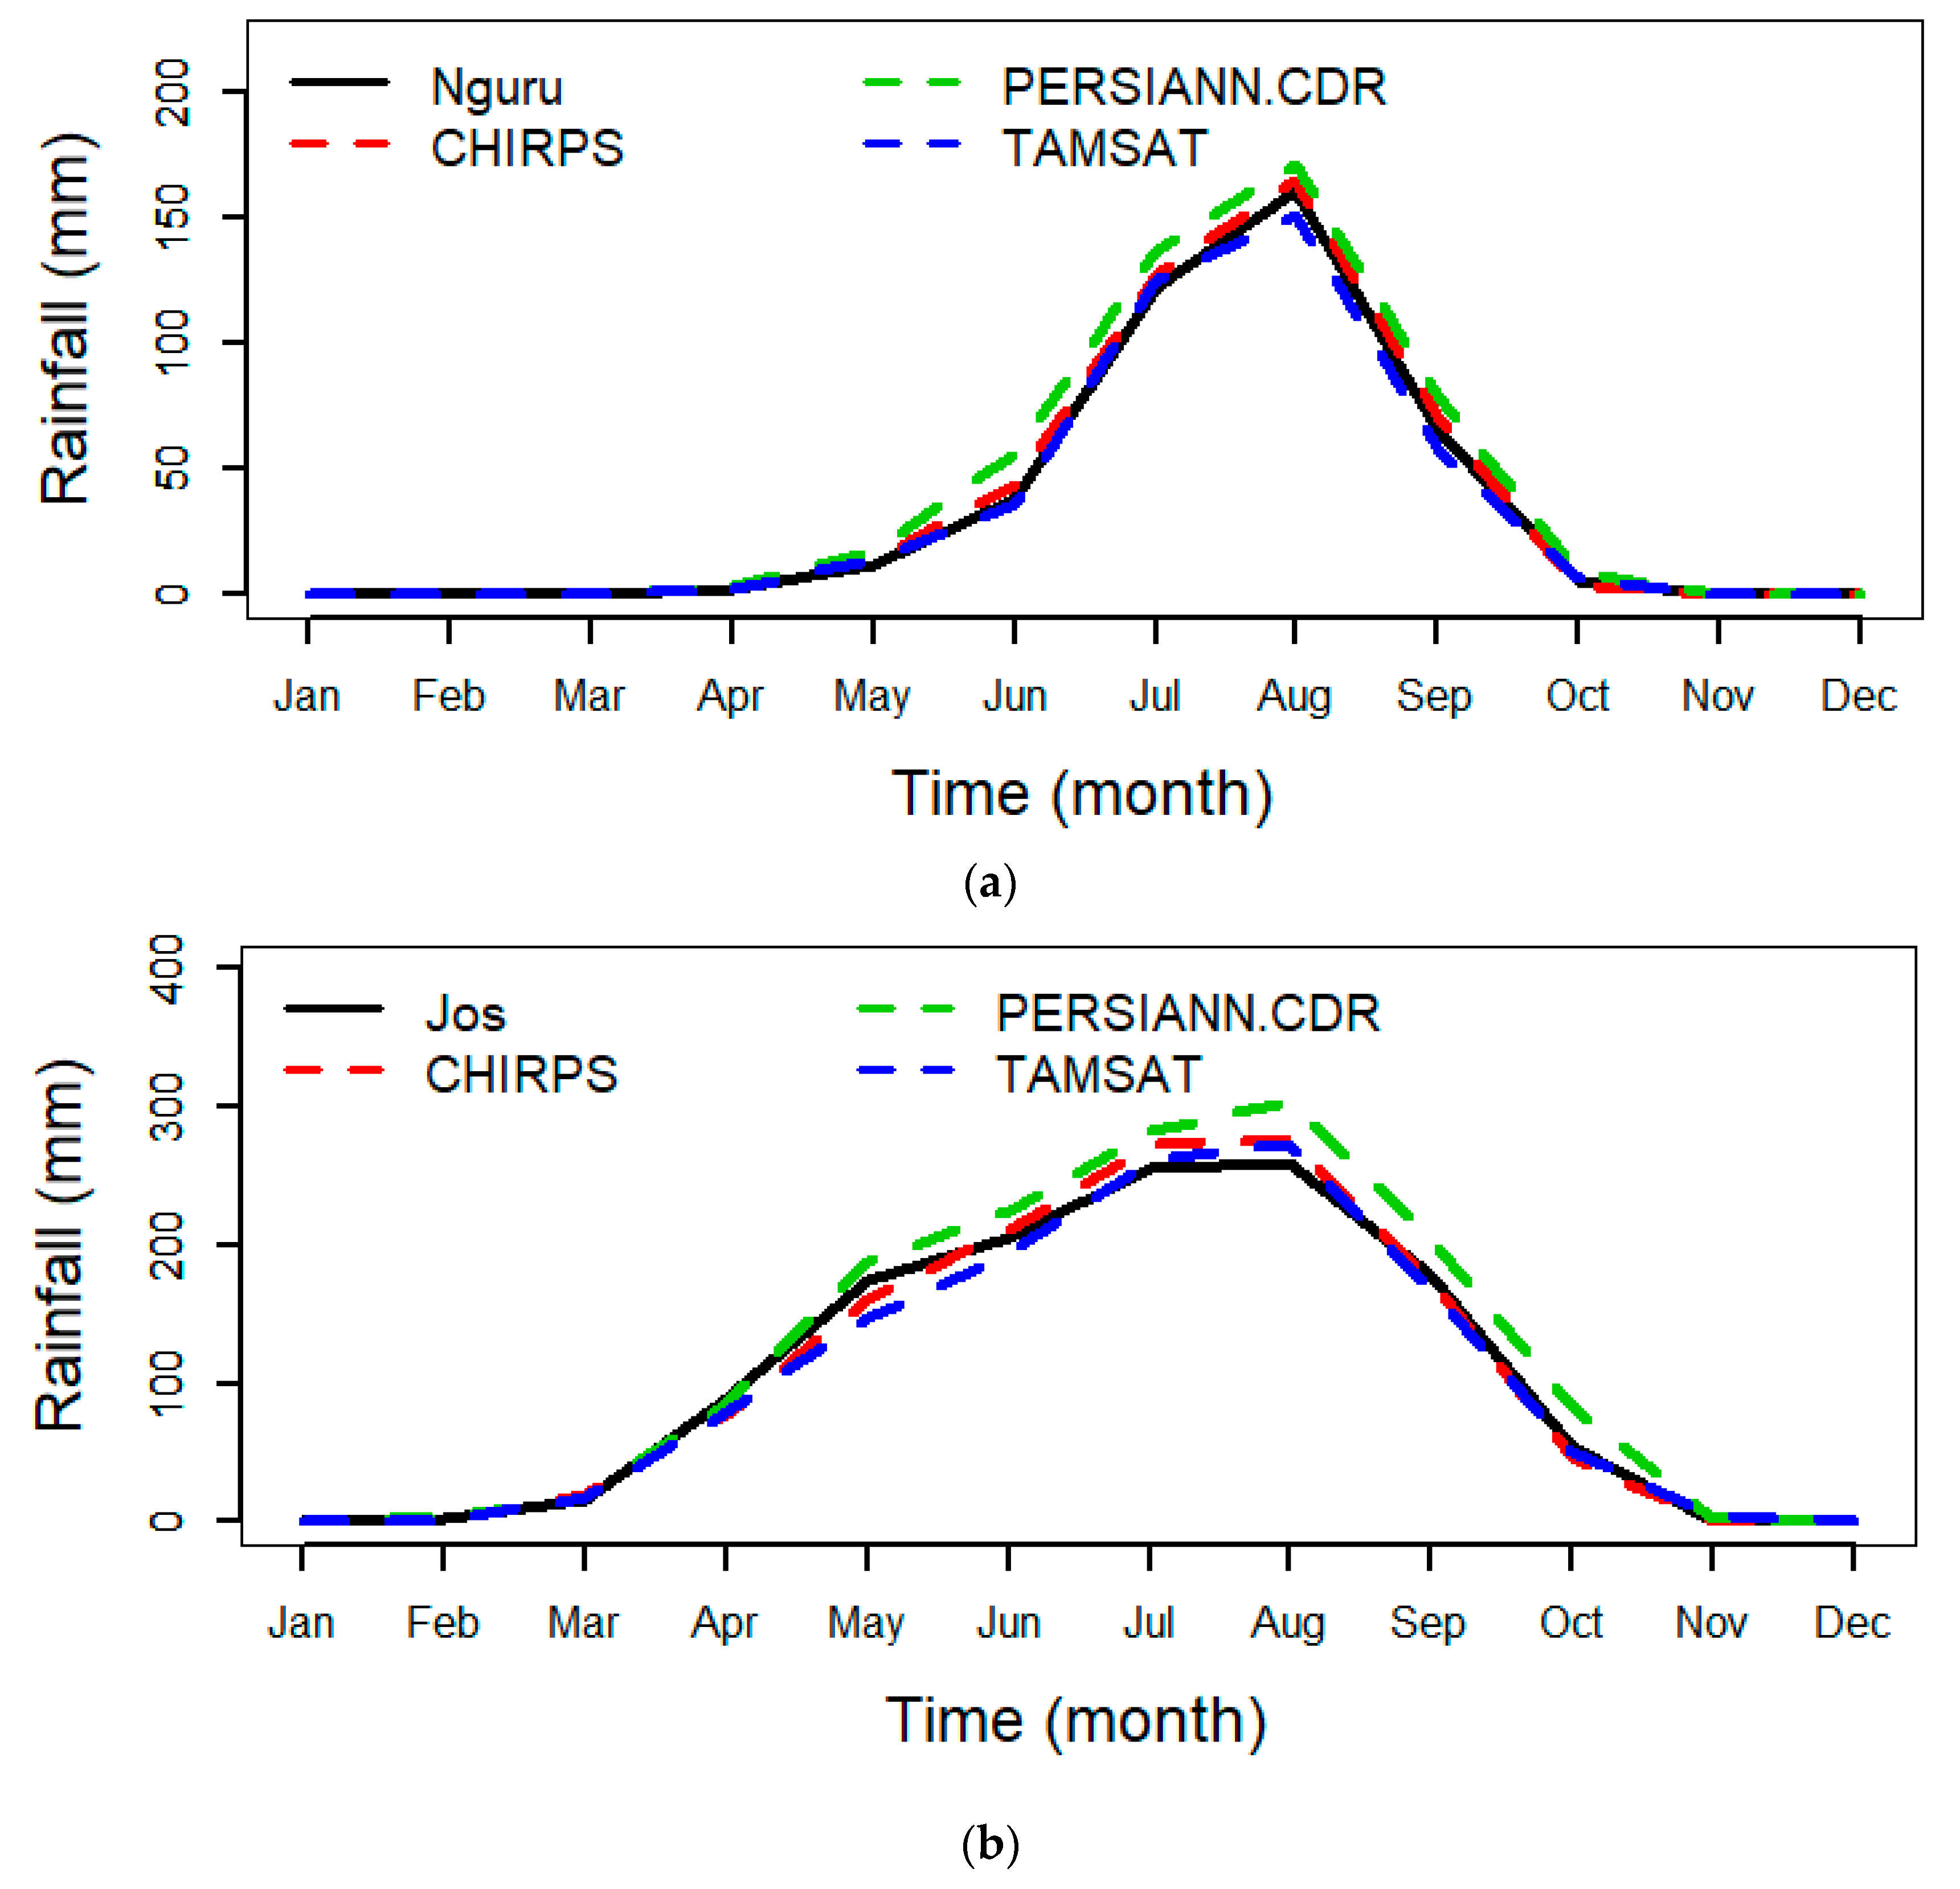
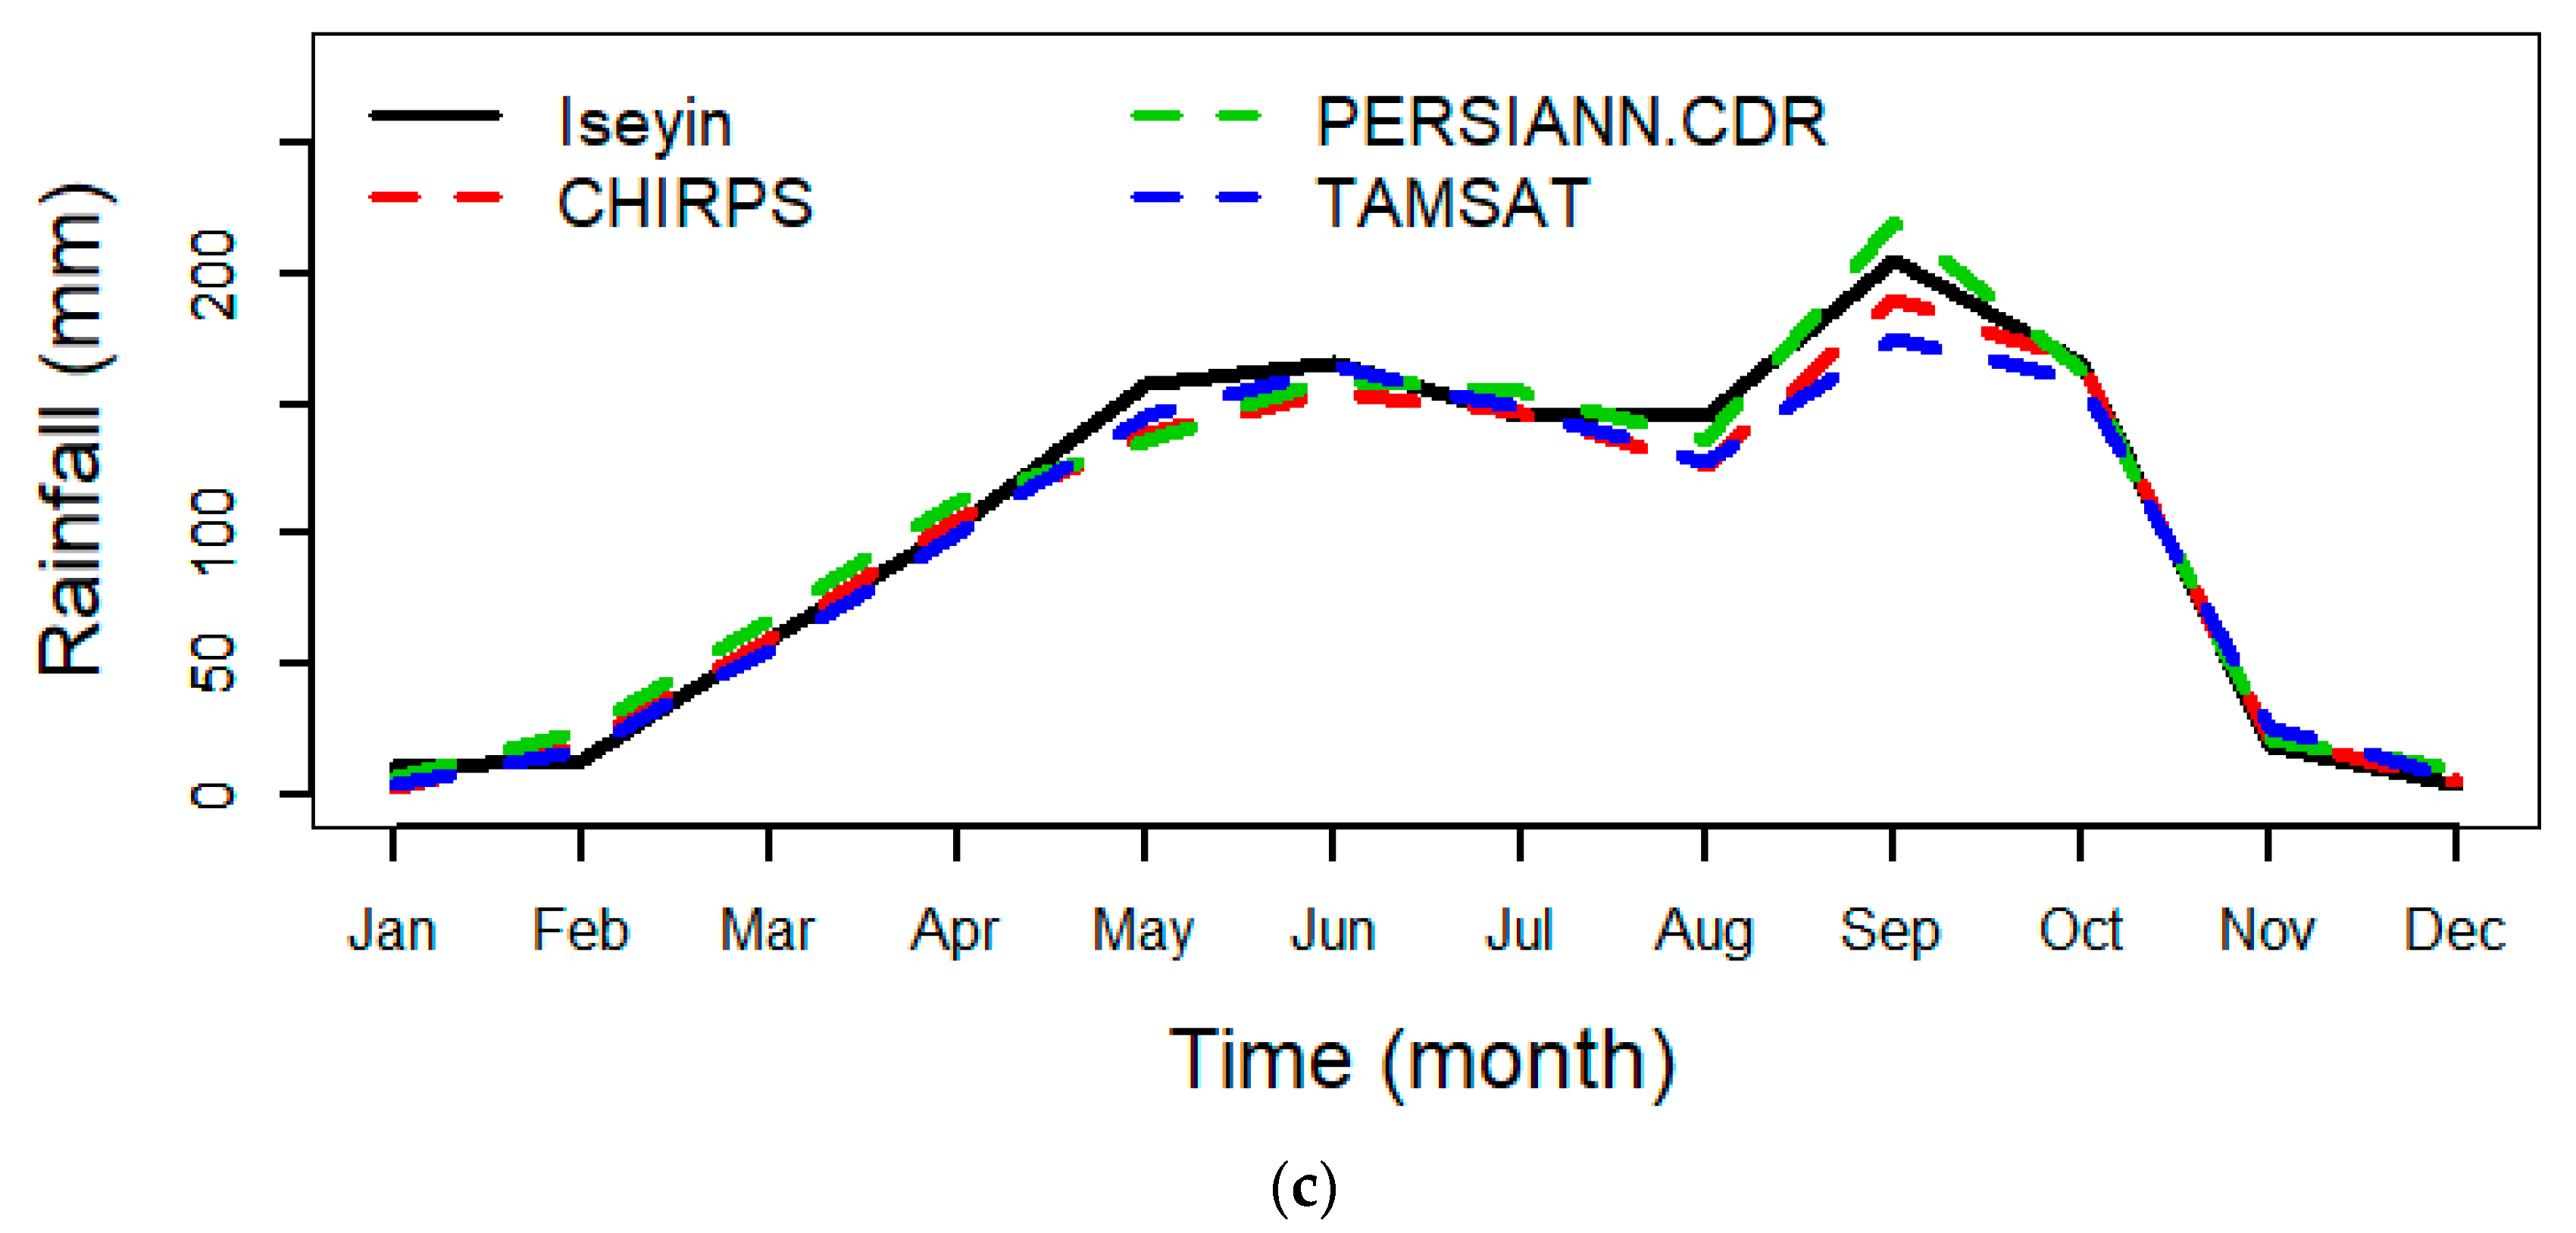
3.2. Annual Cycle of Mean Monthly Rainfall

The annual cycles (1983–2013) of mean monthly rainfall at twenty-four (24) point-based synoptic station scale were compared to corresponding point-based datasets for the satellite-based products in the Sahel, Savannah, and Guinea coast climate zones as shown in Figure 3a–c, respectively. The magnitude of the errors of the satellite-based products from observed data for all locations are presented in Table 3. Results showed that satellite product datasets were able to capture trends and peaks at all synoptic locations, with error deviations ranging from 3 to 60 mm. This shows that the latitudinal oscillations of the ITCZ from southern latitudes to northern latitudes, which results in convective processes, were well captured by all satellite-based products.
In the Sahel region (e.g., Nguru station, Figure 3a), the products underestimated observed rainfall peak at Gusau and Kano synoptic stations, with CHIRPS producing the lowest RMSE (Table 3) values of 13.5 mm and 35.6 mm, respectively. All gridded products produced good model fits with minimal residuals ranging from 3 mm to 11 mm for Maiduguri and Nguru synoptic stations. At Katsina, rainfall peak was over predicted by all products with RMSE values of 12 mm, 15 mm, and 17 mm for TAMSAT, CHIRPS, and PERSIANN, respectively.
The seasonal cycle was reasonably captured by all the entire products in the Savanna zone. The mean seasonal cycle at Jos climate station is depicted in Figure 3b. CHIRPS and TAMSAT datasets represent the peaks better than PERSIANN, especially in Ilorin and Minna. Overestimations of rainfall peaks by all satellite products were observed at Bida, Ibi, Ilorin, Kaduna, and Jos with RMSE values ranging from 7–26 mm. Generally, CHIRPS and TAMSAT presented lower RMSE values ranging from 7.2–20.8 mm in comparison to higher values by the PERSIANN, which ranges from 12.3–23.2 mm.
Contrary to results from Sahel and Savannah regions, larger biases were detected for all of the products in all the locations within the Guinea region, except at Iseyin (Figure 3c) and Lokoja, as shown in Table 3. This notable difference can be partly explained by the heterogeneous land use land cover of the region, and the presence of the Atlantic Ocean at the south border of the country, which greatly influence rainfall processes. All of the satellite rainfall datasets showed a wide range of error magnitudes from 9.2 to 60.1 mm. High values of RMSE > 10 mm were recorded by all products at all synoptic stations, except for minimal values of RMSE < 10 mm recorded by CHIRPS at Lokoja. All satellite products overestimated (underestimated) rainfall peak at Ikom (Benin), showing large RMSE value > 29 mm.
It is important to also note that the entire satellite-based products showed strong agreement (r > 0.9) with gauged datasets at all locations for mean monthly data in Figure 3. Generally, the CHIRPS and TAMSAT datasets performed better in capturing the unimodal and bimodal annual rainfall pattern as influenced by the ITCZ for all locations studied. Unimodal and bimodal rainfall patterns as a result of oscillations of the ITCZ from 15° S to 15° N [34] were well represented by all satellite products in all climatic zones of Nigeria. In a previous study [7], the performance of CHIRPS rainfall estimates in comparison with gauge records for six (6) stations in southwest Nigeria showed strong relationship with high correlation (r) values greater than 0.70. The CHIRPS also showed strong relationships with gauge data at monthly and seasonal time resolutions in a study [4] conducted in the Sudano-Sahelian zone of Nigeria. In another study [5] in East Africa (Ethiopia, Kenya, and Tanzania), CHIRPS was reported as the preferential data source for climate change and hydrological studies in ungauged locations. These authors noted that CHIRPS was more accurate than African Rainfall Climatology, version 2.0, (ARC), Observational-Reanalysis Hybrid (ORH), and Regional Climate Models (RCMs) in reproducing mean monthly rainfall amount over East Africa. Dinku et al., in their study [8] over East Africa (Ethiopia, Kenya, Somalia, Uganda, Rwanda, and Tanzania), reported strong relationship with CHIRPS, TAMSAT, and gauge data with correlation values greater than 0.9 at monthly time steps.

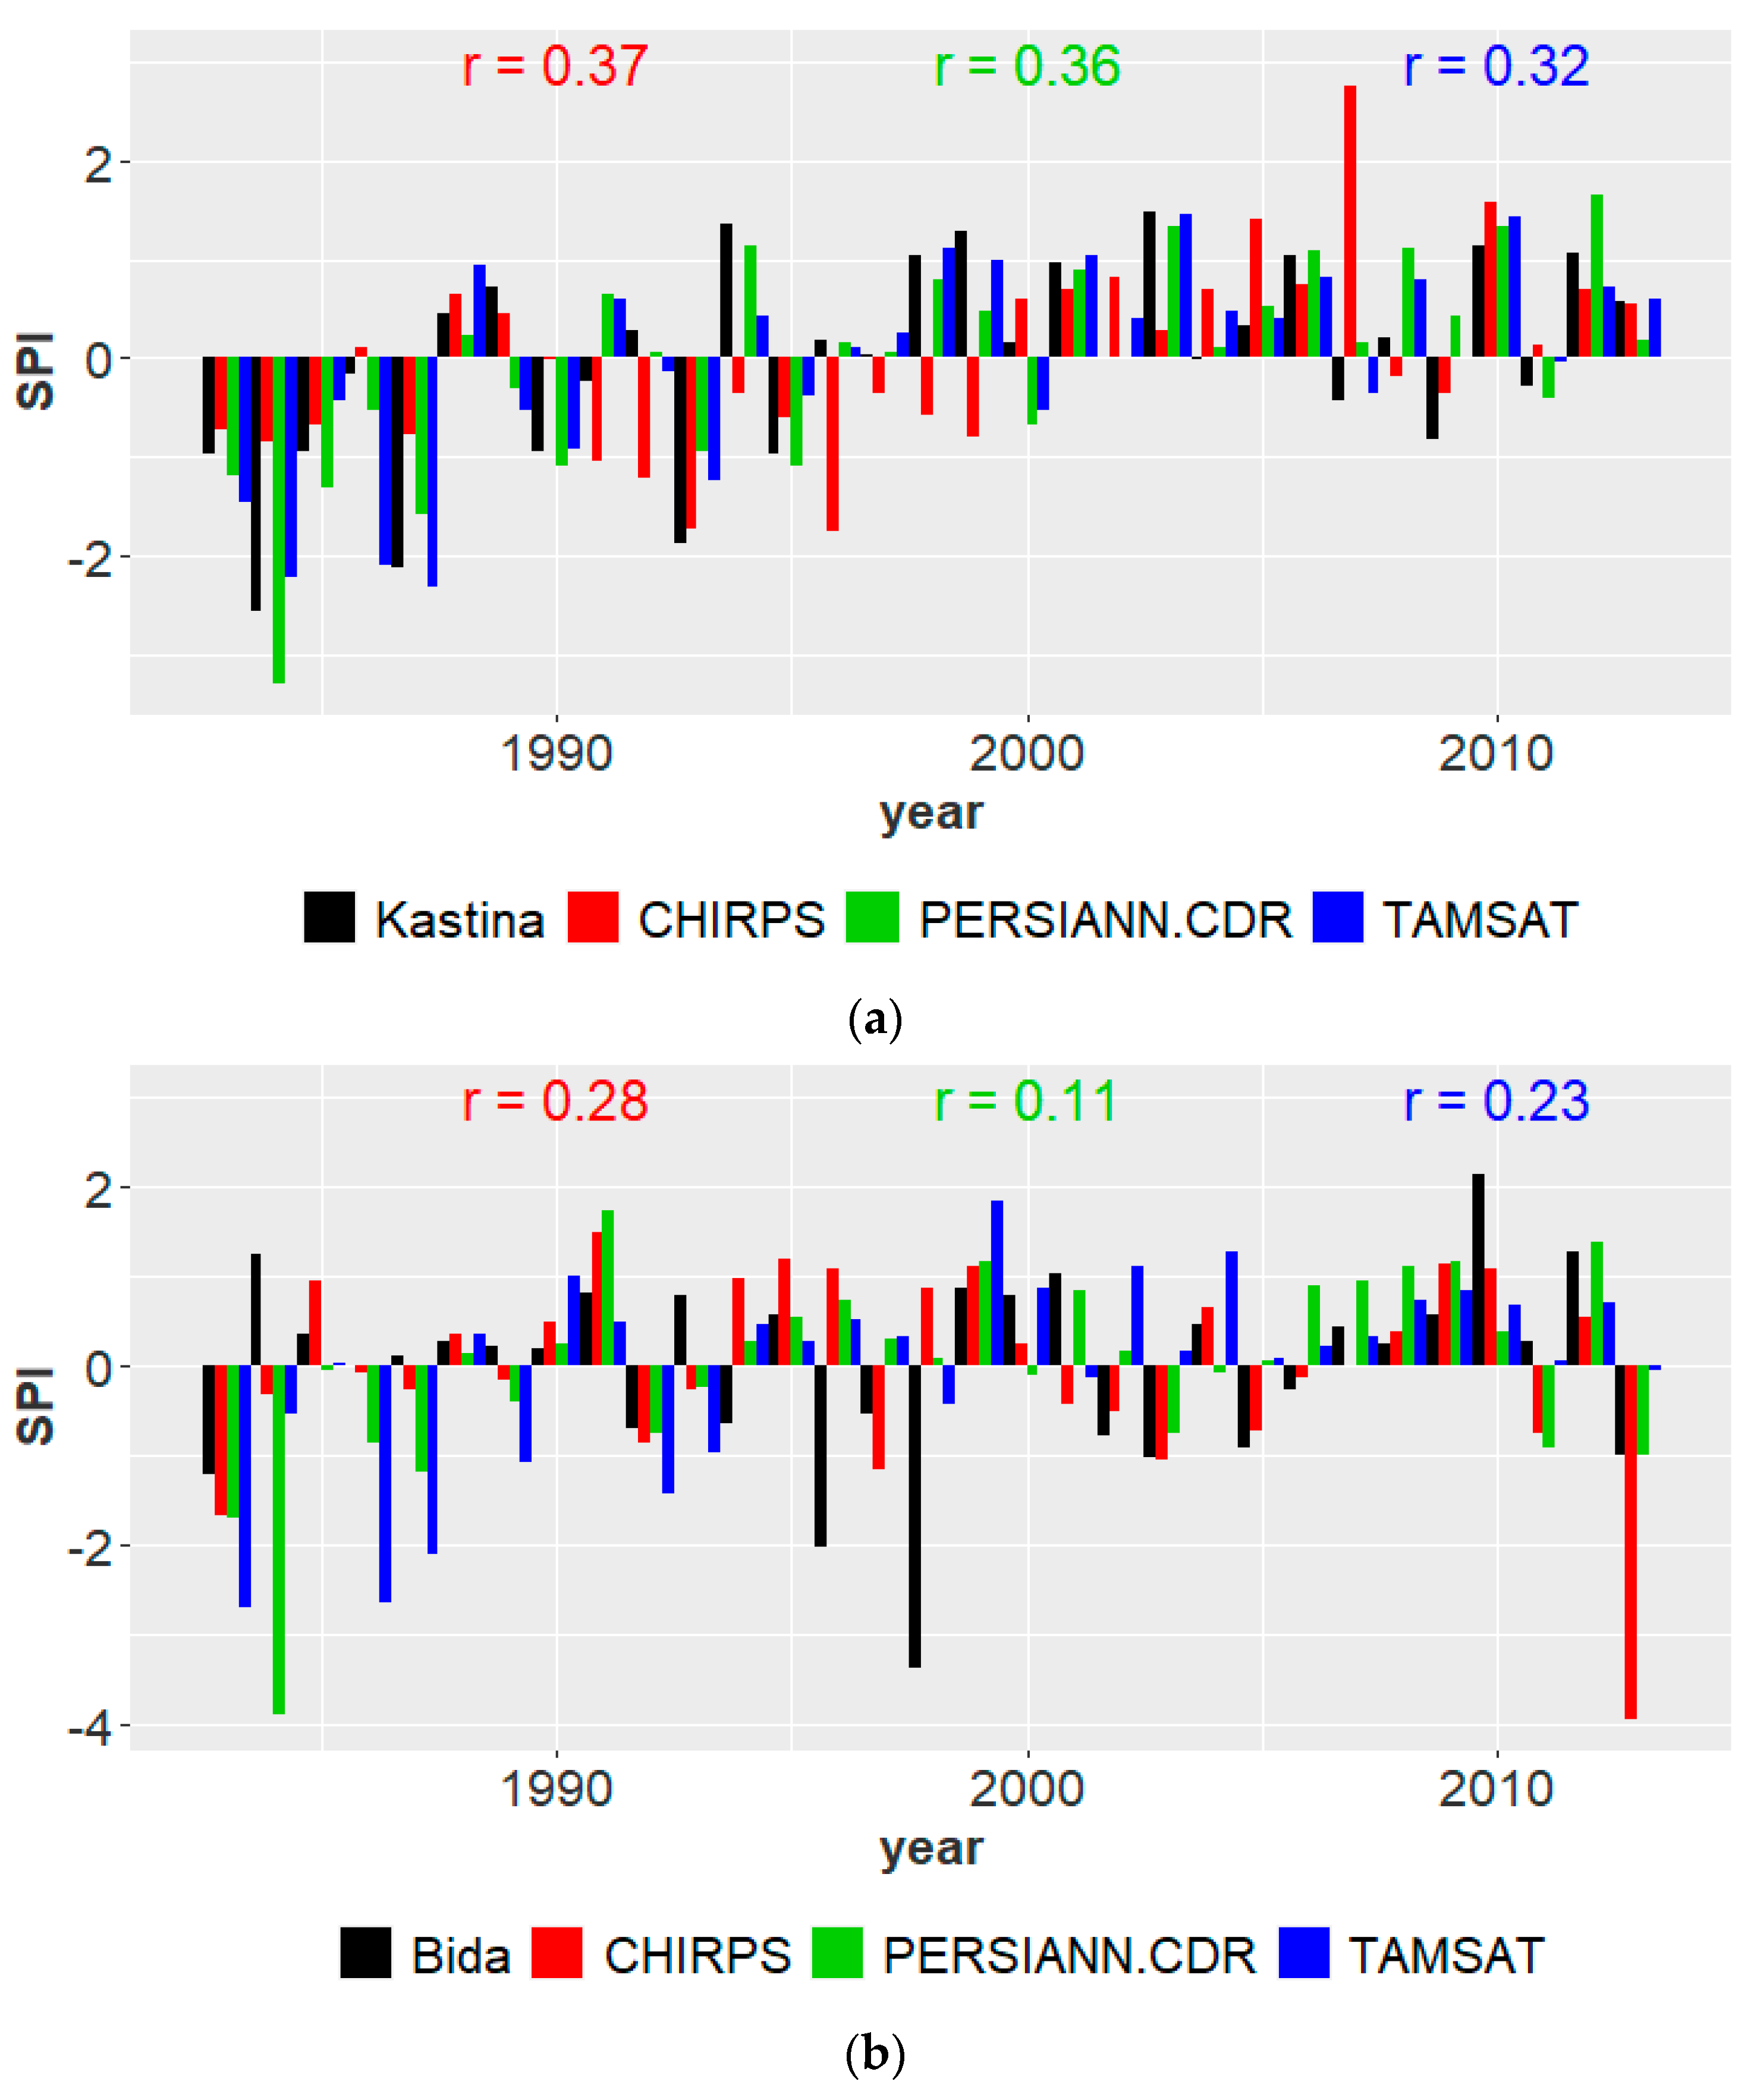
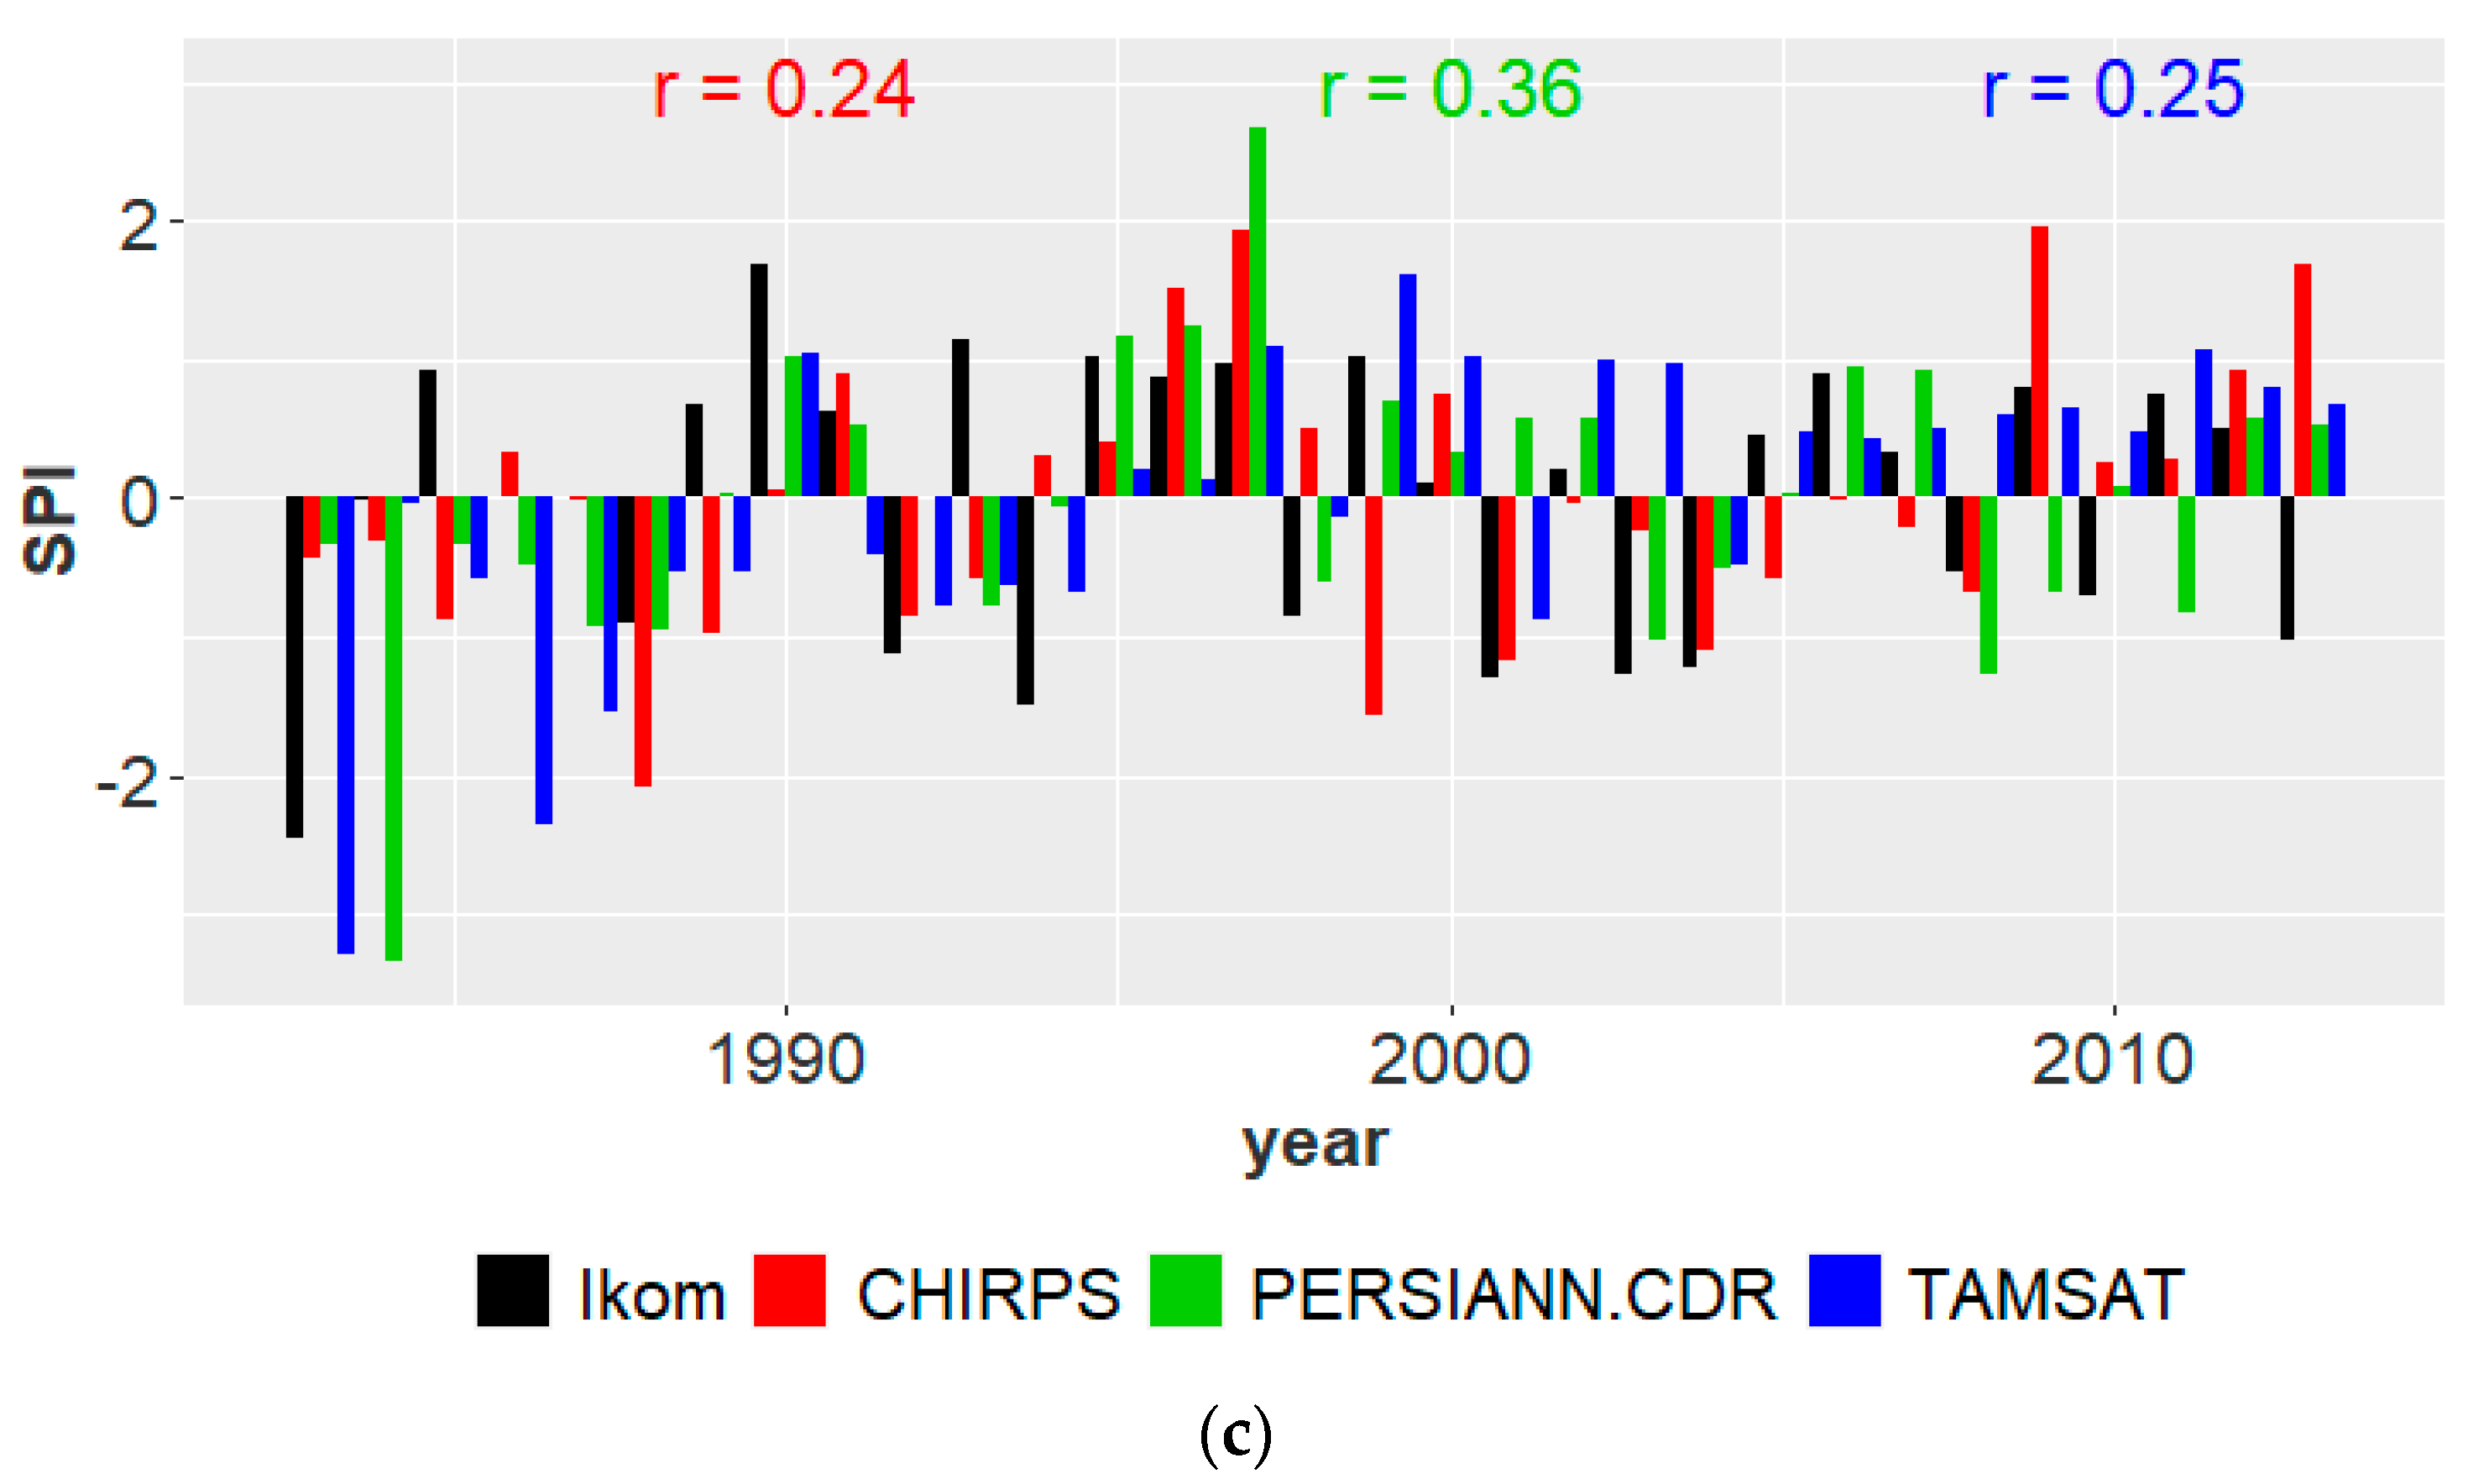
3.3. Inter-Annual Rainfall Anomaly

The capabilities of CHIRPS, PERSIANN, and TAMSAT products to reproduce observed year-to-year rainfall anomalies using standardized precipitation index (SPI) within the three climatic zones are shown in Figure 4a–c by using a single station in each zone for illustrations. The SPI at annual resolutions were estimated differently using rainfall records for gauge and satellite-based rainfall products at point-based location scale for the period 1983–2013. Table 4 presents the correlation scores between each satellite product and gauge data for all locations within the study area at the annual time step. All products exhibited moderate agreement with gauged datasets with correlation values greater than 0.5 (r > 0.5), except at locations within the Sahel region (Katsina; TAMSAT in Gusau), Savannah region (Bida, Ilorin, Jos and Kaduna; PERSIANN at Bauchi; PERSIANN and TAMSAT at Ibi and Gombe), and the Guinea coast region (Calabar and Ikom; CHIRPS at Benin; PERSIANN at Asaba and Ibadan), as shown in Table 4. SPI results obtained for Kastina, Bida, and Ikom stations are shown in Figure 4a, 4b, and 4c, respectively. For the thirty-one (31) years of rainfall series considered, and in the majority of the locations, the CHIRPS dataset exhibited satisfactory performance over PERSIANN and TAMSAT in reproducing the year-year variations of rainfall anomalies. Unsatisfactory correlation found in most of the locations may be attributed to the presence of large-scale forcings on local climatic conditions [31].

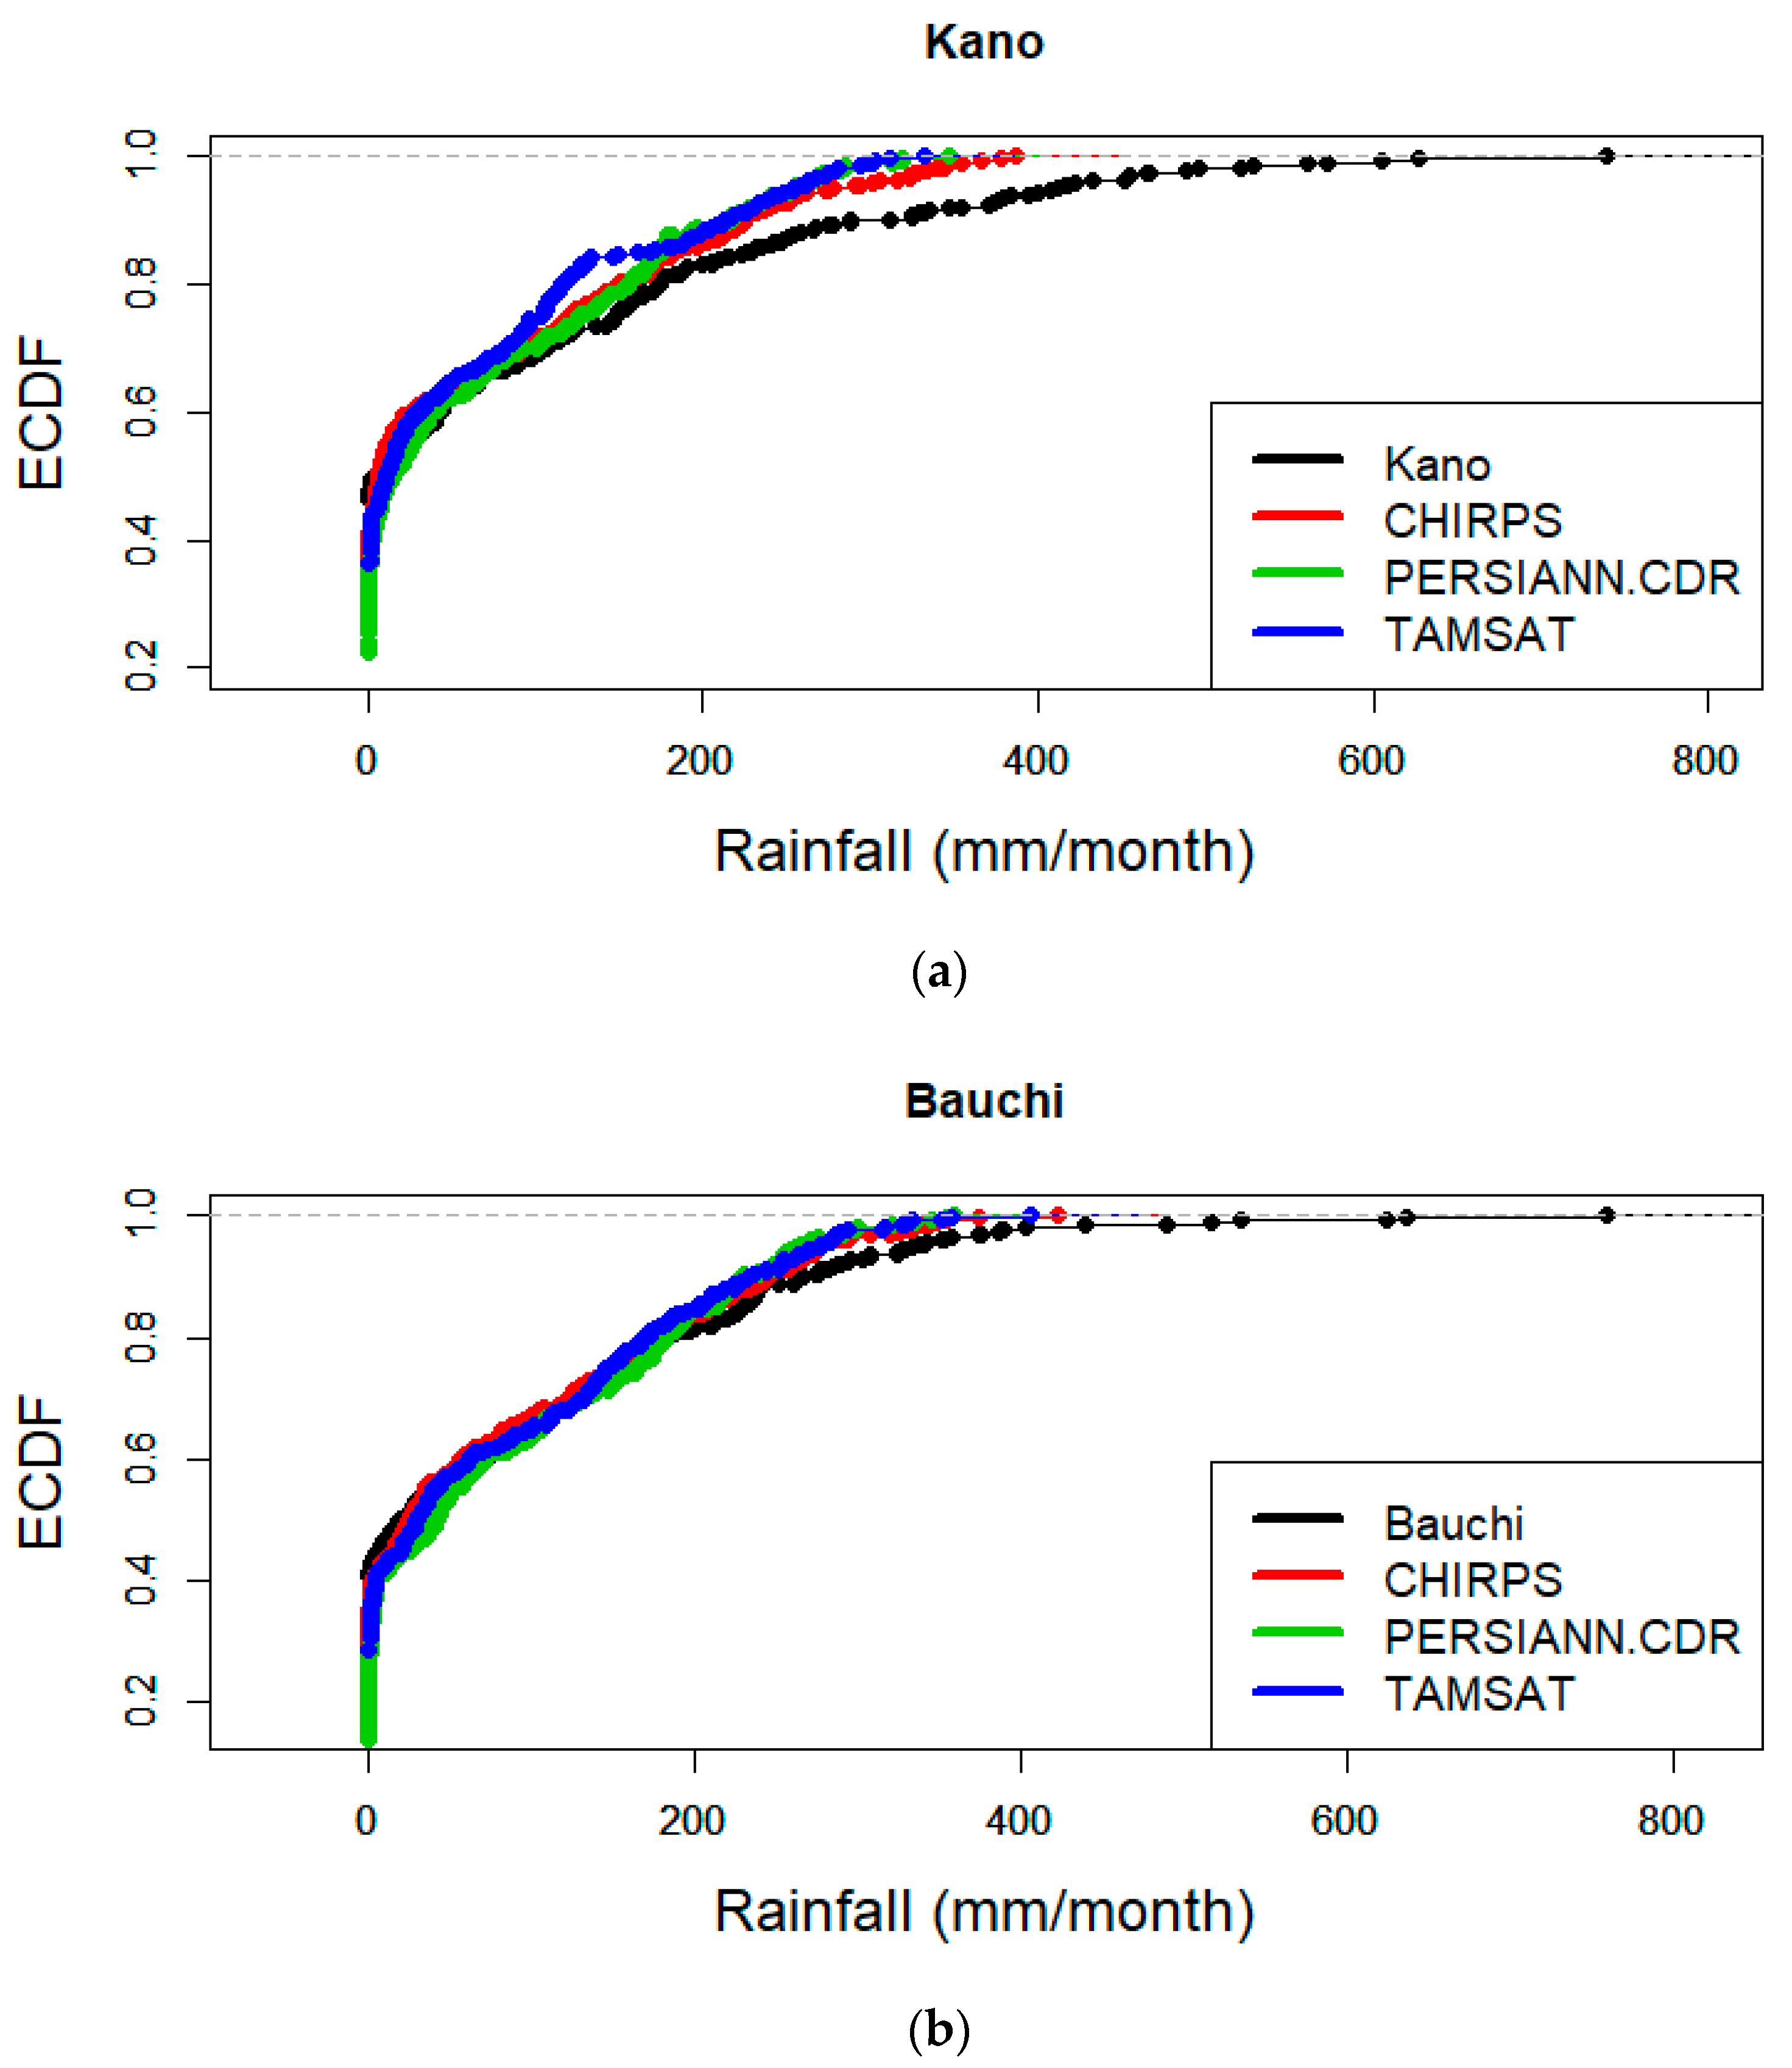
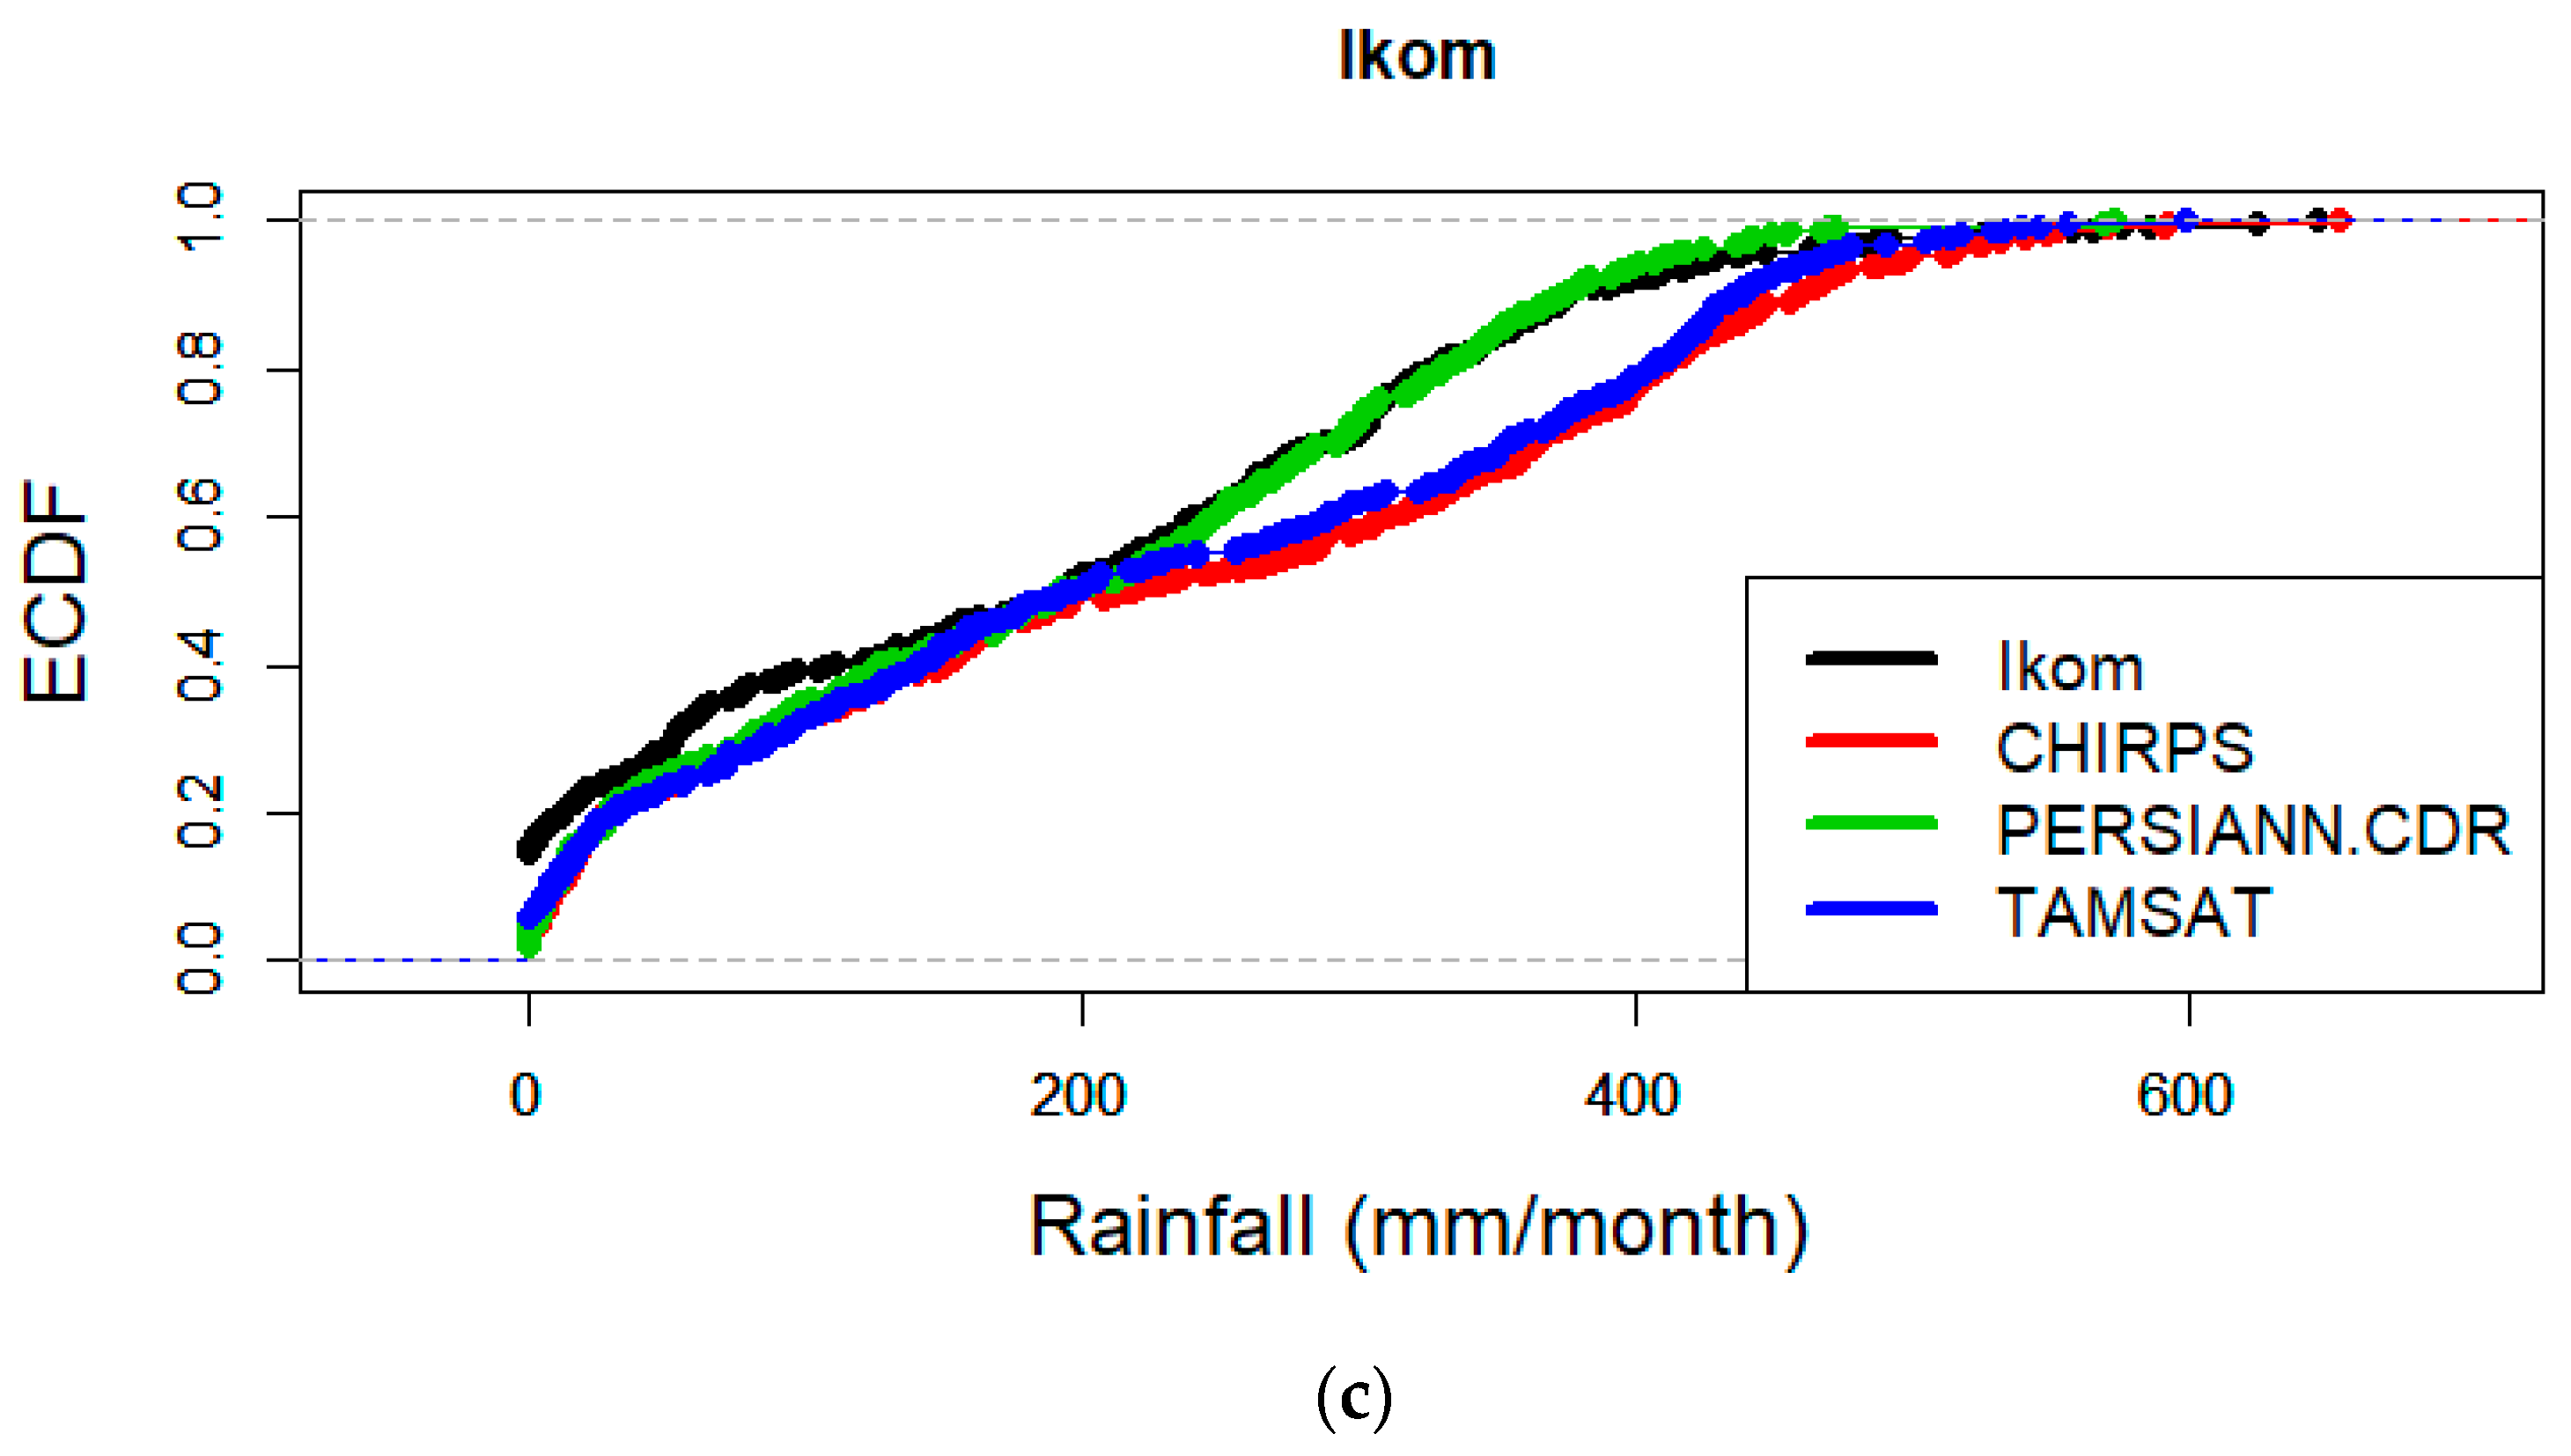
3.4. Empirical Cumulative Distribution Frequency

The ability of satellite-based rainfall products to reproduce the frequency of gauged monthly rainfall amounts from 1983 to 2013 is evaluated using the empirical cumulative distribution function (ECDF) plots. Comparisons of the ECDFs of mean monthly rainfall at point-based scale for gauged and satellite products within Sahel, Savannah, and Guinea Coast climatic zones are shown in Figure 5a–c using one station in each climatic zone. Generally, similar patterns of gauged monthly rainfall distributions in all locations were captured by the satellite products. The frequency of occurrence of monthly rainfall within the Sahel climatic zone was significantly overestimated by all products at the Kano synoptic station (Figure 5a) in the range of 200–400 mm/month. TAMSAT and PERSIANN exhibited overestimation (100–200 mm/month) at Gusau and Katsina, respectively. However, all products showed close monthly probabilities of rainfall to gauged datasets at Maiduguri and Nguru.
In the Savannah region, both CHIRPS and TAMSAT captured overall frequencies of observed values at all locations, although with slight margins, as shown in Figure 5b. The PERSIANN showed consistent frequencies with gauged datasets, but underestimated mean monthly rainfall frequency at Ibi, Ilorin, Jos, Kaduna, and Minna in the range of 150–300 mm/month.
In the Guinea coast climatic zone, the entire product showed consistent frequencies, except at Ikom (Figure 5c), where CHIRPS and TAMSAT significantly underestimated rainfall frequency in the range of 200–400 mm/month. Conversely, all products overestimated rainfall at more than 200 mm/month (at Asaba, Benin, Awka, Ibadan, Ijebu, and Iseyin), and more than 400 mm/month (at Calabar).

3.5. Trend Analysis

Table 5 shows the p-values result of the non-parametric Mann–Kendall method used to assess the presence of significant trends at annual and seasonal (MAM, JJAS, and SON) time scales. The test was performed for all datasets at all synoptic stations under consideration in this study. In the Sahel, the entire satellite products and gauged datasets exhibited significant positive trend in the annual rainfall series, except at Gusau, where only TAMSAT and PERSIANN showed similar consistency. MAM rainfall features a positive significant trend in the local observed rainfall in Katsina, which is accurately replicated by PERSIANN. This significant positive trend was also observed at Gusau (PERSIANN and TAMSAT), Maiduguri (CHIRPS), and Nguru (CHIRPS and PERSIANN). The JJAS observed rainfall showed an increasing significant trend, which is in-line with all satellite products dataset in this zone, except for Gusau (gauge, CHIRPS, and TAMSAT were not significant). During the SON season, observed data from Kano and Maiduguri exhibited a significant trend that was replicated by PERSIANN and TAMSAT, as seen in Table 5.
In the Savannah, all satellite-based products and local rainfall annual series showed a significant positive trend at Bauchi. TAMSAT exhibited a significant increasing trend at all locations within this zone. The same was observed for PERSIANN at Bida, Jos, Kaduna, and Minna, while CHIRPS showed the same trend in Jos. At the seasonal scale, both CHIRPS and TAMSAT indicated a significant increasing trend, the same as seen in the gauged rainfall at Bauchi during the JJAS period. During the SON period, significant positive trends exhibited by the gauge time series at Ibi and Ilorin were reproduced by all satellite products, while in Minna, only PERSIANN and TAMSAT were able to replicate the gauged increasing significant trend successfully. Many of the products replicated seasonal observed trends in most locations, but with different levels of accuracy as presented in Table 5.
Over the Guinea coast, TAMSAT was consistent in exhibiting significant positive trends in all locations at the annual time step (Table 5), and was consistent with gauged data recorded at Benin, Calabar, Enugu, and Ijebu. From Table 5, significant positive trends shown in the gauge time series were also replicated by PERSIANN (at Ijebu), and CHIRPS (at Calabar). At the seasonal scale during the MAM period, (Table 5), TAMSAT exhibited positive significant trends in all stations within the Guinea coast, except in Iseyin. This significant trend was only exhibited in the gauged time series at Benin. For the high monsoon period (JJAS season), gauged data at Calabar exhibited same positive significant trends with CHIRPS and TAMSAT. Moreover, observed data at Ibadan, Ijebu, and Iseyin showed the same significant positive trends with all satellite products during the SON season. Similar significant positive trends were also exhibited between gauge, PERSIANN, and TAMSAT datasets in Enugu and Ikeja, and between gauge data and TAMSAT at Benin in this season.

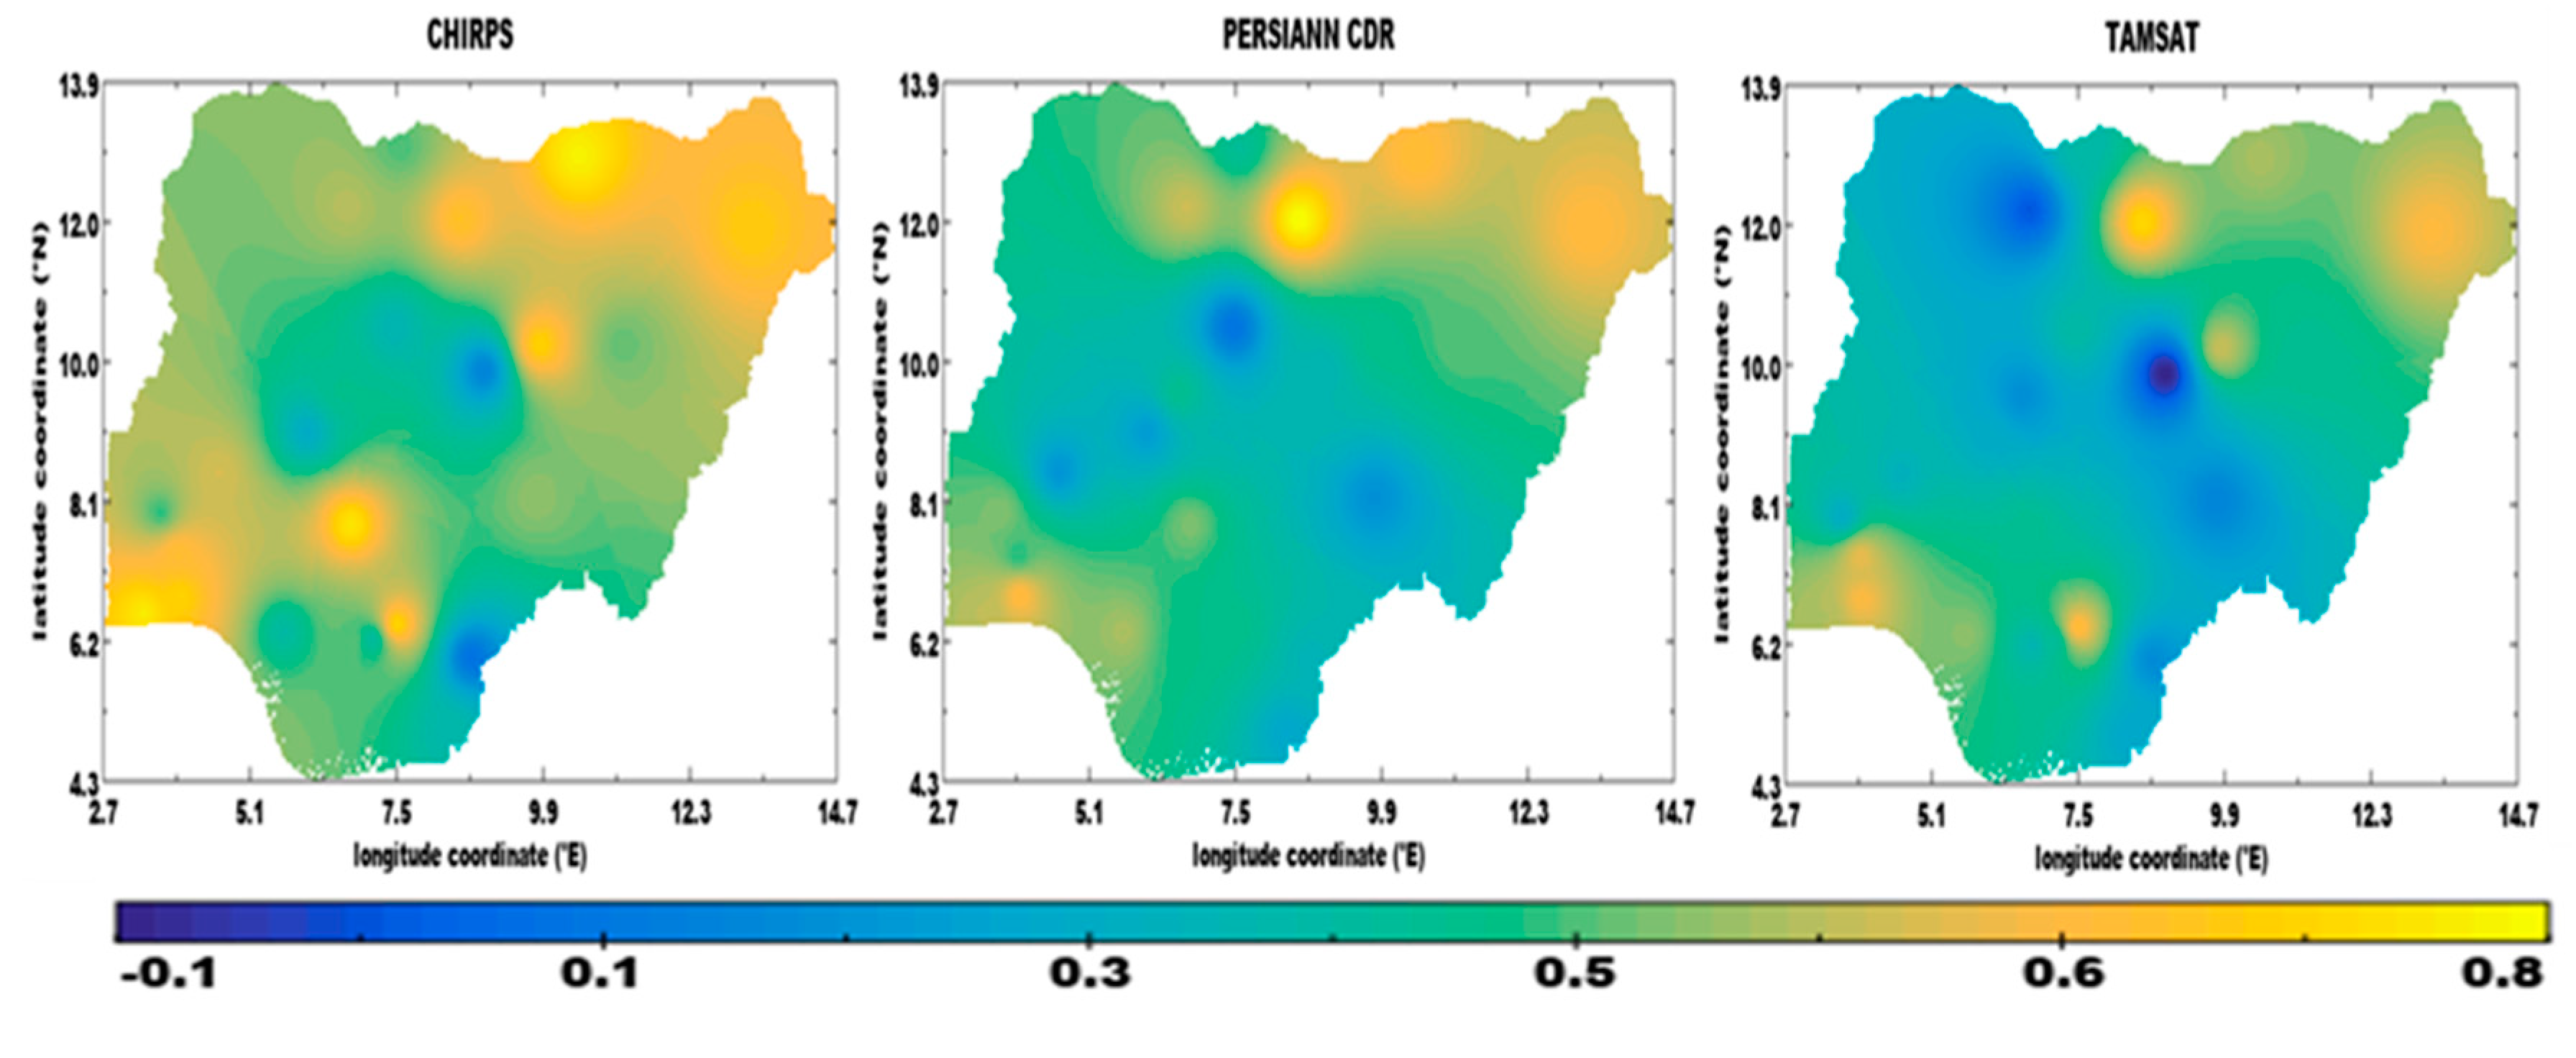
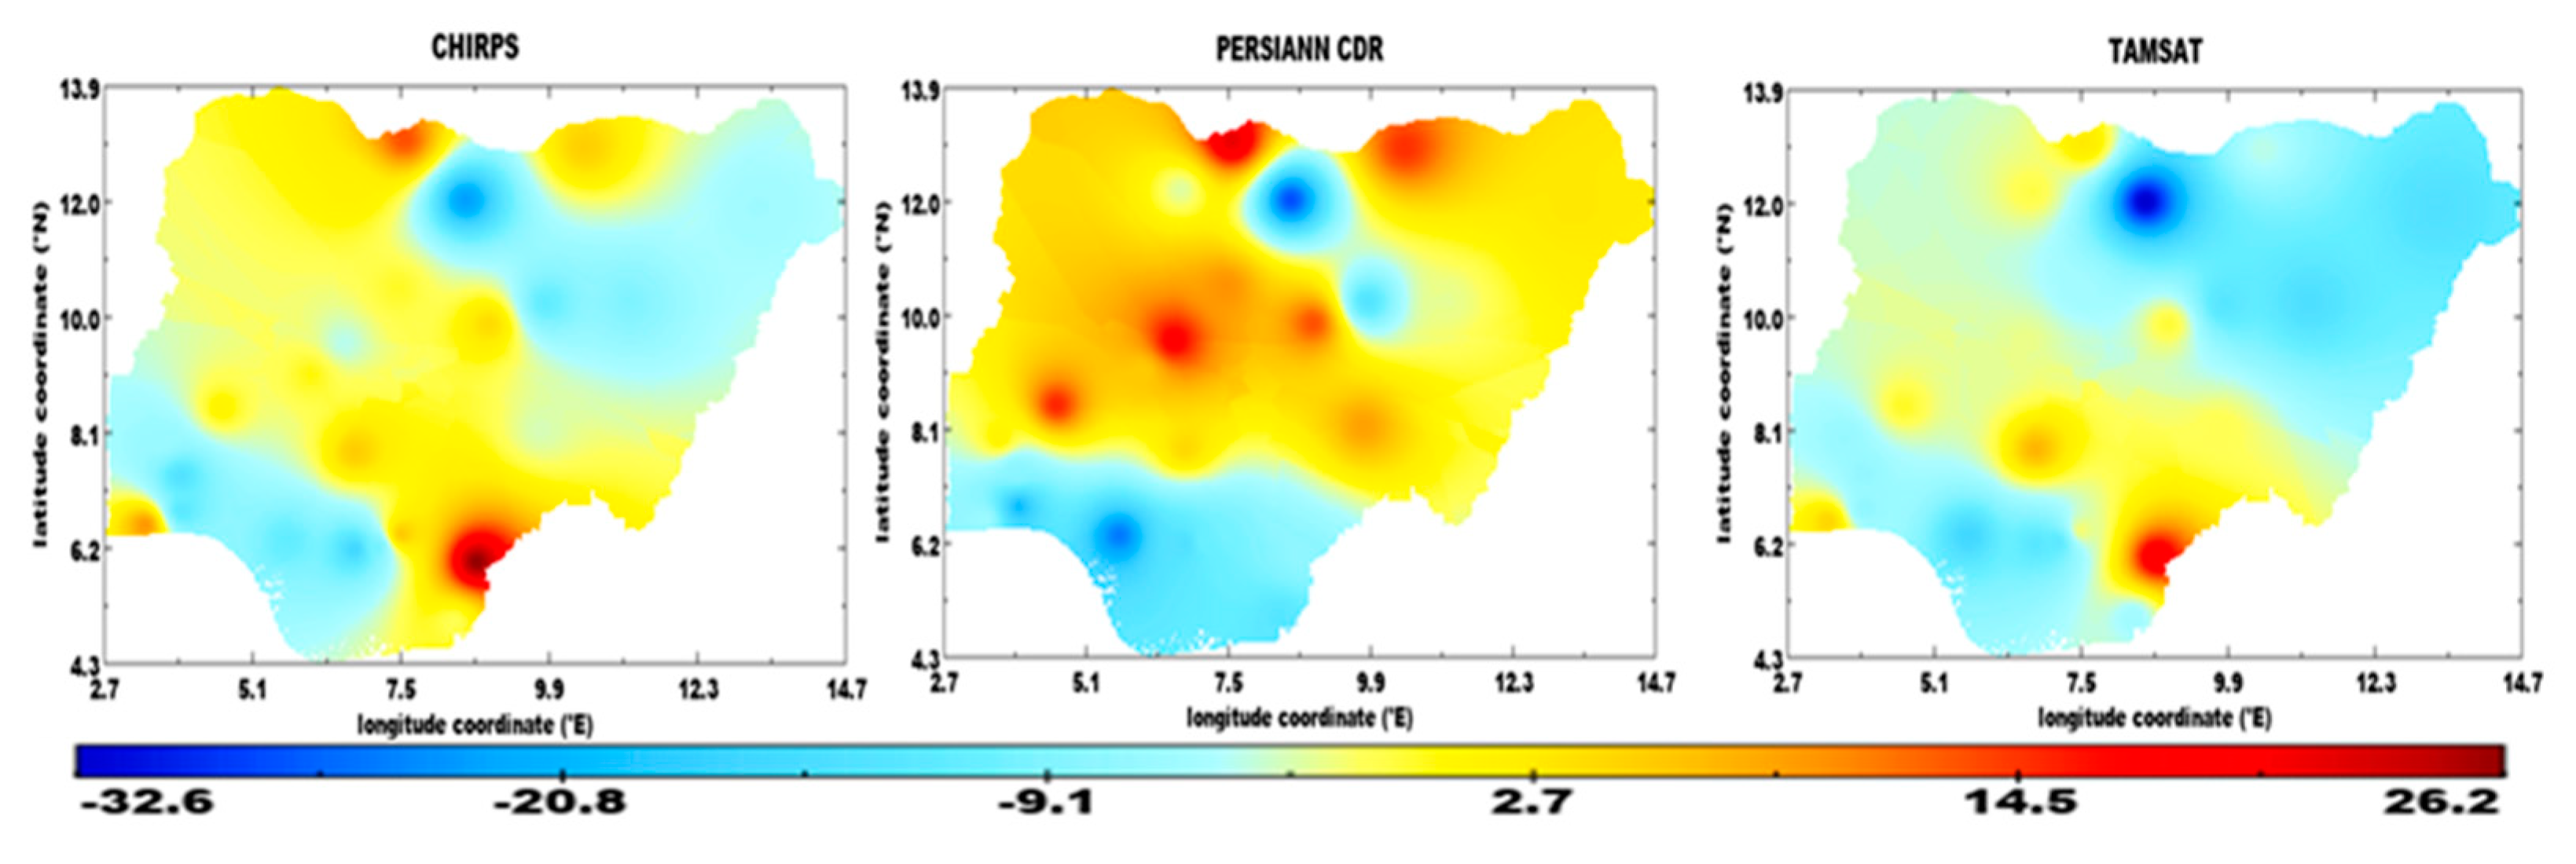
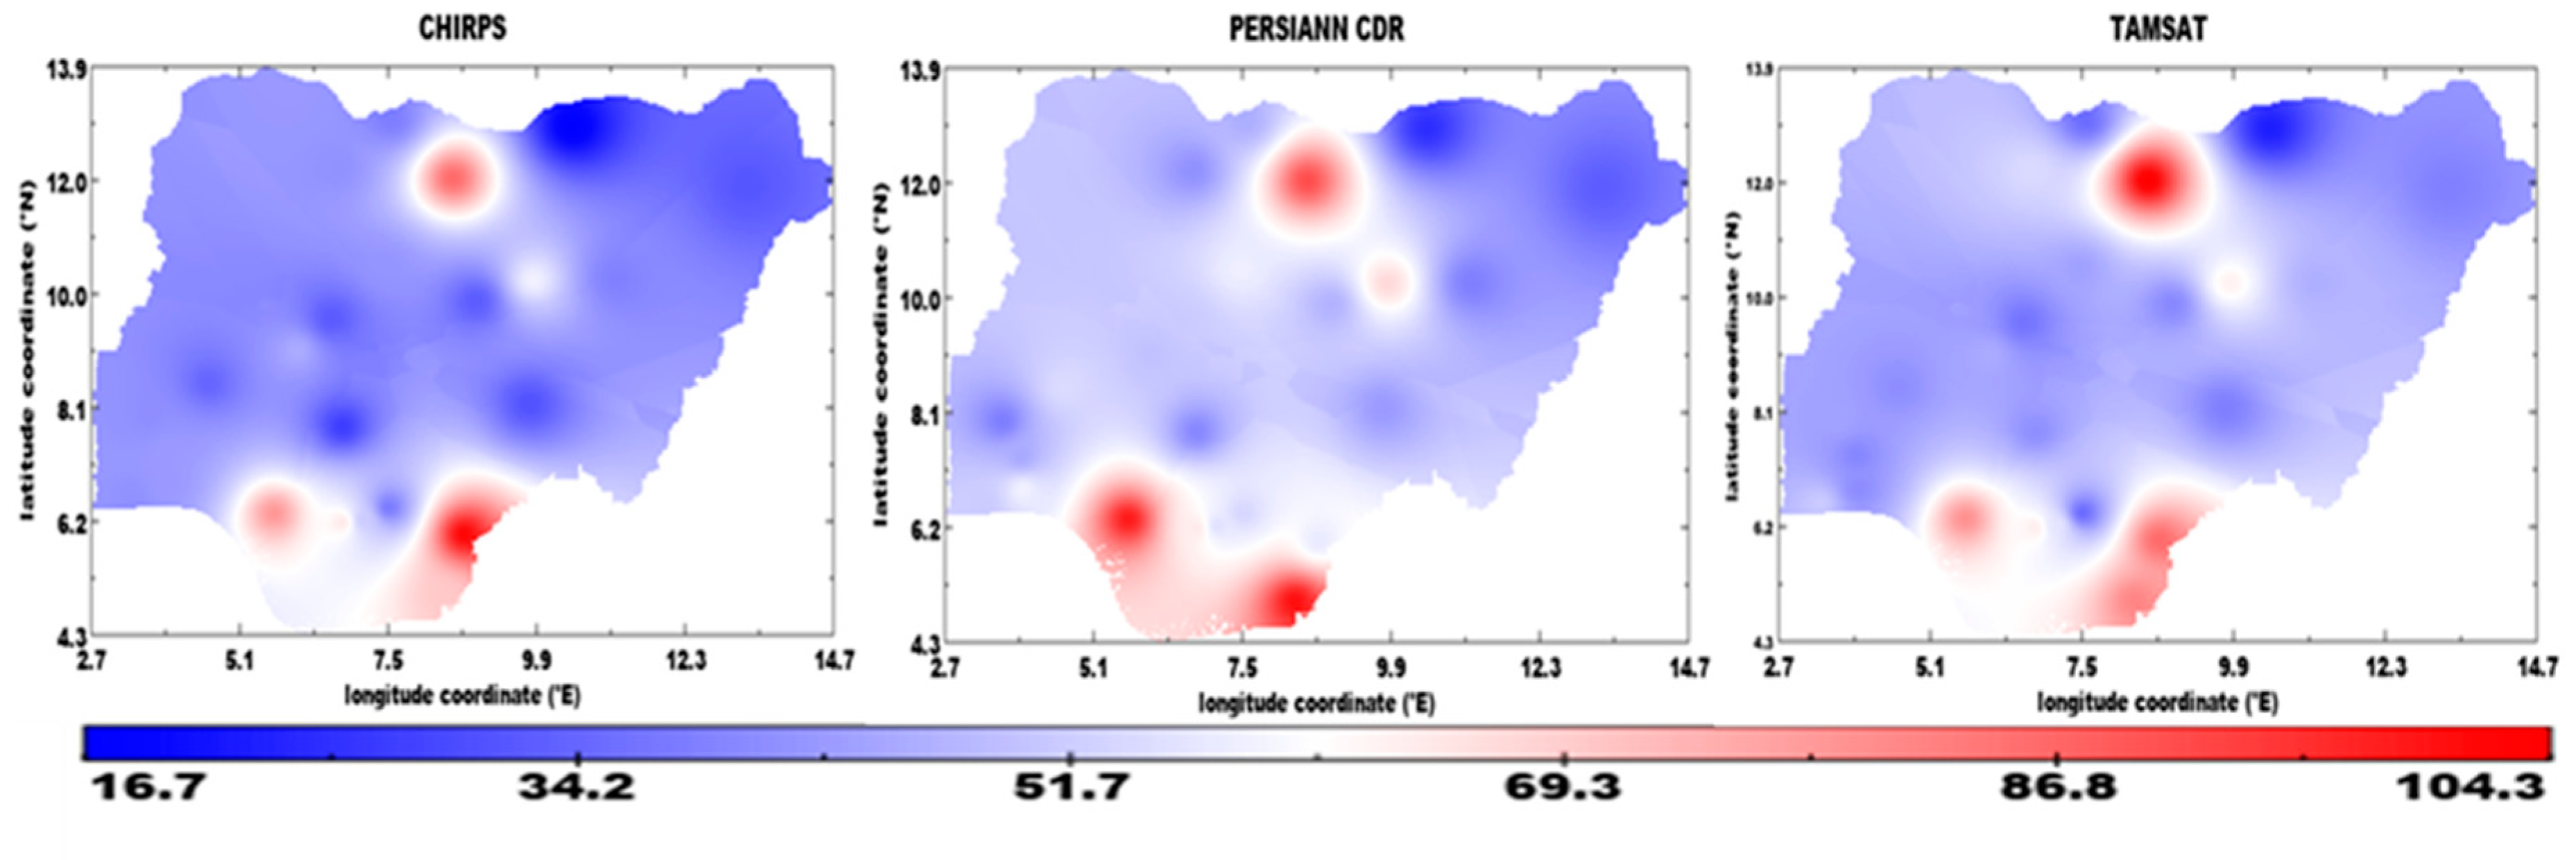
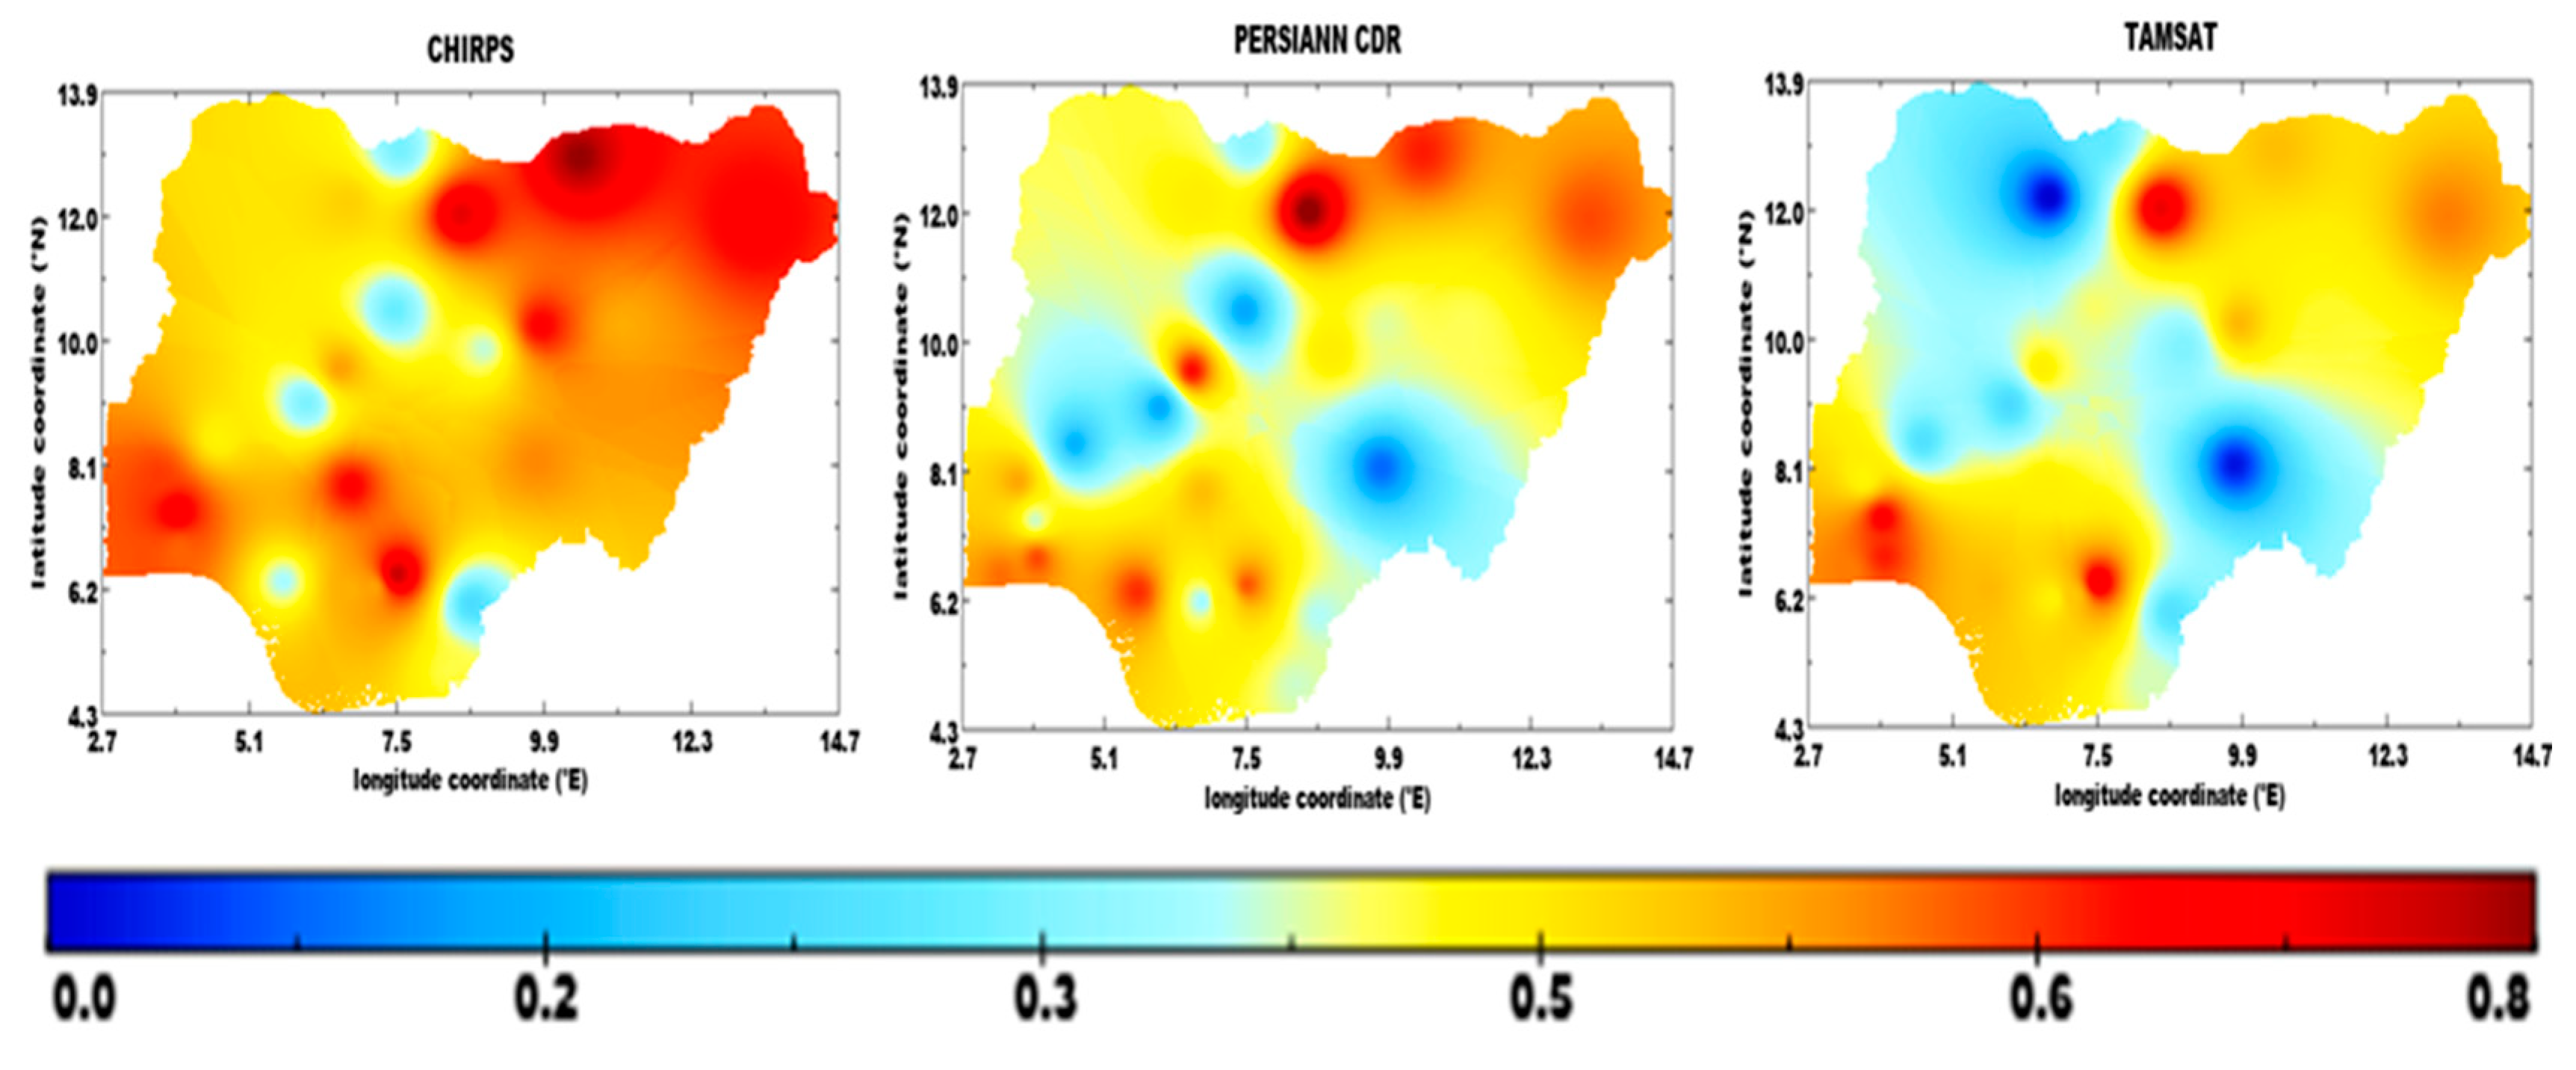
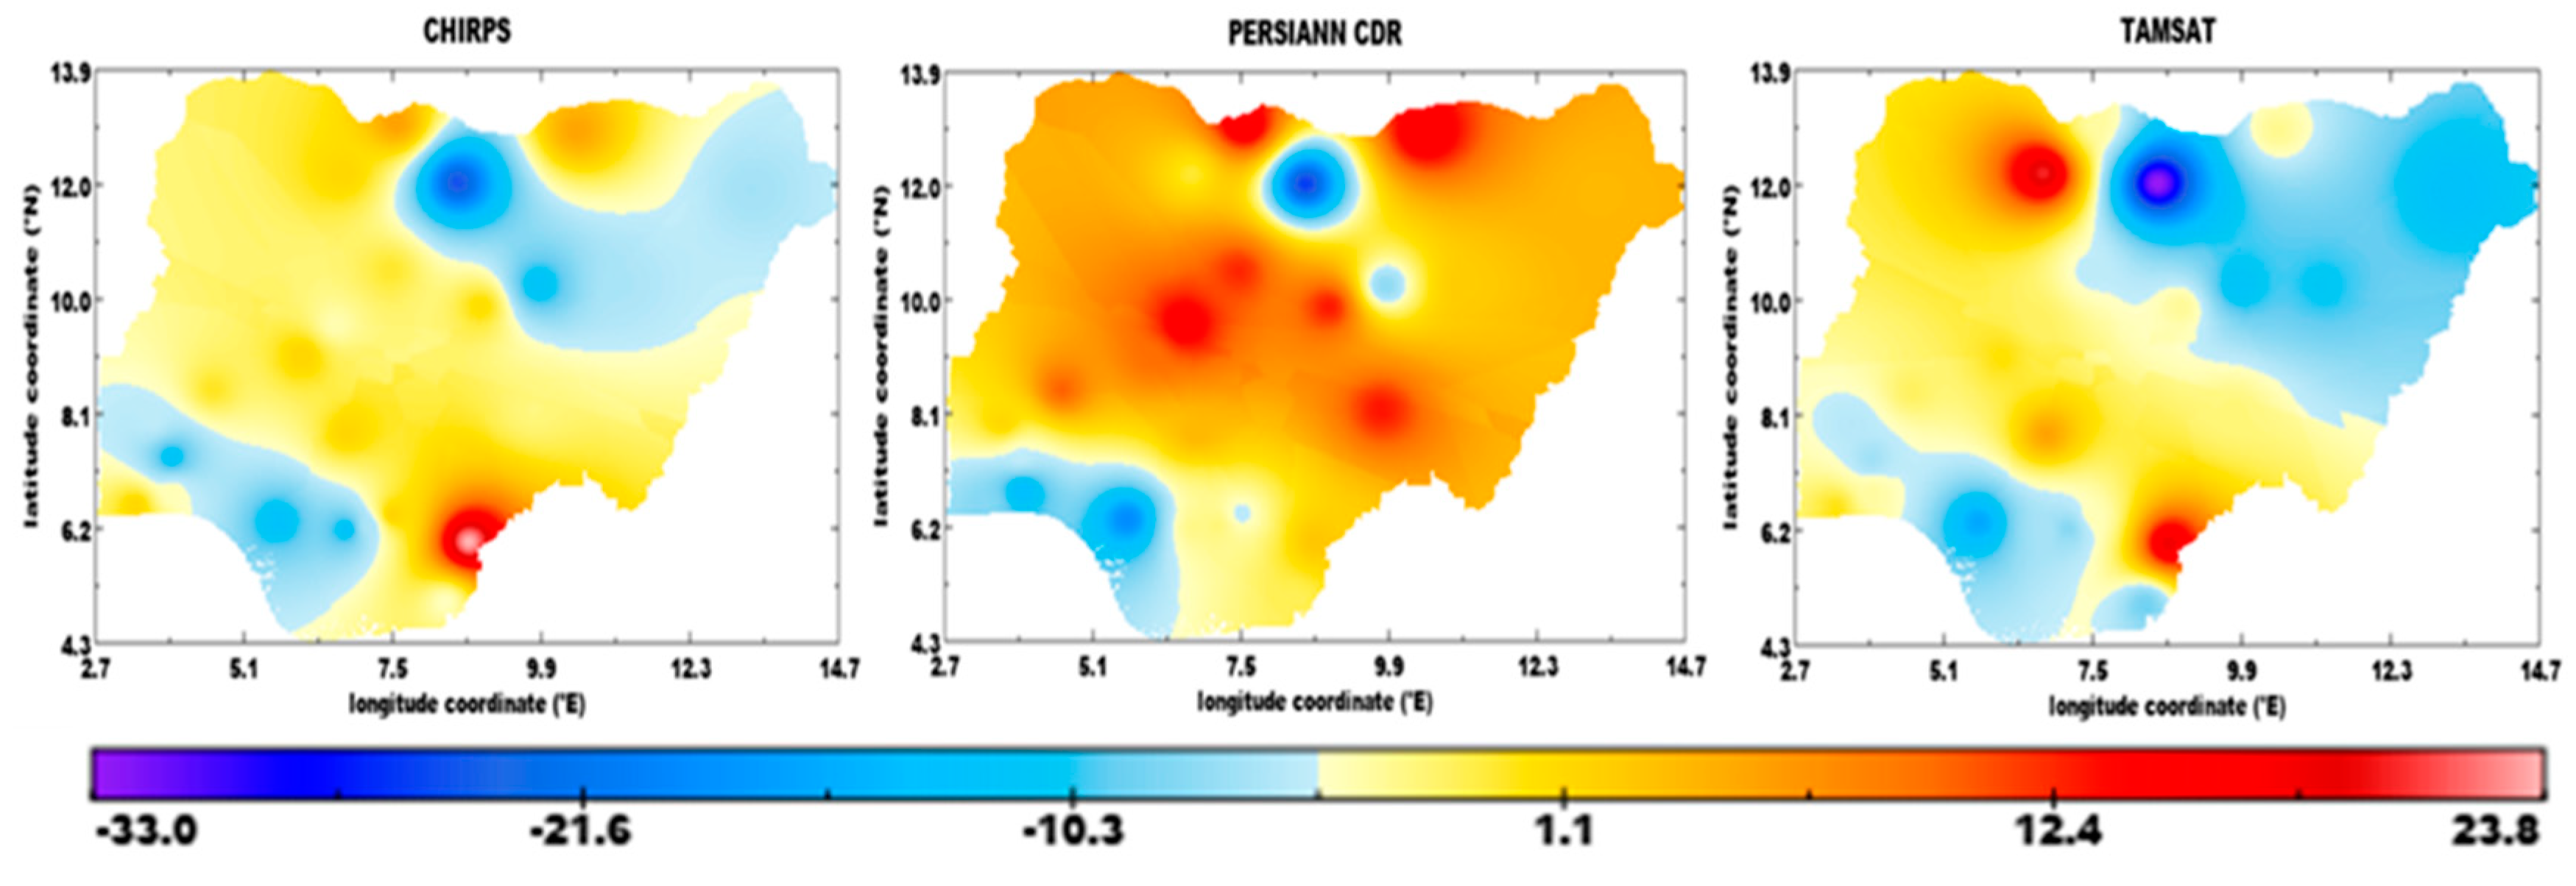
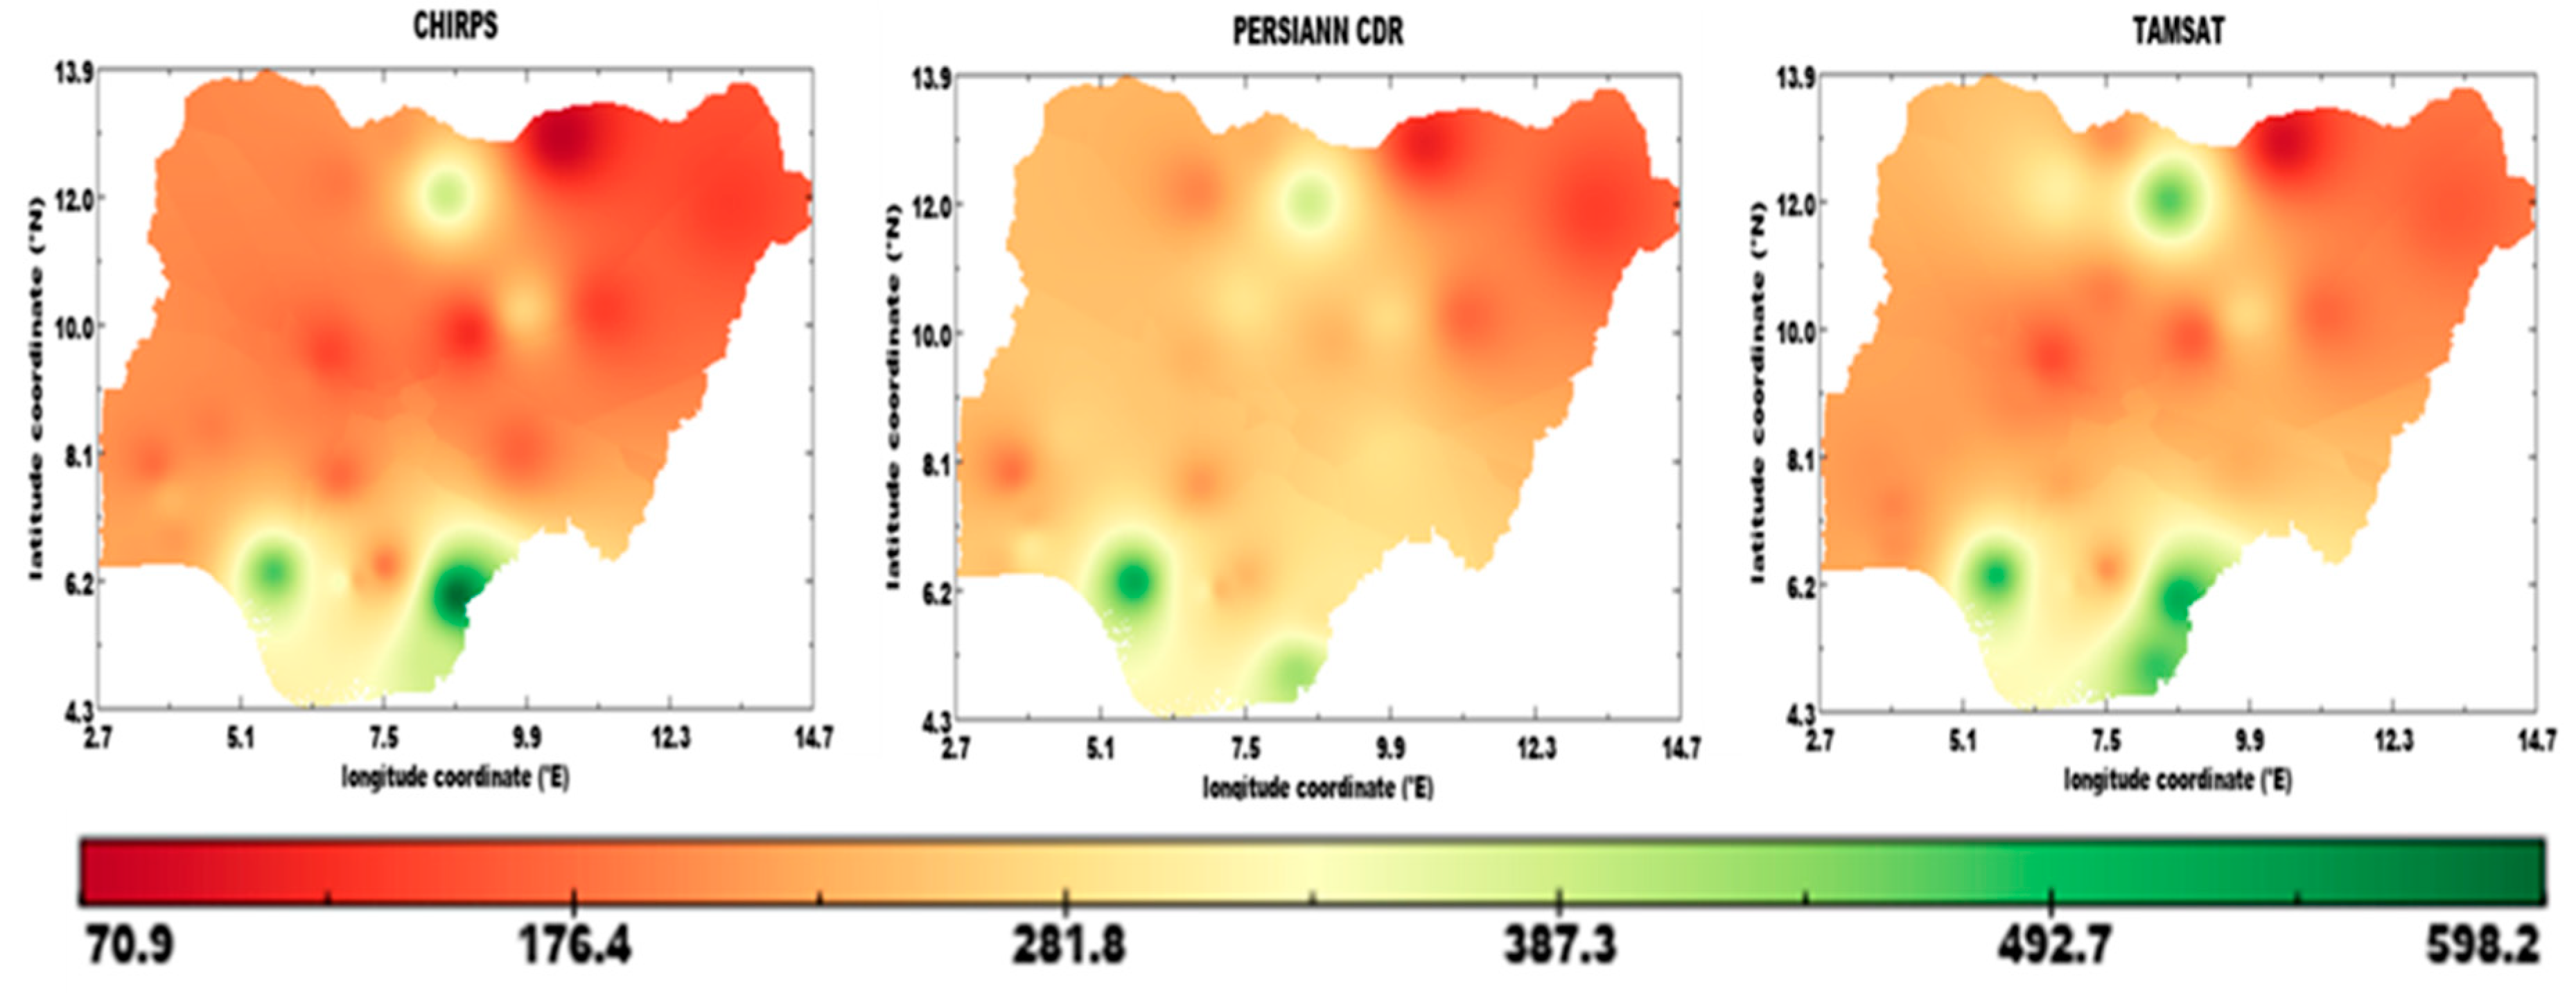
3.6. Evaluation of Satellite Rainfall Products

The capability of the satellite products in reproducing local rainfall characteristics at synoptic station-level was assessed using statistical methods. Results of these statistics at mean seasonal and annual time resolution for the period 1985–2013 are presented as spatial plots produced using the IDW interpolation method. Suitability of satellite products is dependent, not only on low RMSE and PBIAS values, but also on strong correlation coefficient between gauge and model values [31].

3.6.1. Inter-Annual Variation of Mean Seasonal Rainfall

The JJAS period was selected for evaluating the performance of the satellite products because, during this period, all three climatic zones in Nigeria experience rainfall [38]. Each satellite product was compared against gauge datasets using statistics: r, RMSE, and PBIAS, and are presented in Figure 6, Figure 7 and Figure 8, respectively. Within the Sahel (Figure 6), CHIRPS and PERSIANN performed satisfactory exhibiting good correlations (r > 0.5) against gauge data, except in Kastina (where r < 0.4). However, TAMSAT presented weak correlations (in Kastina and Gusau), with an r value of –0.01 at Gusau. Results also indicate statistical significance at 95% confidence level for all products, except in Kastina. The spatial plot of the satellite product bias (Figure 7) exhibits low bias in the range –33.6 to 23.1% and RMSE (Figure 8) of 86–104 mm in Kano.
Results within the Savannah zone (Figure 6) show that the gridded products generally were not suitable in simulating seasonal JJAS rainfall within this zone. Only the CHIRPS product reliably showed strong correlation (r > 0.5) in Bauchi, Gusau, Ilorin, and Ibi, but was not suitable (r < 0.5) at Bida, Kaduna, and Minna. PERSIAN and TAMSAT exhibited weak correlations (r < 0.4) at all locations, except that TAMSAT performed well at Bauchi (r = 0.6). However, low bias (Figure 7) and RMSE (Figure 8) were mostly prevalent over the Savanna zone.
In the Guinea coast zone (Figure 6), CHIRPS was more suitable and shows reasonable correlation with gauge datasets except at Ikom, where it exhibited weak correlation (r = 0.07) in comparison to PERSIANN(r = 0.3) and TAMSAT (0.1). Consequently, the correlation between CHIRPS and gauge were found to be significant at 95% confidence level, except at Ikom and Calabar. Furthermore, CHIRPS and TAMSAT exhibit bias of 26.3% and 20.3%, respectively. The RMSE values of above 78 mm were observed in Benin, Calabar, and Ikom were consistent for all products. Generally, the CHIRPS products showed good results during the JJAS rainfall season as compared to other products under study.

3.6.2. Inter-Annual Variation of Mean Annual Rainfall

The results in this section reveal the inter-annual variation of annual rainfall (mm/year) of all products. Findings from Figure 9 show that CHIRPS was able to reproduce observed annual rainfall with good correlation values (r > 0.4) at Bida, Ikom, Kaduna, and Katsina. A greater portion of the Savannah zone was not well captured by the PERSIANN and TAMSAT data. The northwest region of the Sahel zone was also poorly represented by the TAMSAT product, exhibiting low correlation of less than 0.4.
The spatial plot of satellite products bias from gauge datasets is depicted in Figure 10. Both CHIRPS and TAMSAT show the same pattern of bias with model overestimations of gauge datasets visible in southwestern and northeastern Nigeria. Both products overestimated gauge record in Savannah and the northwestern region of Nigeria.
The pattern of the RMSE (Figure 11) for all satellite products show a gradient from south to north, with RMSE values of above 300 mm within the Guinea zone (Benin, Calabar, Ikom) and Sahel (Kano).

4. Conclusions

In recent times, the easy accessibility of high-quality satellite rainfall products over Africa has stirred up research activities in rainfall-dependent sectors. Most applications at regional scales showed promising results and underscored the utility of these products in data-scarce regions. In this study, the capabilities of the CHIRPS, PERSIANN, and TAMSAT to reproduced local rainfall characteristics in Nigeria from 1983 to 2013 were evaluated at point-location scale. Satellite products performances were analyzed at seasonal, inter-seasonal, and inter-annual time scales using statistical approaches.
Findings from the spatial distribution of seasonal rainfall showed that all of the products followed the same pattern, depicting the south (high) to north (low) gradient of rainfall amount. All products visibly captured this trend during the early (MAM) and late (SON) season, but poorly reproduced it during the heavy rainfall period (JJA and JJAS). The satellite products captured the unimodal and bimodal trend of rainfall peaks, with high RMSE values observed in locations within the Guinea coast climatic zone. The products with varying magnitude of accuracy simulated the inter-annual variations of local rainfall anomaly. The pattern of frequency of monthly rainfall occurrence was also in agreement with gauge datasets, but with varying accuracy. It is worthy to note that CHIRPS performed better than other products in reproducing local rainfall climatology in most locations.
Within the Sahel, a significant increasing trend was accurately reproduced by all products at the annual time series except at Gusau, where only CHIRPS and gauge datasets exhibited a similar trend. At the seasonal time series, variations in capturing significant trends exist at different locations and for different products. Generally, product evaluation statistics show that CHIRPS scored high correlation (r > 0.5) in many of the locations within all zones. However, all the SRPs agree less with the observed data in areas around the southern and northwestern axis of Nigeria.

Author Contributions

Conceptualization, K.N.O. and B.T.; methodology, K.N.O. and B.T.; software implementation, K.N.O. and N.R.H.; formal analysis, K.N.O. and N.R.H.; data curation, K.N.O. and I.E.G.; writing—original draft preparation, K.N.O., N.R.H., I.E.G., and B.T.; writing—review and editing, K.N.O.; supervision, B.T.; funding acquisition, K.N.O. and B.T. All authors have read and agreed to the published version of the manuscript.

Funding

This research was funded by the Department of Ecology and Natural Resources Management, Center for Development Research, University of Bonn, Germany.

Acknowledgments

The first author is a junior researcher at the Center for Development Research (ZEF), University of Bonn, Germany, and wishes to acknowledge ZEF for providing funding for fieldwork and laboratory/facilities for this research. We are grateful to the Nigerian Meteorological Agency (NiMet) for providing access to the station-based gauge data used in this study. The Federal Government of Nigeria through Nnamdi Azikiwe University, Awka, sponsored the first author for this research program.

Conflicts of Interest

The authors declare no conflict of interest.

References

  1. Dembélé, M.; Zwart, S.J. Evaluation and comparison of satellite-based rainfall products in Burkina Faso, West Africa. Int. J. Remote Sens. 2016, 37, 3995–4014. [Google Scholar] [CrossRef] [Green Version]
  2. Fall, C.M.N.; Lavaysse, C.; Drame, M.S.; Panthou, G.; Gaye, A.T. Wet and dry spells in Senegal: Evaluation of satellite-based and model re-analysis rainfall estimates. Nat. Hazards Earth Syst. Sci. Discuss. 2019, 1–29. [Google Scholar] [CrossRef] [Green Version]
  3. Pellarin, T.; Román-Cascón, C.; Baron, C.; Bindlish, R.; Brocca, L.; Camberlin, P.; Fernández-Prieto, D.; Kerr, Y.H.; Massari, C.; Panthou, G.; et al. The Precipitation Inferred from Soil Moisture (PrISM) Near Real-Time Rainfall Product: Evaluation and Comparison. Remote Sens. 2020, 12, 481. [Google Scholar] [CrossRef] [Green Version]
  4. Usman, M.; Nichol, J.E.; Ibrahim, A.T.; Buba, L.F. A spatio-temporal analysis of trends in rainfall from long term satellite rainfall products in the Sudano Sahelian zone of Nigeria. Agric. For. Meteorol. 2018, 260–261, 273–286. [Google Scholar] [CrossRef]
  5. Gebrechorkos, S.H.; Hülsmann, S.; Bernhofer, C. Evaluation of multiple climate data sources for managing environmental resources in East Africa. Hydrol. Earth Syst. Sci. 2018, 22, 4547–4564. [Google Scholar] [CrossRef] [Green Version]
  6. Le Coz, C.; Van De Giesen, N. Comparison of rainfall products over sub-saharan africa. J. Hydrometeorol. 2020, 21, 553–596. [Google Scholar] [CrossRef]
  7. Akinyemi, D.F.; Ayanlade, O.S.; Nwaezeigwe, J.O.; Ayanlade, A. A Comparison of the Accuracy of Multi-satellite Precipitation Estimation and Ground Meteorological Records Over Southwestern Nigeria. Remote Sens. Earth Syst. Sci. 2019, 1–12. [Google Scholar] [CrossRef]
  8. Dinku, T.; Funk, C.; Peterson, P.; Maidment, R.; Tadesse, T.; Gadain, H.; Ceccato, P. Validation of the CHIRPS satellite rainfall estimates over eastern Africa. Q. J. R. Meteorol. Soc. 2018, 144, 292–312. [Google Scholar] [CrossRef] [Green Version]
  9. Satgé, F.; Ruelland, D.; Bonnet, M.-P.; Molina, J.; Pillco, R. Consistency of satellite-based precipitation products in space and over time compared with gauge observations and snow- hydrological modelling in the Lake Titicaca region. Hydrol. Earth Syst. Sci. 2019, 23, 595–619. [Google Scholar] [CrossRef] [Green Version]
  10. Funk, C.; Peterson, P.; Landsfeld, M.; Pedreros, D.; Verdin, J.; Shukla, S.; Husak, G.; Rowland, J.; Harrison, L.; Hoell, A.; et al. The climate hazards infrared precipitation with stations—A new environmental record for monitoring extremes. Sci. Data 2015, 2, 1–21. [Google Scholar] [CrossRef] [Green Version]
  11. Ashouri, H.; Hsu, K.-L.; Sorooshian, S.; Braithwaite, D.K.; Knapp, K.R.; Cecil, L.D.; Nelson, B.R.; Prat, O.P. PERSIANN-CDR: Daily Precipitation Climate Data Record from Multisatellite Observations for Hydrological and Climate Studies. Bull. Am. Meteorol. Soc. 2015, 96, 69–83. [Google Scholar] [CrossRef] [Green Version]
  12. Maidment, R.I.; Grimes, D.; Allan, R.P.; Tarnavsky, E.; Stringer, M.; Hewison, T.; Roebeling, R.; Black, E. The 30 year TAMSAT African Rainfall Climatology And Time series (TARCAT) data set. J. Geophys. Res. Atmos. 2014, 119, 10619–10644. [Google Scholar] [CrossRef] [Green Version]
  13. Tarnavsky, E.; Grimes, D.; Maidment, R.; Black, E.; Allan, R.P.; Stringer, M.; Chadwick, R.; Kayitakire, F. Extension of the TAMSAT satellite-based rainfall monitoring over Africa and from 1983 to present. J. Appl. Meteorol. Climatol. 2014, 53, 2805–2822. [Google Scholar] [CrossRef] [Green Version]
  14. Ayehu, G.T.; Tadesse, T.; Gessesse, B.; Dinku, T. Validation of new satellite rainfall products over the Upper Blue Nile Basin, Ethiopia. Atmos. Meas. Tech. 2018, 11, 1921–1936. [Google Scholar] [CrossRef] [Green Version]
  15. Romilly, T.G.; Gebremichael, M. Evaluation of satellite rainfall estimates over Ethiopian river basins. Hydrol. Earth Syst. Sci. 2011, 15, 1505–1514. [Google Scholar] [CrossRef] [Green Version]
  16. Larbi, I.; Hountondji, F.C.C.; Annor, T.; Agyare, W.A.; Gathenya, J.M.; Amuzu, J. Spatio-temporal trend analysis of rainfall and temperature extremes in the Vea catchment, Ghana. Climate 2018, 6, 87. [Google Scholar] [CrossRef] [Green Version]
  17. Hassan, I.; Kalin, R.M.; White, C.J.; Aladejana, J.A. Evaluation of Daily Gridded Meteorological Datasets over the Niger Delta Region of Nigeria and Implication to Water Resources Management. Atmos. Clim. Sci. 2020, 10, 21–39. [Google Scholar] [CrossRef] [Green Version]
  18. Poméon, T.; Diekkrüger, B.; Springer, A.; Kusche, J.; Eicker, A. Multi-Objective Validation of SWAT for Sparsely-Gauged West African River Basins—A Remote Sensing Approach. Water 2018, 10, 451. [Google Scholar] [CrossRef] [Green Version]
  19. Oyerinde, G.T.; Fademi, I.O.; Denton, O.A. Modeling runoff with satellite-based rainfall estimates in the Niger basin. Cogent Food Agric. 2017, 3, 1363340. [Google Scholar] [CrossRef]
  20. Akande, A.; Costa, A.C.; Mateu, J.; Henriques, R. Geospatial Analysis of Extreme Weather Events in Nigeria (1985-2015) Using Self-Organizing Maps. Adv. Meteorol. 2017, 217, 8576150. [Google Scholar] [CrossRef] [Green Version]
  21. Ogungbenro, S.B.; Morakinyo, T.E. Rainfall distribution and change detection across climatic zones in Nigeria. Weather Clim. Extrem. 2014, 5–6, 1–6. [Google Scholar] [CrossRef] [Green Version]
  22. Abatan, A.A.; Abiodun, B.J.; Lawal, K.A.; Gutowski, W.J. Trends in extreme temperature over Nigeria from percentile-based threshold indices. Int. J. Climatol. 2016, 36, 2527–2540. [Google Scholar] [CrossRef]
  23. Gbode, I.E.; Adeyeri, O.E.; Menang, K.P.; Intsiful, J.D.K.; Ajayi, V.O.; Omotosho, J.A.; Akinsanola, A.A. Observed changes in climate extremes in Nigeria. Meteorol. Appl. 2019, 26, 642–654. [Google Scholar] [CrossRef] [Green Version]
  24. Poméon, T.; Jackisch, D.; Diekkrüger, B. Evaluating the performance of remotely sensed and reanalysed precipitation data over West Africa using HBV light. J. Hydrol. 2017, 547, 222–235. [Google Scholar] [CrossRef]
  25. Wang, X.L.; Chen, H.; Wu, Y.; Feng, Y.; Pu, Q. New techniques for the detection and adjustment of shifts in daily precipitation data series. J. Appl. Meteorol. Climatol. 2010, 49, 2416–2436. [Google Scholar] [CrossRef]
  26. Wang, X.L.; Feng, Y. RHtests_dlyPrcp User Manual; Climate Research Division, Atmospheric Science and Technology Directorate, Science and Technology Branch, Environment Canada: Toronto, ON, Canada, 2013; 17p. [Google Scholar]
  27. McKee, T.B.; Doesken, N.J.; Kleist, J. The relationship of drought frequency and duration to time scales. In Proceedings of the 8th Conference of Applied Climatology, Anaheim, CA, USA, 17–22 January 1993. [Google Scholar]
  28. Kendall, M. Rank Correlation Methods, 4th ed.; Charles Griffin: London, UK, 1975. [Google Scholar]
  29. Adeyeri, O.E.; Lawin, A.E.; Laux, P.; Ishola, K.A.; Ige, S.O. Analysis of climate extreme indices over the Komadugu-Yobe basin, Lake Chad region: Past and future occurrences. Weather Clim. Extrem. 2019, 23, 100194. [Google Scholar] [CrossRef]
  30. Okafor, G.C.; Ogbu, K.N. Assessment of the impact of climate change on the freshwater availability of Kaduna River basin, Nigeria. J. Water Land Dev. 2018, 38, 105–114. [Google Scholar] [CrossRef] [Green Version]
  31. Akinsanola, A.A.; Ajayi, V.O.; Adejare, A.T.; Adeyeri, O.E.; Gbode, I.E.; Ogunjobi, K.O.; Nikulin, G.; Abolude, A.T. Evaluation of rainfall simulations over West Africa in dynamically downscaled CMIP5 global circulation models. Theor. Appl. Climatol. 2018, 132, 437–450. [Google Scholar] [CrossRef]
  32. Pool, S.; Vis, M.; Seibert, J. Evaluating model performance: Towards a non-parametric variant of the Kling-Gupta efficiency. Hydrol. Sci. J. 2018, 63, 1941–1953. [Google Scholar] [CrossRef]
  33. Knoben, W.J.M.; Freer, J.E.; Woods, R.A. Technical note: Inherent benchmark or not? Comparing Nash-Sutcliffe and Kling-Gupta efficiency scores. Hydrol. Earth Syst. Sci. 2019, 23, 4323–4331. [Google Scholar] [CrossRef] [Green Version]
  34. Ayugi, B.; Tan, G.; Gnitou, G.T.; Ojara, M.; Ongoma, V. Historical evaluations and simulations of precipitation over East Africa from Rossby centre regional climate model. Atmos. Res. 2020, 232, 104705. [Google Scholar] [CrossRef]
  35. Hofstra, N.; Haylock, M.; New, M.; Jones, P.; Frei, C. Comparison of six methods for the interpolation of daily, European climate data. J. Geophys. Res. Atmos. 2008, 113. [Google Scholar] [CrossRef] [Green Version]
  36. Chen, T.; Ren, L.; Yuan, F.; Yang, X.; Jiang, S.; Tang, T.; Liu, Y.; Zhao, C.; Zhang, L. Comparison of spatial interpolation schemes for rainfall data and application in hydrological modeling. Water 2017, 9, 342. [Google Scholar] [CrossRef] [Green Version]
  37. Yang, X.; Xie, X.; Liu, D.L.; Ji, F.; Wang, L. Spatial Interpolation of Daily Rainfall Data for Local Climate Impact Assessment over Greater Sydney Region. Adv. Meteorol. 2015, 2015, 563629. [Google Scholar] [CrossRef] [Green Version]
  38. Adeniyi, M.O.; Dilau, K. Seasonal prediction of precipitation over Nigeria. J. Sci. Technol. 2015, 35, 102–113. [Google Scholar] [CrossRef] [Green Version]
Figure 1. Digital Elevation Map of Nigeria (in metres above sea level) showing synoptic station locations within Guinea Coast, Savannah, and Sahel climatic zones [23].
Climate 08 00103 g001
Figure 2. Spatial distributions of mean seasonal rainfall amount (mm/month) for (a) MAM, (b) JJA, and (c) SON over Nigeria.
Climate 08 00103 g002aClimate 08 00103 g002b
Figure 3. Annual cycle of rainfall amount (mm) for (a) Nguru, (b) Jos, and (c) Iseyin, located in the Sahel, Savannah and Guinea Coast climatic zones, respectively.
Climate 08 00103 g003aClimate 08 00103 g003b
Figure 4. Inter-annual variations of standardized precipitation index (SPI) at (a) Kastina, (b) Bida, and (c) Ikom, located in the Sahel, Savannah and Guinea Coast climatic zones, respectively.
Climate 08 00103 g004aClimate 08 00103 g004b
Figure 5. Empirical cumulative distribution function (ECDF) of mean monthly rainfall (a) Kano in the Sahel, (b) Bauchi in Savannah and (c) Ikom in the Guinea Coast climatic zone.
Climate 08 00103 g005aClimate 08 00103 g005b
Figure 6. Correlation Coefficient of Mean JJAS Rainfall.
Climate 08 00103 g006
Figure 7. Percent bias (PBIAS) of mean JJAS rainfall.
Climate 08 00103 g007
Figure 8. Root mean square error (RMSE) of mean JJAS rainfall.
Climate 08 00103 g008
Figure 9. Correlation coefficient of annual rainfall (mm/year) over Nigeria.
Climate 08 00103 g009
Figure 10. Percent bias (PBIAS) of annual rainfall (mm/year)over Nigeria.
Climate 08 00103 g010
Figure 11. Root mean square error (RMSE) of annual rainfall (mm/year) over Nigeria.
Climate 08 00103 g011
Table 1. Meteorological Stations.
StationRegionLongitude (N)Latitude (E)Elevation (m)
AsabaGuinea coast6.736.1860
Awka 7.076.22100
Benin 5.636.3380
Calabar 8.324.9580
Enugu 7.486.43300
Ibadan 3.907.39200
Ijebu 3.936.8260
Ikeja 3.336.5840
Ikom 8.705.9740
Iseyin 3.607.97300
Lokoja 6.737.80180
Bauchi Savannah 9.8210.28600
Bida 6.019.08140
Gombe 11.1710.29440
Ibi 9.758.18120
Ilorin 4.578.53280
Jos 8.909.921160
Kaduna 7.4410.52580
Minna 6.559.62280
GusauSahel 6.6712.17420
Kano 8.5212.00460
Katsina 7.5313.00440
Maiduguri 13.2711.88280
Nguru 10.4512.88340
Table 2. Overview of satellite rainfall products.
Satellite ProductTemporal CoverageSpatial CoverageInstrumentSpatial ResolutionTemporal Resolution
CHIRPS1981–present50° N–50° SMW, IR, RG0.05°Daily
PERSIANN–CDR1983–present60° N–60° SMW, IR, RG0.25°Daily
TAMSAT1983–presentAfricaIR, RG0.0375°Daily
MW = microwave imager, IR = infrared, RG = rain gauge, CHIRPS = Climate Hazards Group InfraRed Precipitation with Station data; PERSIANN–CDR = Precipitation Estimation from Remotely Sensed Information using Artificial Neural Networks–Climate Data Record, TAMSAT = Tropical Applications of Meteorology using SATellite data and ground based observations.
Table 3. Root mean square error (RMSE) values (in mm) for all products with respect to gauged datasets.
StationRegionCHIRPSPERSIANN–CDRTAMSAT
AsabaGuinea coast28.328.323.6
Awka 19.122.822.8
Benin 29.449.135.5
Calabar 22.145.930.8
Enugu 12.924.211.8
Ibadan 21.118.111.7
Ijebu 20.434.114.8
Ikeja 21.227.020.6
Ikom 60.131.250.2
Iseyin 9.610.011.2
Lokoja 9.212.412.7
Bauchi Savannah 15.920.717.7
Bida 8.114.77.2
Gombe 15.812.320.8
Ibi 13.815.112.1
Ilorin 11.223.27.7
Jos 9.520.310.4
Kaduna 13.318.916.2
Minna 8.726.07.5
GusauSahel 13.515.237.7
Kano 35.645.748.5
Katsina 15.716.511.7
Maiduguri 6.84.811.4
Nguru 3.08.73.9
Table 4. Correlation of Annual Rainfall Anomalies for Satellite Products with Respect to Gauge Data.
StationRegionCHIRPSPERSIANN–CDRTAMSAT
AsabaGuinea coast0.560.380.49
Awka 0.540.470.56
Benin 0.370.660.56
Calabar 0.440.400.41
Enugu 0.770.610.75
Ibadan 0.670.410.68
Ijebu 0.610.630.69
Ikeja 0.620.600.63
Ikom 0.240.360.25
Iseyin 0.670.570.48
Lokoja 0.650.500.46
Bauchi Savannah 0.680.430.55
Bida 0.280.110.23
Gombe 0.550.420.44
Ibi 0.560.100.05
Ilorin 0.430.110.23
Jos 0.360.430.29
Kaduna 0.310.130.40
Minna 0.560.690.50
GusauSahel 0.480.480.02
Kano 0.760.830.76
Katsina 0.370.360.32
Maiduguri 0.740.710.64
Nguru 0.750.640.59
Table 5. Mann–Kendall statistics at annual and seasonal time series. JJAS = June–September.
StationDataAnnualMAMJJASSONClimatic Zone
GusauObserved0.200.92–0.95–0.82Sahel
CHIRPS0.82–0.310.820.71
PERSIANN 2.652.262.142.69
TAMSAT2.512.601.392.53
KanoObserved3.811.563.742.86
CHIRPS2.350.922.411.33
PERSIANN 3.091.943.372.35
TAMSAT3.031.143.032.46
KatsinaObserved3.062.672.581.36
CHIRPS2.310.742.341.22
PERSIANN 3.712.582.432.04
TAMSAT3.161.430.001.58
MaiduguriObserved3.640.733.261.97
CHIRPS2.112.112.071.22
PERSIANN 3.261.733.262.44
TAMSAT3.601.043.372.87
NguruObserved2.580.482.750.89
CHIRPS2.452.142.281.29
PERSIANN 3.742.143.772.58
TAMSAT3.881.343.882.21
Bauchi Observed3.94–0.644.081.87Savannah
CHIRPS2.11–0.952.180.44
PERSIANN 2.011.331.942.31
TAMSAT2.941.163.032.35
BidaObserved0.48–0.880.171.05
CHIRPS0.03–0.41–0.850.61
PERSIANN 2.552.580.752.79
TAMSAT2.512.601.392.53
GombeObserved0.65–1.630.580.85
CHIRPS1.330.171.291.87
PERSIANN 1.390.511.673.20
TAMSAT4.221.193.743.06
IbiObserved0.00–0.54–0.852.11
CHIRPS0.99–0.300.072.11
PERSIANN1.332.17–0.483.23
TAMSAT1.712.622.382.84
IlorinObserved0.41–0.100.002.24
CHIRPS1.33–0.750.513.63
PERSIANN1.671.46–0.173.23
TAMSAT2.711.631.162.75
JosObserved1.500.370.081.73
CHIRPS1.97–0.202.350.00
PERSIANN 2.452.521.431.84
TAMSAT3.842.653.602.28
Kaduna Observed1.600.710.921.80
CHIRPS0.92–0.030.200.14
PERSIANN3.431.702.752.72
TAMSAT4.012.693.062.33
MinnaObserved1.530.311.562.65
CHIRPS0.750.37–0.341.77
PERSIANN 3.092.620.822.86
TAMSAT3.202.991.923.33
AsabaObserved0.310.75–0.730.27Guinea
CHIRPS1.601.290.101.70
PERSIANN 0.241.16–2.281.02
TAMSAT3.303.161.803.03
AwkaObserved1.731.80–0.920.88
CHIRPS1.090.74–0.172.24
PERSIANN 0.511.90–2.412.10
TAMSAT3.813.711.873.16
BeninObserved2.312.861.122.67
CHIRPS0.170.92–0.311.12
PERSIANN 0.371.12–1.671.50
TAMSAT3.093.211.633.06
CalabarObserved2.650.882.110.54
CHIRPS2.410.102.44–0.24
PERSIANN 1.091.77–1.94–1.70
TAMSAT3.943.230.032.41
Enugu Observed2.281.121.194.39
CHIRPS1.121.700.511.84
PERSIANN1.052.28–1.532.62
TAMSAT3.573.941.943.23
Ibadan Observed1.090.201.362.31
CHIRPS0.54–0.990.002.31
PERSIANN 1.160.48–0.103.16
TAMSAT2.782.180.613.23
IjebuObserved3.170.252.452.57
CHIRPS1.770.140.542.24
PERSIANN 2.040.446–0.243.06
TAMSAT3.472.580.882.82
IkejaObserved1.830.840.812.78
CHIRPS1.050.410.070.20
PERSIANN 1.350.24–0.242.21
TAMSAT3.912.551.532.69
IkomObserved1.670.65–0.171.73
CHIRPS-0.030.20–1.560.85
PERSIANN 0.882.35–2.752.41
TAMSAT3.402.411.702.86
IseyinObserved1.050.100.032.04
CHIRPS1.90–0.200.002.79
PERSIANN 2.040.710.373.54
TAMSAT3.161.560.533.30
LokojaObserved0.681.46–0.480.99
CHIRPS0.85–0.270.341.60
PERSIANN 0.371.63–1.432.21
TAMSAT2.482.991.052.48
Positive (negative) Z-value indicates increasing (decreasing) trend. Bold values indicates significant trend at 95% confidence interval.

