An Investigation into the Spatial and Temporal Variability of the Meteorological Drought in Jordan

 , and
, and
Abstract
1. Introduction
1.1. Background
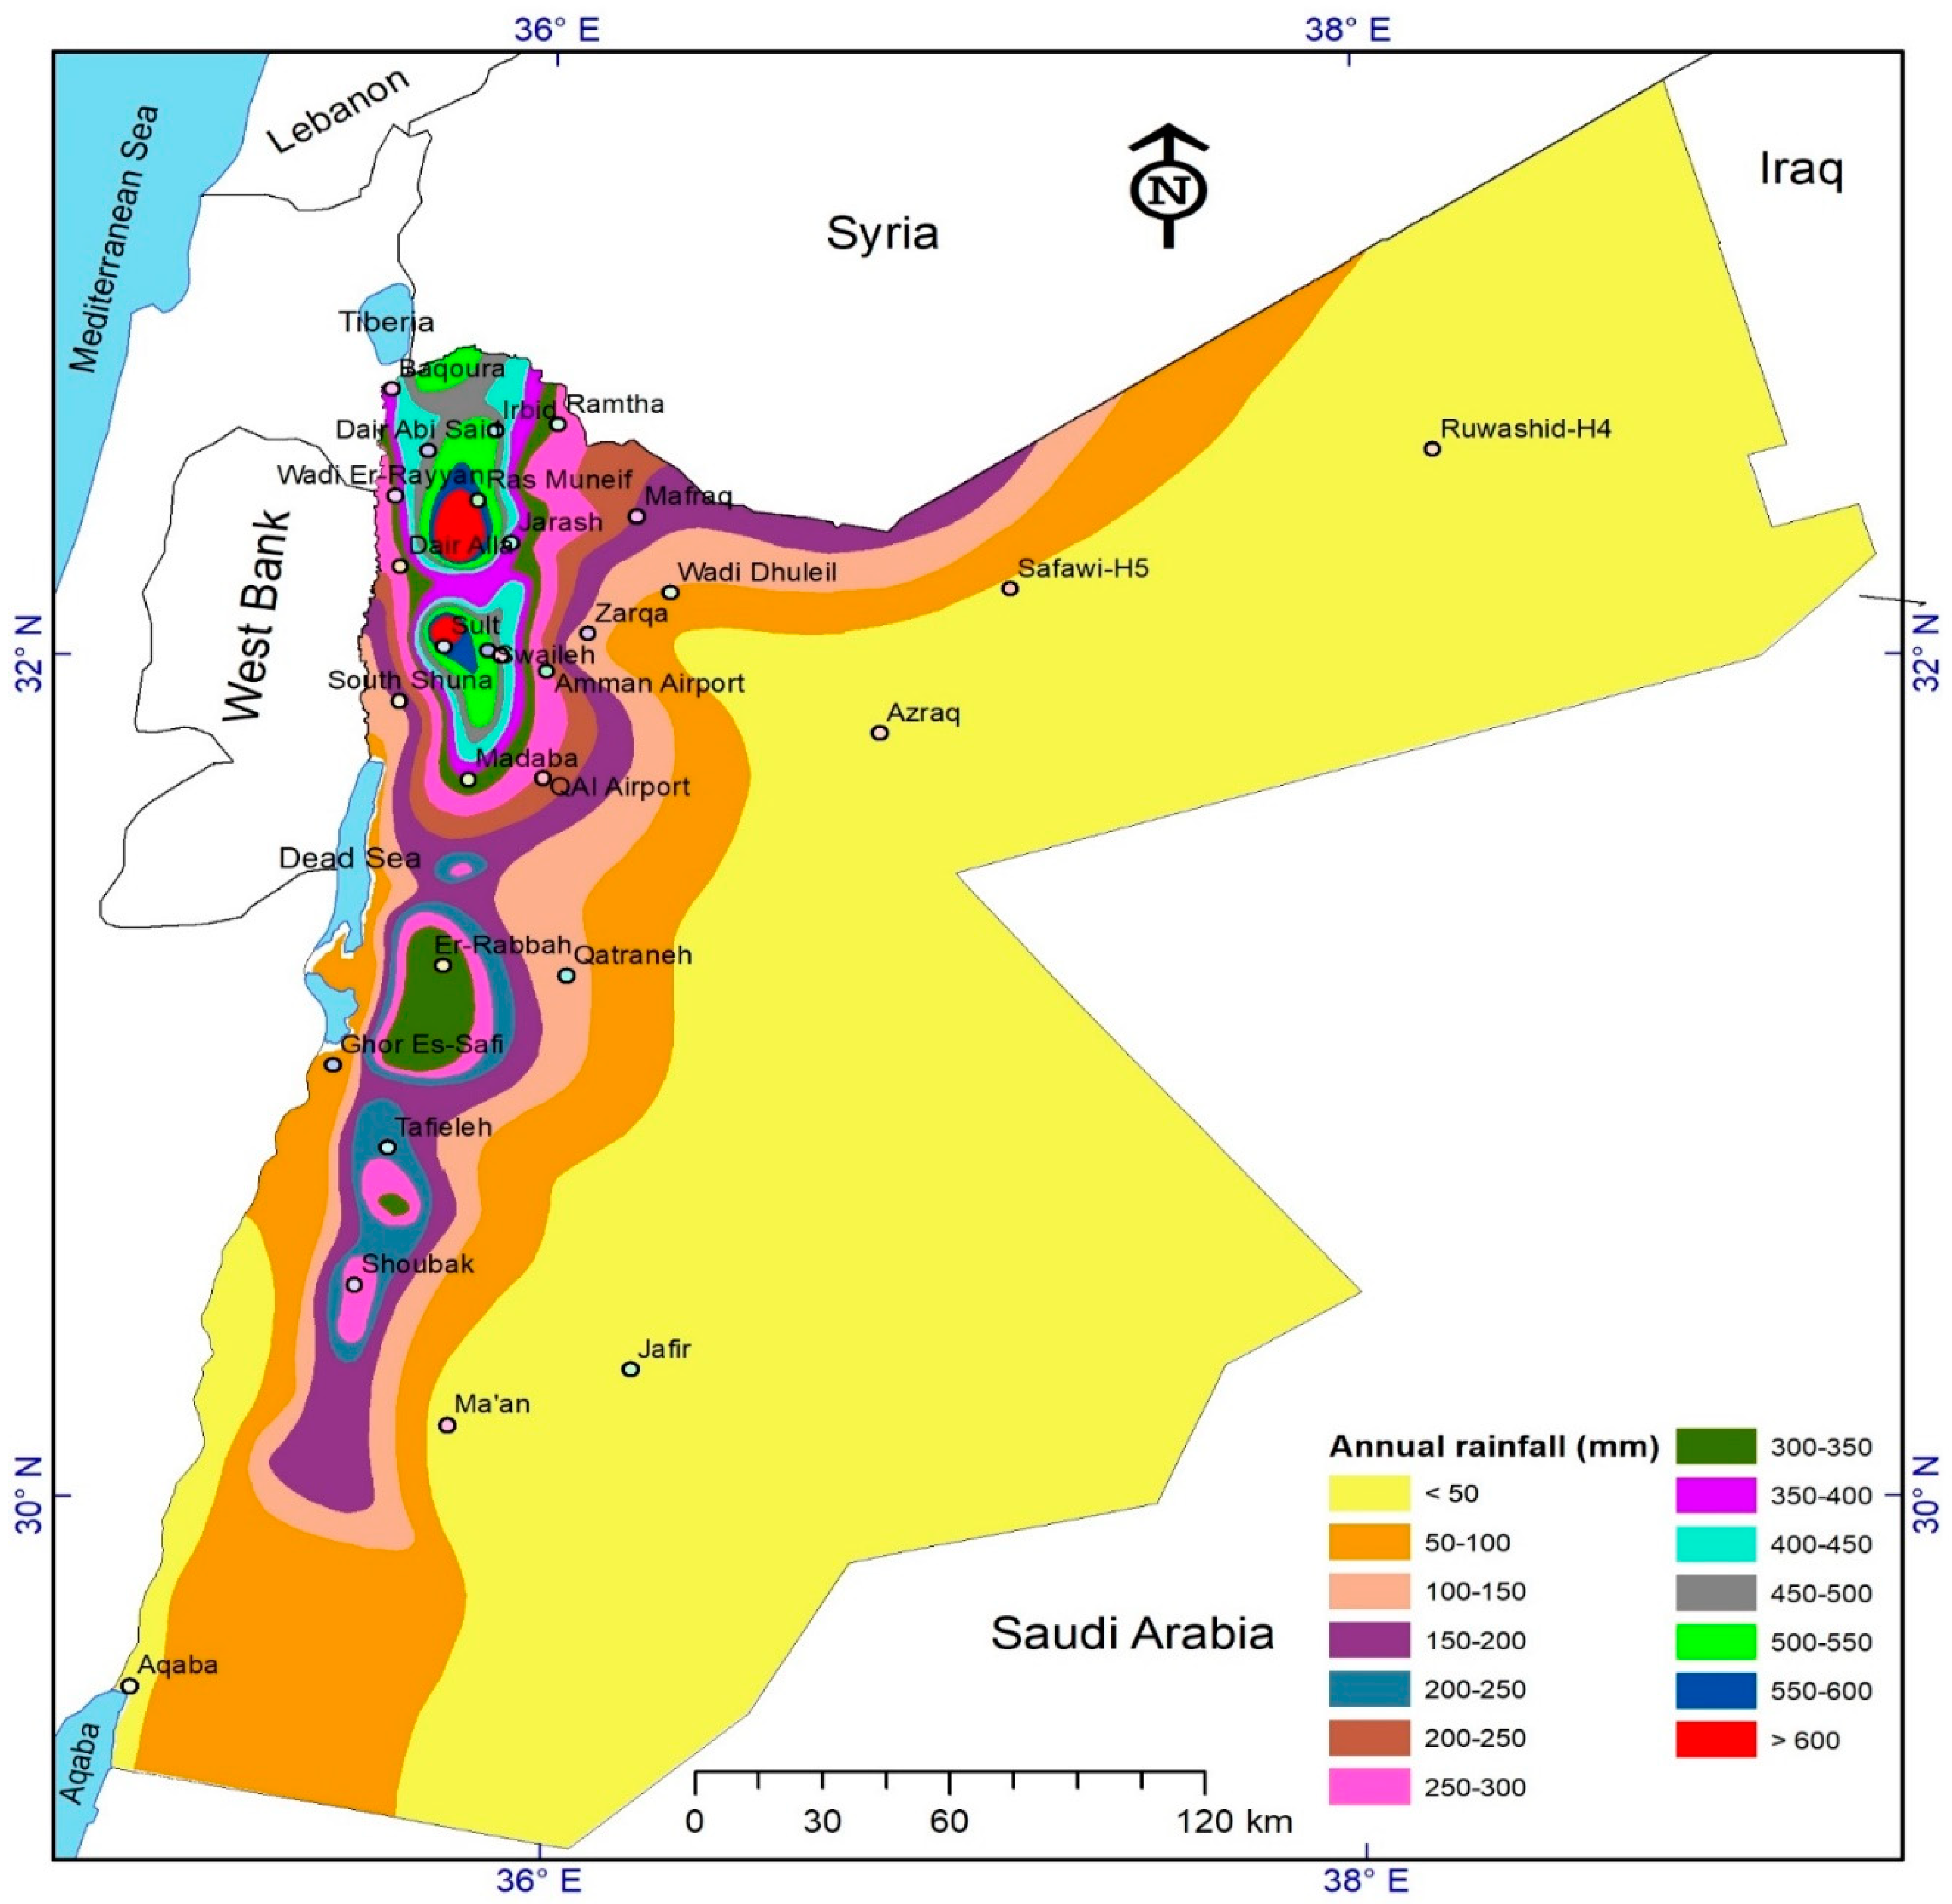
2. Study Area
- The highlands, that comprise mountainous and hilly regions that receive the largest rainfall, and occasionally snow.
- The Jordan Rift Valley (JRV), located west of the highlands, which is rich in water resources, making it fertile and thus primarily used for intensive agricultural practices.
- The desert, which occupies about 90% of the total area of the country and is distributed in the northern, central, and eastern regions (Figure 1).
3. Methodology and Data Analysis
3.1. Standardized Precipitation Index (SPI)
3.2. Areal Investigation
3.3. Cluster Investigation
4. Results and Discussion
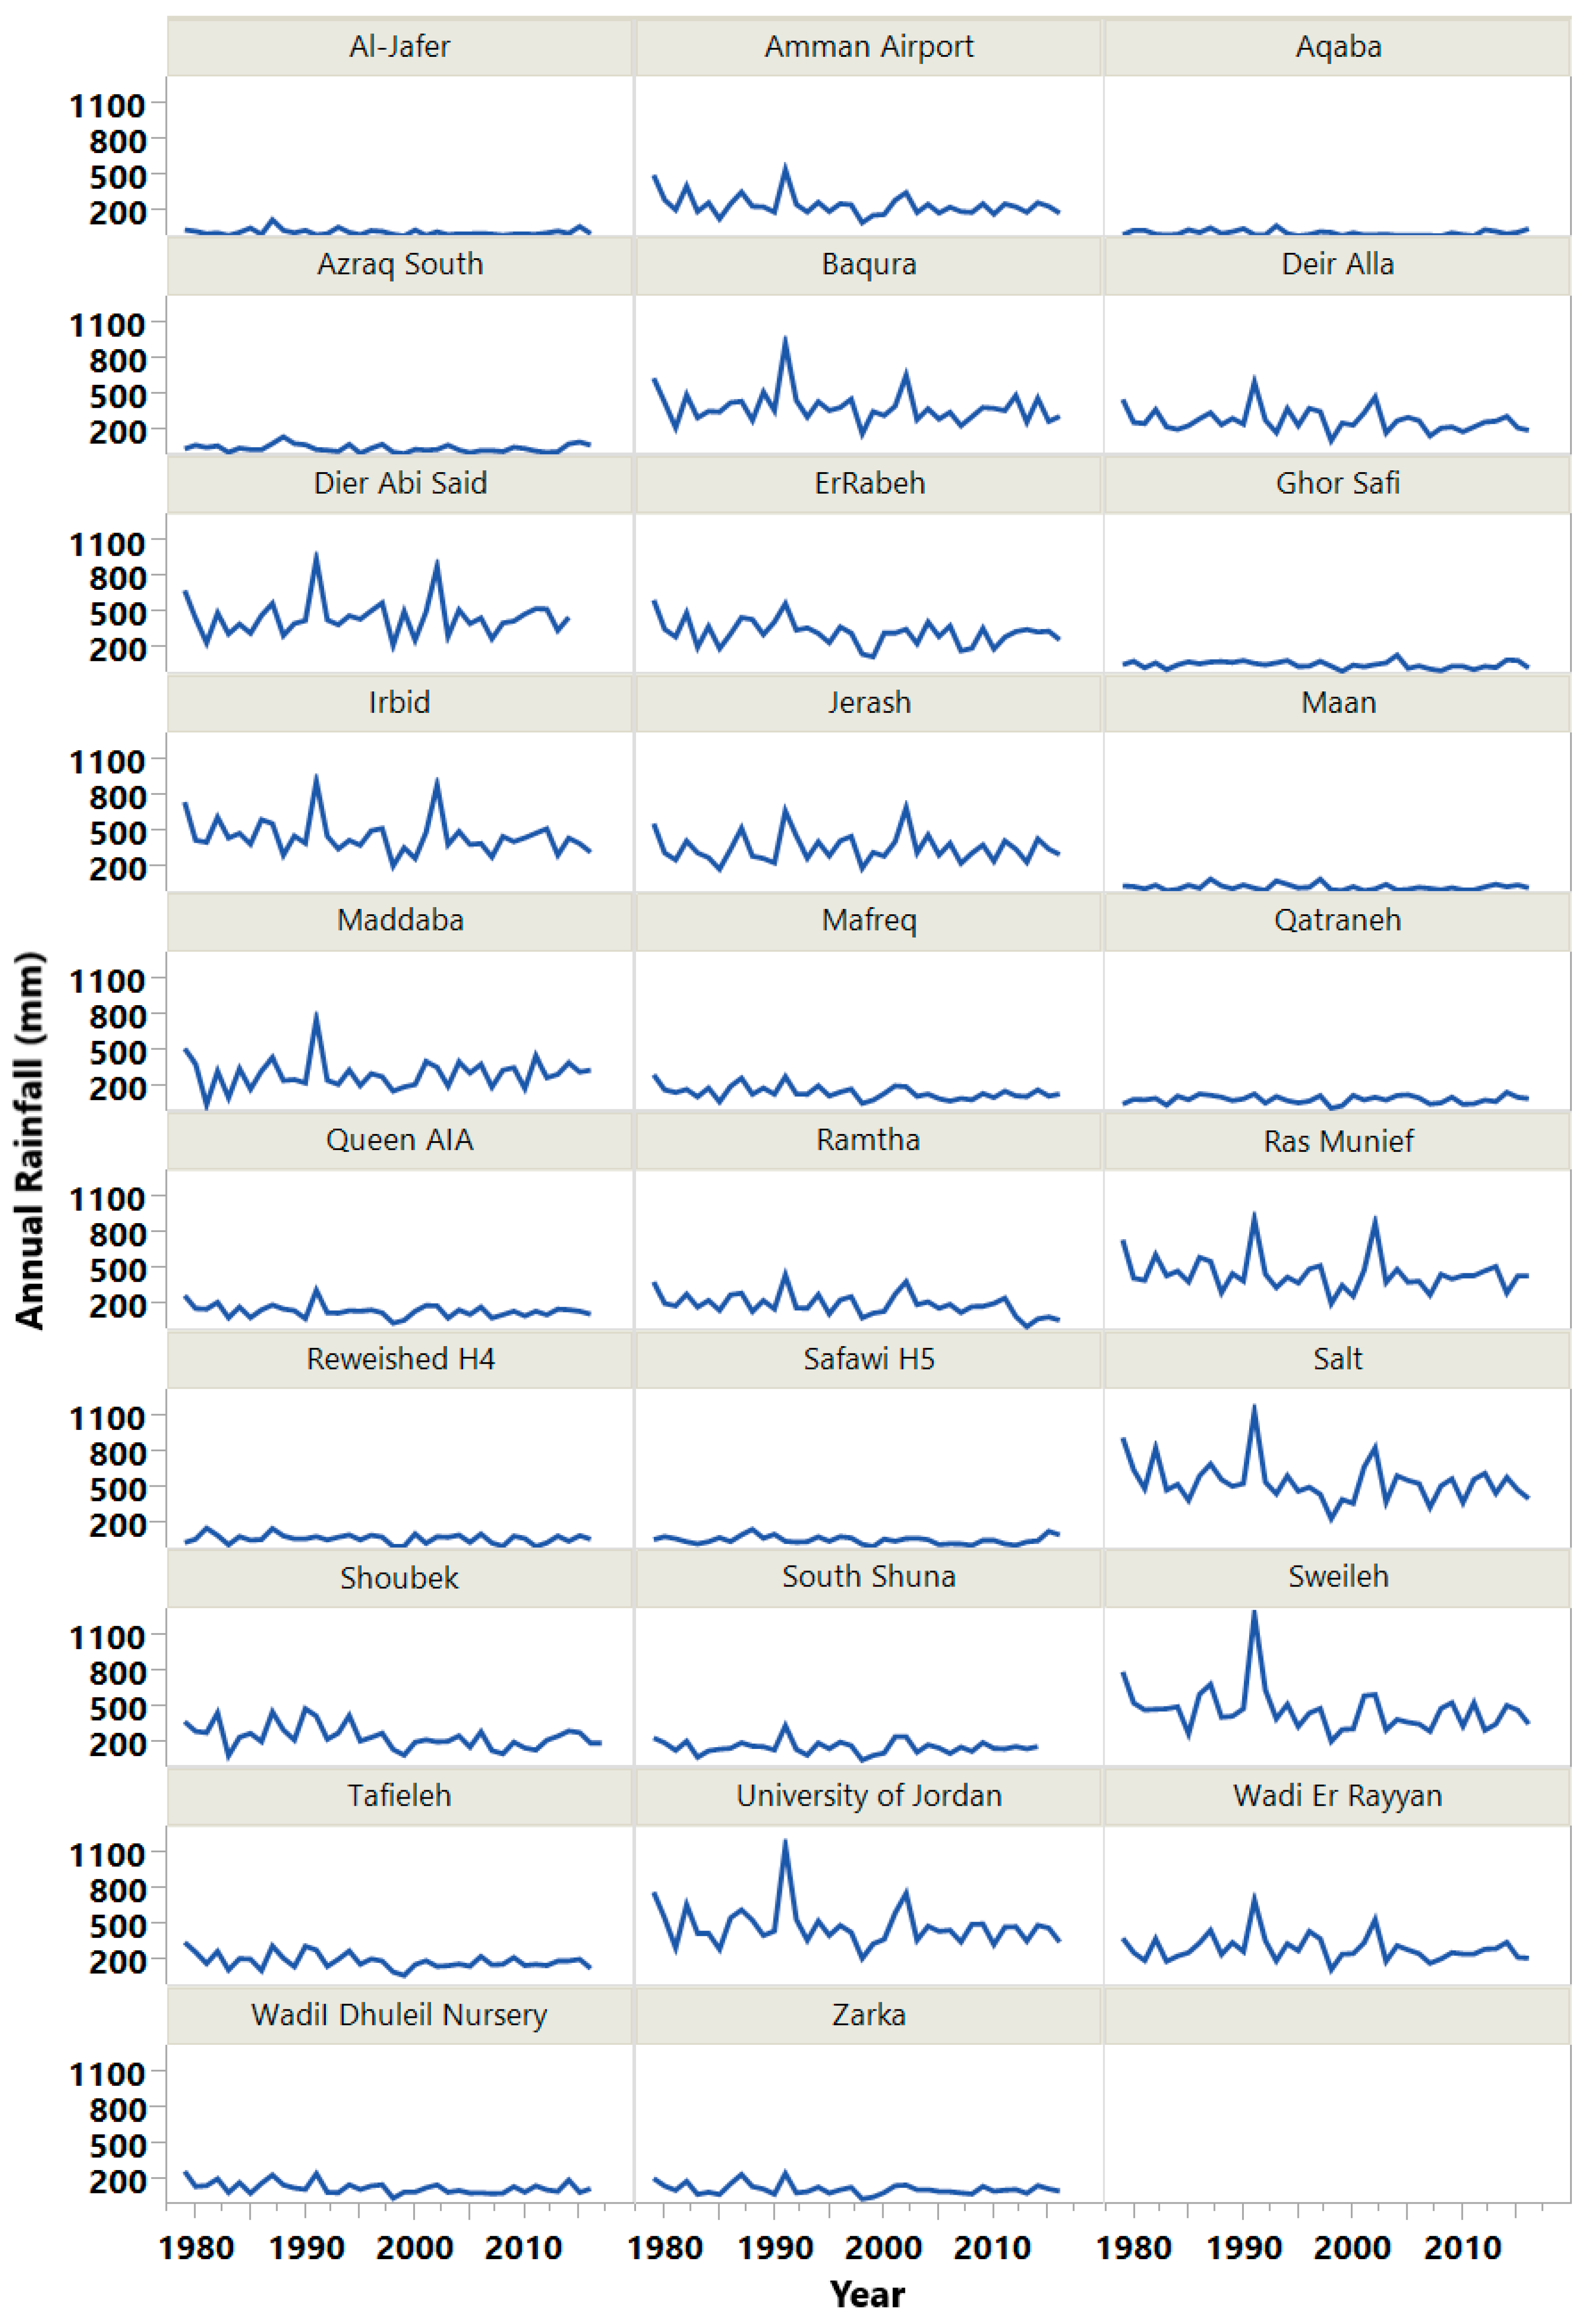
4.1. Investigating Rainfall Trends
4.2. Annual Standardized Precipitation Index (SPI12) Variability
4.3. Seasonal Standardized Precipitation Index (SPI6) Variability
4.4. Three-Months Standardized Precipitation Index (SPI3) Variability
4.5. Spatial Extent of Drought
4.6. Cluster Analysis
5. Conclusions
6. Declarations
Author Contributions
Funding
Acknowledgments
Conflicts of Interest
References
- Sivakumar, M.V.K. Natural Disasters and Extreme Events in Agriculture, Chapter 1of the Book titled: Impacts of Natural Disasters in Agriculture, Rangeland and Forestry: An Overview; Springer: Berlin/Heidelberg, Germany; New York, NY, USA, 2005. [Google Scholar]
- Karavitis, C.A. Drought and urban water supplies: The case of Metropolitan Athens. Water Pol. 1998, 1, 505–524. [Google Scholar] [CrossRef]
- Erian, W.; Katlan, B.; Babah, O. Drought Vulnerability in the Arab Region. Case Study: Drought in Syria Ten Years of Scarce Water (2000–2010). Available online: http://www.unisdr.org/files/23905_droughtsyriasmall.pdf (accessed on 10 June 2019).
- Sun, Y.; Solomon, S.; Dai, A.; Portmann, R.W. How often does it rain? J. Clim. 2006, 19, 916–934. [Google Scholar] [CrossRef]
- Vicente-Serrano, S.M.; Lopez-Moreno, J.I.; Begueria, S.; Lorenzo-Lacruz, J.; Sanchez-Lorenzo, A.; Garcia-Ruiz, J.M.; Azorin-Molina, C.; Moran-Tejeda, E.; Revuelto, J.; Trigo, R. Evidence of increasing drought severity caused by temperature rise in southern Europe. Environ. Res. Lett. 2014, 9, 1–9. [Google Scholar] [CrossRef]
- Wilhite, D.A. Drought as a Natural Hazard: Concepts and Definitions. Available online: http://digitalcommons.unl.edu/droughtfacpub/69 (accessed on 10 June 2019).
- FAO. Drought and Agriculture; International Seminar the Islamic Republic of Iran and the Kingdom of Netherlands: Rome, Italy, 2017. [Google Scholar]
- Karavitis, C.A. Decision support systems for drought management strategies in Metropolitan Athens. Water Int. 1999, 24, 10–21. [Google Scholar] [CrossRef]
- Kastopoulou, E.; Giannakopoulos, C.; Krapsiti, D.; Karali, A. Temporal and Spatial Trends of the Standardized Precipitation Index (SPI) in Greece Using Observations and Output from Regional Climate Models. Perspect. Atmos. Sci. 2017, 475–481. [Google Scholar]
- Vicente-Serrano, S.M.; Gonzalez-Hidalgo, J.C.; de Luis, M.; Raventos, J. Spatial and temporal patterns of droughts in the Mediterranean area: The Valencia region (East-Spain). Clim. Res. 2004, 26, 5–15. [Google Scholar] [CrossRef]
- Vicente-Serrano, S.M.; Cabello, D.; Tomas-Burguera, M.; Martin-Hernandez, N.; Begueria, S.; Azorin-Molina, C.; Kenawy, A. Drought variability and land degradation in semiarid regions: Assessment using remote sensing data and drought indices (1982–2011). Remote Sens. 2015, 7, 4391–4423. [Google Scholar] [CrossRef]
- Langat, P.K.; Kumar, L.; Koech, R. Temporal Variability and Trends of Rainfall and Streamflow in Tana River Basin, Kenya. Sustainability 2017, 9, 1963. [Google Scholar] [CrossRef]
- Li, X.; Wang, X.; Babovic, V. Analysis of variability and trends of precipitation extremes in Singapore during 1980–2013. Int. J. Climatol. 2017, 38, 125–141. [Google Scholar] [CrossRef]
- Klingaman, N.; Keat, W. El Niño 2018-19: Historical Impact Analysis; Available online: https://www.dai.com/uploads/DFID_El%20Nino_2018_Historical%20Impact%20Analysis%20(University%20of%20Reading).pdf (accessed on 10 June 2019).
- Li, X.; Meshgi, A.; Babovic, V. Spatio-temporal variation of wet and dry spell characteristics of tropical precipitation in Singapore and its association with ENSO. Int. J. Climatol. 2016, 36, 4831–4846. [Google Scholar] [CrossRef]
- Surendran, U.; Kumar, V.; Ramasubramoniam, S.; Raja, P. Development of Drought Indices for Semi-Arid Region Using Drought Indices Calculator (DrinC)—A case study from Madurai District, a semi-arid region in India. Water Resour. Manag. 2017, 31, 3593–3605. [Google Scholar] [CrossRef]
- Van Loon, A.F. Hydrological Drought Explained. Wiley Interdiscip. Rev. Water 2015, 2, 359–392. [Google Scholar] [CrossRef]
- Deo, R.C.; Sahin, M. Application of the artificial neural network model for prediction of monthly standardized precipitation and evapotranspiration index using hydrometeorological parameters and climate indices in eastern Australia. Atmos. Res. 2015, 161, 65–81. [Google Scholar] [CrossRef]
- Tsakiris, G.; Pangalou, D.; Vangelis, H. Regional drought assessment based on the reconnaissance drought index (RDI). Water Resour. Manag. 2007, 21, 821–833. [Google Scholar] [CrossRef]
- Vicente-Serrano, S.M.; López-Moreno, J.I. Hydrological response to different time scales of climatological drought: An evaluation of the Standardized Precipitation Index in a mountainous Mediterranean basin. Hydrology and Earth System Sciences Discussions. Eur. Geosci. Union 2005, 9, 523–533. [Google Scholar]
- Vicente-Serrano, S.M. Differences in spatial patterns of drought on different time scales: An analysis of the Iberian Peninsula. Water Resour. Manag. 2006, 20, 37–60. [Google Scholar] [CrossRef]
- Vicente-Serrano, S.M.; Begueria, S.; Lopez-Moreno, J.I. A multi-scalar drought index sensitive to global warming: The standardized precipitation evapotranspiration index—SPEI. J. Clim. 2010, 23, 1696–1718. [Google Scholar] [CrossRef]
- Zambrano, F.; Wardlow, B.; Tadesse, T.; Saaverda, M.L.; Lagos, O. Evaluating satellite-derived long-term historical precipitation datasets for drought monitoring in Chile. Atmos. Res. 2017, 186, 26–42. [Google Scholar] [CrossRef]
- Heim, R.R. A review of twentieth-century drought indices used in the United States. Bull. Am. Meteorol. Soc. 2002, 83, 1149–1165. [Google Scholar] [CrossRef]
- Keyantash, J.; Dracup, J.A. The quantification of drought: An analysis of drought indices. Bull. Am. Meteorol. Soc. 2002, 83, 1167–1180. [Google Scholar] [CrossRef]
- Vicente-Serrano, S.M.; Begueria, S.; Lopez-Moreno, J.I.; Angulo, M.; Kenawy, E.L. A new global 0.58 gridded dataset (1901–2006) of a multiscalar drought index: Comparison with current drought index datasets based on the Palmer drought severity index. J. Hydrometeorol. 2010, 11, 1033–1043. [Google Scholar] [CrossRef]
- AMS (American Meteorological Society). Statement on meteorological drought. Bull. Am. Meteorol. Soc. 2004, 85, 771–773. [Google Scholar]
- Wilhite, D.A.; Glantz, M.H. Understanding the drought phenomenon: The role of definitions. In Planning for Drought; Wilhite, D.A., Easterling, W.E., Wood, D.A., Eds.; Vestview Press: Boulder, CO, USA, 1985; pp. 11–27. [Google Scholar]
- IPCC. Climate Change: The Physical Science Basis; Working Group I Contribution to the IPCC Fifth Assessment Report; Intergovernmental Panel on Climate Change; Cambridge University Press: Cambridge, UK, 2013; Available online: www.ipcc.ch/report/ar5/wg1 (accessed on 10 June 2019).
- Gonçalves, M.; Barrera Escoda, A.; Guerreiro, D.; Baldasano, J.M.; Cunillera, J. Seasonal to yearly assessment of temperature and precipitation trends in the North Western Mediterranean Basin by dynamical downscaling of climate scenarios at high resolution (1971–2050). Clim. Chang. 2014, 122, 243–256. [Google Scholar] [CrossRef]
- Evans, J.P. 21st century climate change in the Middle East. J. Clim. Chang. 2009, 92, 417–432. [Google Scholar] [CrossRef]
- Dai, A. Drought under global warming: A review. Clim. Chang. 2011, 45–65. [Google Scholar] [CrossRef]
- Willeke, G.E.; Hosking, J.R.M.; Wallis, J.R.; Guttman, N.B. The National Drought Atlas; Institute for Water Resources Report 94–NDS–4; U.S. Army Corps of Engineers: Washington, DC, USA, 1994.
- Gibbs, W.J.; Maher, J.V. Rainfall Deciles as Drought Indicators; Bureau of Meteorology: Melbourne, Australia, 1967.
- Palmer, W.C. Meteorological Drought; U.S. Department of Commerce Weather Bureau: Washington, DC, USA, 1965.
- Vicente-Serrano, S.M.; Begueria, S.; Lopez-Moreno, J.I. Comment on “Characteristics and trends in various forms of the Palmer Drought Severity Index (PDSI) during 1900–008” by A Dai. J. Geophys. Res. Atmos. 2011, 116, D19112. [Google Scholar] [CrossRef]
- Alley, W.M. The Palmer Drought Severity Index: Limitation and assumptions. J. Clim. Appl. Meteorol. 1984, 23, 1100–1109. [Google Scholar] [CrossRef]
- Shafer, B.A.; Dezman, L.E. Development of a surface water supply index (swsi) to assess the severity of drought conditions in snowpack runoff areas. In Proceedings of the Western Snow Conference, Fort Collins, CO, USA, 19–23 April 1982; pp. 164–175. [Google Scholar]
- McKee, T.B.; Doesken, N.J.; Kleist, J. The relationship of drought frequency and duration to time scales. In Proceedings of the 8th Conference on Applied Climatology, Anaheim, CA, USA, 17–22 January 1993; pp. 179–184. [Google Scholar]
- Guttman, N.B. Accepting the standardized precipitation index: A calculation algorithm. Am. J. Water Resour. Assoc. 1999, 35, 311–322. [Google Scholar] [CrossRef]
- Hayes, M.J.; Svoboda, M.D.; Wilhite, D.A.; Vanyarkho, O.V. Monitoring the 1996 Drought Using the Standardized Precipitation Index. Bull. Am. Meteorol. Soc. 1999, 80, 429–438. [Google Scholar] [CrossRef]
- Karavitis, C.A.; Alexandris, S.; Tsesmelis, D.E.; Athanasopoulos, G. Application of the Standardized Precipitation Index (SPI) in Greece. Water 2011, 3, 787–805. [Google Scholar] [CrossRef]
- Palfai, I. Description and forecasting of droughts in hungary. In Proceedings of the 14th Congress on Irrigation and Drainage (ICID), Rio de Janario, Brazil,, 30 April–4 May 1990; Volume 1-C, pp. 151–158. [Google Scholar]
- Deo, R.C.; Kisi, O.; Singh, V.P. Drought forecasting in eastern Australia using multivariate adaptive regression spline, least square support vector machine and M5Tree model. Atmos. Res. 2017, 184, 149–175. [Google Scholar] [CrossRef]
- Wilhite, D.A.; Svoboda, M.D.; Hayes, M.J. Understanding the complex impacts of drought: A key to enhancing drought mitigation and preparedness. Water Resour. Manag. 2007, 21, 763–774. [Google Scholar] [CrossRef]
- Chortaria, C.; Karavitis, C.A.; Alexandris, S. Development of the SPI drought index for Greece using geo-statistical methods. In Proceedings of the BALWOIS 2010 International Conference, Ohrid, FYROM, 25–29 May 2010. [Google Scholar]
- Morid, S.; Smakhtin, V.U.; Moghaddasi, M. Comparison of seven meteorological indices for drought monitoring. Iran. Int. J. Climatol. 2006, 26, 971–985. [Google Scholar] [CrossRef]
- Mathbout, S.; Lopez-Bustins, J.A.; Martin-Vide, J.; Bech, J.; Rodrigo, F.S. Spatial and temporal analysis of drought variability at several time scales in Syria during 1961–2012. Atmos. Res. 2018, 200, 153–168. [Google Scholar] [CrossRef]
- Black, E. The impact of climate change on daily precipitation statistics in Jordan and Israel. Atmos. Sci. Lett. 2009, 10, 192–200. [Google Scholar] [CrossRef]
- Lionello, P. (Ed.) The Climate of the Mediterranean Region: From the Past to the Future. 2012. Available online: http://citeseerx.ist.psu.edu/viewdoc/download?doi=10.1.1.459.5178&rep=rep1&type=pdf (accessed on 10 June 2019).
- Turk, M.; Levin, N.; Tessler, N.; Saaroni, H. Recent changes and relations among drought, vegetation and wildfires in the Eastern Mediterranean: The case of Israel. Glob. Planet. Chang. 2016, 151, 28–35. [Google Scholar]
- Lionello, P.; Malanotte-Rizzoli, P.; Boscolo, R. (Eds.) Mediterranean Climate Variability; Elsevier: Amsterdam, The Netherlands, 2006. [Google Scholar]
- Mahfouz, P.; Mitri, G.; Jazi, M.; Karam, F. Investigating the Temporal Variability of the Standardized Precipitation Index in Lebanon. Climate 2016, 4, 27. [Google Scholar] [CrossRef]
- UN. Strengthening National Capacities to Manage Water Scarcity and Drought in West Asia and North Africa: The Analysis, Mapping and Identification of Critical Gaps in Preimpact and Preparedness Drought Management Planning in Waterscarce and in-Transitioning-Settings Countries in West Aisa/North Africa; Department of Economic and Social Affairs (DESA), Economic and Social Commission for Western Asia (ESCWA): UN, Beirut, Lebanon, 2013. [Google Scholar]
- MWI. Jordan Water Sector Facts and Figures; Ministry of Water and Irrigation: Amman, Jordan, 2015.
- World Bank. Promoting Poverty Reduction and Shared Prosperity: Systematic Country Diagnostic; Middle East and North Africa Region. The World Bank Group: Washington, DC, USA, 2016. [Google Scholar]
- DOS. Agricultural Statistics; Department of Statistics: Amman, Jordan, 2017.
- Gilbert, S. Drought and Climate Change in Jordan: An Analysis of the 2008–2009 Drought and Climate Change Impact. Ph.D. Thesis, Pennsylvania State University, State College, PA, USA, 2017. [Google Scholar]
- Hammouri, N.; El-Naqa, A. Drought Assessment Using GIS and Remote Sensing in Amman-Zarqa Basin, Jordan. Jordan J. Civ. Eng. 2007, 1, 142–152. [Google Scholar]
- Abu Sada, A.; Abu-Allaban, M.; Al-Malabeh, A. Temporal and Spatial Analysis of Climate Change at Northern Jordanian Badia. Jordan J. Earth Environ. Sci. 2015, 7, 87–93. [Google Scholar]
- Törnros, T.; Menzel, L. Addressing drought conditions under current and future climates in the Jordan River region. Hydrol. Earth Syst. Sci. 2014, 18, 305–318. [Google Scholar] [CrossRef]
- MoEnv. Capacity Development to support National Drought Management Policy: Drought Conditions and Management Strategies in Jordan; Ministry of Environment: Amman, Jordan, 2014.
- Al-Qinna, M.I.; Hammouri, N.A.; Obeidat, M.M.; Ahmad, F.Y. Drought analysis in Jordan under current and future climates. Clim. Chang. 2011, 106, 421–440. [Google Scholar] [CrossRef]
- JMP. Statistics and Graphics Guide Version 8; SAS Institute Inc.: Cary, CA, USA, 2011. [Google Scholar]
- Paulin, C.; Xiaogang, S. Identification of the Effect of Climate Change on Future Design Standards of Drainage Infrastructure in Ontario; Paulin Coulibaly and Xiaogang Shi, McMaster University Department of Civil Engineering: Ontario, ON, Canada, 2005. [Google Scholar]
- Kendall, M. Rank Correlation Methods, 4th ed.; Charles Griffin: London, UK, 1975. [Google Scholar]
- Gilbert, R. Statistical Methods for Environmental Pollution Monitoring; Wiley: New York, NY, USA, 1987. [Google Scholar]
- Mann, H. Non-parametric tests against trend. Econometrica 1945, 13, 245–259. [Google Scholar] [CrossRef]
- Yue, S.; Pilon, P.; Cavadias, G. Power of the Mann–Kendall and Spearman’s rho tests for detecting monotonic trends in hydrological series. J. Hydrol. 2002, 259, 254–271. [Google Scholar] [CrossRef]
- Abdi, H. Kendall Rank Correlation. In Encyclopedia of Measurement and Statistics; Salkind, N.J., Ed.; Sage: Thousand Oaks, CA, USA, 2007. [Google Scholar]
- Nelsen, R. Kendall tau metric. In Encyclopedia of Mathematics; Hazewinkel, M., Ed.; Springer: New York, NY, USA, 2001. [Google Scholar]
- Sneyers, R. On the Statistical Analysis of Series of Observations; Technical Note 143; World Meteorological Organization: Geneva, Switzerland, 1990; ISBN 978-92-63-10415-1. [Google Scholar]
- DeGaetano, A.T. Recent trends in maximum and minimum temperature threshold exceedences in the North-Eastern United States. J. Clim. 1996, 9, 1646–1660. [Google Scholar] [CrossRef]
- Tigkas, D.; Vangelis, H.; Tsakiris, G. DrinC: A software for drought analysis based on drought indices. Earth Sci. Inform. 2015, 8, 697–709. [Google Scholar] [CrossRef]
- McKee, T.B.; Doesken, N.J.; Kleist, J. Drought monitoring with multiple time scales. In Proceedings of the Ninth Conference on Applied Climatology, Dallas, TX, USA, 15–20 January 1995. [Google Scholar]
- ESRI, ArcView GIS Version 9.2. A Computer Software to Visualize, Explores, Query and Analyze Data Spatially; Environmental Systems Research Institute (ESRI): Redlands, CA, USA, 2006.
- Selker, J.S.; Keller, C.K.; McCord, J.T. Vadose Zone Processes; Lewis Publishers, CRC Press LLC: Boca Raton, FL, USA, 1999. [Google Scholar]
- Goovaerts, P. Geostatistics for Natural Resources Evaluation; Oxford University Press: New York, NY, USA, 1997. [Google Scholar]
- Scott, H.D. Soil Physics: Agricultural and Environmental Applications; Iowa State University Press: Ames, IA, USA, 2000. [Google Scholar]
- Lovejoy, S.; Schertzer, D.; Ladoy, P. Fractal characterization of inhomogeneous geophysical measuring networks. Nature 1986, 319, 43–44. [Google Scholar] [CrossRef]
- Milligan, G.W. An examination of the effect of six types of error perturbation on fifteen clustering algorithms. Psychometrika 1980, 45, 325–342. [Google Scholar] [CrossRef]


| No. | Station Name | Altitude (m) | Mean (mm) | SD (mm) | Min (mm) | Max (mm) | CV (%) | Skewness | Kurtosis |
|---|---|---|---|---|---|---|---|---|---|
| 1 | Baqura | −170 | 392.4 | 133.3 | 174.3 | 918.3 | 34.0 | 1.86 | 5.76 |
| 2 | DeirAlla | 330 | 282.3 | 93.1 | 117.0 | 599.0 | 33.0 | 1.30 | 2.73 |
| 3 | Ghor Safi | −350 | 72.4 | 28.6 | 18.3 | 151.8 | 39.5 | 0.30 | 0.21 |
| 4 | Irbid | 616 | 459.6 | 144.6 | 216.8 | 912.9 | 31.5 | 1.52 | 3.20 |
| 5 | Rabba | 920 | 337.3 | 103.3 | 138.0 | 606.0 | 30.6 | 0.39 | 0.65 |
| 6 | Shoubek | 1365 | 251.6 | 97.4 | 95.0 | 482.0 | 38.7 | 0.72 | 0.23 |
| 7 | Tafieleh | 1200 | 203.8 | 61.5 | 85.0 | 358.0 | 30.2 | 0.68 | 0.26 |
| 8 | Salt | 796 | 550.1 | 166.8 | 246.0 | 1130. | 30.3 | 1.40 | 3.25 |
| 9 | Aqaba | 51 | 25.6 | 21.4 | 1.0 | 86.0 | 83.7 | 1.05 | 0.38 |
| 10 | RasMunief | 1150 | 463.9 | 142.9 | 217.0 | 913.0 | 30.8 | 1.50 | 3.29 |
| 11 | Amman Airport | 790 | 254.2 | 88.2 | 111.0 | 548.0 | 34.7 | 1.67 | 3.60 |
| 12 | Mafreq | 686 | 154.8 | 54.3 | 65.0 | 301.0 | 35.1 | 0.93 | 0.98 |
| 13 | Safawi H5 | 674 | 70.1 | 32.0 | 16.0 | 158.0 | 45.6 | 0.70 | 0.53 |
| 14 | Queen AIA | 722 | 155.9 | 51.7 | 56.0 | 326.0 | 33.2 | 1.05 | 2.68 |
| 15 | Maan | 1069 | 41.2 | 24.5 | 12.0 | 108.0 | 59.5 | 1.17 | 1.29 |
| 16 | Al-Jafer | 865 | 31.4 | 25.7 | 1.0 | 135.0 | 82.0 | 2.09 | 6.14 |
| 17 | Zarqa | 664 | 129.5 | 45.3 | 48.0 | 258.0 | 34.9 | 1.14 | 1.68 |
| 18 | WadiDhuleil | 575 | 141.0 | 49.3 | 54.5 | 276.0 | 35.0 | 1.04 | 0.94 |
| 19 | Qatraneh | 730 | 97.3 | 31.1 | 25.0 | 156.0 | 31.9 | −0.25 | 0.56 |
| 20 | Azraq South | 610 | 54.0 | 30.5 | 9.0 | 149.0 | 56.5 | 0.90 | 0.93 |
| 21 | Reweished H4 | 683 | 81.2 | 36.7 | 16.0 | 168.0 | 45.3 | 0.09 | 0.14 |
| 22 | WadiErRayyan | −200 | 308.5 | 107.0 | 132.0 | 708.0 | 34.7 | 1.65 | 4.39 |
| 23 | Sweileh | 1050 | 468.6 | 180.1 | 212.6 | 1258.3 | 38.4 | 2.39 | 9.23 |
| 24 | Maddaba | 758 | 307.6 | 123.1 | 55.9 | 755.5 | 40.0 | 1.10 | 3.70 |
| 25 | Ramtha | 590 | 209.1 | 90.8 | 25.9 | 453.9 | 43.4 | 0.63 | 0.70 |
| 26 | DierAbi Said | −224 | 461.2 | 149.1 | 234.0 | 942.6 | 32.3 | 1.42 | 3.33 |
| 27 | South Shuna | −211 | 165.5 | 53.7 | 57.9 | 341.4 | 32.4 | 0.88 | 2.27 |
| 28 | University of Jordan | 992 | 486.9 | 161.2 | 225.3 | 1150.8 | 33.1 | 2.05 | 6.97 |
| 29 | Jerash | 585 | 364.5 | 115.9 | 189.5 | 696.7 | 31.8 | 1.10 | 1.37 |
| Station | R | Kendall τ | Prob > |τ| | Linear Trend Equation | R2 | RMSE | Prob > F |
|---|---|---|---|---|---|---|---|
| Baqura | −0.231 | −0.147 | 0.1954 | 5796.86 − 2.71 × Year | 0.051 | 131.7 | 0.1735 |
| DeirAlla | −0.274 | −0.176 | 0.1219 | 4751.47 − 2.24 × Year | 0.071 | 90.9 | 0.1049 |
| Ghor Safi | −0.224 | −0.204 | 0.0722 | 1195.83 − 0.56 × Year | 0.048 | 28.3 | 0.1877 |
| Irbid | −0.270 | −0.184 | 0.1049 | 7320.20 − 3.43 × Year | 0.070 | 141.4 | 0.1094 |
| ErRabeh | −0.335 | −0.197 | 0.0827 | 6420.43 − 3.05 × Year | 0.107 | 99.0 | 0.0447 * |
| Shoubek | −0.425 | −0.297 | 0.0078 * | 7509.17 − 3.63 × Year | 0.181 | 89.3 | 0.0070 * |
| Tafieleh | −0.386 | −0.211 | 0.0627 | 4377.6 − 2.1 × Year | 0.143 | 57.7 | 0.0195 * |
| Salt | −0.313 | −0.178 | 0.116 | 9721.26 − 4.59 × Year | 0.094 | 161.0 | 0.0618 |
| Aqaba | −0.164 | −0.130 | 0.2522 | 642.62 − 0.31 × Year | 0.026 | 21.4 | 0.3365 |
| RasMunief | −0.223 | −0.124 | 0.2739 | 6041.09 − 2.79 × Year | 0.047 | 141.4 | 0.1904 |
| Amman Airport | −0.342 | −0.207 | 0.0682 | 5553.58 − 2.65 × Year | 0.112 | 84.2 | 0.0402 * |
| Mafreq | −0.420 | −0.238 | 0.0357 * | 4164.22 − 2.01 × Year | 0.169 | 50.2 | 0.0104 * |
| Safawi H5 | −0.184 | −0.149 | 0.1907 | 1099.41 − 0.52 × Year | 0.032 | 31.9 | 0.2820 |
| Queen AIA | −0.308 | −0.223 | 0.0496 * | 2949.49 − 1.40 × Year | 0.090 | 50.0 | 0.0669 |
| Maan | −0.150 | −0.056 | 0.6236 | 684.24 − 0.32 × Year | 0.021 | 24.6 | 0.3820 |
| Al-Jafer | −0.217 | −0.128 | 0.2628 | 1008.17 − 0.49 × Year | 0.045 | 25.5 | 0.2029 |
| Zarka | −0.283 | −0.093 | 0.4137 | 2380.98 − 1.13 × Year | 0.077 | 44.1 | 0.0925 |
| WadiIDhuleil | −0.418 | −0.258 | 0.0229 * | 3766.28 − 1.81 × Year | 0.167 | 45.6 | 0.0108 * |
| Qatraneh | 0.003 | −0.020 | 0.8602 | 79.15 + 0.01 × Year | 0.000 | 31.5 | 0.9846 |
| Azraq South | −0.153 | −0.147 | 0.1954 | 871.78 − 0.41 × Year | 0.022 | 30.6 | 0.3712 |
| Reweished H4 | −0.221 | −0.084 | 0.4581 | 1504.29 − 0.71 × Year | 0.046 | 36.4 | 0.1938 |
| WadiErRayyan | −0.188 | −0.120 | 0.2908 | 3826.12 − 1.76 × Year | 0.034 | 106.6 | 0.2715 |
| Sweileh | −0.328 | −0.222 | 0.0498 * | 10838.1 − 5.2 × Year | 0.103 | 173.0 | 0.0499 * |
| Maddaba | 0.068 | 0.064 | 0.5716 | −1160.45 + 0.73 × Year | 0.004 | 124.5 | 0.6922 |
| Ramtha | −0.464 | −0.314 | 0.0055 * | 7625.99 − 3.71 × Year | 0.207 | 82.0 | 0.0041 * |
| DierAbi Said | −0.003 | 0.067 | 0.5673 | 544.71 − 0.04 × Year | 0.000 | 151.3 | 0.9863 |
| South Shuna | −0.115 | −0.038 | 0.7437 | 1244.32 − 0.54 × Year | 0.011 | 54.2 | 0.5381 |
| Jerash | −0.045 | 0.010 | 0.9299 | 1274.64 − 0.46 × Year | 0.002 | 117.4 | 0.7946 |
| University of Jordan | −0.241 | −0.166 | 0.1413 | 7290.79 − 3.41 × Year | 0.055 | 158.8 | 0.1558 |
| Category | SPI Class Range | Probability (%) | ||||||
|---|---|---|---|---|---|---|---|---|
| SPI12 | SPI6W | SPI6D | SPI3JFM | SPI3AMJ | SPI3JAS | SPI3OCD | ||
| Extremely Wet | ≥2.00 | 3.37 | 3.70 | 3.081 | 3.09 | 2.82 | 2.96 | 1.55 |
| Very Wet | 1.50 – 1.99 | 3.46 | 3.52 | 3.26 | 3.46 | 3.27 | 23.14 | 5.55 |
| Moderately Wet | 1.00 – 1.49 | 6.28 | 7.31 | 9.33 | 8.00 | 9.91 | 49.23 | 8.55 |
| Near Normal | −0.99 – 0.99 | 72.22 | 71.39 | 74.30 | 69.27 | 74.00 | 24.67 | 68.36 |
| Moderately Drought | −1.49 – 1.00 | 8.93 | 8.89 | 8.10 | 9.00 | 8.46 | 0 | 9.27 |
| Severe Drought | −1.99 − −1.5 | 3.10 | 2.91 | 1.14 | 4.82 | 1.27 | 0 | 4.55 |
| Extreme Drought | ≤ −2.00 | 2.64 | 2.29 | 7.92 | 2.36 | 0.27 | 0 | 2.18 |
| SPI | Linear Trend Equation | R2 | RMSE | Prob. > F |
|---|---|---|---|---|
| SPI12 | = 40.39 − 0.02 × Year | 0.0488 | 0.976 | <0.0001* |
| SPI6W | = 41.06 − 0.02 × Year | 0.0505 | 0.975 | <0.0001* |
| SPI6D | = −3.45 + 0.002 × Year | 0.0005 | 0.891 | 0.4642 |
| SPI3AMJ | = −1.86 + 0.001 × Year | 0.0001 | 0.8774 | 0.6859 |
| SPI3JAS | = 1.25 + 0.000 × Year | 0.0001 | 0.4080 | 0.9979 |
| SPI3JFM | = 30.69 − 0.015 × Year | 0.0283 | 0.9867 | <0.0001* |
| SPI3OND | = 19.12 − 0.010 × Year | 0.0113 | 0.9806 | <0.0001* |
| Parameters | SPI3AMJ | SPI3JAS | SPI3JFM | SPI3OND |
|---|---|---|---|---|
| Mean | 0.098 | 1.253 | 0.000 | 0.011 |
| Standard Deviation | 0.877 | 0.408 | 1.000 | 0.986 |
| Maximum | 3.064 | 2.684 | 2.922 | 2.632 |
| Minimum | −2.767 | 0.633 | −3.030 | −2.787 |
| Weather Station | Estimate | t-ratio | Prob > ItI a |
|---|---|---|---|
| Time | −0.020028 | −7.46 | 0.001 * |
| Baqura | −0.000485 | 0.0 | 0.9975 |
| DeirAlla | 0.0003229 | 0.00 | 0.9984 |
| Ghor Safi | 0.003824 | 0.02 | 0.9807 |
| Irbid | −9.885e−5 | −0.00 | 0.9995 |
| ErRabeh | 0.0021258 | 0.01 | 0.9893 |
| Shoubek | 0.0013583 | 0.01 | 0.9931 |
| Tafieleh | 0.0012457 | 0.01 | 0.9937 |
| Salt | 0.0002993 | 0.00 | 0.9985 |
| Aqaba | −0.000319 | −0.00 | 0.9984 |
| RasMunief | 0.0006314 | 0.00 | 0.9968 |
| Amman Airport | −0.000698 | −0.00 | 0.9965 |
| Mafreq | 0.0006292 | 0.00 | 0.9968 |
| Safawi H5 | 0.0023324 | 0.01 | 0.9882 |
| Queen AIA | 0.0013181 | 0.01 | 0.9933 |
| Maan | −0.001784 | −0.01 | 0.9910 |
| Al-Jafer | 0.0032788 | 0.02 | 0.9834 |
| Zarka | 0.0015815 | 0.01 | 0.9920 |
| WadiIDhuleil | 0.0001879 | 0.00 | 0.9991 |
| Qatraneh | 0.0043724 | 0.03 | 0.9779 |
| Azraq South | 0.0030334 | 0.02 | 0.9847 |
| Reweished H4 | 0.0076678 | 0.05 | 0.9613 |
| WadiErRayyan | −0.000371 | −0.00 | 0.9981 |
| Sweileh | −0.001671 | −0.01 | 0.9916 |
| Maddaba | 0.0037757 | 0.02 | 0.9809 |
| Ramtha | 0.0055731 | 0.04 | 0.9718 |
| DierAbi Said | −0.019975 | −0.12 | 0.9019 |
| South Shuna | −0.018202 | −0.11 | 0.9106 |
| Jerash | 0.0001972 | 0.00 | 0.9990 |
| University of Jordan | −0.000684 | −0.00 | 0.9965 |
© 2019 by the authors. Licensee MDPI, Basel, Switzerland. This article is an open access article distributed under the terms and conditions of the Creative Commons Attribution (CC BY) license (http://creativecommons.org/licenses/by/4.0/).
Share and Cite
Aladaileh, H.; Al Qinna, M.; Karoly, B.; Al-Karablieh, E.; Rakonczai, J. An Investigation into the Spatial and Temporal Variability of the Meteorological Drought in Jordan. Climate 2019, 7, 82. https://doi.org/10.3390/cli7060082
Aladaileh H, Al Qinna M, Karoly B, Al-Karablieh E, Rakonczai J. An Investigation into the Spatial and Temporal Variability of the Meteorological Drought in Jordan. Climate. 2019; 7(6):82. https://doi.org/10.3390/cli7060082
Chicago/Turabian StyleAladaileh, Haitham, Mohammed Al Qinna, Barta Karoly, Emad Al-Karablieh, and János Rakonczai. 2019. "An Investigation into the Spatial and Temporal Variability of the Meteorological Drought in Jordan" Climate 7, no. 6: 82. https://doi.org/10.3390/cli7060082
APA StyleAladaileh, H., Al Qinna, M., Karoly, B., Al-Karablieh, E., & Rakonczai, J. (2019). An Investigation into the Spatial and Temporal Variability of the Meteorological Drought in Jordan. Climate, 7(6), 82. https://doi.org/10.3390/cli7060082