Abstract
Following the impact of droughts witnessed during the last decade there is an urgent need to develop a drought management strategy, policy framework, and action plan for Jordan. This study aims to provide a historical baseline using the standardized precipitation index (SPI) and meteorological drought maps, and to investigate the spatial and temporal trends using long-term historical precipitation records. Specifically, this study is based on the statistical analysis of 38 years of monthly rainfall data, gathered from all 29 meteorological stations that cover Jordan. The Mann–Kendall test and linear regression analysis were used to uncover evidence of long-term trends in precipitation. Drought indices were used for calculating the meteorological SPI on an annual (SPI12), 6-months (SPI6), and 3-months basis (SPI3). At each level, every drought event was characterized according to its duration, interval, and intensity. Then, drought maps were generated using interpolation kriging to investigate the spatial extent of drought events, while drought patterns were temporally characterized using multilinear regression and spatial grouped using the hierarchical clustering technique. Both annual and monthly trend analyses and the Mann–Kendall test indicated significant reduction of precipitation in time for all weather stations except for Madaba. The rate of decrease is estimated at approximately 1.8 mm/year for the whole country. The spatial SPI krig maps that were generated suggest the presence of two drought types in the spatial dimension: Local and national. Local droughts reveal no actual observed trends or repeatable patterns of occurrence. However, looking at meteorological droughts across all time scales indicated that Jordan is facing an increasing number of local droughts. With a probability of occurrence of once every two years to three years. On the other hand, extreme national droughts occur once every 15 to 20 years and last for two or more consecutive years. Linear trends indicated significant increase in drought magnitude by time with a rate of 0.02 (p < 0.0001). Regression analysis indicated that draught in Jordan is time dependent (p < 0.001) rather than being spatially dependent (p > 0.99). Hierarchical clustering was able to group national draughts into three zones, namely the northern zone, the eastern zone, and the southern zone. This study highlights the urgent need for a monitoring program to investigate local and national drought impacts on all sectors, as well as the development of a set of proactive risk management measures and preparedness plans for various physiographic regions.
1. Introduction
1.1. Background
Drought is a general term referring to a consequence of an extended period (e.g., season, year, or more) of deficient precipitation compared to the statistical decadal average for a region. These events result in water shortages that impact on the functioning of natural ecosystems, and bring great hardship and disruption to human activities [1,2]. A drought is a temporary dry period, in contrast to the permanent aridity in known arid areas, and droughts occur in most parts of the world, even in wet and humid regions [3,4,5].
Droughts are considered a natural hazard; a traditional disaster often leading to emergency mobilization. Since the 19th century, more people have been negatively affected by drought than any other physical hazard; more than 11 million people have died as a consequence of drought, and more than 2 billion people have been affected in some way [6]. The percentage of the planet affected by drought has more than doubled in the last 40 years and, in the same time span, droughts have affected more people worldwide than any other natural hazard [7]. Droughts represent the primary cause of most ill health and death due to a lack of access to adequate and clean water supplies. Droughts have significant socioeconomic and environmental impacts, both direct and indirect. In general, drought have a major impact on agriculture and related sectors, including forestry and fisheries, and it can lead to famines, internal displacement, natural resource degradation, weak economic performance, and can also exacerbate social tensions and fuel civil unrest [8,9,10,11,12].
A drought event is gradual, and usually hits different regions of a country with varying levels of intensity and at different time periods. The variability of the precipitations is influenced by the combined effects of major atmospheric dynamics such as El Niño–southern oscillation (ENSO), global atmospheric composition, and local land effects [13]. Significant correlations are found between precipitation extremes and the three previous mentioned factors. Previous El Niño events in some parts of the Middle East and North Africa (MENA) region have led to flooding, with significant damage to infrastructure. In the year after previous El Niño events, dry conditions have led to drought, reduced water availability, and reduced crop productivity [14]. During the El Niño phase, precipitation spells generally become drier [15].
To help manage these impacts drought indicators are helpful to understand the onset of a drought and its characteristics in terms of severity, duration, and direction [16,17,18,19,20,21,22]. Unfortunately, there is no single indicator or index that can precisely describe the onset and severity of a drought [23,24,25,26]. Based on the nature of the water deficit, four types of droughts are defined: Meteorological, hydrological, agricultural, and socioeconomical [27,28].
According to the IPCC [29], the frequency, severity, and duration of droughts have increased over time. Drought, a devastating natural hazard, affects a significant proportion of the global population, particularly those living in semiarid and arid regions. Climate change is indeed exacerbating drought in many parts of the world, and future projections suggest droughts will become more widespread, broadly consistent with expected changes in the hydrologic cycle under global warming [5,30,31,32]. Several indices are presented in literature, among those are:
- Percent of normal [33];
- Deciles [34];
- Palmer drought severity index (PDSI) [35,36,37];
- Surface water supply index (SWSI) [38];
- Standardized precipitation index (SPI) [39,40,41,42];
- Palfai aridity index (PAI) [43];
- and others [8,44,45,46].
The nature of the indicator, local conditions, data availability, and validity are the factors that usually determine which indicator is to be applied [47].
Mathbout, S. et al. [48] investigated the spatiotemporal characteristics of drought phenomenon in Syria using the SPI and the standardized precipitation evapotranspiration index (SPEI) for various time scales (3, 6, 9, 12, and 24 months) using data from 20 weather stations covering the years 1961–2012. The authors concluded that the temporal and spatial characteristics of the SPI and SPEI can be used for developing a drought intensity—areal extent—and frequency curve that assesses the variability of regional droughts in Syria.
Several studies have indicated that most arid and semiarid lands in the Middle East are highly sensitive to periodic climate change and are considered to be some of the driest areas of the world, suffering from considerable levels of water scarcity [31,49,50]. Middle Eastern countries are subjected to severe droughts that affect the development of these countries across many aspects and sectors [51,52,53]. ACSAD (2011) classified the 1998–2001 drought across this region was the worst in 50 years, affecting millions of people.
Drought cannot be stopped but, due to the growing availability of technological innovations, it can be forecasted—in some cases, up to a month in advance. Likewise, when appropriate policy instruments are in place, the impacts of drought can be substantially mitigated and reduced. Experience shows that proactive and risk-based management approaches are effective in enhancing the resilience of communities and their capacity to cope with drought, but despite the progress made, drought management and planning is often overlooked until a crisis unfolds. This reactive, crisis-led response gives rise to a fragmented policy space where interventions differ across sectors, tend not to be “joined up,” and therefore, drought mitigation strategies tend to underperform. [7,54]. In order to avoid such failures and to reduce the costs caused by drought, drought characterization should be the basis for implementing effective drought monitoring and developing an early warning system, which is one important component of a national drought management policy.
2. Study Area
Jordan is one of the developing countries in the Middle East, located about 80 kilometers east of the Mediterranean Sea between 29°11′ to 33°22′ north, and 34°19′ to 39°18′ east. Unfortunately, the country lacks natural resource wealth and is ranked among the poorest countries in the world in terms of water scarcity, where the water resources per capita is less than 100 liters per capita per day [55,56]. In addition, the country is facing unstable agricultural development and food insecurity due to multiple demands on the water supply to satisfy the needs of population growth, economic development, and the sudden influx of refugees from neighboring countries. These pressures will be significantly exacerbated by the adverse impacts of climate change and global warming.
Jordan exhibits various micro-climate conditions caused by altitude variability that ranges from −400 m sea level (Dead Sea) to 1750 m in the southern highlands. Thus, the climate varies from dry sub-humid Mediterranean in the northwest of the country to desert conditions at the majority of the east [57]. For this reason, Jordan was divided into three physiographic regions for the purposes of this study:
- The highlands, that comprise mountainous and hilly regions that receive the largest rainfall, and occasionally snow.
- The Jordan Rift Valley (JRV), located west of the highlands, which is rich in water resources, making it fertile and thus primarily used for intensive agricultural practices.
- The desert, which occupies about 90% of the total area of the country and is distributed in the northern, central, and eastern regions (Figure 1).
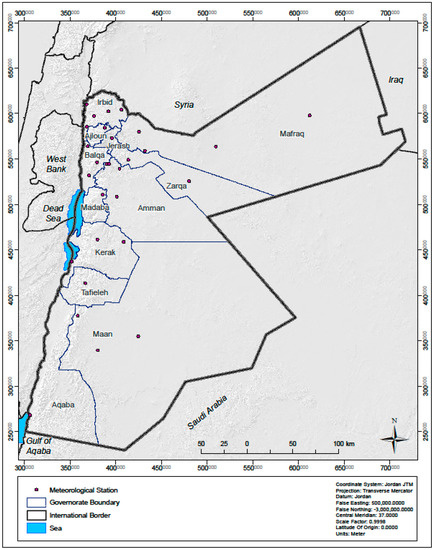 Figure 1. Hashemite Kingdom of Jordan as a study area.
In Jordan, the challenge is to provide sustainable livelihoods for the population as a whole, and particularly for those living in the fragile arid and semiarid ecosystems, where they often face water scarcity, made worse in times of drought, as well as land degradation and desertification. Climate change is also playing a vital role in placing additional constraints on fragile ecosystems and limited natural resources. In recent years, Jordan has witnessed a significant increase in the natural, human, and economic impacts of water shortage which resulted from fluctuations in, and a shortage of, precipitation. In the last three decades in particular, drought episodes have resulted in severe social crises in Jordan, receiving broad attention from senior decision makers, as well as the scientific and governing communities [54].
Droughts in Jordan are characterized by an increasing frequency and severity over time ([58,59,60]. Drought frequency is increasing in Jordan, with almost twice as many droughts between 1961–2012 as between 1900–1960. This trend, coupled with future climate predictions that show an increase in maximum temperatures and a decrease in winter precipitation, emphasize that water scarcity is likely to become an even greater concern for future generations [58,61]. Jordan experiences recurring periods of drought. The most recent drought period, 1998–2000, resulted in serious economic, environmental, and social losses. Drought impact information is a critical requirement for the conduct of vulnerability assessments for various sectors [62]. Impacts of drought in Jordan can be severe. At least 70% of the camel population died due to the drought effect of the period between 1958–1962; around 30% of the sheep died or were slaughtered prematurely in the 1997 drought; and the 1999 drought led to a 99% drop in the cereal harvest, and a 60% fall in the production of red meat and milk [62]. Recent droughts in Jordan, including the intense 2013–2014 drought, illustrate the complex nature of drought impacts on hydrological, agricultural, social, economic, and ecological systems.
The drought season in Jordan tends to be from January through March, and over time, the effects of drought tend to move from the southern desert to those in the north, and from the eastern desert to the highlands and the Jordan Rift Valley (JRV) in the west [63]. For the past 35 years, droughts in Jordan have occurred in a frequent, no uniform, and irregularly repetitive manner. Drought severity, magnitudes, and life span have all increased over time from previously normal levels to new extremes, especially in the last decade when some reached SPI levels of over 4.
The efforts so far made by the Jordanian government are not enough to address such serious consequences, though they do recognize the urgent need to develop an appropriate strategy and action plan for drought preparedness and mitigation, particularly for the agricultural sector. Jordan needs to implement a holistic approach of integrated drought management based on a proactive and preventive risk management approach, rather than the ad hoc approach of crisis management, in order to reduce the impact of droughts.
A drought management strategy, supported by a sound policy framework, should be designed to deliver effective, timely, and coordinated actions on the ground from all designated public and private institutions. This requires decision makers, stakeholders, and the public at large to have timely information from drought monitoring and early warning systems which urgently need to be developed and implemented now. The strategic plan will be based on the development of an effective impact assessment procedure, proactive risk management measures, preparedness plans to increase coping capabilities, and effective emergency response programs to reduce the impact of a drought. The main aim of this study is to provide maps based on a historical baseline and to investigate the presence of spatial and temporal drought trends through investigating the SPI of meteorological droughts in Jordan using long-term historical precipitation records.
3. Methodology and Data Analysis
Monthly rainfall data for 29 meteorological stations covering the whole country (Figure 2) were obtained from the Jordan Meteorological Department (JMD) for 38 years (1979/1980 to 2016/2017). The characteristics of the long-term historical mean annual rainfall data for all meteorological stations is presented in Table 1.
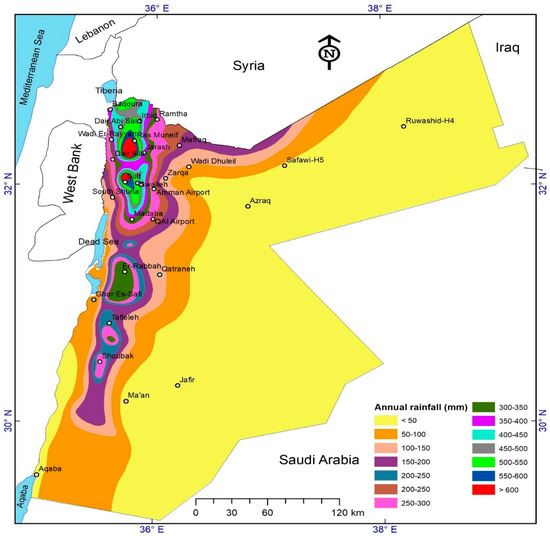
Figure 2.
Rainfall Distribution map of the country based on long historical rainfall records (Modified after MWI, 2010).

Table 1.
Statistical summary for annual rainfall data per station. CV: Coefficient of variation.
To characterize and search for monthly rainfall extremes, preliminary statistical analysis was performed for each meteorological station using the distribution platform within the JMP statistical software [64]. The preliminary statistical analyses included measures of central tendency (mean and median), dispersion (standard deviation and coefficient of variation), and distribution (skewness and kurtosis).
To explore specific rainfall trends, monthly and annual rainfall data were investigated using both the Mann–Kendall test and linear regression analysis (time series linear regression). In linear regression analysis, the coefficient of determination (R2), root mean square error, and p-value, as obtained from analysis of variance (ANOVA), is used to determine the significance of the linear trend. Trends are described in a linear equation where both intercept and slope have significant meanings [64].
The Mann–Kendall test is a nonparametric statistical test used for indicating trends in data [65,66,67,68]. The acceptance or rejection of the main hypothesis (Ho: There exists a trend in the data) at a certain probability level (α) is based on the calculation of Kendall’s tau (τ) that measures the association between two ordinal variables [69]. Kendall’s tau (τ) ranges from −1.0 to 1.0, where a positive value indicates that the rankings of both variables increase together. A negative value, on the other hand, indicates that, as the rank of one variable increases, the other decreases. If the two variables are independent, then the Kendall’s tau is expected to be approximately zero [70,71,72,73]
3.1. Standardized Precipitation Index (SPI)
Drought indices calculator (DrinC) version 1.5.73 was used to calculate meteorological SPI [74]. Prior to calculating this, the long-term monthly rainfall records were initially normalized using the gamma distribution function within the DrinC software.
The SPI was calculated in line with McKee et al. [75] through which the standardized precipitation is derived by dividing the difference between the normalized seasonal precipitation and its long-term seasonal precipitation mean by the standard deviation (Equation (1)):
where is the seasonal precipitation at ith rain gauge station and jth observation, where is the long-term seasonal mean, and where σ is its standard deviation.
According to McKee et al. [75], a drought event occurs any time the SPI is continuously negative and reaches an intensity of −1.0 or less, and the event ends when the SPI becomes positive. Drought severity is divided into seven classes in this study: Extremely wet (SPI > 2), very wet (1.5 to 1.99), moderately wet (1.0 to 1.49), near normal (−0.99 to 0.99), moderate drought (−1.49 to −1), severe drought (−1.99 to −1.5), and extreme drought (SPI < −2).
The data used for analysis were obtained from the Jordan Meteorological Department consisted of monthly rainfall amounts for the hydrological year (rain season) in which rainfall starts in October and increases to reach its peak in the winter months (December, January, and February), then decreases gradually to vanish in May in the next year.
In this study, the SPI was calculated on an annual (SPI12), 6-months (SPI6), and 3-months (SPI3) basis. The two SPI6 values for any given year are classified as SPI6W for the wet period from October to March, and SPI6D for the dry period from April to September. Similarly, the four SPI3 were classified as SPI3JFM, SPI3AMJ, SPI3JAS, and SPI3OCD, months (January to March), spring months (April to June), autumn months (July to September), and winter months (October to December), respectively.
At each level, every drought event had a duration (beginning to end), and an intensity for each month that the event continues. The positive sum of the SPI’s for all months within a drought event was then termed as the drought’s magnitude.
3.2. Areal Investigation
In order to investigate the areal extent of droughts in Jordan, tSPI values of all 29 meteorological stations in Jordan for the period from 1980 to 2017 were interpolated using an ordinary kriging interpolation technique via a geostatistical tool within the ArcGIS package [76]. The krig investigation was performed in four steps. The first step involved the determination of the types of distribution. The second step dealt with the characterization of spatial distribution that involved computation of semivariance clouds in all directions using Equation (2) and tested for isotropy [77].
where, is the semivariance, the regionalized variable, and N(h) the number of pairs of sample data taken a distance h.
The third step was modeling through the selection and construction of the best empirical fit to represent the actual SPI spatial variations. There are several theoretical semivariogram models from which to choose (e.g., linear, spherical, Gaussian, exponential, etc.), and the selection was based on both a cross-validation test and the smallest nugget value [78,79]. Within this step, the final variogram model was characterized by its three major components: (1) Distance of independency (major and minor ranges), (2) sill, which represents the ordinary sample variance, and (3) nugget representing the measurement error due to micro-regionalization. It is worth mentioning, as reported by [80], the measuring stations of most in situ geophysical networks are spatially distributed in a highly inhomogeneous manner, being mainly concentrated on continents and population centers, leads to biases in geophysical statistics, serious difficulties in interpolating measurements to a uniform grid.
The fourth step involved the generation of prediction maps for SPI values at unknown locations using the point kriging technique of simple linear weighted-interpolation scheme, or ordinary kriging. The ordinary kriging technique assumes a constant unknown mean, where the value at the un sampled point can be predicted by a linear weighting of the variation between the surrounding points derived from variogram analyses (Equations (3) and (4)).
where, is an unknown constant and is the error associated to unknown location , Z(x0) is the estimated value of at and is the weight that give the best possible estimation from the surrounding points.
3.3. Cluster Investigation
To investigate the spatial and temporal patterns of drought throughout the country, two methods were used: Temporal analysis using multilinear regression and a clustering technique. For the multilinear regression analysis, both time and location were included as independent variables to predict the SPI12 as a response. The significant effect of each independent variable was estimated from the parameter test using both ANOVA and t-test.
In order to group the spatial drought pattern based on the SPI data, hierarchical clustering using Ward’s method joins clusters to maximize the likelihood at each level of the hierarchy under the assumptions of multivariate normal mixtures, spherical covariance matrices, and equal sampling probabilities. The clustering was achieved using JMP statistical software.
In Ward’s minimum variance method, the distance between two clusters is the ANOVA sum of squares between the two clusters added up over all the variables [66]. At each generation, the within-cluster sum of squares is minimized over all partitions obtainable by merging two clusters from the previous generation [81].
4. Results and Discussion
4.1. Investigating Rainfall Trends
The highest mean annual rainfall was recorded at the Salt station (550.1 mm) followed by University of Jordan (486.9 mm), Sweileh (468.6 mm), the RasMunief station (463.9 mm), then Irbid (459.6 mm). Those stations are all located in the north east of the country with elevations higher than 600 m above sea level. The distribution of rainfall data coincides with rainfall distribution isohyets across the country, where only 2% of the country enjoy mean annual rainfall above 400 mm, all of which is located in the northeast. Around 65.8% of the country suffers severe aridity (long mean annual rainfall < 50 mm), and 10.2% falls within the arid zone (long mean annual rainfall between 100–200 mm), thus 90.5% of the country is characterized by an arid to severe arid environment (long mean annual rainfall below 200 mm).
The detailed rainfall time series and trend analyses at both annual and monthly scales indicate huge variability in rainfall data within and between stations (Table 1 and Figure 3). The associated coefficient of variations (CVs) for annual rainfall data ranged from 30.2% up to 83.7%, illustrating the significant variability of rainfall data at each weather station. At the same time, the positive skewness values and high kurtosis values associated at the weather stations indicates the presence of extremely high rainfall in very wet years, though most of the time, the rainfall is much less.
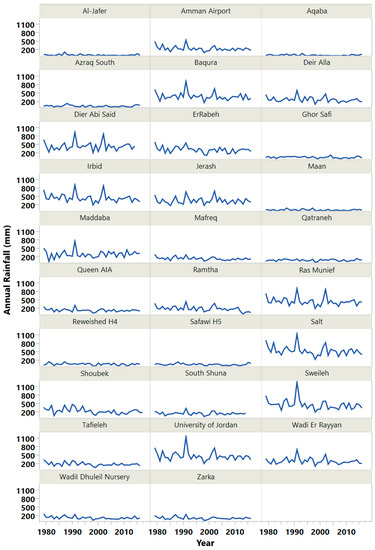
Figure 3.
Historical rainfall distribution by station from 1980 to 2017.
According to the Mann–Kendall test for historical annual rainfall data for the 29 meteorological stations across Jordan, both the correlation coefficient (r) and the Kendall τ values are entirely negative (except for the Madaba station, which might be due to human error in data collection) indicating the decreasing trends in rainfall over time. The significance of rainfall trends varies from highly significant (p < 0.001) to significant (p < 0.05) to nonsignificant (p > 0.05) as indicated by the associated p-values (Table 2). The strongest trends are seen at Mafreq, Queen AIA, Ramtha, Shoubek, and Sweileh weather stations. Similarly, regressed trends across all the weather stations showed decreasing trends and agreed with the Mann–Kendall test results. The linear trends indicate an average decrease of about 1.8 mm/year for the whole country, ranging from 0.04 to 5.2 mm/year. On the other hand, Madaba weather station shows a nonsignificant increase in rainfall records over time, with a mean rate of change of 0.73 mm/year.

Table 2.
Mann–Kendall test and linear regression trend results for the annual rainfall records per weather station.
4.2. Annual Standardized Precipitation Index (SPI12) Variability
The SPI12 results show that 15% of the period between the years 1980 to 2017 is classified as drought (SPI < −1) ranging from normal, through moderate, to extreme drought, while 72% of the records are classified as near normal (Table 3). Conversely, wet conditions, from moderately wet to extremely wet, were recorded for only 13% of the period, much of which fell in the years 1979, 1982, 1987, 1990, 1991, 1994, and 2002. It is important to note that 50% of the SPI data are below zero and thus, 26% of the drought data in Jordan is above normal.

Table 3.
The observed probability for seven categories according to the annual standardized precipitation index (SPI12) values.
There was an extreme drought event across the entire country in 1998–1999, and extreme drought was observed at a few stations in the years 1980/1981, 2007/2008, 2010/2011, and 2012/2013. On the other hand, moderate to severe drought events were observed over the years 1980/1981, 1982/1983, 1984/1985, 1988, 1993, 2003–2008, and 2010–2014 (Figure 4).
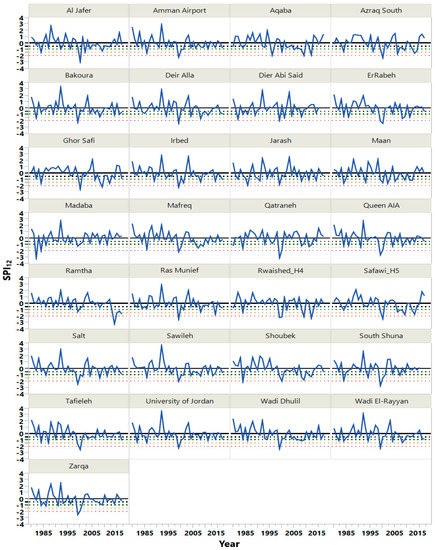
Figure 4.
Annual standardized precipitation index (SPI12) values for each station 1980–2017.
In terms of frequency, drought events tend to occur once every two to three years. On the other hand, the whole country witnessed an extreme drought during 1998/1999 (SPI12 < −2), where its impact extended through the following year. In terms of local impact, the most extreme drought event in the data occurred during 2013/2014, with a SPI12 of −3.2 at Ramtha weather station, the only station at which such an extreme was recorded that year.
The linear regression of SPI12 indicated the existence of a significant increase in drought magnitude over time, at a rate of −0.02 per year (p < 0.0001). This indicates that drought events in Jordan are becoming more frequent and with higher severity (Table 4).

Table 4.
Linear trend analysis for standardized precipitation index over time.
4.3. Seasonal Standardized Precipitation Index (SPI6) Variability
The dry season standardized indices (SPI6D) show little variability overtime for all stations (Figure 5), partly because summers are dry, with rainfall being particularly rare in April and May. Indeed, April and May come at the end of the rainy season, and a drought during the dry season is often due to reduced rainfall during these two months. Except in extremely wet years, rainfall in April and May is less than 5% of the annual total rainfall.
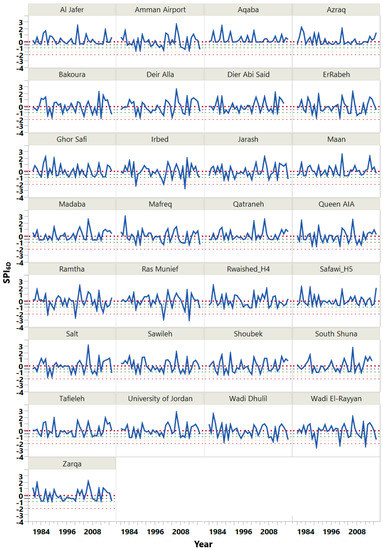
Figure 5.
Dry season standardized precipitation index (SPI6D) values for each station from 1980 to 2017.
The rainfall data for the 1980 to 2017 dry seasons shows that there was a drought for 17.2% of the time (Table 3). On other hand, 46.2% of these drought events were classified as extreme, which may indicate a huge reduction in rainfall during the dry seasons. Based on investigating the linear trends of SPI3D over time, there were no significant trends detected (Table 4).
Although the lowest annual rainfall occurred during the year 1998/1999, the SPI6D indicates that most extreme drought was recorded in 2012 with a value of −2.8 at RasMunief weather station, followed by an event in 2000 with a value of −2.7 for the same station. The drought event at Ramtha station is still considered to be extreme, on the basis of SPI6D, in the years 1987 and 2000, in addition to the event at the Irbid weather station during 1987 and 2010, and at the Wadi El-Rayyan weather station, also in 1987 and 2010.
By investigating the RasMunief weather station records, which is located at the highest point in Jordan, at 1150 m above sea level, it was clear that the rainfall there always extends into April, and sometimes into early May, with an average of about 20 mm for April, and 7 mm for May. However, in the years 2000 and 2012, RasMunief recorded zero rainfall.
The wet season standardized indices (SPI6W) mimics the variability of the annual SPI overtime (Figure 6). This is true as SPI6W represents the variability for about 95% of the rainfall records that falls within the wet months (October to March). In a similar pattern to the annual indices, the drought has a significant linear increase of about −0.02 per year (p < 0.0001).
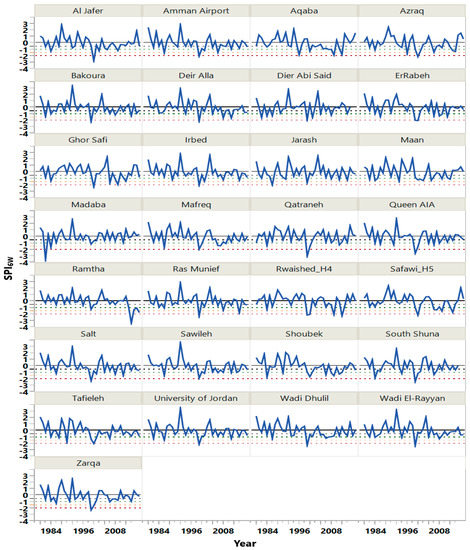
Figure 6.
Wet season standardized precipitation index (SPI6W) values for each station 1980–2017.
4.4. Three-Months Standardized Precipitation Index (SPI3) Variability
The SPI3 values vary from −3.03 to 3.06 with an average of 0.30, though the variability in SPI3 varies according to the investigated months (Table 5 and Figure 7). The highest exist at SPI3JFM followed by SPI3OND, while SPI3JAS has the lowest variability. Since there is no rainfall in July, and since the average rainfall in August is only 0.01 mm, then SPI3JAS shows the variability for September only. Table 3 and Table 5 show that the observed probability is ranging from near normal to extremely wet, and thus, this SPI3 can be used to categorize the existence of extremely wet conditions.

Table 5.
Summary of SPI3 magnitudes for the historical rainfall records from 1980 to 2017.
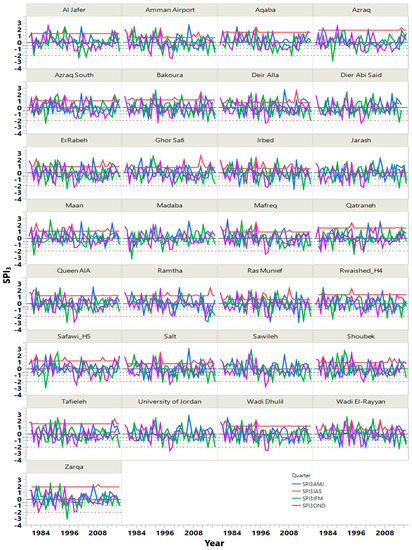
Figure 7.
Standardized precipitation index of quarter periods (SPI3) values 1980–2017.
SPI trend analyses (Table 4) indicated that there are significant increases in drought events, with a rate of −0.015 and −0.01 per year for SPI3JFM and SPI3OND, respectively. However, SPI3AMJ and SPI3JAS show no trends.
Similarly, SPI3AMJ represents the variability in spring time that extends from April to June. In Jordan, the rainfall may extend into April and the first half of May only, therefore SPI3AMJ represents the variability within those two months only, and ranged from −2.77 to 3.06.
In terms of drought occurrence, magnitude, and interval per weather station, the overall SPI3 variability indicates that droughts in Jordan are clearer in the period of October to December and January to March. The data indicates that droughts during these periods is not only longer (as expressed by variability between SPI quarters), but also more severe (magnitude) as indicated by the McKee classification [77].
In addition to the above, SPI3 analyses indicates that national droughts are effective in months and quarters, however local droughts are more evident at specific weather station either in the north or south of the country. This variability shows that droughts in Jordan are either localized or national based on the extent of each one (Figure 8).
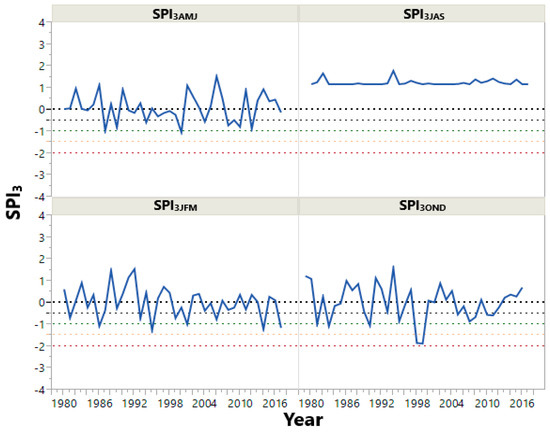
Figure 8.
Overall trend of the standardized precipitation index of quarter periods (SPI3) values from 1980 to 2017.
4.5. Spatial Extent of Drought
The spatial SPI krig maps generated using the geostatistical tool within the ArcGIS package provided visual interpolations for the spatial extent of droughts in Jordan for the period from 1980 to 2017 (Figure 9). The generated maps prove the presence of two drought types based on the extent of the event; local and national. A local drought is confined to a specific geographical area, lasting one season, and there is no observable trend to them; an area suffering a local drought in one year may not experience another for four or five years. Extreme local droughts, however, have a higher intensity than national droughts at specific weather stations, and thus impose severe impacts on local scale geographical locations.
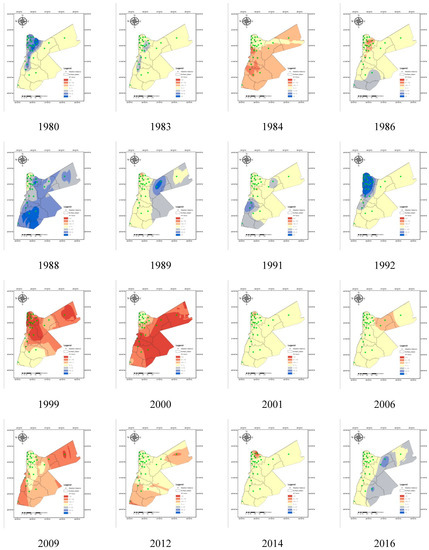
Figure 9.
Spatial SPI krig maps generated for the period from 1980 to 2017.
On the other hand, national droughts, where extremely low or zero rainfall is recorded at all meteorological stations, are very rare. Of course, they have a much greater impact and magnitude than local droughts, and though a national drought can go on for two consecutive years, the time between such events is long.
The krig semivariogram analyses indicate that local droughts are anisotropy in their behavior, with different angles of impact varying from year to year. In most cases, the drought spatial variation is best fitted exponentially with very negligible nuggets and long major ranges. The location of local drought is related to the severity of impact. Local droughts in desert areas, in the west of the country, seems more frequent but with lower impact since the low mean annual rainfall in those areas is less than 50 mm anyway, while local droughts in the highlands is more critical as the mean average there is more than 400 mm.
On the other hand, national droughts had a circular distribution fit in an isotropical behavior, indicating that national droughts impact the whole spatial extent of the country with no specific trends in orientation.
4.6. Cluster Analysis
Using multilinear regression analysis, the ANOVA tables indicated that the effect of the time (year) is more significant than the spatial location as indicated by the very significant probability test of p < 0.001 for time and nonsignificant p = 0.99 for location (Table 6). Regardless of the location of the drought, the average SPI drought magnitude increases over time with an average rate of −0.02 per year (R2 of 0.048 and RMSE of 0.9896).

Table 6.
Regression analysis for SPI12 regarding spatial and temporal scales.
The difference of a drought is clearer in more apparent in some years than others whilst in some there is no significant differences found between weather stations when the extreme event (either wet or dry) was national in scale.
Using Ward’s minimum variance method within hierarchical cluster analysis for SPI12, three significant clusters were identified regardless of the effective year. The dendrogram results illustrated shows the grouping pattern achieved from clustering (Figure 10). The results indicate that spatial locations of each group (cluster) have similar magnitudes and changes overtime that significantly varies from other clusters.
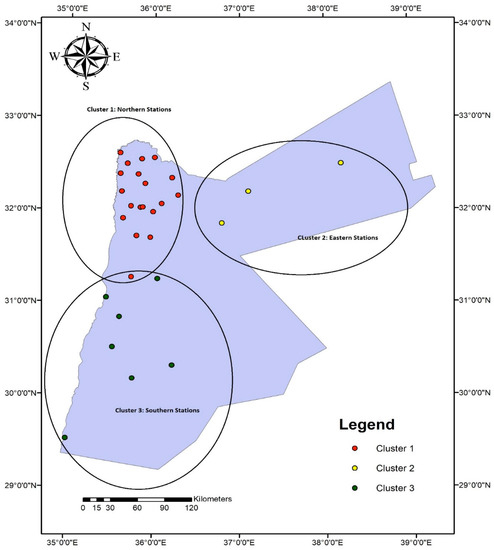
Figure 10.
Drought grouping using Ward’s minimum variance method within hierarchical cluster analysis for SPI12.
The generated grouping actually identifies three main regions in the kingdom: northern, eastern, and southern. Each region has similar micro-climatological conditions. The northern region (shown in red) is characterized by wet patterns with rainfall above 250 mm, while the eastern part of the kingdom (shown in green) represent low rainfall regions with average annual rainfall of less than 100 mm, and finally the southern region is characterized by average annual rainfall of less than 250 mm.
5. Conclusions
Analyzing the data across all scales indicates that Jordan is facing a growing number of drought years. Although there are few variances between annual, 6-months, and 3-months basis SPI, however, the various scaled SPI provides a better understanding of drought occurrences, magnitudes, and severity. The changes in precipitation deficiency according to SPI6 and SPI3 months bases proves that the Jordanian climate is changing fast, with a narrowing of rainfall duration at both tails, and decreasing in quantities over the winter season. Thus, droughts are forecasted to become longer in duration and rather higher in severity. The computed SPIs and generated krig maps for all years in the study suggest the presence of both local and national drought events. Local droughts tend to occur once every two years to three years and are often more severe than national droughts, as indicated at the RasMunief, Ramtha, Irbid, and Wadi El-Rayyan weather stations. On the other hand, extreme national droughts occur once every 15 to 20 years and extend for two or more consecutive years. The linear trend of drought magnitude indicated a significant increase over time with a rate of 2 percent. Analysis of precipitation data starting from 1915 to present indicates that severe droughts have a return period of 20 years before the 1990s, with a declining long-term precipitation rate. After 1995, the return frequency severe droughts increased with recorded severe droughts in 1997–2001 and 2014. The drought of 1958–1962 virtually ended camel husbandry as an economic activity in Jordan and led to changes in agricultural credit schemes. The 1997–2001 drought saw precipitation declines of ~70% across the country and resulted in the only documented official drought declaration in Jordan’s history.
The variability of drought events at the governorate and smaller scales reflects the assets held in each region. The more populated areas with larger agricultural operations may be more sensitive simply because there is more to lose, while sparsely populated dry zones (badia) may not have large municipal populations or agricultural activity. The existence of severe to extreme local droughts demonstrates the need to have a monitoring program to investigate the direct and indirect impacts on all related sectors, and to develop proactive risk management measures and preparedness plans at various physiographic regions. Officials and political decision-makers have difficulty identifying and declaring the onset of drought conditions in both technical and legal senses.
6. Declarations
Availability of Data and Material: The datasets used and analyzed during the current study are available from the corresponding author on reasonable request
Author Contributions
H.A. and E.A.-K. collected, organized and sorted data from Jordan Metrological Department and from various sources and provided software results. H.A. and M.A.Q. performed the assessment and drafted the manuscript, provided skills development, comments and suggestions during data compilation, analysis and results interpretation. H.A. and B.K. and J.R. provided methods guidance to develop the thematic maps, review. All authors read and approved the final manuscript.
Funding
This research received no external funding.
Acknowledgments
We would like to thank the Journal editor and three anonymous reviewers for their suggestions and comments. Following the suggestions, we included several improvements in the manuscript.
Conflicts of Interest
The authors declare that they have no competing or conflict of interests
References
- Sivakumar, M.V.K. Natural Disasters and Extreme Events in Agriculture, Chapter 1of the Book titled: Impacts of Natural Disasters in Agriculture, Rangeland and Forestry: An Overview; Springer: Berlin/Heidelberg, Germany; New York, NY, USA, 2005. [Google Scholar]
- Karavitis, C.A. Drought and urban water supplies: The case of Metropolitan Athens. Water Pol. 1998, 1, 505–524. [Google Scholar] [CrossRef]
- Erian, W.; Katlan, B.; Babah, O. Drought Vulnerability in the Arab Region. Case Study: Drought in Syria Ten Years of Scarce Water (2000–2010). Available online: http://www.unisdr.org/files/23905_droughtsyriasmall.pdf (accessed on 10 June 2019).
- Sun, Y.; Solomon, S.; Dai, A.; Portmann, R.W. How often does it rain? J. Clim. 2006, 19, 916–934. [Google Scholar] [CrossRef]
- Vicente-Serrano, S.M.; Lopez-Moreno, J.I.; Begueria, S.; Lorenzo-Lacruz, J.; Sanchez-Lorenzo, A.; Garcia-Ruiz, J.M.; Azorin-Molina, C.; Moran-Tejeda, E.; Revuelto, J.; Trigo, R. Evidence of increasing drought severity caused by temperature rise in southern Europe. Environ. Res. Lett. 2014, 9, 1–9. [Google Scholar] [CrossRef]
- Wilhite, D.A. Drought as a Natural Hazard: Concepts and Definitions. Available online: http://digitalcommons.unl.edu/droughtfacpub/69 (accessed on 10 June 2019).
- FAO. Drought and Agriculture; International Seminar the Islamic Republic of Iran and the Kingdom of Netherlands: Rome, Italy, 2017. [Google Scholar]
- Karavitis, C.A. Decision support systems for drought management strategies in Metropolitan Athens. Water Int. 1999, 24, 10–21. [Google Scholar] [CrossRef]
- Kastopoulou, E.; Giannakopoulos, C.; Krapsiti, D.; Karali, A. Temporal and Spatial Trends of the Standardized Precipitation Index (SPI) in Greece Using Observations and Output from Regional Climate Models. Perspect. Atmos. Sci. 2017, 475–481. [Google Scholar]
- Vicente-Serrano, S.M.; Gonzalez-Hidalgo, J.C.; de Luis, M.; Raventos, J. Spatial and temporal patterns of droughts in the Mediterranean area: The Valencia region (East-Spain). Clim. Res. 2004, 26, 5–15. [Google Scholar] [CrossRef]
- Vicente-Serrano, S.M.; Cabello, D.; Tomas-Burguera, M.; Martin-Hernandez, N.; Begueria, S.; Azorin-Molina, C.; Kenawy, A. Drought variability and land degradation in semiarid regions: Assessment using remote sensing data and drought indices (1982–2011). Remote Sens. 2015, 7, 4391–4423. [Google Scholar] [CrossRef]
- Langat, P.K.; Kumar, L.; Koech, R. Temporal Variability and Trends of Rainfall and Streamflow in Tana River Basin, Kenya. Sustainability 2017, 9, 1963. [Google Scholar] [CrossRef]
- Li, X.; Wang, X.; Babovic, V. Analysis of variability and trends of precipitation extremes in Singapore during 1980–2013. Int. J. Climatol. 2017, 38, 125–141. [Google Scholar] [CrossRef]
- Klingaman, N.; Keat, W. El Niño 2018-19: Historical Impact Analysis; Available online: https://www.dai.com/uploads/DFID_El%20Nino_2018_Historical%20Impact%20Analysis%20(University%20of%20Reading).pdf (accessed on 10 June 2019).
- Li, X.; Meshgi, A.; Babovic, V. Spatio-temporal variation of wet and dry spell characteristics of tropical precipitation in Singapore and its association with ENSO. Int. J. Climatol. 2016, 36, 4831–4846. [Google Scholar] [CrossRef]
- Surendran, U.; Kumar, V.; Ramasubramoniam, S.; Raja, P. Development of Drought Indices for Semi-Arid Region Using Drought Indices Calculator (DrinC)—A case study from Madurai District, a semi-arid region in India. Water Resour. Manag. 2017, 31, 3593–3605. [Google Scholar] [CrossRef]
- Van Loon, A.F. Hydrological Drought Explained. Wiley Interdiscip. Rev. Water 2015, 2, 359–392. [Google Scholar] [CrossRef]
- Deo, R.C.; Sahin, M. Application of the artificial neural network model for prediction of monthly standardized precipitation and evapotranspiration index using hydrometeorological parameters and climate indices in eastern Australia. Atmos. Res. 2015, 161, 65–81. [Google Scholar] [CrossRef]
- Tsakiris, G.; Pangalou, D.; Vangelis, H. Regional drought assessment based on the reconnaissance drought index (RDI). Water Resour. Manag. 2007, 21, 821–833. [Google Scholar] [CrossRef]
- Vicente-Serrano, S.M.; López-Moreno, J.I. Hydrological response to different time scales of climatological drought: An evaluation of the Standardized Precipitation Index in a mountainous Mediterranean basin. Hydrology and Earth System Sciences Discussions. Eur. Geosci. Union 2005, 9, 523–533. [Google Scholar]
- Vicente-Serrano, S.M. Differences in spatial patterns of drought on different time scales: An analysis of the Iberian Peninsula. Water Resour. Manag. 2006, 20, 37–60. [Google Scholar] [CrossRef]
- Vicente-Serrano, S.M.; Begueria, S.; Lopez-Moreno, J.I. A multi-scalar drought index sensitive to global warming: The standardized precipitation evapotranspiration index—SPEI. J. Clim. 2010, 23, 1696–1718. [Google Scholar] [CrossRef]
- Zambrano, F.; Wardlow, B.; Tadesse, T.; Saaverda, M.L.; Lagos, O. Evaluating satellite-derived long-term historical precipitation datasets for drought monitoring in Chile. Atmos. Res. 2017, 186, 26–42. [Google Scholar] [CrossRef]
- Heim, R.R. A review of twentieth-century drought indices used in the United States. Bull. Am. Meteorol. Soc. 2002, 83, 1149–1165. [Google Scholar] [CrossRef]
- Keyantash, J.; Dracup, J.A. The quantification of drought: An analysis of drought indices. Bull. Am. Meteorol. Soc. 2002, 83, 1167–1180. [Google Scholar] [CrossRef]
- Vicente-Serrano, S.M.; Begueria, S.; Lopez-Moreno, J.I.; Angulo, M.; Kenawy, E.L. A new global 0.58 gridded dataset (1901–2006) of a multiscalar drought index: Comparison with current drought index datasets based on the Palmer drought severity index. J. Hydrometeorol. 2010, 11, 1033–1043. [Google Scholar] [CrossRef]
- AMS (American Meteorological Society). Statement on meteorological drought. Bull. Am. Meteorol. Soc. 2004, 85, 771–773. [Google Scholar]
- Wilhite, D.A.; Glantz, M.H. Understanding the drought phenomenon: The role of definitions. In Planning for Drought; Wilhite, D.A., Easterling, W.E., Wood, D.A., Eds.; Vestview Press: Boulder, CO, USA, 1985; pp. 11–27. [Google Scholar]
- IPCC. Climate Change: The Physical Science Basis; Working Group I Contribution to the IPCC Fifth Assessment Report; Intergovernmental Panel on Climate Change; Cambridge University Press: Cambridge, UK, 2013; Available online: www.ipcc.ch/report/ar5/wg1 (accessed on 10 June 2019).
- Gonçalves, M.; Barrera Escoda, A.; Guerreiro, D.; Baldasano, J.M.; Cunillera, J. Seasonal to yearly assessment of temperature and precipitation trends in the North Western Mediterranean Basin by dynamical downscaling of climate scenarios at high resolution (1971–2050). Clim. Chang. 2014, 122, 243–256. [Google Scholar] [CrossRef]
- Evans, J.P. 21st century climate change in the Middle East. J. Clim. Chang. 2009, 92, 417–432. [Google Scholar] [CrossRef]
- Dai, A. Drought under global warming: A review. Clim. Chang. 2011, 45–65. [Google Scholar] [CrossRef]
- Willeke, G.E.; Hosking, J.R.M.; Wallis, J.R.; Guttman, N.B. The National Drought Atlas; Institute for Water Resources Report 94–NDS–4; U.S. Army Corps of Engineers: Washington, DC, USA, 1994.
- Gibbs, W.J.; Maher, J.V. Rainfall Deciles as Drought Indicators; Bureau of Meteorology: Melbourne, Australia, 1967.
- Palmer, W.C. Meteorological Drought; U.S. Department of Commerce Weather Bureau: Washington, DC, USA, 1965.
- Vicente-Serrano, S.M.; Begueria, S.; Lopez-Moreno, J.I. Comment on “Characteristics and trends in various forms of the Palmer Drought Severity Index (PDSI) during 1900–008” by A Dai. J. Geophys. Res. Atmos. 2011, 116, D19112. [Google Scholar] [CrossRef]
- Alley, W.M. The Palmer Drought Severity Index: Limitation and assumptions. J. Clim. Appl. Meteorol. 1984, 23, 1100–1109. [Google Scholar] [CrossRef]
- Shafer, B.A.; Dezman, L.E. Development of a surface water supply index (swsi) to assess the severity of drought conditions in snowpack runoff areas. In Proceedings of the Western Snow Conference, Fort Collins, CO, USA, 19–23 April 1982; pp. 164–175. [Google Scholar]
- McKee, T.B.; Doesken, N.J.; Kleist, J. The relationship of drought frequency and duration to time scales. In Proceedings of the 8th Conference on Applied Climatology, Anaheim, CA, USA, 17–22 January 1993; pp. 179–184. [Google Scholar]
- Guttman, N.B. Accepting the standardized precipitation index: A calculation algorithm. Am. J. Water Resour. Assoc. 1999, 35, 311–322. [Google Scholar] [CrossRef]
- Hayes, M.J.; Svoboda, M.D.; Wilhite, D.A.; Vanyarkho, O.V. Monitoring the 1996 Drought Using the Standardized Precipitation Index. Bull. Am. Meteorol. Soc. 1999, 80, 429–438. [Google Scholar] [CrossRef]
- Karavitis, C.A.; Alexandris, S.; Tsesmelis, D.E.; Athanasopoulos, G. Application of the Standardized Precipitation Index (SPI) in Greece. Water 2011, 3, 787–805. [Google Scholar] [CrossRef]
- Palfai, I. Description and forecasting of droughts in hungary. In Proceedings of the 14th Congress on Irrigation and Drainage (ICID), Rio de Janario, Brazil,, 30 April–4 May 1990; Volume 1-C, pp. 151–158. [Google Scholar]
- Deo, R.C.; Kisi, O.; Singh, V.P. Drought forecasting in eastern Australia using multivariate adaptive regression spline, least square support vector machine and M5Tree model. Atmos. Res. 2017, 184, 149–175. [Google Scholar] [CrossRef]
- Wilhite, D.A.; Svoboda, M.D.; Hayes, M.J. Understanding the complex impacts of drought: A key to enhancing drought mitigation and preparedness. Water Resour. Manag. 2007, 21, 763–774. [Google Scholar] [CrossRef]
- Chortaria, C.; Karavitis, C.A.; Alexandris, S. Development of the SPI drought index for Greece using geo-statistical methods. In Proceedings of the BALWOIS 2010 International Conference, Ohrid, FYROM, 25–29 May 2010. [Google Scholar]
- Morid, S.; Smakhtin, V.U.; Moghaddasi, M. Comparison of seven meteorological indices for drought monitoring. Iran. Int. J. Climatol. 2006, 26, 971–985. [Google Scholar] [CrossRef]
- Mathbout, S.; Lopez-Bustins, J.A.; Martin-Vide, J.; Bech, J.; Rodrigo, F.S. Spatial and temporal analysis of drought variability at several time scales in Syria during 1961–2012. Atmos. Res. 2018, 200, 153–168. [Google Scholar] [CrossRef]
- Black, E. The impact of climate change on daily precipitation statistics in Jordan and Israel. Atmos. Sci. Lett. 2009, 10, 192–200. [Google Scholar] [CrossRef]
- Lionello, P. (Ed.) The Climate of the Mediterranean Region: From the Past to the Future. 2012. Available online: http://citeseerx.ist.psu.edu/viewdoc/download?doi=10.1.1.459.5178&rep=rep1&type=pdf (accessed on 10 June 2019).
- Turk, M.; Levin, N.; Tessler, N.; Saaroni, H. Recent changes and relations among drought, vegetation and wildfires in the Eastern Mediterranean: The case of Israel. Glob. Planet. Chang. 2016, 151, 28–35. [Google Scholar]
- Lionello, P.; Malanotte-Rizzoli, P.; Boscolo, R. (Eds.) Mediterranean Climate Variability; Elsevier: Amsterdam, The Netherlands, 2006. [Google Scholar]
- Mahfouz, P.; Mitri, G.; Jazi, M.; Karam, F. Investigating the Temporal Variability of the Standardized Precipitation Index in Lebanon. Climate 2016, 4, 27. [Google Scholar] [CrossRef]
- UN. Strengthening National Capacities to Manage Water Scarcity and Drought in West Asia and North Africa: The Analysis, Mapping and Identification of Critical Gaps in Preimpact and Preparedness Drought Management Planning in Waterscarce and in-Transitioning-Settings Countries in West Aisa/North Africa; Department of Economic and Social Affairs (DESA), Economic and Social Commission for Western Asia (ESCWA): UN, Beirut, Lebanon, 2013. [Google Scholar]
- MWI. Jordan Water Sector Facts and Figures; Ministry of Water and Irrigation: Amman, Jordan, 2015.
- World Bank. Promoting Poverty Reduction and Shared Prosperity: Systematic Country Diagnostic; Middle East and North Africa Region. The World Bank Group: Washington, DC, USA, 2016. [Google Scholar]
- DOS. Agricultural Statistics; Department of Statistics: Amman, Jordan, 2017.
- Gilbert, S. Drought and Climate Change in Jordan: An Analysis of the 2008–2009 Drought and Climate Change Impact. Ph.D. Thesis, Pennsylvania State University, State College, PA, USA, 2017. [Google Scholar]
- Hammouri, N.; El-Naqa, A. Drought Assessment Using GIS and Remote Sensing in Amman-Zarqa Basin, Jordan. Jordan J. Civ. Eng. 2007, 1, 142–152. [Google Scholar]
- Abu Sada, A.; Abu-Allaban, M.; Al-Malabeh, A. Temporal and Spatial Analysis of Climate Change at Northern Jordanian Badia. Jordan J. Earth Environ. Sci. 2015, 7, 87–93. [Google Scholar]
- Törnros, T.; Menzel, L. Addressing drought conditions under current and future climates in the Jordan River region. Hydrol. Earth Syst. Sci. 2014, 18, 305–318. [Google Scholar] [CrossRef]
- MoEnv. Capacity Development to support National Drought Management Policy: Drought Conditions and Management Strategies in Jordan; Ministry of Environment: Amman, Jordan, 2014.
- Al-Qinna, M.I.; Hammouri, N.A.; Obeidat, M.M.; Ahmad, F.Y. Drought analysis in Jordan under current and future climates. Clim. Chang. 2011, 106, 421–440. [Google Scholar] [CrossRef]
- JMP. Statistics and Graphics Guide Version 8; SAS Institute Inc.: Cary, CA, USA, 2011. [Google Scholar]
- Paulin, C.; Xiaogang, S. Identification of the Effect of Climate Change on Future Design Standards of Drainage Infrastructure in Ontario; Paulin Coulibaly and Xiaogang Shi, McMaster University Department of Civil Engineering: Ontario, ON, Canada, 2005. [Google Scholar]
- Kendall, M. Rank Correlation Methods, 4th ed.; Charles Griffin: London, UK, 1975. [Google Scholar]
- Gilbert, R. Statistical Methods for Environmental Pollution Monitoring; Wiley: New York, NY, USA, 1987. [Google Scholar]
- Mann, H. Non-parametric tests against trend. Econometrica 1945, 13, 245–259. [Google Scholar] [CrossRef]
- Yue, S.; Pilon, P.; Cavadias, G. Power of the Mann–Kendall and Spearman’s rho tests for detecting monotonic trends in hydrological series. J. Hydrol. 2002, 259, 254–271. [Google Scholar] [CrossRef]
- Abdi, H. Kendall Rank Correlation. In Encyclopedia of Measurement and Statistics; Salkind, N.J., Ed.; Sage: Thousand Oaks, CA, USA, 2007. [Google Scholar]
- Nelsen, R. Kendall tau metric. In Encyclopedia of Mathematics; Hazewinkel, M., Ed.; Springer: New York, NY, USA, 2001. [Google Scholar]
- Sneyers, R. On the Statistical Analysis of Series of Observations; Technical Note 143; World Meteorological Organization: Geneva, Switzerland, 1990; ISBN 978-92-63-10415-1. [Google Scholar]
- DeGaetano, A.T. Recent trends in maximum and minimum temperature threshold exceedences in the North-Eastern United States. J. Clim. 1996, 9, 1646–1660. [Google Scholar] [CrossRef]
- Tigkas, D.; Vangelis, H.; Tsakiris, G. DrinC: A software for drought analysis based on drought indices. Earth Sci. Inform. 2015, 8, 697–709. [Google Scholar] [CrossRef]
- McKee, T.B.; Doesken, N.J.; Kleist, J. Drought monitoring with multiple time scales. In Proceedings of the Ninth Conference on Applied Climatology, Dallas, TX, USA, 15–20 January 1995. [Google Scholar]
- ESRI, ArcView GIS Version 9.2. A Computer Software to Visualize, Explores, Query and Analyze Data Spatially; Environmental Systems Research Institute (ESRI): Redlands, CA, USA, 2006.
- Selker, J.S.; Keller, C.K.; McCord, J.T. Vadose Zone Processes; Lewis Publishers, CRC Press LLC: Boca Raton, FL, USA, 1999. [Google Scholar]
- Goovaerts, P. Geostatistics for Natural Resources Evaluation; Oxford University Press: New York, NY, USA, 1997. [Google Scholar]
- Scott, H.D. Soil Physics: Agricultural and Environmental Applications; Iowa State University Press: Ames, IA, USA, 2000. [Google Scholar]
- Lovejoy, S.; Schertzer, D.; Ladoy, P. Fractal characterization of inhomogeneous geophysical measuring networks. Nature 1986, 319, 43–44. [Google Scholar] [CrossRef]
- Milligan, G.W. An examination of the effect of six types of error perturbation on fifteen clustering algorithms. Psychometrika 1980, 45, 325–342. [Google Scholar] [CrossRef]
© 2019 by the authors. Licensee MDPI, Basel, Switzerland. This article is an open access article distributed under the terms and conditions of the Creative Commons Attribution (CC BY) license (http://creativecommons.org/licenses/by/4.0/).