Article

The Evolution of Climate Changes in Portugal: Determination of Trend Series and Its Impact on Forest Development

by
Leonel J. R. Nunes
1,*,
Catarina I. R. Meireles
1,
Carlos J. Pinto Gomes
1,2 and
Nuno M. C. Almeida Ribeiro
1,3
1
ICAAM—Instituto de Ciências Agrárias e Ambientais Mediterrânicas, Universidade de Évora, 7000-083 Évora, Portugal
2
Departamento da Paisagem, Ambiente e Ordenamento, Universidade de Évora, 7000-671 Évora, Portugal
3
Departamento de Fitotecnia, Universidade de Évora, 7000-083 Évora, Portugal
*
Author to whom correspondence should be addressed.
Climate 2019, 7(6), 78; https://doi.org/10.3390/cli7060078
Submission received: 18 April 2019 / Revised: 23 May 2019 / Accepted: 28 May 2019 / Published: 1 June 2019
(This article belongs to the Special Issue Climate Change, Carbon Budget and Energy Policy)

Abstract

:
Climate changes are a phenomenon that can affect the daily activities of rural communities, with particular emphasis on those directly dependent on the agricultural and forestry sectors. In this way, the present work intends to analyse the impact that climate changes have on forest risk assessment, namely on how the occurrence of rural fires are affecting the management of the forest areas and how the occurrence of these fires has evolved in the near past. Thus, a comparative analysis of the data provided by IPMA (Portuguese Institute of the Sea and the Atmosphere), was carried out for the period from 2001 to 2017 with the climatic normal for the period between 1971 to 2000, for the variables of the average air temperature, and for the precipitation. In this comparative study, the average monthly values were considered and the months in which anomalies occurred were determined. Anomalies were considered in the months in which the average air temperature varied by 1 °C than the value corresponding to the climatic norm, in at least 50% of the national territory. The same procedure was repeated for the variable precipitation, counting as anomaly the occurrence of a variation in precipitation of 50%, also in 50% of the national territory. Then the calculation of the moving averages for cycles of 3, 5 and 7 periods were applied, and the trend lines were projected. Subsequently, the relationship between the results obtained and the occurrence of rural fires as well as the spatial distribution of forest area, species and structure were analyzed. From the results obtained it was possible to confirm the existence of a tendency for the occurrence of climatic anomalies, highlighting the occurrence of an increasing number of months with temperatures higher by at least 1 °C. It was possible to foresee the relation between the occurrence of rural fires and the periods of anomaly and absence of precipitation. From the results obtained it is also possible to infer that, analyzing the tendency for these phenomena to occur, it can be necessary to change the “critical period of rural fires”, since it is verified that what is currently in use does not covers the entire period where anomalies occur and where large-scale rural fires potentially can happen.

1. Introduction

The study of the climate is a complex field of investigation presently in great evolution, mainly due to the number of factors that can intervene in it, such as temperature, precipitation, sea currents and solar radiation, among others. These factors interact directly with the energy balance of the planet, provoking variations in different time scales, e.g. from tens to thousands or even millions of years, which make Earth’s climate never static [1,2,3].
Climate changes can be defined as global variations of the Earth’s climate, due to natural causes, but also to the action of Man [4]. Climate changes occurs at very different times and over all climatic parameters, such as temperature, precipitation, cloudiness, and so on. The designation “greenhouse effect” is applied to the phenomenon of retention of solar radiation by Earth’s atmosphere through a layer of gases called “greenhouse gases”. Without them life as it is known would not be possible, since the planet would be too cold [5].
Among these gases are carbon dioxide, nitrogen oxides and methane, which are produced mainly by industry, agriculture and the combustion of fossil fuels. The industrialized world contributed to increase the concentration of these gases by about 30% during the 20th century, when, without human action, nature was able to balance these emissions [6]. Today, there is a consensus about the idea that the current model of energy production and consumption is generating global climate changes, which in turn will cause serious impacts both on planet’s environment and on socioeconomic systems [7].
In the distant year of 2001, the Third Assessment Report of the Intergovernmental Panel on Climate changes (IPCC) highlighted the evidence provided by observations of physical and biological systems showing that regional changes in climate, more specifically the increases in temperatures, were affecting different systems in several parts of the planet [8]. The report definitively stated that there were mounting evidences of the existence of climate changes and its derived impacts. However, the temperature increased by about 0.6 °C during the 20th century [9].
More recently, in 2013, the IPCC Summary for Policy Makers stated that “man’s influence on the climate is obvious. This is evident from the growing concentration of greenhouse gases in the atmosphere, and it is extremely likely that human influence is the dominant cause of warming since mid-20th century. The continuous emission of greenhouse gases will cause further warming and changes in all climatic components of the planetary system. Limiting climate changes will require a substantial and sustainable reduction in the production and emission of greenhouse gases” [10]. Climate changes affects everyone on the planet indiscriminately. The potential impact is huge with predictions of lack of potable water, major changes in food production conditions and rising mortality rates due to floods, storms, droughts and heat waves [11].
Climate changes are not only an environmental phenomenon, but also have profound economic and social consequences. The poorest countries, which are least equipped to deal with rapid changes, will suffer the worst consequences. Extinction of animals and plants is expected as habitats will change so sharply that many species will not be able to adapt in time to survive. The World Health Organization (WHO) warned that the health of millions of people can be threatened by increased malaria, malnutrition and diseases [12,13].
Portugal, because of its geographical situation and socioeconomic characteristics, is very vulnerable to climate changes. As a consequence, even if there are uncertainties that do not allow the expected climate changes to be quantified with sufficient precision, the information validated so far is sufficient to take immediate action, in accordance with the so-called “Precautionary Principle”, which to is made reference in Article 3 of the United Nations Framework Convention on Climate Change (UNFCCC) [14]. Inertia, delays and the irreversibility of the climate system are very important factors to be taken into account and, the longer it takes to start action, more the effects of increasing concentrations of greenhouse gases will be less reversible [15].
Climate change presents major challenges for the Portuguese forestry sector. The effects of climate changes on forest ecosystems in Portugal are already evident in many respects. Anticipated impacts of future climate scenarios indicate a progressive intensification of these effects as the 21st century progresses, e.g., in the distribution of forest formations, structural and functional changes, in certain parameters of forest health, greater vulnerability to extreme weather events and rural fires, and a change in the flow of environmental goods and services that forests provide [16].
The interactions between the forest area and the problem of climate changes must be analyzed from two perspectives. On the one hand, it is necessary to contemplate what the forests can bring to the reduction of this problem, being a path to mitigation, and on the other hand, what impact climate changes can have on forests, analyzing their adaptation and evolution [17].
These interactions are not independent and are affected by complex interconnection and cause-effect processes. For example, the importance of forests to mitigate CO2 concentrations can be affected if the impact of climate changes reduce their storage capacity through growth and development constraints, or increases the problem of rural fires. In other words, it is necessary to define and apply tools to manage forests more efficiently, to tackle the problem of climate changes, interlinking adaptation and mitigation, with a view to adaptation in order to mitigate its effects and consequences [18,19].
In Portugal, forests occupy approximately 3.2 million hectares, about 35% of the total area of the country [20]. Portuguese forests provide many benefits and services, including clean water and air, recreational and leisure spaces, wildlife habitats, carbon sequestration and storage, climate regulation, and a variety of forest products with a large impact on the economy [21,22].
Climate influences the structure and function of forest ecosystems and plays a key role in forest health. A changing climate can intensify many of the threats to forests, such as the outbreak of pest outbreaks, fires, drought and the very development of populations there [23]. Climate changes directly and indirectly affect the growth and productivity of forests through changes in temperature, precipitation, climate and other factors. In addition, high levels of carbon dioxide can also affect plant growth. These changes influence the complex forest ecosystems in various ways [24].
Together with the impacts resulting from the effects of climate changes, forests face impacts due to the development of land management, namely due to their use and occupation, periodic rural fires and atmospheric pollution. Although it is difficult to separate the effects of these different factors, the combined impact is already causing changes in Portuguese forests. As these changes are expected to continue in the coming decades, some of the economic aspects provided by forests may be compromised in the short term [25].
This review article is intended to approach climate changes, starting from the global perspective and then to deal specifically with the Portuguese situation, from the point of view of impacts. Following sections deal specifically with the evolution of the climate in Portugal, with the objective of understanding how these variations can influence the development of the forest. In this way, an analysis of the current state and the development of the climate in the last years is presented, both in terms of the evolution of the average air temperature and precipitation evolution. An analysis is also made of the effects of the changes and their relationship with the occurrence of rural fires in Portugal, with particular attention to the period 2001 to 2017, and to the way in which these occurrences interfere in the development and evolution of forests. Finally, an analysis is made of the impacts of climate changes and its consequences on Portuguese forests, in particular due to the increase in the occurrence of rural fires, pests and occurrence of forest invasive species.

2. Impact of Climate Changes in Forest Production

2.1. Forest Growth and Productivity

There are several aspects related to climate changes that are most likely to significantly affect the growth and productivity of forest species. Examples of such factors are the rise in temperature, changes in precipitation levels and increases in the concentration of carbon dioxide [26].
The rise in temperature generally increases the duration of a plant’s growing season. This factor also contributes to the change in the geographic dispersion of some tree species. In this way, the habitats of some types of trees tend to move to the north or to higher altitudes. Other species will be at risk locally or regionally if the conditions in their current geographical ranges are not the most appropriate. For example, species that currently exist only on top of mountains in some regions may disappear as the climate warms up as these species cannot evolve to a higher altitude [27].
Climate change is most likely to increase the risk of drought in some areas and the risk of extreme rainfall and flooding in other regions [28]. Increased temperatures change the defrosting time, affecting the seasonal availability of water. Although many trees achieve up to a certain degree of drought, rising temperatures can make future droughts more damaging than they have in the past. In addition, drought increases the risk of rural fires, since dry trees and shrubs provide fuel for the fires. Drought also reduces sap trees’ ability to produce sap, which protects them from destructive insects and disease [29].
Carbon dioxide is needed for photosynthesis, the process by which green plants use sunlight to grow. With sufficient water and nutrients, increases in atmospheric CO2 concentration may allow trees to have higher growth rates, which may alter the distribution of tree species. Growth will be higher on nutrient rich soils, with no water limitations, and will decrease with reduced fertility and water supply [30].

2.2. Pests, Invasive Species and Rural Fires

Climate changes can change the frequency and intensity of negative impacts on the forest, such as pest outbreaks, invasive species proliferation, rural fires and storm surges. These disturbances can reduce forest productivity and change the distribution of forest species. In some cases, forests may recover from a disturbance, but in other cases, existing species may evolve or disappear. In these cases, new plant species that colonize a given area create a new type of forest [31].
According to the opinion of several authors [32,33,34], with temperatures rising as the climate changes and warms, insects will become more active, and consequently more ravenous and abundant, increasing the likelihood of occurrence of insect pests. In this way damage to crops, both agricultural and forestry, is bound to increase [32]. This argument gains strength, as the increase in temperature accelerates the metabolism and reproduction of insects. The same authors estimate that each degree of increase in temperatures will mean increased damage in crops of 10% to 25% [32].
Unlike mammals and birds, insects heat or cool according to their environment. When an insect warms up, its metabolism accelerates. The faster you burn energy, the more voraciously the insect feeds and the sooner you can reproduce. The analysis of this information has allowed researchers to conclude that the growth rates of the populations are not very different among the different types of insects, allowing the development of a mathematical model that simulates the growth of the insect populations. This simulation allows us to infer the damage caused by these same populations of insects in the crops, both agricultural and forestry [32,34].
Tropical insects generally are already close to the upper limit of their temperature tolerance, so it can be concluded that it will not be in these regions that the greatest variations in insect populations will surely be observed. In areas with a more temperate climate, insects can significantly accelerate their activity, causing more damage to the crops. Variations in temperature may encourage or discourage insect species from invading new territories. Temperatures can also affect the parasites that attack the same insects that attack the crops, so the end result will greatly depend on the ability of all stakeholders to evolve and adapt to the new reality [32,35].
A number of biotic and abiotic agents have been identified in Portugal that are capable of causing physiological imbalances responsible for changes in tree development and that may be associated with the high frequency with which rural fires occur, which may lead to the onset of pests and diseases. Table 1 presents some of these pests that constitute major sanitary problems for the Portuguese forest.
The xylophagous or subcortical insects that attack the trunk can be considered as the most serious pests, since they block the circulation of sap, putting at risk the survival of the tree. Some of these insects also have the ability to inoculate agents that contribute to the weakening and death of trees [36]. Insect attacks on leaves usually do not jeopardize tree survival (with the exception of very severe attacks on young stands), as the young tree has been completely stripped of needles, leading to the tree’s death. In other situations, for example with older and larger trees, canopy regeneration may occur, although it may show a decrease in its annual growth rate, since the energy reserves will be channeled for the renewal of the foliage [36].
This situation is more critical in the resinous species since its leaf surface is renewed in a slower way than in the hardwood species. However, it is the pests and diseases introduced in Portugal that cause the most damage to the forest. This is an example of the introduction of the woody pine nematode (Bursaphelenchus xylophilus) in 1999, which is currently the most serious forest health problem in Portugal, and is responsible for enormous economic losses, not only due to the dead pine trees, but also due to the strong restrictions on the export of pinewoods [36].
Eucalyptus also suffered from the introduction of exotic species, such as mortality caused by the eucalyptus borer (Phoracantha semiounctata) in the late 1990s, mainly in Beiras and Alentejo and, more recently, the damage caused by the defoliant weevil in the North and Center regions [36].
Recently, other exotic insects have been registered in Portugal, such as the eurasian golden-bug (Thaumastocoris peregrinus) and the chestnut-horned wasp (Dryocosmus kuriphilus) [37]. Its medium and long-term impact in the national territory is not yet known, but because of the risk of being an emerging pest, action plans have already been implemented for its control [36]. Lack of natural controls such as predators or pathogens, as well as the fact that tree defenses are unsuitable for these harmful agents, may allow insects to spread. Climate changes could contribute to an increase in the severity of future insect outbreaks. Rising temperatures may allow some species of insects to develop more rapidly, alter their seasonal life cycles, and expand their activity to other latitudes than usual [38,39].
In 2017, rural fires consumed more than 442,000 hectares of forest in Portugal, causing 104 human casualties and more than 600 million euros in losses [40,41]. High temperatures and drought conditions during the early summer contributed to this tragic scenario [42]. The rural fires of 2017 were the largest catastrophe in the country in terms of the number of fatalities since the fateful floods of 1967 [43]. Rural fires cause a feeling of impotence in the population, which considers them almost a fatality intrinsic to the Portuguese forest, to the point of generalizing the expression “fire season”, as if it were naturally part of the calendar as another season [44]. Since 2000, 200 people have died as a result of rural fires in Portugal [45].
As mentioned earlier, hundreds of thousands of hectares of forest have disappeared, accounting for more than half of the area burned in Europe in 2017 [46] and comprising a great historical landmark, since the fire decimated a significant part of the Pinhal do Rei in Leiria, from where the legend must have left the mythical wood that served to build the ships and caravels that led the Portuguese in the period of maritime expansion [44]. But it was not only the past that was destroyed, since the industrial and agricultural sectors were also largely hit, putting a high number of jobs at risk.
However, this event is not new and in 2017 it only reached the contours that it reached due to the absurd number of deaths and injuries, since in previous years similar phenomena were observed, except for the number of victims. The effect of climate changes is expected to contribute to increasing the extent, intensity and frequency of rural fires in certain areas of the country. Warmer spring and summer temperatures, coupled with reduced availability of water, dry woody materials in forests and increase the risk of rural fires.
Fires can also contribute to the very phenomenon of climate changes, as they can cause large and rapid releases of carbon dioxide into the atmosphere [47]. It is important to note that fire activity is not only determined by drought as a structural basis and by meteorology as the conjunctural basis of risk. The continued aridity has effects of greater temporal availability of all vegetation to burn, resulting in campaigns of continuous or extended fires, creating the conditions for large fires more easily and quickly than under the “normal” regime of situations [48].
The concept of “aridity” of fuel has been related in the USA with the increase in rural fires in size and severity [49]. This concept, as well that of fine fuel moisture content (FFMC) [50], is related to climate changes and contributes to the regime of extreme fires of the past gradually becoming the current normal fire regime [51]. Spring weather, and especially June weather conditions, led to very significant fuel “aridity” conditions. The months of June 2015–2017 along with the four-year period 2003–2006 were the hottest since record keeping, coinciding with years of larger fires [52]. There is, however, a significant difference between 2017 and the years 2003 to 2006, which means that in 2017 the concept of “aridity” of fuel has reached its maximum in Portugal by making a warm June to hot spring happen, what differentiates 2017 from the years of great fires of the recent past. As a result, in 2017 there was an advance of the first major fires of the year to June, when in the past they had always occurred in late July and early August. This change constitutes a clear impact of the effect of climate changes on contemporary fire regimes [53].
In the data presented in Table 2 it can be observed that the occurrence of rural fires has been a recurring situation in recent years. The table shows the area burned in fires from 1980 to 2017, as well as the number of ignitions occurred during the same period, in order to allow the correlation between the fires and the burning area and the annual costs caused by rural fires. From the analysis of the data it is possible to infer a tendency for the growth of the area burned in rural fires, mainly from the 90s, although this tendency has already occurred since the 80s, but with less significance. According to the Portuguese Nature and Forests Conservation Survey (ICNF) available data, the 10 years with the highest area burned all occurred after this period, including the peak year in 2017. This period coincides with many of the hottest years recorded throughout the country.
This type of occurrence, especially when it occurs simultaneously, can interact with one another, or with changes in temperature variation and amount of precipitation, to increase the risks for the occurrence of several impacts on the forests. For example, drought can weaken trees and make the forest more susceptible to rural fires or outbreaks of insect pests and diseases. Similarly, after the occurrence of a forest fire, the forest may become more vulnerable to insect pests and diseases. This permanent occurrence of rural fires in Portugal, in addition to the environmental impact that is easily recognized, also has a very significant impact on the economic perspective.
In fact, as already mentioned, the trivialization of the “fire season” as if it were a seasonally repeatable period of the Portuguese year led to the inclusion of significant amounts of costs in the state budget for the prevention of rural fires, in addition to the creation of an increasingly modern and prepared device to combat the fires. Table 2 presents as well the costs related to the occurrence of rural fires from 1980 to 2017. From the simple analysis of the data, there is a progressive increase in costs associated with the growth of the burned areas. The amount presented represents the sum corresponding to the amount spent each year on the prevention, combat and costs associated with the damages caused by rural fires.
This phenomenon of rural fires in Portugal, which it is now beginning to be understood can be boosted by climate changes, does not however originate in these changes or even natural causes in the overwhelming majority of occurrences. Nowadays, the cause of the origin of the great majority of the rural fires is already investigated, being therefore possible to refute the thesis of the natural origin for these occurrences.
Both the ICNF and the Nature and Environment Protection Survey (SEPNA), belonging to the National Republican Guard (GNR), have the human and technical capacity to analyze the causes that caused a certain ignition and disseminate the results of the investigations in documents that are available at their respective websites, which can be followed at the addresses, respectively (www.icnf.pt and http://www.gnr.pt/atrib_SPENA.aspx). From the analysis of these data we obtain the results that are presented in Table 3.
From the analysis of the data presented in Table 3, it can be observed that in the vast majority of cases, rural fires have an accidental, negligent or willful origin, origin in human activity, and the role of natural phenomena to which responsibilities, are clearly very insignificant. This group includes, for example, the occurrence of dry thunderstorms, very frequent in the summer. However, as shown in the previous table, with a very insignificant weight in the overall number of occurrences. Among all the frequent causes, it continues to be the “use of fire”, mainly in the form of burnings to eliminate agricultural and forest residues, that is the main cause for the occurrence of rural fires (Figure 1).

3. Evolution of Climate Changes in Portugal

3.1. Framework

As previously mentioned, climate can be defined as the set of long-term meteorological conditions prevailing in a given area. Thus, in this perspective, the average values of the climatic variables of a given location will be more representative according to the time interval used in the analysis, thus constituting a time serie. In this way, the same results are not obtained when comparing a time interval of one year with one of 10 years, or one of 100 years. It is important to have long time series of data to analyze the variations and the evolution of the climate. For example, the Portuguese Institute of the Sea and the Atmosphere (IPMA), has available series of meteorological data dating back to 1865 [55].
The World Meteorological Organization (WMO) agreed that climate characterization is done by analyzing the mean values of the various climatic elements over a period of 30 years [56,57]. This period is the normal value of a climatic element and represents the average value corresponding to a sufficiently long number of years to be assumed to represent the predominant value of that element at the site under consideration [58,59]. Similarly, the WMO designates the statistical values obtained for periods of 30 years, starting in the first year of each set of years (1901–1930, 1931–1960, 1961–1990, 1991–2020) [60]. These are the reference normals or average representative values, however, can be calculated and used climatological normals based on intercalary periods, for example periods like 1951–1980 or 1971–2000 [55].
The Portuguese Institute of the Sea and Atmosphere (IPMA) provides online information on the climatological normal of 21 meteorological stations for the period 1971–2000, including monthly and annual values of the main climatic elements. In the same website are also available the average values of air temperature and total precipitation. For the two climatic parameters selected, average air temperature and precipitation, IPMA provides information on the occurrence of anomalies by creating maps of isolines representing, in the case of average air temperature, areas where the air temperature exceeded (positive or negative) the values of the last climatic normal (period from 1971 to 2000). Likewise, for precipitation, isoline maps are also presented, thus representing percentage of the amount of precipitation occurred compared to normal climatic conditions (period 1971 to 2000).
Subsequently, new maps of isolines based on the previous ones, made available by the IPMA website, were constructed, which were simplified in order to facilitate the reading and counting of the number of anomalies that occurred, both for the average air temperature and for the precipitation. After counting the anomalies in the period from 2001 to 2017 for the two parameters selected, tables were elaborated presenting the data. For the verification of the existence of a trend of occurrence of events and to allow a better visualization of the results, a moving average model was applied, because this method facilitate the smoothing of the plotting of the data allowing an easier visualization of the eventual trend.

3.2. Air Temperature Anomalies

The most well-known and referred parameter when it comes to the subject of climate changes is surely the rise of air temperature. If on the one hand the scientific community addresses other parameters with the same concern and capacity for analysis, civil society refers to this particular issue, often without understanding its real effects, but mainly because it is the most approached by the media. It is a rare day when no news comes out in all kinds of media that do not allude to “global warming” and the “greenhouse effect”, or very specifically to its effects and consequences anywhere in the world, such as occurrences of rural fires, hurricanes, floods, long periods of drought, rising sea levels or changing monsoon cycles.
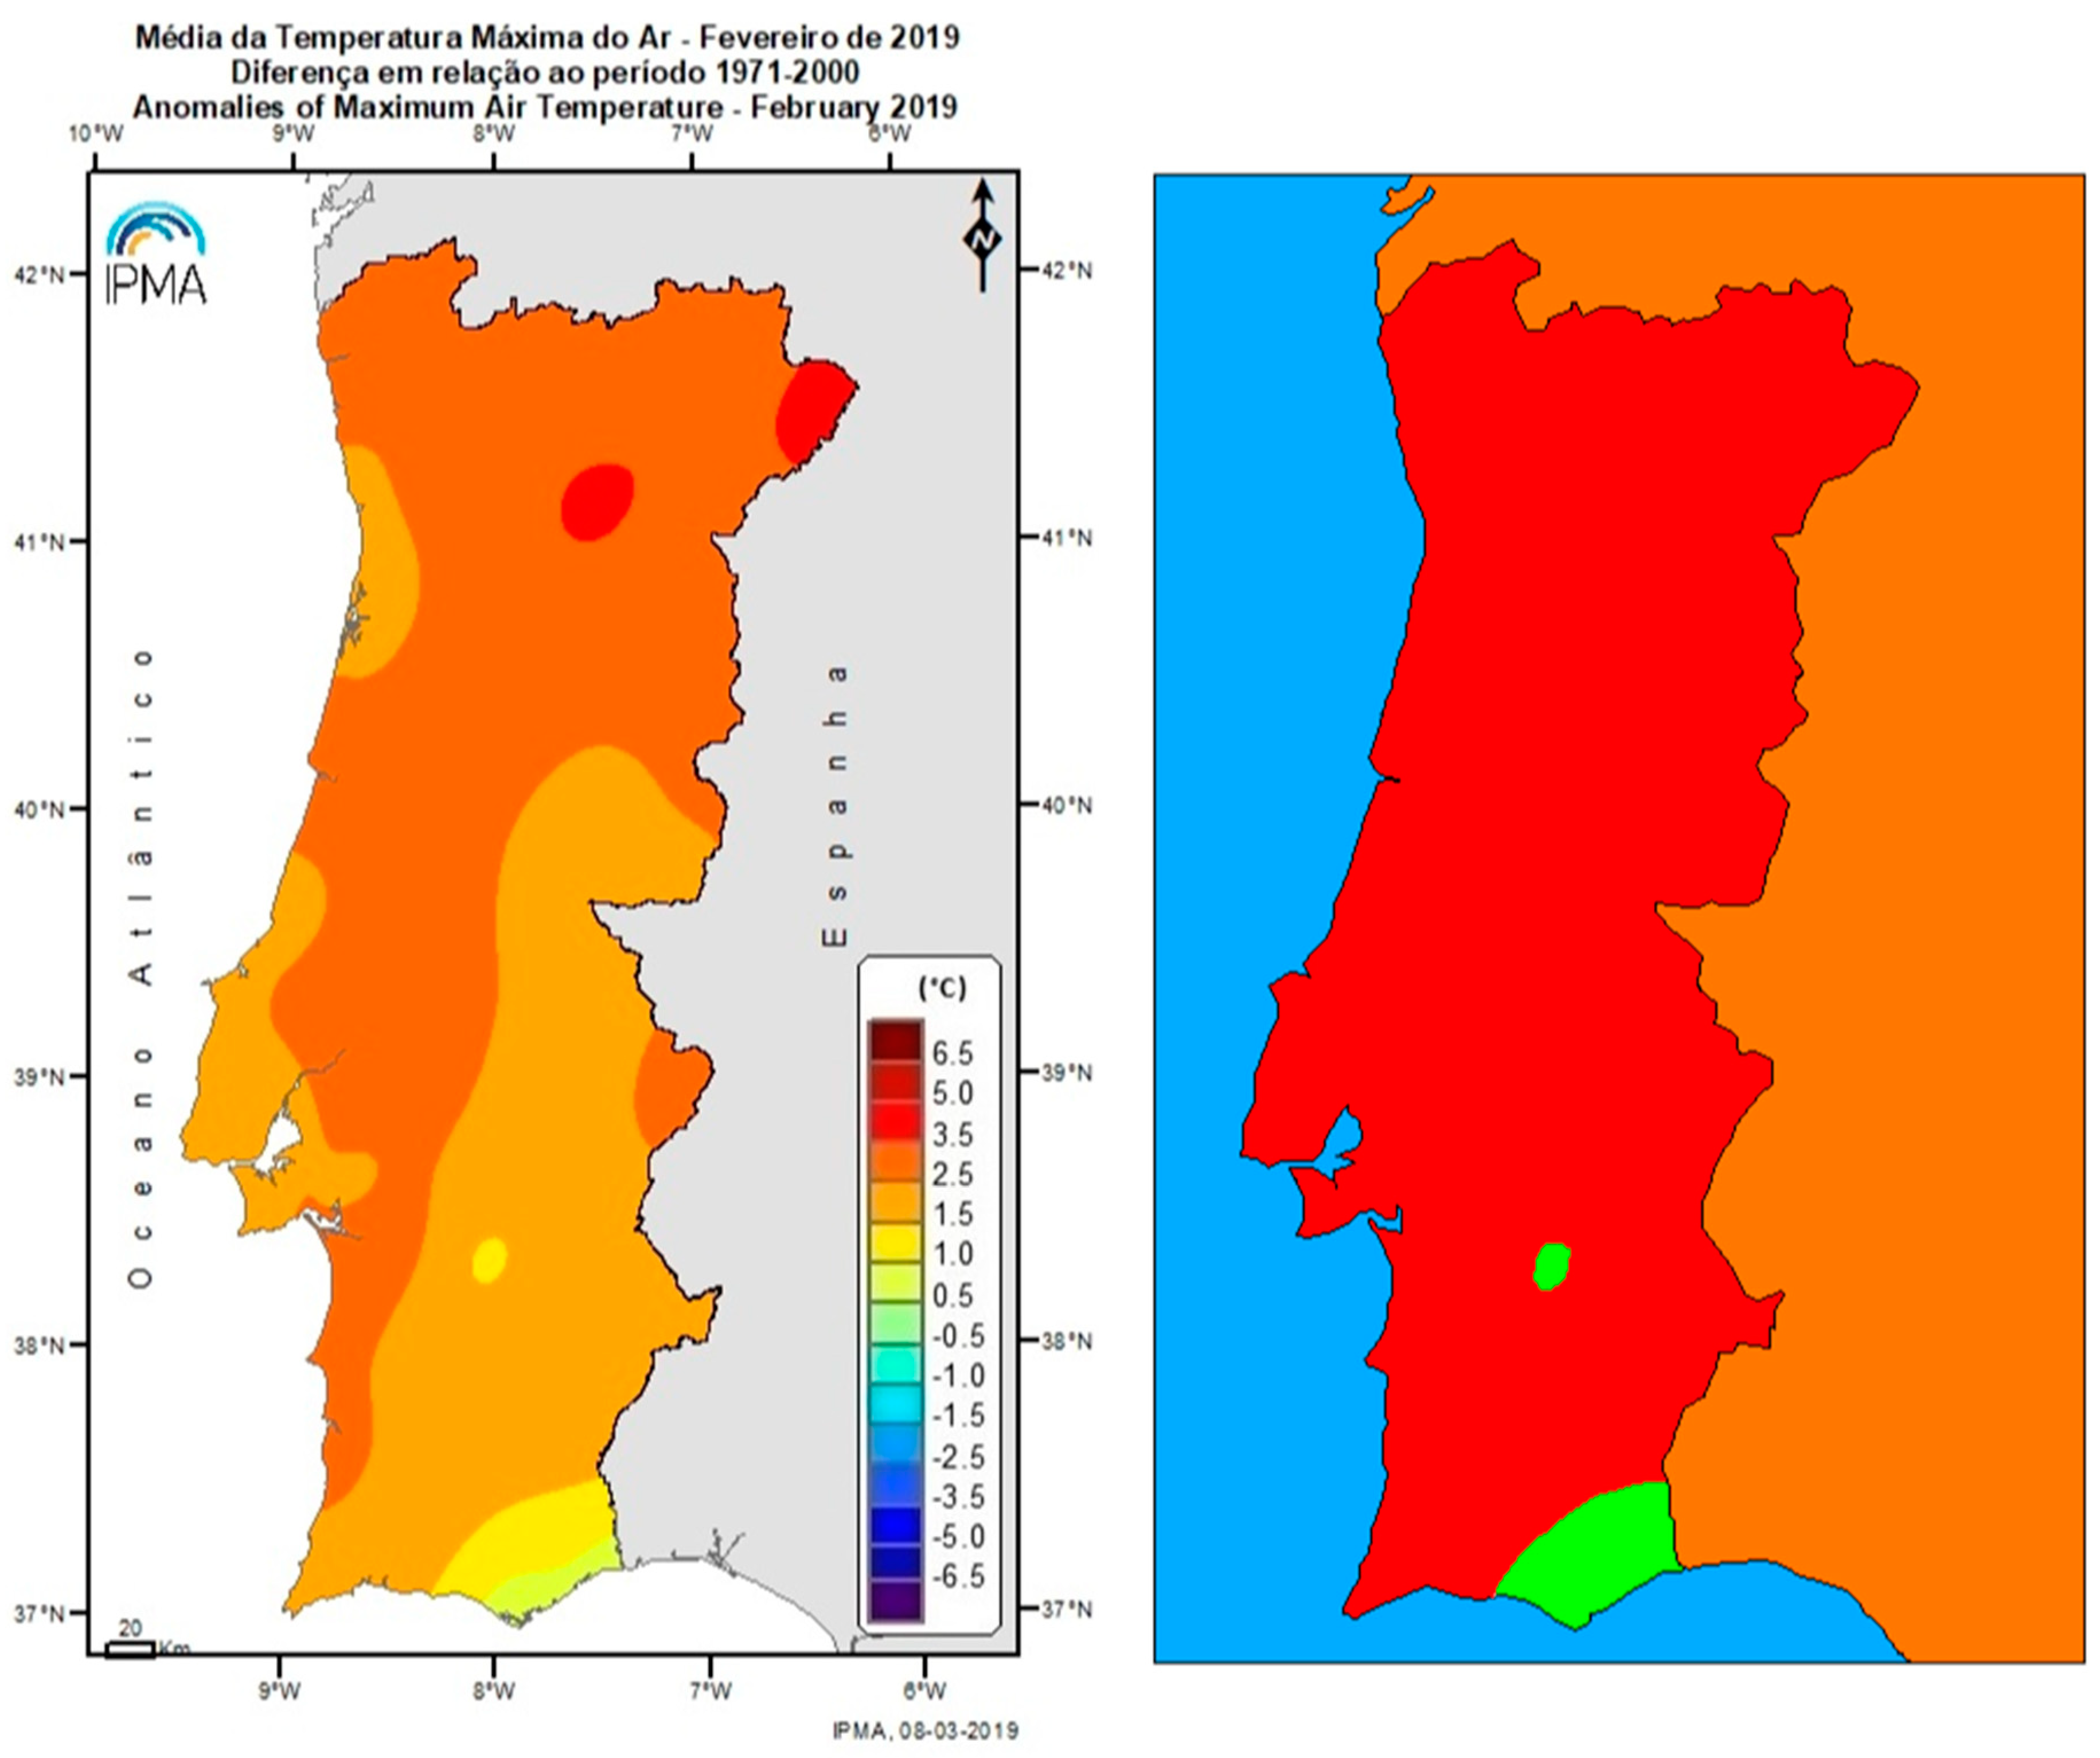
Thus, this section analyzes the occurrence of anomalies in the average air temperature. In this particular case, the occurrence of an anomaly is considered whenever the average monthly temperature exceeds 1 °C, compared to normal climatic conditions during the period 1971–2000. Based on this analysis, isoline maps were constructed, as the presented in the example of Figure 2, which visually indicate which regions of the country have exceeded +1 °C (colored in red), −1 °C (colored in blue) and which were similar to normal climatic (colored in green). An abnormal month is considered when at least 50% of the national territory has been subjected to temperature values above or below 1 °C compared to normal climatic conditions (period 1971–2000).
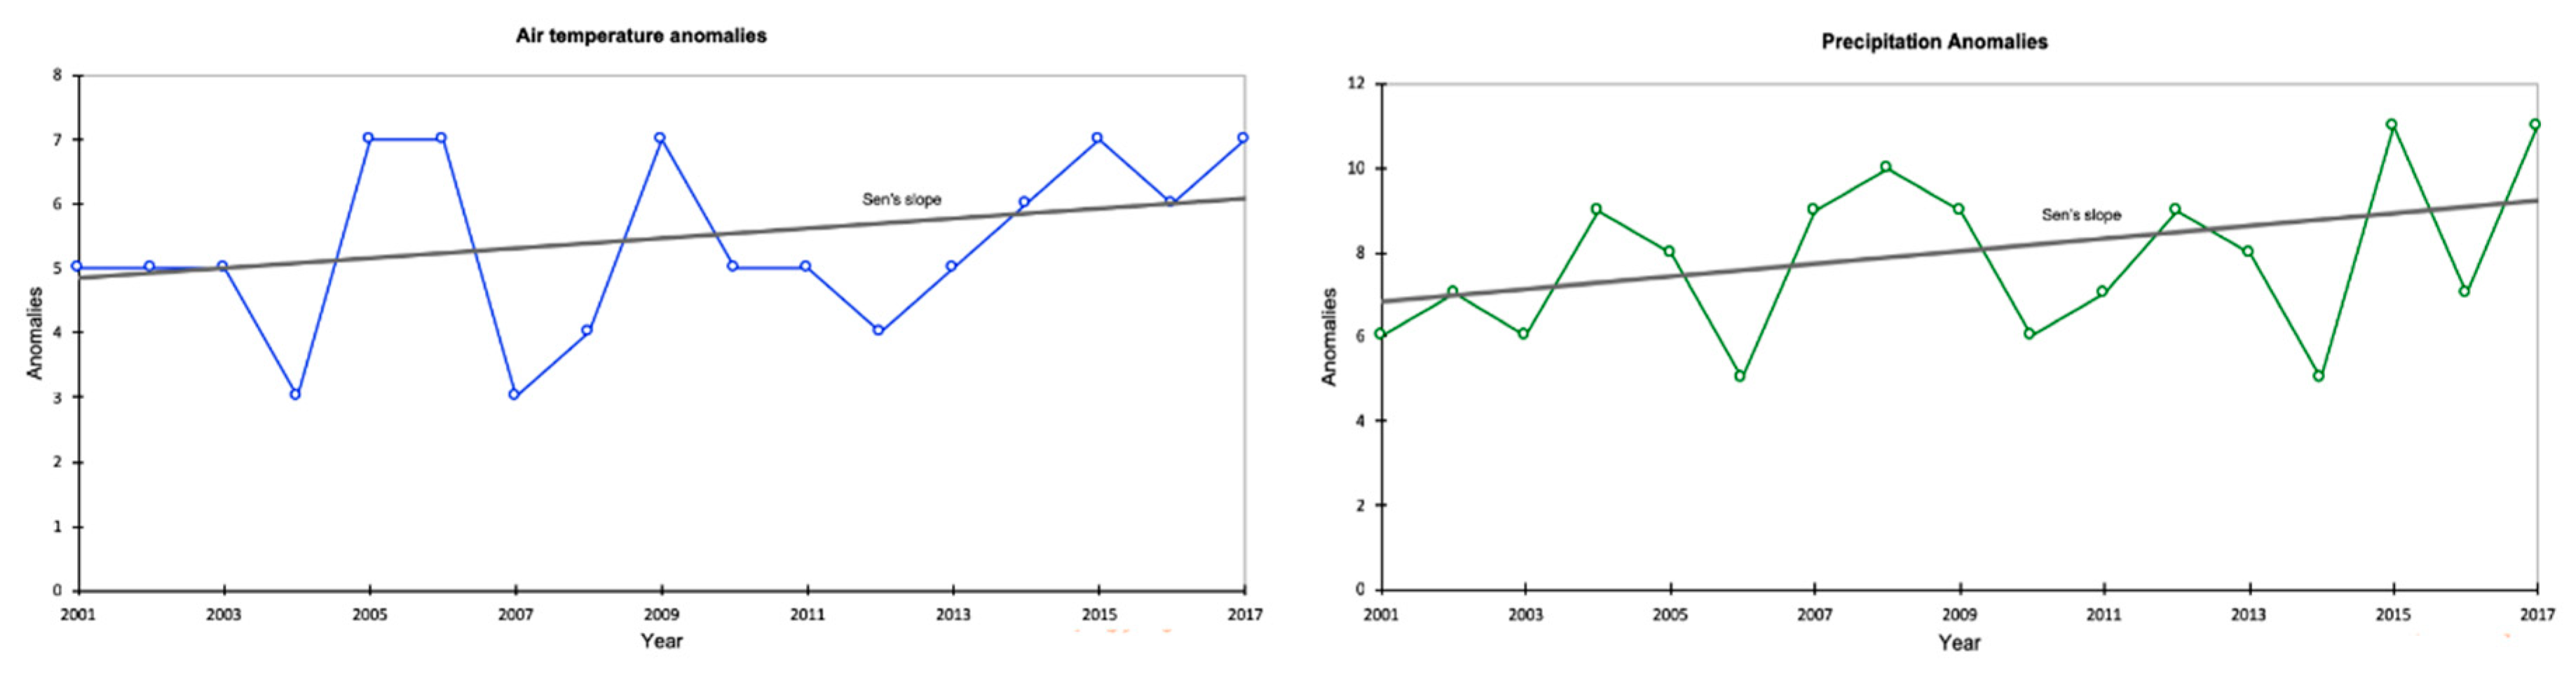
Table 4 shows the anomalies observed in the period between 2001 and 2017. As can be seen, there was a significant set of anomalies in all the constituent years of the period, with a maximum of anomalies of 7 occurring in 2017 2005, 2006, 2009, 2015 and 2017. The lowest number of anomalies was reached in 2004 and 2007, with 3 occurrences. Based on these data, it is necessary to determine the existence of a tendency for an increasing number of anomalies, that is, to determine if the number of anomalies occurring in the period between 2001 and 2017 shows a tendency to occur in some sense. For this inquiry the simple moving average method was used [61].
The determination of the simple moving average of a set of n elements is obtained by calculating the unweighted averages of the subsets of n elements in a given set of data. For example, given a set of n elements p1, …, pn, the first element of the moving average is given by Equation (1):
M n = p 1 + + p n n = 1 n
the second is given by Equation (2):
M n = p 2 + + p n + 1 n = 1 n i = 2 n + 1 p i
or even by Equation (3):
M n = M n + p n + 1 n p 1 n
and so on until pn−n+1,…,pn.
The same 
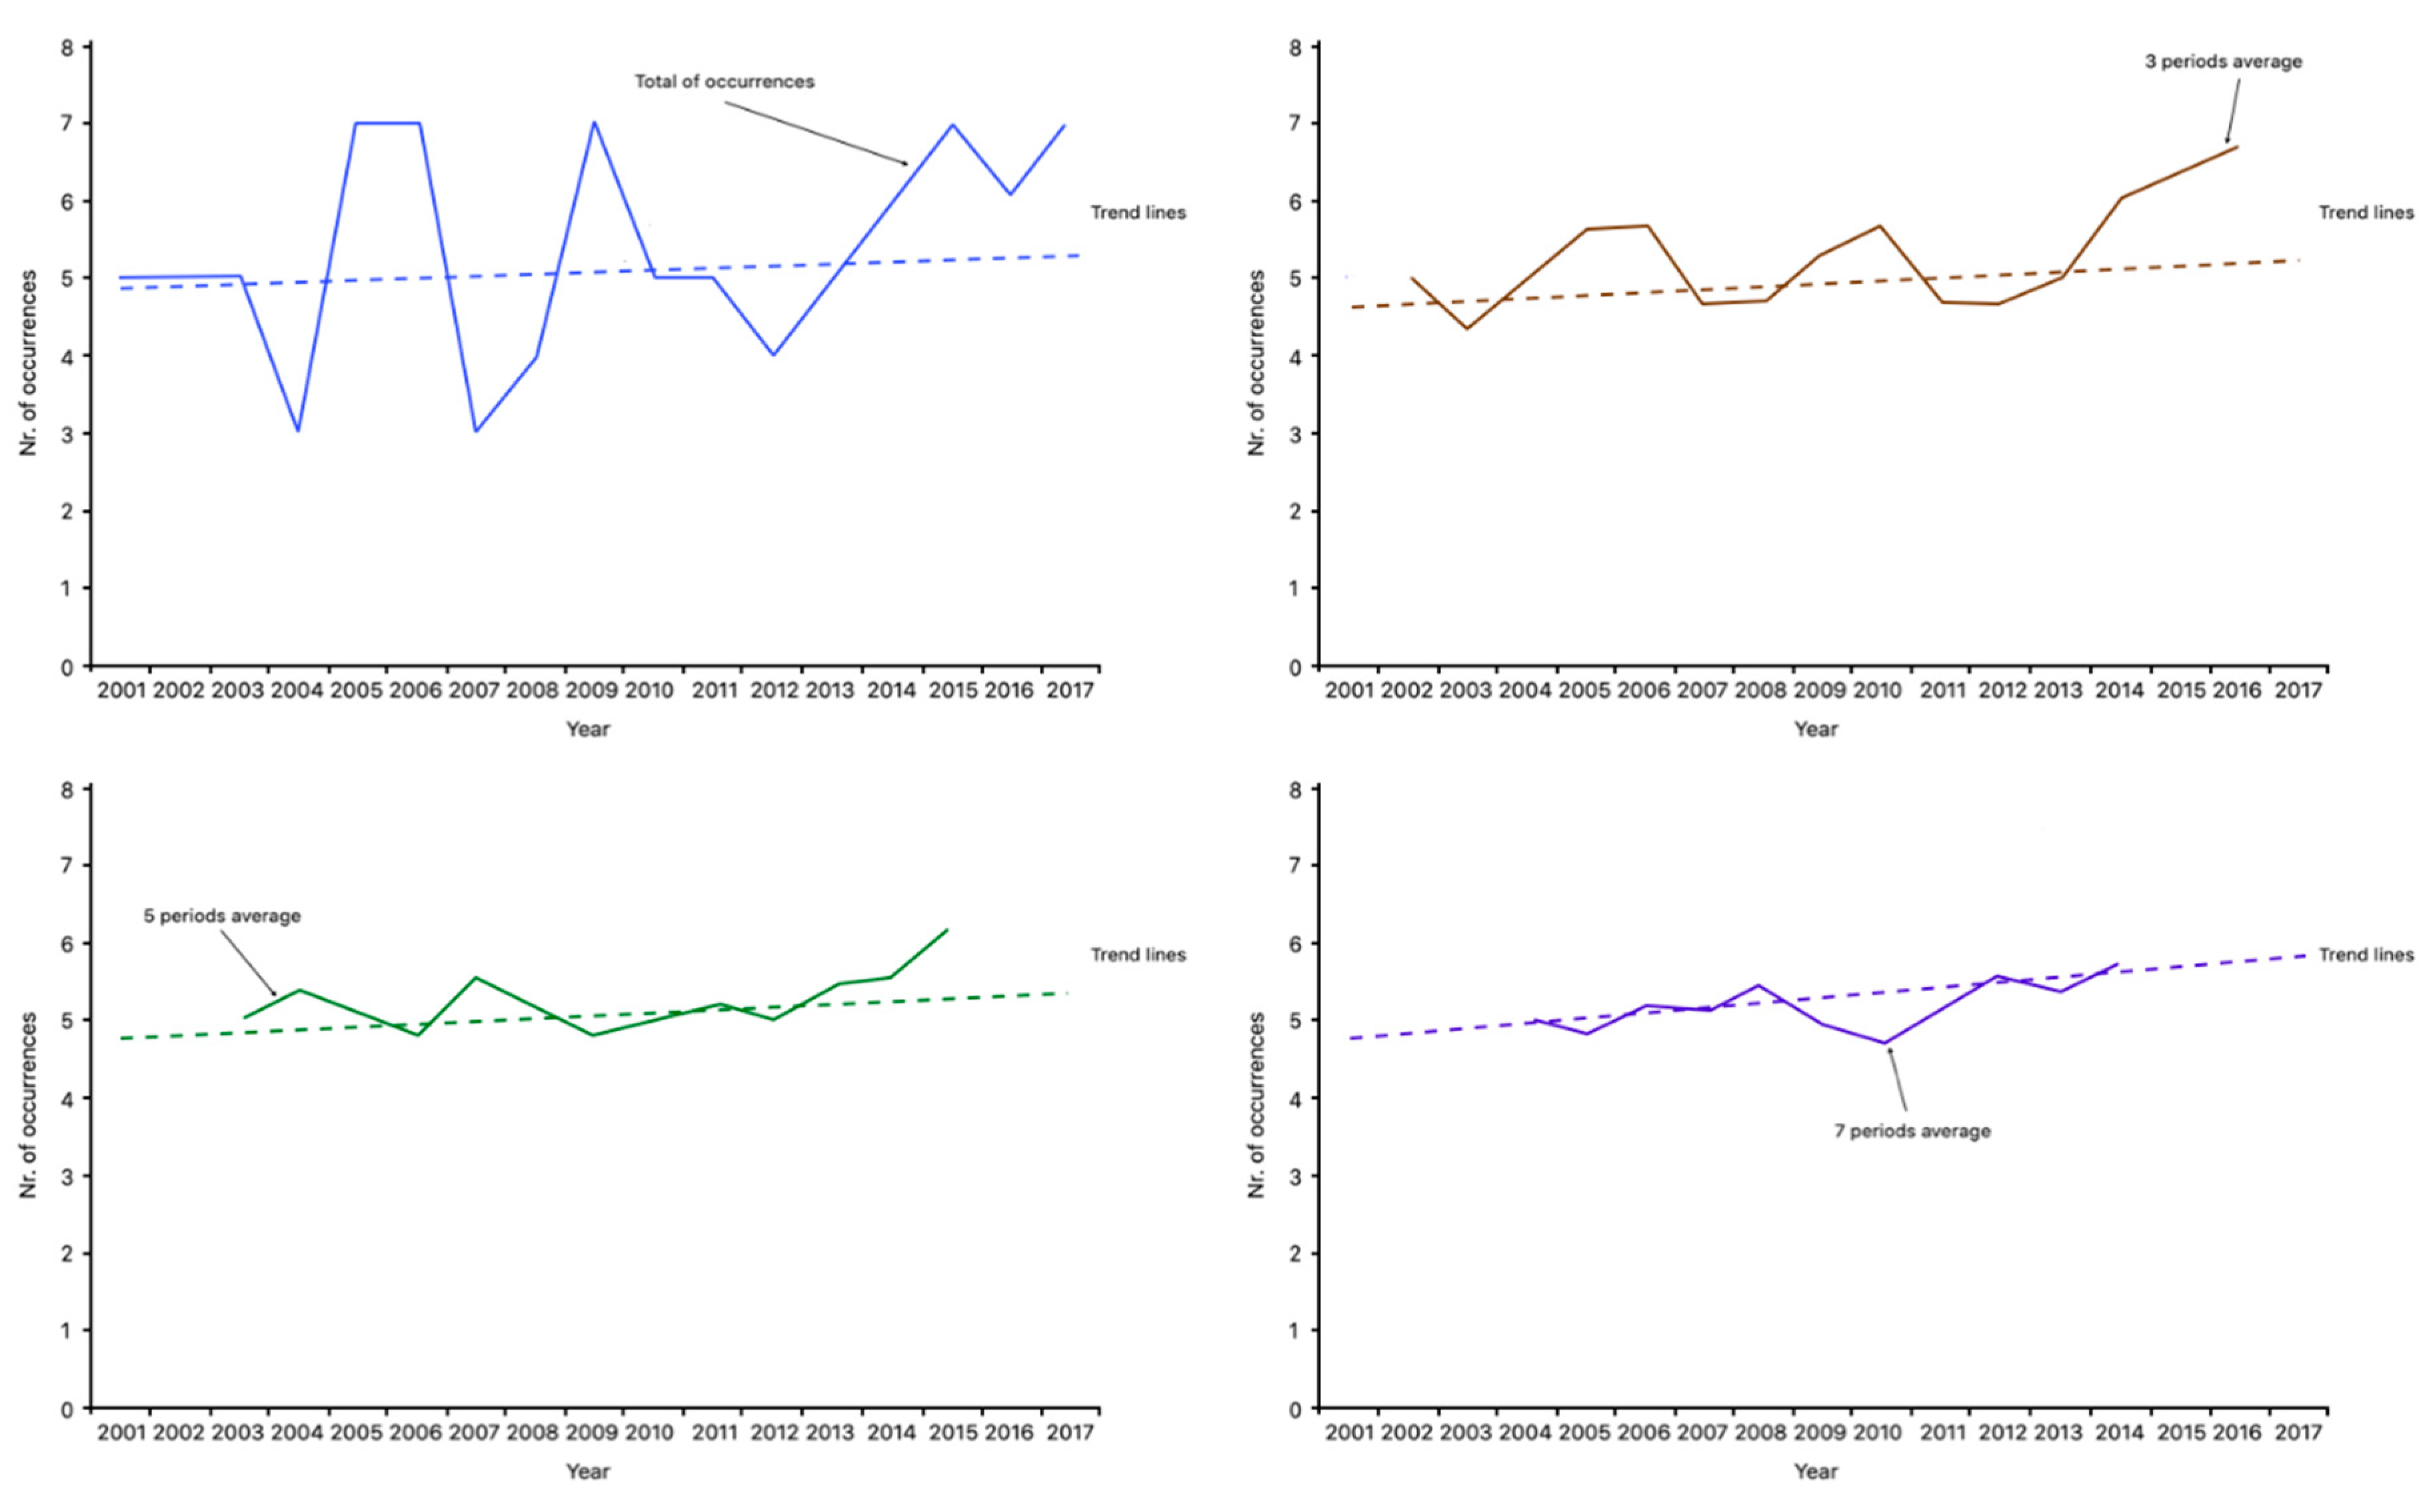
Table 5 presents the results of the application of the simple moving average method and in Figure 3 the trend lines are presented. In this particular situation the method was applied for 3, 5 and 7 periods, since it was understood that for the number of data available, it would be sufficient.
The application of the periods consists in the aggregation of data groups according to the period used, and in the performance of the average of that group, the result obtained corresponds to the average element of the group. For example, for an average of three periods, the first three years, 2001, 2002 and 2003 are selected, and the average number of occurrences for these three years are determined. The final result is assigned to the middle element, in this case it is the year 2002. Then the operation was repeated for the group of the next three elements, 2002, 2003 and 2004, and so on.
For the calculation of the means of five and seven periods, the procedure is similar, but now, instead of selecting three elements, five or seven will be selected, repeating the operation for all the elements of the sample. The higher the number of data available, more averages with different periods can be calculated, the data being analyzed as linearly as possible. It is in this way that one can determine if there is a growing or decreasing tendency of the occurrence of a given event (Figure 2).
In the previous figure is showed the projection of the data previously presented in Table 1. As can be seen, the real data or the total occurrences, represented by the blue line, allow the creation of a trend line and indicate by itself a perspective increase in the number of occurrences. However, with the application of the simple moving averages method, it is verified that the lines corresponding to each of the averages, the average of three periods being represented by the brown line, the average of the five periods represented by the green line and the average of seven periods represented by the purple line, indicate in a much more visible way an increasing tendency for the occurrence of climatic anomalies. This fact is even more noticeable when one observes the lines or lines of trend, which clearly indicate an increasing trend towards a more frequent occurrence of this event.
In addition to this verification of the tendency for a given event to occur, in this case the occurrence of climatic anomalies, it is also necessary to verify the probability of occurrences occurring in one month to the detriment of another, since this seasonality, associated to the occurrence of precipitation and to the biological cycles of plant growth may be determinant for the increased risk of occurrence of rural fires, as well as for their degree of intensity and severity.
Table 5 presents the distribution of climatic anomalies by the months of the constituent years of the period under analysis. As can be seen in the data presented in Table 5, although there is a dispersion for all the months of the year, since climatic anomalies occurred in all months of the year without exception. Over the last 17 years under analysis in this study, there is a higher concentration of these events in the spring and early summer months (April, May and June), so if factors are also anomalous in the following months, summer and autumn, also associated to the occurrence of precipitation anomalies, a strong probability of occurrence of ideal conditions for the outbreak of rural fires of great intensity and severity.
As can be seen, there is also a strong tendency for air temperature anomalies to occur during the summer and autumn months, so it can be said that the probability of repeating situations such as those occurring in 2017, favorable for the outbreak of fires in summer and autumn, is very high.

3.3. Precipitation Anomalies

Similar to the methodology used for the previous section, maps of isolines were created on the maps made available on the IPMA website (www.ipma.pt). In these maps, the zones of the country where precipitation was at least equal to that of the normal climatic period used in this study, the period 1971 to 2000 were defined as an anomaly when in a given month, in at least 50% of the continental national territory, precipitation was lower than that occurred in the period of normal climatic conditions.
Table 6 shows the precipitation anomalies observed in the period between 2001 and 2017. As can be seen, there was a significant set of anomalies in all the constituent years of the period, with a maximum of 11 anomalies occurring until 2017, in the years of 2015 and 2017, but in 2008 there were 10 anomalies, and in the years 2004, 2007, 2009 and 2012, there were 9 anomalies. The lowest number of anomalies was reached in the years 2006 and 2014, with 5 occurrences. 
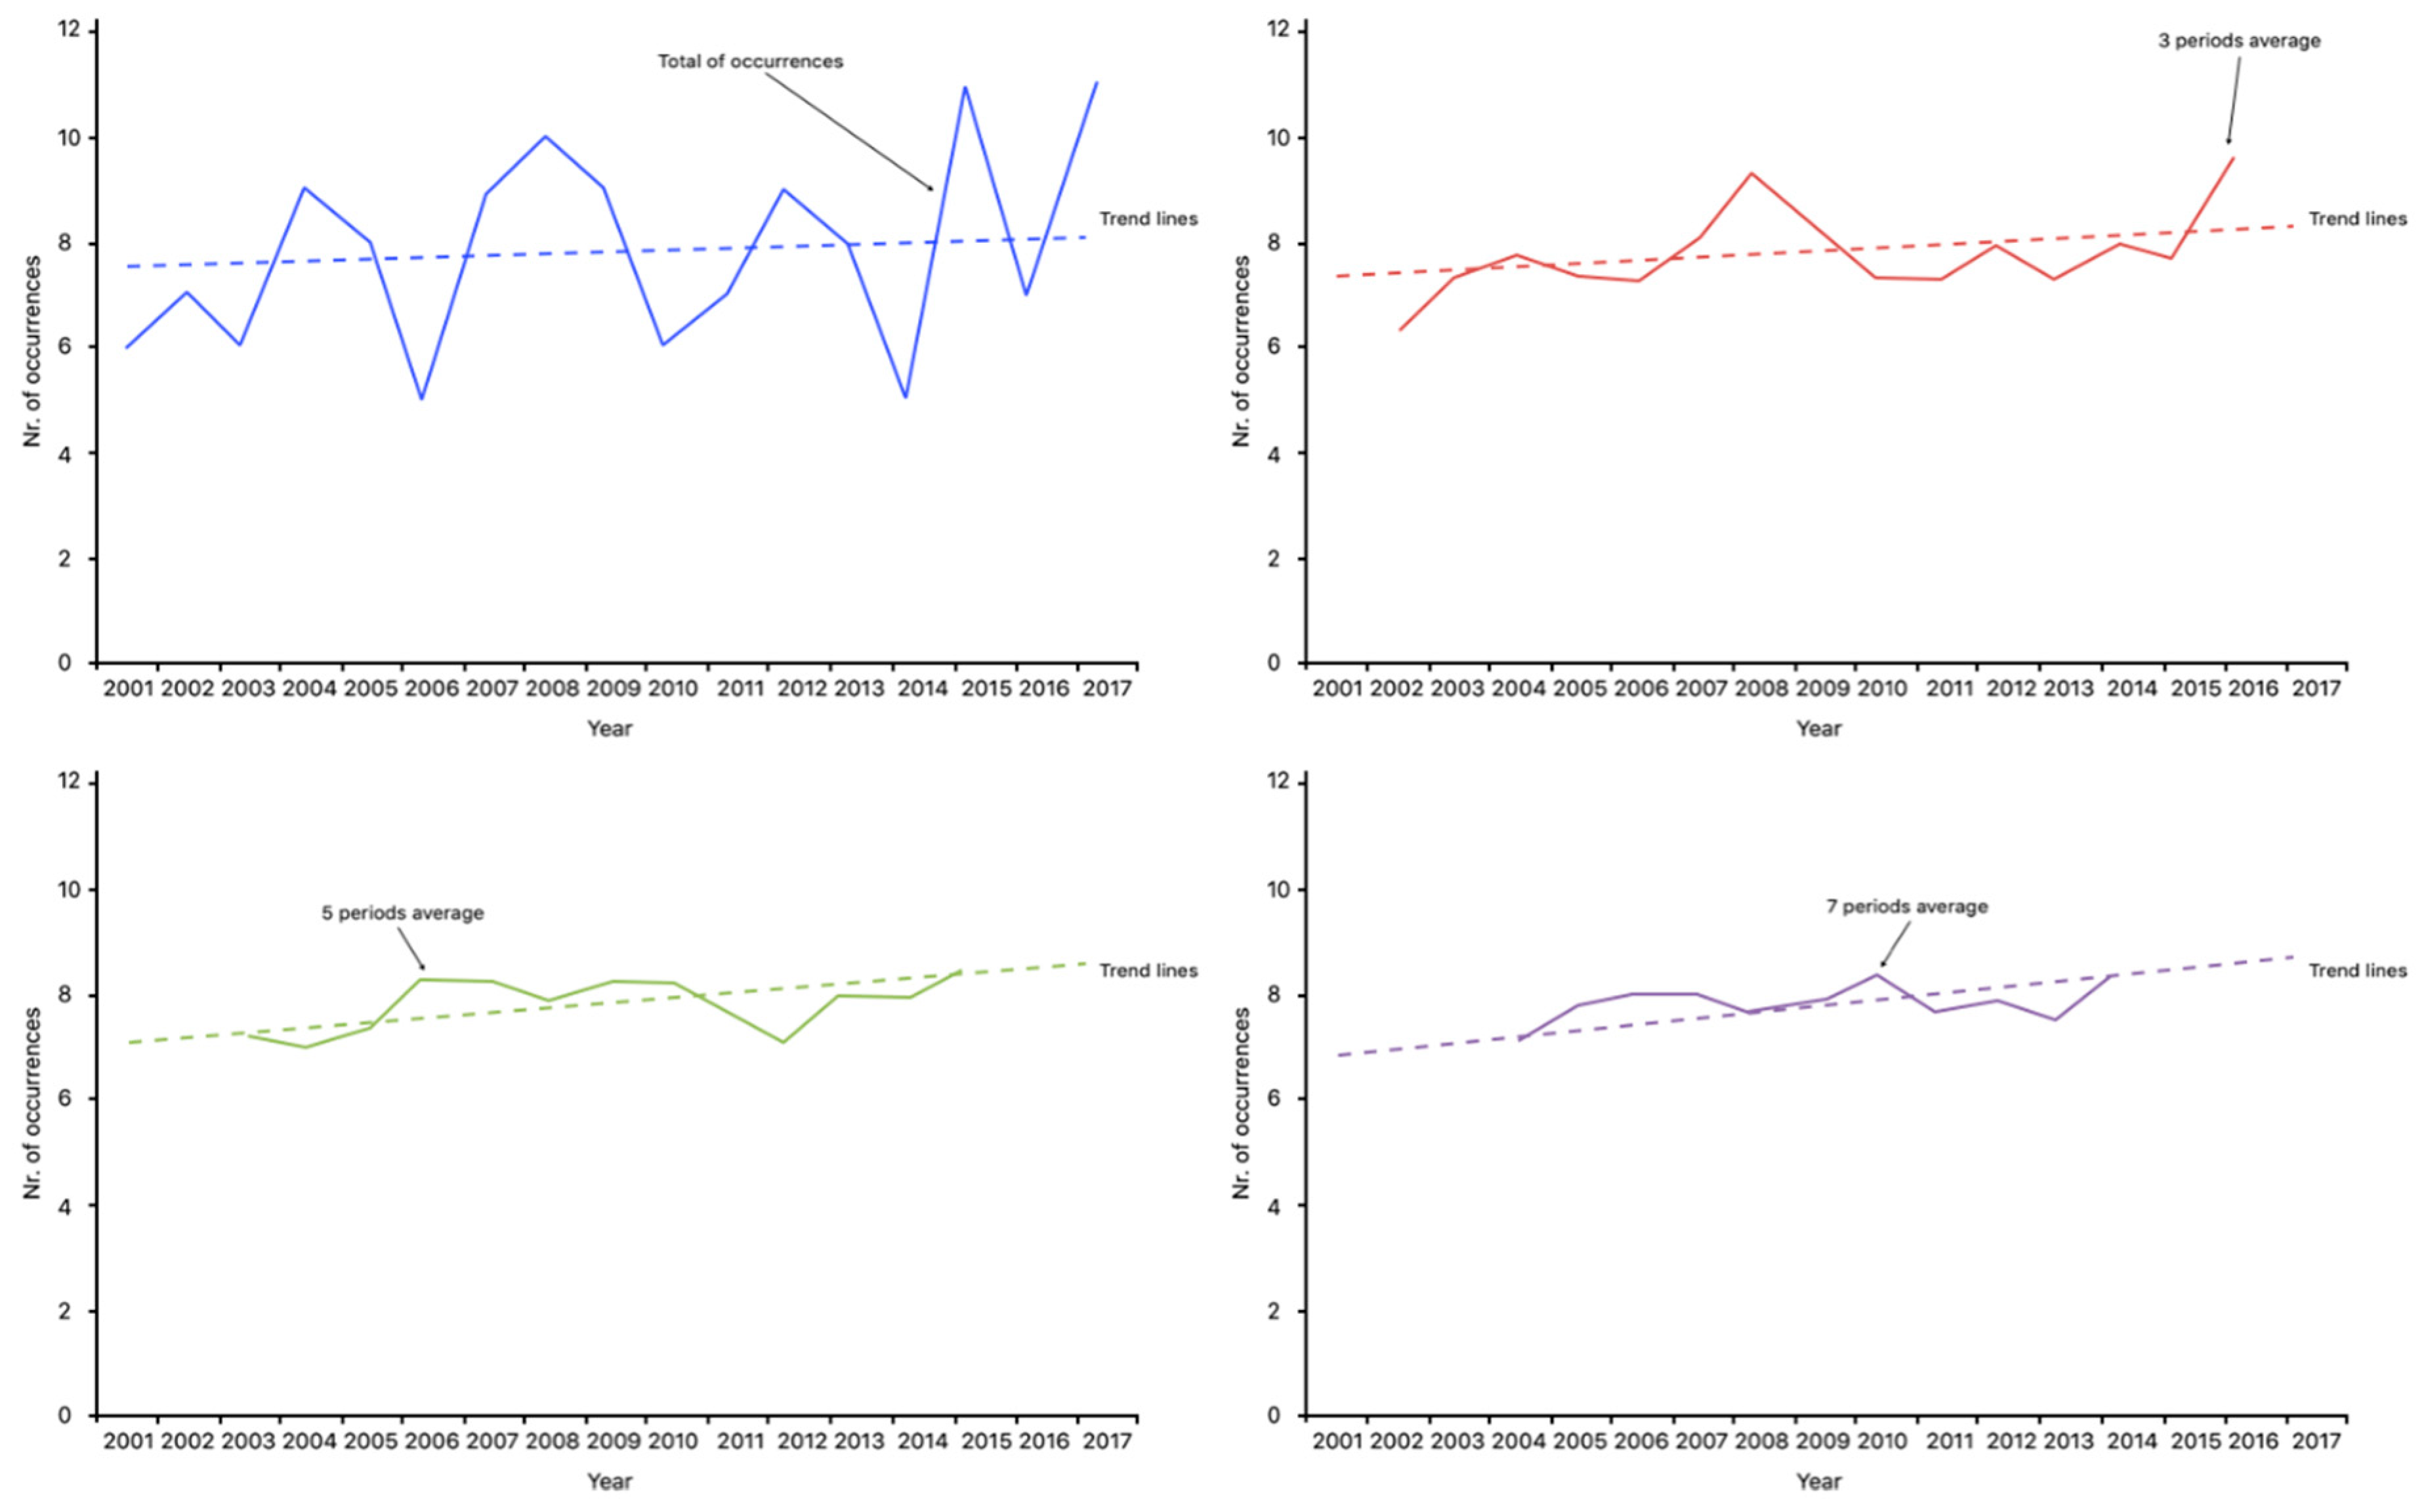
Table 6 presents the results of the application as well of the simple moving average method and in Figure 4 the trend lines are presented, using the same methodology described in the previous section. Also, in this situation the method was applied for 3, 5 and 7 periods, since it was understood that for the number of data available, it would be sufficient. Based on these results the graphic presented in Figure 4 was constructed, where the trend lines are also projected, and the projection of data previously presented in Table 3 are shown.
As can be seen, the actual data or total counted occurrences, represented by the blue line, allow the creation of a trend line and indicate in itself a growth perspective of the number of occurrences. However, with the application of the simple moving averages method, it is verified that the lines corresponding to each of the averages, the average of three periods being represented by the red line, the average of the five periods represented by the green line and the average of seven periods represented by the purple line, indicate in a much more visible way an increasing tendency for the occurrence of climatic anomalies.
This fact is even more noticeable when trend lines are analyzed, which clearly indicate an increasing trend towards a more frequent occurrence of this event, similar to what had already happened in the previous section, in the analysis of air temperature anomalies.
As can be seen in Table 7, there is a dispersion of the occurrence of anomalies for all the months of the year, since occurred climatic anomalies in all months of the year without exception. Over the last 17 years under analysis in this study, there is a greater concentration of these events in the spring and early summer months (April, May and June), so if factors are also anomalous in the following months, summer and autumn, also associated with the occurrence of precipitation anomalies, there is a strong probability of occurrence of ideal conditions for the outbreak of rural fires of great intensity and severity. It also appears that the occurrence of periods with precipitation at levels lower than usual would occur more and more frequently and can be said that the trend of the period between 2001 and 2017 is the repetition of periods of low precipitation.
As can be observed, there is also a certain tendency for precipitation anomalies to occur during the spring and summer months, so it can be said that the probability of repeating situations such as those occurring in 2017, with very favorable conditions for the outbreak of rural fires in summer and autumn is very high, especially when the conditions previously discussed are combined.
However, these considerations still have to be validated through the analysis of a longer time period, since the use of a range composed of only 17 years seems manifestly short so that definitive conclusions can be drawn on the evolutionary tendency of the climate. Several authors indicate in their work that a period of less than 30 years may not be representative to justify an evolutionary analysis of the climate [62,63,64]. Many point to the analysis of time intervals of 30, 50, or even more years. However, there are other authors who point to the use of more restricted time windows, in order to allow the analysis of short duration sensitivity, which may somehow indicate trends in a given direction, for one or more variables [4,65].
Notwithstanding the fact that this is not the most appropriate conclusion, in order to verify if there is an effective trend of climate change, the data indicate a tendency for an increasing number of climate anomalies, both associated with monthly air temperature average, and to the monthly average precipitation, when compared to the normal period 1971–2000. A good possibility for an expedited confirmation of the existence of a trend in time series is through the use of the non-parametric Mann–Kendall test, suggested by the WMO to evaluate the trend in time series of environmental data.
The non-parametric Mann–Kendall test is commonly employed to detect monotonic trends in series of environmental data, climate data or hydrological data [66]. The null hypothesis, H0, is that the data come from a population with independent realizations and are identically distributed. The alternative hypothesis, HA, is that the data follow a monotonic trend. The Mann–Kendall test statistic is calculated according to:
S = k = 1 n 1 j = k + 1 n s g n ( X j X k )
where,
s g n ( x ) = { 1   i f   x > 0 0   i f   x = 0 1   i f   x < 0
The mean of S is E[S] = 0 and the variance, σ2 is:
σ 2 = { n ( n 1 ) ( 2 n + 5 ) j = 1 p t j ( t j 1 ) ( 2 t j + 5 ) } / 18
where p is the number of the tied groups in the data set and tj is the number of data points in the jth tied group. The statistic S is approximately normal distributed provided that the following Z-transformation is employed:
Z = { S 1 σ   i f   S > 0 0   i f   S = 0 S + 1 σ   i f   S < 0
The statistic S is closely related to Kendall’s τ as given by:
τ = S D
where,
D = [ 1 2 n ( n 1 ) 1 2 j = 1 p t j ( t j 1 ) ] 1 2 [ 1 2 n ( n 1 ) ] 1 2
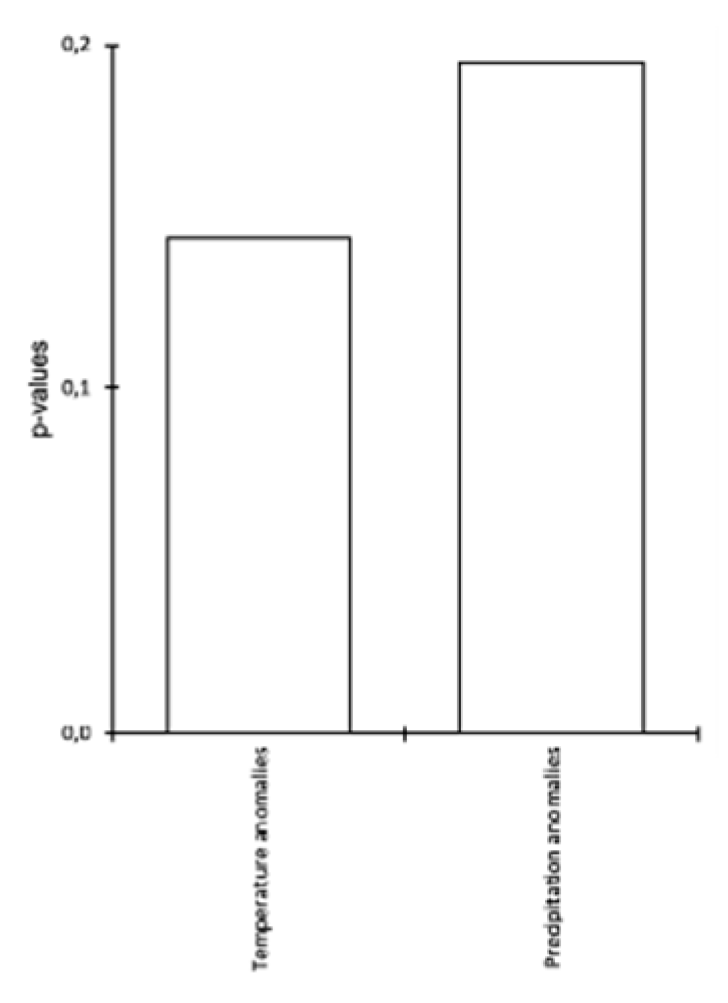
From the application of the Mann–Kendall test to the counted data of the anomalies occurring for mean air temperature and precipitation, summarized in Table 8 and in Figure 5 and Figure 6, it can be inferred that there is in fact an increasing tendency for occurrence of this type of anomalies. Considering the hypothesis H0: there is no trend in the series, and the hypothesis Ha: there is a positive trend in the series, and since the calculated p-value is lower than the level of significance, we reject the null hypothesis H0 in favor of the alternative hypothesis Ha.

4. Discussion and Conclusions

As stated previously, temperatures on Earth are suitable for life thanks to a natural process called the “greenhouse effect”. When solar radiation reaches the atmosphere, part of it is reflected into space, and part of it passes and is absorbed by the Earth. This causes the Earth’s surface to heat up. The heat is radiated out and absorbed by the gases present in the Earth’s atmosphere, the so-called “greenhouse gases” (GHG) [67]. This process prevents the heat from disappearing, causing the temperature to rise to +14°C instead of −19°C. There are many greenhouse gases responsible for additional warming of the atmosphere, which are produced in different manners. Most come from the combustion of fossil fuels in cars, factories and the production of electricity. The gas responsible for most of the heating is carbon dioxide. Other gases that contribute to heating are methane, which is expelled by landfills and agriculture (especially from the digestive systems of large animals in intensive production), nitrous oxide from fertilizers, gases used for cooling in industrial processes and massive loss of forest area, otherwise they would store CO2 [68,69].
Forests, which function as warehouses for greenhouse gases, help to mitigate the effects of climate change. However, the biological diversity of forests is also directly and indirectly affected by changing climatic conditions. These changes question the extent to which forests could continue to sequester greenhouse gases in the future [70].
The models that represent the ecosystems and their variations in the different climatic scenarios suggest that the changes will present a variety of impacts on the distribution of the forest populations, as well as on the impact on the function and composition of the ecosystems. In general, habitats are expected to move towards the poles and progress in altitude, conquering new territories [71].
With the change of the habitats, forest biodiversity will be forced to adapt and as a result, species composition in forests will likely change, and species and populations that are already vulnerable will become potentially extinct. In addition, with climate changes, there will be a greater incidence of extreme weather events, such as floods and droughts. These types of events will further affect forest populations and may make forests more prone to disturbances such as fires, invasive species, diseases and pests [72]. A mixed and preferably autochthonous forest stand, consisting of several different tree species with different ecological requirements and the ability to adapt to the expected changes in temperature, precipitation, frequency of storms and pests, will allow for continuous adjustments according to the climatic evolution [73].
The problem of climate changes has been addressed in a continuous way in Portugal, both by elements of the academic world, which are drawing attention to the causes and consequences of the phenomenon, but also by other sectors of civil society, in particular by the political sector, which has since some time initiated an ambitious program for the implementation of measures aimed at minimizing the negative impacts of climate changes in the country. Although they are still are taking the first steps in understanding the causes and consequences, it is assumed by the national and international scientific community that countries with Mediterranean climate characteristics may be the most affected by climate changes [16,74,75].
In this sense, a significant effort has been made in Portugal to implement measures that contribute to mitigating the harmful effects of climate changes, which at least begin to have international recognition. On 18 June 2018, TSF radio station on its website published a news item entitled “Portugal is second in a ranking on ambition in goals and measures to comply with the Paris Agreement on climate changes, being only exceeded by Sweden. The vast majority of the Member States of the European Union (EU) are failing to reach the targets of the Paris Agreement, and Portugal is among the few countries that have appealed to goals and policies more ambitious in the area of energy and climate, such as reducing greenhouse gas emissions”. This information is the result of a study entitled “Off target: Ranking of European Union (EU) countries ‘ambition and progress’ in fighting climate changes”, which determines member states’ commitment to achieving energy policy and energy targets and the progress they are making in reducing greenhouse gas emissions and implementing programs for the use of energy from renewable sources and energy efficiency [76].
The planet’s climate has undergone major changes for several decades. The IPCC report indicates that climate warming is evident and that most is probably due to the increase in GHG concentrations caused by human activities, such as the widespread use of fuels, the decomposition of urban or livestock waste and the changes in the occupation of the soil.
There is already irrefutable proof of this change. The temperature of the atmosphere at surface level has undergone a progressive warming from the beginning of the industrial era to the present day of approximately 0.6°C on average, with an even greater increase in some areas such as the poles or the Mediterranean region. The hottest years since recordings have occurred since 1990, as well as major seasonal changes, such as the decline of icy surfaces, rising sea levels, changes in the overall circulation flow of marine currents, and so on [77,78,79]. The frequency and severity of extreme weather events has increased. There is a more frequent occurrence of floods, heat and cold waves and periods of prolonged drought. An example of this is the news and constant warnings of hurricanes and storms of extreme force, which always cause high economic and personal damages.
There is a total consensus on the part of the scientific community when it comes to attributing to the increased concentration of GHG generated by human activities the greater responsibility for the phenomenon of climate changes. The reality is that without the natural presence of some of these gases in the atmosphere, such as water vapor and CO2, creating the known greenhouse effect, Earth would be a very different place from what is known today, with average temperatures well below the current.
Since the beginning of the industrial revolution, when large quantities of fossil fuels began to be burned to meet the energy needs of industrial processes, so far, the amount of CO2 in the atmosphere has increased progressively. Likewise, other anthropogenic GHGs also increased their concentration in the atmosphere considerably. Demographic growth and the current socio-economic model put great pressure on the self-regulating capacity of the atmosphere, which is leading to a situation close to its limits and, according to some scientists, likely to overcome them.
The main causes for GHG emissions vary according to the regions of the planet. Thus, in the northern hemisphere, the main causes are associated with energy production, industrial production and transportation, while in the southern hemisphere the main causes are associated with the change in land use, namely through the conversion of extensive forest areas into agricultural land or pastures.
It should be noted that in recent years there was an effort in the industrialized countries, with some success in some cases like Portugal, for the reduction in carbon dioxide emissions. The reasons for this reduction are the introduction of more efficient technologies, the use of renewable energies, the increasing weight of the services sector and the relocation of the most polluting companies to less developed countries. However, the steady growth of these industrialized economies, as well as the significant increase in emissions in other sectors, such as transport and the domestic sector, have made the total amount of GHG emissions of human origin increase considerably in recent years.
Forests like all other natural ecosystems are as susceptible to climate changes as other sectors (such as agriculture, for example, which are also highly vulnerable to climate and environmental changes). Unlike other sectors, where financial resources and technology can directly contribute to increasing the adaptive capacity of affected systems, natural forests depend on their own natural ability to adapt.
Adding to all this human pressure, pressure for development, and climate changes itself, it is highly likely that the ability of forestry systems to adapt to the new situation quickly and efficiently will be exceeded. It is expected that different forest systems will have different sensitivities to changes in climate. Therefore, it is important to take into account that the conservation of forests for other uses, and their ability to sequester carbon dioxide, can contribute predominantly to carbon dioxide emissions in the future if forest systems are affected by natural or human influences.
The way ecosystems respond to climate changes is usually guided by two paradigms: evolution and adaptation, as seen in previous sections. In the first one it is assumed that there will be a migration of ecosystems to other regions, almost intact, just looking for new locations where climatic and environmental conditions reproduce those where they currently are. The second paradigm assumes that as the climate and other factors change, ecosystems will change in the same location where they are today, which will interfere both in the variety of species and in their position in the ecosystem.
In addition to the intrinsic value of natural ecosystems, ecosystems of all kinds, from the most natural to the most intensively managed, offer a variety of benefits to society as a whole. Some of the products originating from these ecosystems enter the market and contribute directly to economic development. For example, forests are a source of raw materials for a number of industries, such as the production of biomass pellets, pulp production, the production of wood pellets and the production of furniture. Forest ecosystems also provide a number of benefits to society, such as their role in regulating water flows, preventing erosion, maintaining biodiversity and temporary storage of carbon, which can be as long as the longer the forest species and the more extensive the forestry operation recommended, for example, in the Portuguese case, using native species such as oaks, holm oaks or cork oaks.
Changes in soil cover caused by climate changes can have a number of impacts on these benefits, such as the ability of these systems to stabilize the landscape against erosion or sequester carbon dioxide. Even in regions where the amount of existing vegetation is expected to increase as a result of higher precipitation rates and increased growth due to the higher concentration of atmospheric carbon dioxide it can lead to an increase in the frequency and intensity of fires during a longer summer period. The increase in the occurrence of fires is already a threat not only to the vegetation cover, but also to the residential structures that are built in the rural areas, which are increasingly vulnerable. For this reason, it is very plausible that the changes caused in the natural ecosystems by the changes of the climate affect this set of benefits usually associated with the forestry activity.
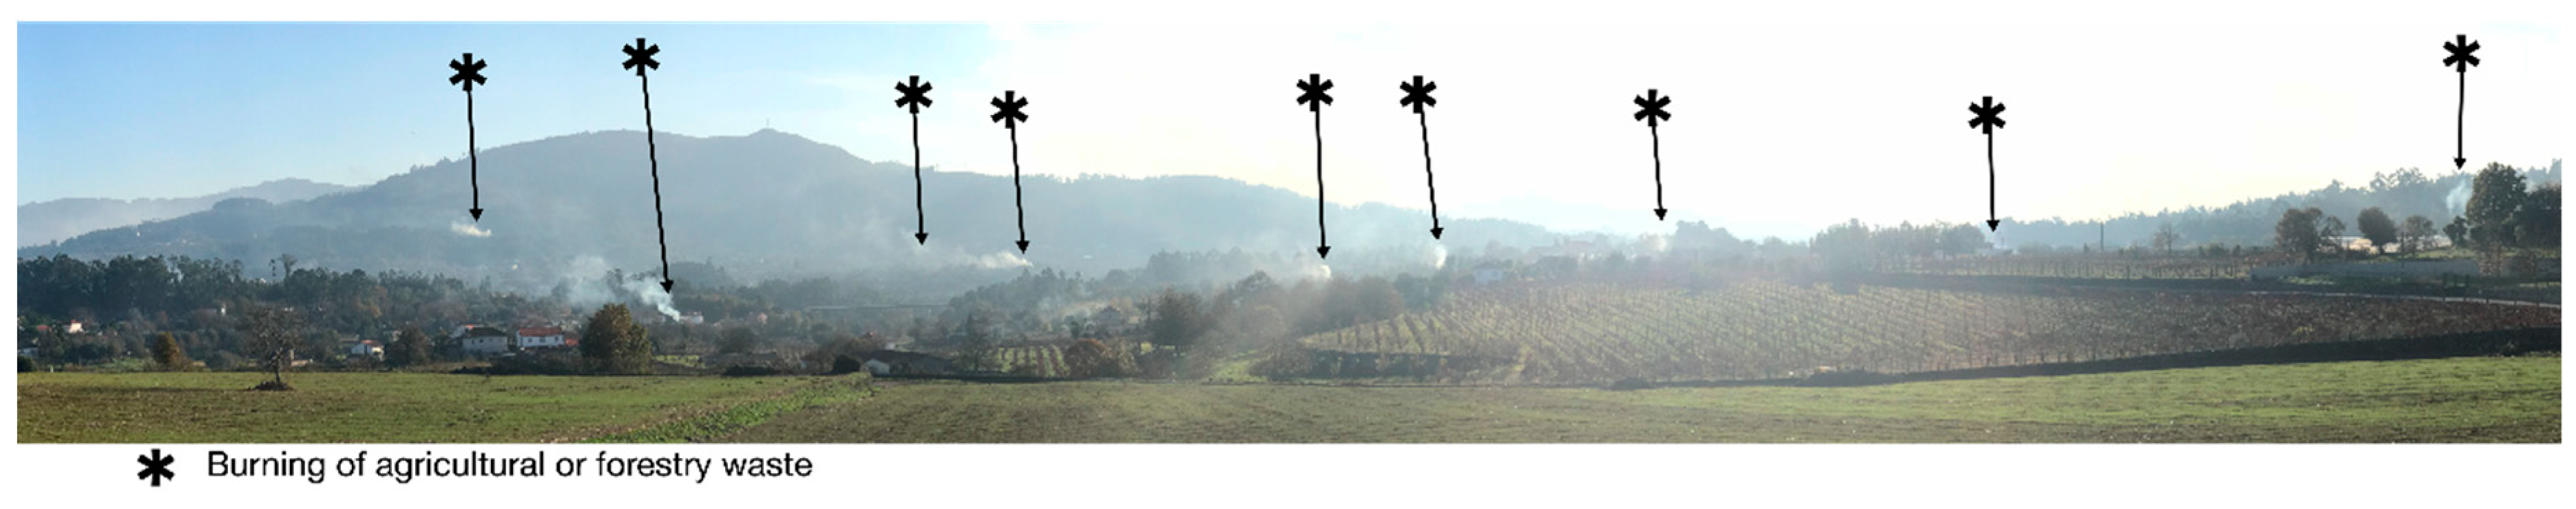
As seen in previous sections, burning, or simply the “use of fire”, are the main causes of the occurrence of rural fires in Portugal, and its control and, if necessary, prohibition is urgently needed. Although it is an ancestral practice, with the worsening of climatic conditions, especially during the summer period, but which, as previously seen, now also extended to spring and autumn, the risk associated with this practice has grown exponentially. Most likely, the need to extend the so-called “rural fires season” will arise in the short term, where all means of combat are on alert so that they can react in a timely manner to any emergency.
Almost all climate models anticipate a decrease in the amount of precipitation in various parts of the globe, but they emphasize in particular the effects on the Mediterranean climate regions. The parallel effect of temperature increasing and reduction of precipitation may lead to a significant decrease in the amount of soil moisture.
According to the information provided in the previous sections, there is already a tendency for climatic anomalies related to the increase of average air temperature in Portugal, associated with the occurrence of anomalies related to the amount of precipitation in several months of the year. That is, the trend indicates a strong probability of occurrence of periods of temperature rise associated with lower levels of precipitation.
This lack can make trees more fragile from insect pest attacks and diseases, but also from increasing the likelihood of rural fires. The frequency and intensity of these occurrences will determine the type and rate of conversion of soil cover to a new state, for example the replacement of a forest composed of native species, by another one composed of invasive species. In Portugal, infestations of extensive forest areas by species of the genus Acacia begin to be very frequent, but there are others, such as Hakea, that begin to occupy very significant areas and are no longer limited to occupying space along the circulation ways.
However, as a consequence of climate changes, forests can undergo more rapid changes; for example, unless a significant increase in precipitation occurs, the severity of rural fires may increase. For this reason, it is urgent to create a model of forest management that takes into account the phenomenon of climate changes and all associated variables, and not to forget that forests are a natural resource that can should be profitable, with a view to sustainability for the future.

Author Contributions

Conceptualization, L.J.R.N., C.I.R.M., C.J.P.G. and N.M.C.A.R.; methodology, L.J.R.N.; validation, C.I.R.M., C.J.P.G. and N.M.C.A.R.; writing—original draft preparation, L.J.R.N.; writing—review and editing, C.I.R.M., C.J.P.G. and N.M.C.A.R.; supervision, C.I.R.M., C.J.P.G. and N.M.C.A.R.

Funding

This research received no external funding.

Acknowledgments

Authors declare no need of further acknowledgements.

Conflicts of Interest

The authors declare no conflict of interest.

References

  1. Füssel, H.-M. Vulnerability: A generally applicable conceptual framework for climate change research. Glob. Environ. Chang. 2007, 17, 155–167. [Google Scholar] [CrossRef]
  2. Kurten, B. Pleistocene Mammals of Europe; Routledge: Abingdon-on-Thames, UK, 2017. [Google Scholar]
  3. Zagwijn, W.H. Vegetation and climate during warmer intervals in the Late Pleistocene of western and central Europe. Quat. Int. 1989, 3, 57–67. [Google Scholar] [CrossRef]
  4. Parmesan, C.; Yohe, G. A globally coherent fingerprint of climate change impacts across natural systems. Nature 2003, 421, 37. [Google Scholar] [CrossRef] [PubMed]
  5. Moss, R.H.; Edmonds, J.A.; Hibbard, K.A.; Manning, M.R.; Rose, S.K.; van Vuuren, D.P.; Carter, T.R.; Emori, S.; Kainuma, M.; Kram, T.; et al. The next generation of scenarios for climate change research and assessment. Nature 2010, 463, 747. [Google Scholar] [CrossRef] [PubMed]
  6. Tian, H.; Lu, C.; Ciais, P.; Michalak, A.M.; Canadell, J.G.; Saikawa, E.; Huntzinger, D.N.; Gurney, K.R.; Sitch, S.; Zhang, B.; et al. The terrestrial biosphere as a net source of greenhouse gases to the atmosphere. Nature 2016, 531, 225. [Google Scholar] [CrossRef]
  7. Melillo, J.M.; Richmond, T.; Yohe, G. Climate Change Impacts in the United States: Third National Climate Assessment; Government Printing Office: Washington, DC, USA, 2014; p. 52.
  8. IPCC. Climate Change 2014: Mitigation of Climate Change; Cambridge University Press: Cambridge, UK, 2015; Volume 3. [Google Scholar]
  9. Church, J.A.; White, N.J. A 20th century acceleration in global sea-level rise. Geophys. Res. Lett. 2016, 33. Available online: https://doi.org/10.1029/2005GL024826 (accessed on 31 May 2019).
  10. Stocker, T. Climate Change 2013: The Physical Science Basis: Working Group I Contribution to the Fifth Assessment Report of the Intergovernmental Panel on Climate Change; Cambridge University Press: Cambridge, UK, 2014. [Google Scholar]
  11. Crate, S.A.; Nuttall, M. Anthropology and Climate Change: From Encounters to Actions; Routledge: Abingdon-on-Thames, UK, 2016. [Google Scholar]
  12. Organization, W.H. Global Technical Strategy for Malaria 2016–2030; World Health Organization: Geneva, Switzerland, 2015. [Google Scholar]
  13. Watts, N.; Adger, W.N.; Agnolucci, P.; Blackstock, J.; Byass, P.; Cai, W.; Chaytor, S.; Colbourn, T.; Collins, M.; Cooper, A.; et al. Health and climate change: Policy responses to protect public health. Lancet 2015, 386, 1861–1914. [Google Scholar] [CrossRef]
  14. Henriques, A.G. Convenção Quadro das nações Unidas Sobre Alterações Climáticas. Instituto Superior Técnico, Mestrado em Engenharia do Ambiente, Lisboa. Available online: https://fenix.ist.utl.pt/disciplinas/pa5/2008-2009/2-semestre/convencao-quadro-das-nacoes--unidas-sobre-alteracoes-climaticas (accessed on 12 January 2019).
  15. Milheiro, L. Alterações Climáticas em Portugal: Cenários, Impactos e Medidas de Adaptação (Projecto SIAM II); Gradiva: Lisboa, Portugal, 2006. [Google Scholar]
  16. Pereira, J.S.; Pereira, J.S.; Correia, A.V.; Correia, A.C.; Ferreira, M.; Onofre, N.; Freitas, H.; Godinho, F. Florestas e biodiversidade. In Alterações Climáticas em Portugal—Cenários, Impactos e Medidas de Adaptação (Projecto SIAM II); Gradiva: Lisboa, Portugal, 2006; pp. 301–343. [Google Scholar]
  17. Torres Ribeiro, K.; Freitas, L. Impactos potenciais das alterações no Código Florestal sobre a vegetação de campos rupestres e campos de altitude. Biota Neotropica 2010, 10. [Google Scholar]
  18. Boegelsack, N.; Withey, J.; O’Sullivan, G.; McMartin, D. A Critical Examination of the Relationship between Wildfires and Climate Change with Consideration of the Human Impact. J. Environ. Prot. 2018, 9, 461. [Google Scholar] [CrossRef]
  19. De Groot, W.J.; Flannigan, M.D.; Stocks, B.J. Climate change and wildfires. In Proceedings of the Fourth International Symposium on Fire Economics, Planning, and Policy: Climate Change and Wildfires, Albany, NY, USA, 1−10 November 2012. [Google Scholar]
  20. Icnf. IFN6-Áreas dos Usos do Solo e das Espécies Florestais de Portugal Continental. Resultados Preliminaries; Instituto da Conservação da Natureza e das Florestas Lisboa: Lisboa, Portugal, 2013. [Google Scholar]
  21. Feliciano, D. Indicadores de Eficácia de Organizações de Produtores Florestais em Portugal. Silva Lusitana 2012, 20, 55–70. [Google Scholar]
  22. Ramos, E.D. Certificação Florestal: Custos e Benefícios da Certificação da Gestão Florestal em Portugal; Universidade Atlântica: Lisboa, Portugal, 2012. [Google Scholar]
  23. Sarmento, E.d.M.; Dores, V. Desafios para a Gestão: Ambiental da Fileira Florestal em Portugal. Silva Lusitana 2013, 21, 1–19. [Google Scholar]
  24. Bongers, F.; Chazdon, R.; Poorter, L.; Peña-Claros, M. The potential of secondary forests. Science 2015, 348, 642–643. [Google Scholar] [CrossRef]
  25. Pereira, J.S. O Futuro da Floresta em Portugal; Fundação Francisco Manuel dos Santos: Lisboa, Portugal, 2016. [Google Scholar]
  26. Lempereur, M.; Martin-StPaul, N.K.; Damesin, C.; Joffre, R.; Ourcival, J.M.; Rocheteau, A.; Rambal, S. Growth duration is a better predictor of stem increment than carbon supply in a Mediterranean oak forest: Implications for assessing forest productivity under climate change. New Phytol. 2015, 207, 579–590. [Google Scholar] [CrossRef]
  27. Clark, J.S.; Iverson, L.; Woodall, C.W.; Allen, C.D.; Bell, D.M.; Bragg, D.C.; Jackson, S.T. The impacts of increasing drought on forest dynamics, structure, and biodiversity in the United States. Glob. Chang. Biol. 2016, 22, 2329–2352. [Google Scholar] [CrossRef] [Green Version]
  28. Pinho, J.; Mateus, P. Retrato a carvão: a gestão do fogo no âmbito da administração florestal e do ordenamento florestal do território. Subsídios para uma perspetiva histórica e de futuro. Territorium 2018, 26, 61–88. [Google Scholar] [CrossRef]
  29. Bennett, A.C.; McDowell, N.G.; Allen, C.D.; Anderson-Teixeira, K.J. Larger trees suffer most during drought in forests worldwide. Nat. Plants 2015, 1, 15139. [Google Scholar] [CrossRef]
  30. Doughty, C.E.; Metcalfe, D.B.; Girardin, C.A.J.; Amézquita, F.F.; Cabrera, D.G.; Huasco, W.H.; Feldpausch, T.R. Drought impact on forest carbon dynamics and fluxes in Amazonia. Nature 2015, 519, 78. [Google Scholar] [CrossRef]
  31. Anderegg, W.R.; Schwalm, C.; Biondi, F.; Camarero, J.J.; Koch, G.; Litvak, M.; Wolf, A. Pervasive drought legacies in forest ecosystems and their implications for carbon cycle models. Science 2015, 349, 528–532. [Google Scholar] [CrossRef] [Green Version]
  32. Deutsch, C.A.; Tewksbury, J.J.; Tigchelaar, M.; Battisti, D.S.; Merrill, S.C.; Huey, R.B.; Naylor, R.L. Increase in crop losses to insect pests in a warming climate. Science 2018, 361, 916–919. [Google Scholar] [CrossRef] [Green Version]
  33. Dukes, J.S.; Pontius, J.; Orwig, D.; Garnas, J.R.; Rodgers, V.L.; Brazee, N.; Ehrenfeld, J. Responses of insect pests, pathogens, and invasive plant species to climate change in the forests of northeastern North America: What can we predict? Can. J. For. Res. 2009, 39, 231–248. [Google Scholar] [CrossRef]
  34. Wylie, F.R.; Speight, M.R. Insect Pests in Tropical Forestry; CABI: Wallingford, UK, 2012. [Google Scholar]
  35. Browne, F.G. Pests and diseases of forest plantation trees: An annotated list of the principal species occurring in the British Commonwealth. In Pests and Diseases of Forest Plantation Trees: An Annotated List of the Principal Species Occurring in the British Commonwealth; Oxford University Press: Oxford, UK, 1968. [Google Scholar]
  36. Naves, E.S.L.B.P. Principais pragas florestais em Portugal: Como atuar? Mundo Rural 2016, 36–37. Available online: http://www.iniav.pt/fotos/editor2/pragas_florestais.pdf (accessed on 31 May 2019).
  37. Ribeiro, M. Sustentabilidade dos recursos florestais em Portugal: O que aprendemos com o pinheiro-bravo. In Proceedings of the 8º Congresso Florestal Nacional. Floresta em Português: Raízes do Futuro, Viana do Castelo, Portugal, 11−14 October 2017. [Google Scholar]
  38. Endara-Agramont, A.R.; Calderón-Contreras, R.; Nava-Bernal, G.; Franco-Maass, S. Analysis of fragmentation processes in high-mountain forests of the centre of Mexico. Am. J. Plant Sci. 2013, 4, 697. [Google Scholar] [CrossRef]
  39. Arnaldo, P.S.; Oliveira, I.; Santos, J.; Leite, S. Climate change and forest plagues: The case of the pine. For. Syst. 2011, 20, 508–515. [Google Scholar]
  40. Fernandes, S.; Meira Castro, A.; Lourenço, L. Duas décadas de investigação das causas de incêndios florestais em Portugal continental. In Proceedings of the IV Congresso Internacional de Riscos: “Riscos e Educação”, Coimbra, Portugal, 23–26 May 2017. [Google Scholar]
  41. Silva, C.C. 2017 foi o ano em que Mais Ardeu nos últimos 10 anos—4 vezes mais do que o Habitual. Available online: https://www.publico.pt/2017/11/10/sociedade/noticia/2017-foi-o-ano-em-que-mais-ardeu-nos-ultimos-dez-anos--quatro-vezes-mais-que-o-habitual-1792180 (accessed on 4 September 2018).
  42. Bugalho, L.; Pessanha, L. Relação da área ardida em Portugal com o risco de fogo florestal ICRI. Acta de las Jornadas Científicas de la Asociación Meteorológica Española 2018, 32, 180–181. [Google Scholar]
  43. Espada, M.H. Não Falar do mau Cheiro dos Cadáveres: Como Salazar Escondeu 700 Mortos. Available online: https://www.sabado.pt/portugal/detalhe/cheias-de-1967-a-tragedia-esquecida-que-matou-centenas (accessed on 2 October 2018).
  44. Martins, C.; Guerreiro, P.S.; Beleza, J.; Duarte, J.S. Um fogo que não se apaga. J. Expresso. 2017. Available online: https://expresso.pt/multimedia-expresso/2017-12-29-Um-fogo-que-nao-se-apaga-incendios-o-acontecimento-nacional-de-2017#gs.f1050o (accessed on 8 September 2018).
  45. LUSA. Cronologia: Pelo Menos 200 Mortos Deste 2000 em Incêndios, 2017 é o pior ano. Available online: https://www.dn.pt/lusa/interior/cronologia-pelo-menos-200-mortos-desde-2000-em-incendios-2017-e-o-pior-ano-8848644.html (accessed on 2 October 2018).
  46. Commission, E. European Forest Fire Information System (EFFIS). Available online: http://effis.jrc.ec.europa.eu/ (accessed on 8 September 2018).
  47. Mata-Lima, H.; Alvino-Borba, A.; Pinheiro, A.; Mata-Lima, A.; Almeida, J.A. Impacts of natural disasters on environmental and socio-economic systems: what makes the difference? Ambiente Sociedade 2013, 16, 45–64. [Google Scholar] [CrossRef]
  48. Independente, C.T. Análise e Apuramento dos Factos Relativos aos Incêndios que Ocorreram em Pedrogão Grande, Castanheira de Pera, Ansião, Alvaiázere, Figueiró dos Vinhos, Arganil, Góis, Penela, Pampilhosa da Serra, Oleiros e Sertã, Entre 17 e 24 de Junho de 2017; Assembleia da República: Lisboa, Portugal, 2017; p. 297.
  49. Abatzoglou, J.T.; Williams, A.P. Impact of anthropogenic climate change on wildfire across western US forests. Proc. Natl. Acad. Sci. USA 2016, 113, 11770–11775. [Google Scholar] [CrossRef] [Green Version]
  50. Gitas, I.Z.; Katagis, T.; Toukiloglou, P. Burned area mapping and post-fire monitoring of a Mediterranean forest using NDVI time-series of low resolution imagery and the BFAST method Mapeamento de área queimada e monitoramento pós-fogo de floresta na região Mediterrânea a partir de série. Ambiência 2012, 8, 461–470. [Google Scholar] [CrossRef]
  51. Werth, P.A.; Potter, B.E.; Alexander, M.E.; Clements, C.B.; Cruz, M.G.; Finney, M.A.; McAllister, S.S. Synthesis of Knowledge of Extreme Fire Behavior: Volume 2 for Fire Behavior Specialists, Researchers, and Meteorologists; Gen. Tech. RePNW-GTR-891; US Department of Agriculture, Forest Service, Pacific Northwest Research Station: Portland, OR, USA, 2016; 258p.
  52. Fernandes, P.M.; Guiomar, N. Os incêndios como causa de desarborização em Portugal. AGROTEC 2017, 22, 28–32. [Google Scholar]
  53. Westerling, A.L. Increasing western US forest wildfire activity: Sensitivity to changes in the timing of spring. Phil. Trans. R. Soc. B. 2016, 371, 20150178. [Google Scholar] [CrossRef]
  54. Cambardella, C.A.; Moorman, T.B.; Parkin, T.B.; Karlen, D.L.; Novak, J.M.; Turco, R.F.; Konopka, A.E. Field-scale variability of soil properties in central Iowa soils. Soil Sci. Soc. Am. J. 1994, 58, 1501–1511. [Google Scholar] [CrossRef]
  55. IPMA. O Clima em Portugal Continental. s.d. Available online: https://www.ipma.pt/pt/educativa/tempo.clima/index.jsp?page=clima.pt.xml (accessed on 3 September 2018).
  56. Pereira, J.M.; Almeida, P.S.D.; Sousa, A.V.D.; Paula, A.M.D.; Machado, R.B.; Gurgel-Gonçalves, R. Climatic factors influencing triatomine occurrence in Central-West Brazil. Memórias do Instituto Oswaldo Cruz 2013, 108, 335–341. [Google Scholar] [CrossRef]
  57. Smit, B.; Burton, I.; Klein, R.J.; Wandel, J. An anatomy of adaptation to climate change and variability. In Societal Adaptation to Climate Variability and Change; Springer: Berlin, Germany, 2000; pp. 223–251. [Google Scholar]
  58. Leemans, R.; Cramer, W.P. The IIASA Database for Mean Monthly Values of Temperature, Precipitation, and Cloudiness on a Global Terrestrial Grid; International Institute for Applied Systems Analysis: Laxenburg, Austria, 1991. [Google Scholar]
  59. Rahmstorf, S.; Coumou, D. Increase of extreme events in a warming world. Proc. Natl. Acad. Sci. USA 2011, 108, 17905–17909. [Google Scholar] [CrossRef] [PubMed] [Green Version]
  60. Jones, P.D.; New, M.; Parker, D.E.; Martin, S.; Rigor, I.G. Surface air temperature and its changes over the past 150 years. Rev. Geophys. 1999, 37, 173–199. [Google Scholar] [CrossRef]
  61. Crowder, S.V. A simple method for studying run–length distributions of exponentially weighted moving average charts. Technometrics 1987, 29, 401–407. [Google Scholar]
  62. Easterling, D.R.; Meehl, G.A.; Parmesan, C.; Changnon, S.A.; Karl, T.R.; Mearns, L.O. Climate extremes: Observations, modeling, and impacts. Science 2000, 289, 2068–2074. [Google Scholar] [CrossRef]
  63. Goswami, B.N.; Venugopal, V.; Sengupta, D.; Madhusoodanan, M.S.; Xavier, P.K. Increasing trend of extreme rain events over India in a warming environment. Science 2006, 314, 1442–1445. [Google Scholar] [CrossRef]
  64. Dore, M.H. Climate change and changes in global precipitation patterns: What do we know? Environ. Int. 2005, 31, 1167–1181. [Google Scholar] [CrossRef] [PubMed]
  65. Alexander, L.V.; Zhang, X.; Peterson, T.C.; Caesar, J.; Gleason, B.; Klein Tank, A.M.G.; Haylock, M.; Collins, D.; Trewin, B.; Rahimzadeh, F.; et al. Global observed changes in daily climate extremes of temperature and precipitation. J. Geophys. Res. Atmos. 2006, 111, D5. [Google Scholar] [CrossRef]
  66. Yue, S.; Pilon, P.; Cavadias, G. Power of the Mann–Kendall and Spearman’s rho tests for detecting monotonic trends in hydrological series. J. Hydrol. 2002, 259, 254–271. [Google Scholar] [CrossRef]
  67. Raval, A.; Ramanathan, V. Observational determination of the greenhouse effect. Nature 1989, 342, 758. [Google Scholar] [CrossRef]
  68. Rodhe, H. A comparison of the contribution of various gases to the greenhouse effect. Science 1990, 248, 1217–1219. [Google Scholar] [CrossRef]
  69. Rosenzweig, C.; Hillel, D. Climate Change and the Global Harvest: Potential Impacts of the Greenhouse Effect on Agriculture; Oxford University Press: Oxford, UK, 1998. [Google Scholar]
  70. Luo, Y.; Hui, D.; Zhang, D. Elevated CO2 stimulates net accumulations of carbon and nitrogen in land ecosystems: A meta-analysis. Ecology 2006, 87, 53–63. [Google Scholar] [CrossRef] [PubMed]
  71. Pecl, G.T.; Araújo, M.B.; Bell, J.D.; Blanchard, J.; Bonebrake, T.C.; Chen, I.C.; Falconi, L. Biodiversity redistribution under climate change: Impacts on ecosystems and human well-being. Science 2017, 355, eaai9214. [Google Scholar] [CrossRef]
  72. Dale, V.H.; Joyce, L.A.; McNulty, S.; Neilson, R.P.; Ayres, M.P.; Flannigan, M.D.; Simberloff, D. Climate change and forest disturbances: Climate change can affect forests by altering the frequency, intensity, duration, and timing of fire, drought, introduced species, insect and pathogen outbreaks, hurricanes, windstorms, ice storms, or landslides. AIBS Bull. 2001, 51, 723–734. [Google Scholar]
  73. De Dios, V.R.; Fischer, C.; Colinas, C. Climate change effects on Mediterranean forests and preventive measures. New For. 2007, 33, 29–40. [Google Scholar] [CrossRef]
  74. Giorgi, F.; Lionello, P. Climate change projections for the Mediterranean region. Glob. Planet. Chang. 2008, 63, 90–104. [Google Scholar] [CrossRef]
  75. Pausas, J.G. Changes in fire and climate in the eastern Iberian Peninsula (Mediterranean basin). Clim. Chang. 2004, 63, 337–350. [Google Scholar] [CrossRef]
  76. TSF/LUSA. Portugal é o 2.º Melhor país Europeu na luta Contra Alterações Climáticas; TSF: Lisboa, Portugal, 2018. [Google Scholar]
  77. Hoegh-Guldberg, O.; Bruno, J.F. The impact of climate change on the world’s marine ecosystems. Science 2010, 328, 1523–1528. [Google Scholar] [CrossRef]
  78. Solomon, S.; Qin, D.; Manning, M.; Averyt, K.; Marquis, M. Climate Change 2007-the Physical Science Basis: Working Group I Contribution to the Fourth Assessment Report of the IPCC; Cambridge University Press: Cambridge, UK, 2007; Volume 4. [Google Scholar]
  79. Parmesan, C. Ecological and evolutionary responses to recent climate change. Annu. Rev. Ecol. Evol. Syst. 2006, 37, 637–669. [Google Scholar] [CrossRef]
Figure 1. Panoramic picture taken on 12/5/2017 from ESA—Ponte de Lima School of Agriculture of the Polytechnic Institute of Viana do Castelo (north Portugal), where it is possible to observe 9 fires in a rural environment occurring simultaneously.
Climate 07 00078 g001
Figure 2. Example of the creation of isolines maps for the anomalies of in February in the year 2019. In the left part is the image obtained at the Portuguese Institute of the Sea and the Atmosphere (IPMA) website and in the right side is the image created from the first one.
Climate 07 00078 g002
Figure 3. Trend lines. As can be seen in the figures, the lines indicate an increasing tendency for anomalies to occur, allowing it to be inferred that, over the years, an increasing number of anomalies can be expected to occur.
Climate 07 00078 g003
Figure 4. Trend lines. As can be seen in the figures, the lines indicate an increasing tendency for anomalies to occur, allowing it to be inferred that, over the years, an increasing number of anomalies can be expected to occur.
Climate 07 00078 g004
Figure 5. p-values.
Figure 5. p-values.
Climate 07 00078 g005
Figure 6. Sen’s slope indicating the increasing probability for the occurrence of anomalies. As can be seen in the figures, the Sen’s slope indicates an increasing trend for the occurrence of anomalies, allowing it to be inferred that, over the years, an increasing number of anomalies can be expected to occur.
Climate 07 00078 g006
Table 1. Main pests of the forest in Portugal (adapted from [36]).
Forestry SpeciesScientific Name of the Pest
EucaliptusGonipterus platensis
Phoracantha semipunctata
Cork oak and holm oakLymantria dispar
Periclista spp.
Tortrix viridana
Curculio elephas
Cydia splendana
Coroebus undatus
Coroebus florentinus
Platypus cylindrus
Xyleborus spp.
Maritime pine and stone pineThaumetopoea pityocampa
Pineus pini
Cinara maritima
Leucaspis spp.
Pissodes validirostris
Dioryctria mendacella
Leptoglossus occidentalis
Orthotomicus erosus
Tomicus spp.
Ips sexdentatus
Dioryctria sylvestrella
Pissodes castaneus
Monochamus galloprovincialis
Table 2. Annual costs associated with rural fires (adapted from [20] and [54]).
YearNr. of OccurrencesBurned Area (m2)Total Costs (€)
1980234944,251€96,024,670
1981673089,798€194,861,660
1982362639,556€85,836,520
1983454247,811€103,749,870
1984735652,710€114,380,700
19858441146,254€317,371,180
1986503689,522€194,262,740
1987770576,268€165,501,560
1988613122,434€48,681,780
198921,896126,237€273,934,290
199010,745137,252€297,836,840
199114,327182,486€395,994,620
199214,95457,012€123,716,040
199316,10149,963€108,419,710
199419,98377,323€167,790,910
199534,116169,612€368,058,040
199628,62688,857€192,819,690
199723,49730,535€66,260,950
199834,675158,369€343,660,730
199925,47370,613€153,230,210
200034,107159,605€433,000,000
200126,947112,312€319,000,000
200226,576124,619€394,000,000
200326,219425,839€1,303,000,000
200422,165130,108€402,000,000
200535,824339,089€756,746,827
200620,44476,058€132,001,898
200720,31632,595€37,109,004
200814,93017,565€22,371,685
200926,13687,421€86,259,214
201022,026133,091€183,911,947
201125,22273,829€80,557,921
201221,179110,232€196,227,660
201319,294152,690€208,337,840
2014706719,930€27,503,169
201515,85164,412€119,406,200
201613,079160,490€460,000,000
201716,981442,418€616,000,000
Total4,419,166€9,589,826,075
Table 3. Causes of rural fires investigated by National Republican Guard/Nature and Environment Protection Survey (GNR/SEPNA) in 2016 (adapted from [20]).
CausesPercentage of Total Occurrences
Undetermined34.7%
Use of fire25.2%
Arson21.6%
Re-ignition of rural fires13.6%
Accidental3.5%
Natural0.7%
Structural0.6%
Table 4. Results obtained from the application of the simple moving average method.
YearNr. of Occurrences3 Periods Average5 Periods Average7 Periods Average
20015
200255
2003545
20043555
20057655
20067655
20073565
20084555
20097555
20105655
20115555
20124556
20135555
20146666
2015766
201667
20177
Table 5. Distribution of climatic anomalies by the months of the constituent years of the period under analysis.
YearJFMAMJJASOND
2001aaaa a
2002aaaa a
2003 a aa aa
2004a aa
2005 aaaaaa a
2006 aa aaaaa
2007 a aa
2008aa a a
2009 a aa aaaa
2010 a aaaa
2011 aaa aa
2012 a aa a
2013a aaaa
2014aa a aaa
2015 aaaa aaa
2016a aaaaa
2017 a aaaaa a
Total766101012889942
Table 6. Results obtained from the application of the simple moving average method.
YearNr. of Occurrences3 Periods Average5 Periods Average7 Periods Average
20016
200276
2003677
20049877
20058778
20065788
20079888
200810988
20099888
20106788
20117788
20129878
20138788
20145888
20151188
2016710
201711
Table 7. Distribution of climatic anomalies by the months of the years of the period under analysis.
YearJFMAMJJASOND
2001a a aa aa
2002aa aaaaa
2003 a aaa a a
2004aaaa aa a aa
2005aa a aaaa a
2006aa aa a
2007aaaaa a aaa
2008aaa aaaaaaa
2009 aaaa aaaaa
2010 aa aaa a
2011a aaa aa a
2012aaaaaaaa a
2013 a aaaaa aa
2014 a aa a a
2015aaaaaaaaa aa
2016 a aaaaa a
2017aa aaaaaaaaa
Total111291112131511106914
Table 8. Summary of data obtained from the Mann–Kendall test.
Series/TestKendall’s τp-valueSen’s slope
Temperature anomalies0.2810.1440.077
Precipitation anomalies0.2420.1940.148

