1. Introduction
The increasing rate of heat in urban areas has become one of the striking problems in many of the developing countries. Daily increase in temperature tends to worsen and continuously becoming threat to human health. This assertion according to [
1,
2] and International Panel of Climate Change [
3], had been a central theme among climatologists and it is well documented by many scholars around the world.
Studies show that various effects of climate variation and change in increasing urban temperature in Nigeria among other developing countries are high when compared to the number of similar studies in the temperate and developed countries [
4]. For example, [
5] noted that extreme temperatures can directly cause ill-health to man. This is because average human body is most efficient at a core temperature of 37 °C and this body temperature can only be maintained when there is a balance between heat loss and heat gain.
The heat exchange between the human body and his environment is governed by processes such as radiation, convection and evaporation. According to Amador
et al. [
6], high temperatures can cause numerous heat related illness such as: heat exhaustion, heat cramps, heat rash, heat tetany, heat syncope (fainting), over-sweating and heat stroke. On the other hand, exposure to very low temperatures can cause frost bite. The overall effects of high and low temperature disrupt the thermal and physiological comforts of man.
Urban heat is defined as an increase in the temperature of urban areas compared to the rural neighborhoods. This phenomenon is influenced by physical, human and anthropogenic factors [
7]. This especially occurs as cities develop, where more vegetation is lost and there is increase in paved, concreted or covering of land by buildings. Built up areas also evaporate less water which contributes to increase in surface and air temperatures.
The incidence of urban heat as well as concerns about it has increased over the years. In [
7], it was noted that cities are often 2 °f to 10 °f (1 to 6 °C) warmer than surrounding landscapes due to the fact that more heat is being released during cooling and heating processes in cities through industrial activities, moving vehicles and emissions coupled with the release of heat from domestic heating and cooling units [
8].
Due to increasing anthropogenic activities in Akure, the study area, overexertion in hot weather, sun or bushfire exposure, and exercising or working in hot, poorly ventilated or confined areas, people have been exposed to harsh weather which increases the risk of heat stress. The heat stress mostly results in heat rash—sometimes called “prickly heat”, a skin irritation caused by excessive sweating. This looks like a red cluster of pimples or small blisters. It is most likely to occur on the neck and upper chest, in the groin, under the breasts and in the elbow creases. Based on the effect of current heat status in the study area, it is pertinent to assess its increasing impact on human health with a view to identifying its existing relationship and prevalence towards proper management that can enhance improved human comfort.
2. Literature Review
According to United States Environmental Protection Agency [
9], when people are exposed to extreme heat, they can suffer from potentially deadly illnesses such as elevated body temperatures, heat cramps, heat exhaustion, and heat stroke. As the world’s average temperature gets warmer, some areas are already experiencing an increase in the number of extremely hot days, and scientists expect severe heat waves to become more frequent and more intense in the future. The physiological effects of temperature on the human body are well known, because extreme conditions of heat or cold can be detrimental to many body functions, both directly and in terms of the water stress imposed by high temperatures.
In a recent survey of mortality, Keatinge
et al. [
10] have reported that deaths in mid- and high-latitude countries occur most frequently during conditions of extreme cold or extreme heat. Between the two extremes, a physio-climatic “optimum” exists where mortality is at a minimum. This is because the physiological response to heat and cold stress will be vastly different for inhabitants in Helsinki and Athens, for example, since they are acclimatized to a particular range of temperatures under current climatic conditions; it is when temperatures begin to come out of the current range that health impacts may become significant.
Hot working environments are not just a question of comfort, but a concern for health protection and the ability to perform work tasks. Working in hot environments increases the risk of diminished ability to carry out physical tasks [
11], diminishes mental task ability [
12], increases accident risk [
13] and, if prolonged, may lead to heat exhaustion or heatstroke.
Heat waves, particularly in large urban areas, are associated with episodes of strong pollution often linked to the formation of tropospheric ozone, a gas that is formed by chemical transformation of nitrogen oxides and other “precursor” gases released during the combustion of fossil fuels. Ozone is a highly corrosive gas that can irritate or damage lung tissues in addition to provoking eye irritation. “Los Angeles smog” has long been a persistent feature of southern California, as a result of socio-economic and meteorological conditions optimal for ozone formation, but today the very large cities in the south, such as Mexico City, New Delhi, or Cairo, are also severely affected by such pollution. The probable increase in heat waves in a generally warmer climate and the concomitant effects of heat on atmospheric pollution will lead to greater mortality overall, even taking into account the probable reduction in cold-related deaths in many parts of the mid- and high-latitude countries.
Also, the properties of the materials or urban structures such as concretes, iron and steel among others increase urban heat due to their high thermal emissivity and heat retention capacity. In addition, glassy windows, concrete surfaces, asphalt covered roads, brick/stone buildings, colored/painted buildings, corrugated roofs, tiled roofs and tar or gravel tends to absorb heat rather than reflect heat due to their low albedos (0–3 to 0.35) unlike white painted buildings that have high albedo (0.60–0.70). As a result, these materials contribute to increased heat in urban areas. On the other hand, daily increase in the urban atmospheric pollution leads to increase in emissions of Green House Gases (GHGs) through the burning of fossil fuels, wastes, and combustion of solid wastes. Also the increase in population and proportionate increase in human activities contributes but also alter the balance of the equilibrium between the natural GHGs and the atmospheric gases thus promoting the warming of urban areas, since they are heat-trapping gases.
The incidence of urban heat as well as concerns about it has increased over the years. This was observed by [
7], who noted that cities are often 2 °f to 10 °f (1 to 6 °C) warmer than surrounding landscapes due to the fact that more heat is being released during cooling and heating processes in cities, in industries, by moving vehicles and through emissions coupled with the release of heat from domestic heating and cooling units [
8].
The foregoing, according to Matzarakis
et al. [
14], signifies that interest in this area of study is an indicator of the effect of climate on health and physiological comfort of man. Moreover, the assessment of health in Africa shows that many communities in the developing countries are already impacted by health stresses, especially as urbanization increases [
15].
In relation to monthly weather variation, [
16] correlated daily mortality for 10 cities with weather conditions in January, April, July, and October and found that large diurnal variations in temperature, dewpoint, and pressure were associated with many high mortality days. In addition, hot, humid weather with concomitant high pollutant concentrations were also contributory mechanisms. Other studies do not attribute large variations in mortality to extreme events, but rather to the normal seasonal changes in weather [
17].
The importance of determining the role of weather in human health cannot be understated. Reports of large increases in mortality during heat and cold waves are commonplace; for example, the National Oceanic and Atmospheric Administration (NOAA) estimated that 1327 fatalities in the United States were directly attributed to the 1980 heat wave; fatalities in Missouri alone accounted for over 25% of the total excess deaths [
18]. During a heat wave in 1963, more than 4600 deaths above a computed mean occurred in June and July in the eastern United States [
19]. The impact of weather on human well-being goes beyond mortality; even birth rates and sperm counts appear to be affected by meteorological phenomena [
20,
21,
22].
The impact of temperature on morbidity and mortality can be assessed at both the seasonal and daily level. The variability in occurrence of numerous illnesses is linked to somewhat predictable seasonal trends in temperature [
17], although significant year-to-year differences do occur. Medical disorders such as bronchitis, peptic ulcer, adrenal ulcer, glaucoma, goiter, eczema, and herpes zoster are related to seasonal variations in temperature [
13]. Heart failure (most often myocardia l infarction) and cerebrovascular accidents represent two general mortality categories that have been correlated many times with ambient monthly temperatures [
17]. Complications from these disorders can be expected at higher temperatures since the body responds to thermal stress by forcing blood into peripheral areas to promote heat loss through the skin. This increases central blood pressure and encourages constriction of blood vessels near the core of the body. However, increases in the occurrence of heart disease are also noted at very cold temperatures as well. Strong negative correlations have been found between winter temperature and deaths in certain North American, northern Asian, and European countries [
17].
The degree of seasonality in the climate of a region also appears to affect mortality rates. In [
23], it was reported that countries with smaller seasonal temperature ranges exhibit steeper regression lines in temperature-mortality correlations than do countries with greater temperature ranges. Maximum death rates in warmer countries are found at below normal temperatures, and in cooler countries similar temperatures will produce no appreciable rise in mortality.
Some studies contend that mostly long-term (
i.e., monthly and annual) fluctuations in temperature affect mortality [
24] and only small, irregular aberrations can be explained by daily temperature variability [
17]. However, authors in [
25] reports that daily fluctuations in temperature can increase mortality rates by up to 50% in certain cities.
Much of the temperature-mortality research has concentrated on heat and cold wave episodes. It appears that hot weather extremes have a more substantial impact than cold, and many “heat stress” indices have been developed to assess the degree of impact [
26,
27]. The authors of [
16] related 19 different meteorological variables with total mortality and other more specific mortality classes (cause of death, age) and identified high temperature as the most important causal mechanism in summer. Many other studies support this relationship between temperature and mortality [
28,
29,
30]. Interestingly, a majority of studies have found that most of the excess deaths that occurred during periods of intense heat were not attributed to causes traditionally considered to be weather-related, such as heat stroke [
31]. Consequently, many researchers continue to utilize total mortality figures in their analyses, as deaths from a surprisingly large number of causes appear to escalate with increasing temperature [
32,
33].
Although most researchers have preferred the use of maximum temperature as the primary predictor of mortality, others continue to utilize average daily temperature as their primary weather statistic. While [
34] found that maximum temperature with a 1-day lag was the single most important predictive weather/mortality variable, authors in [
35] worked strictly with daily average temperature to evaluate cardiovascular diseases; others have even used weekly averages [
36,
37]. Those who use daily averages cite the importance of warm nights in contributing to mortality, something that is neglected when utilizing maximum temperatures alone [
30]. However, others report that daily averages tend to mask the effect on mortality of large daily oscillations in temperature [
38].
Based on the fact that, the bulk of intuitive understanding of the importance of temperature, as well as research-based data that proves its significance, much often, the consideration to minimize heat in urban areas has not been given proper attention. In the light of this, this study will examine the seasonal trend and relationship of the monthly temperature and incidence of heat-rash in Akure, a fast growing urban center in Nigeria.
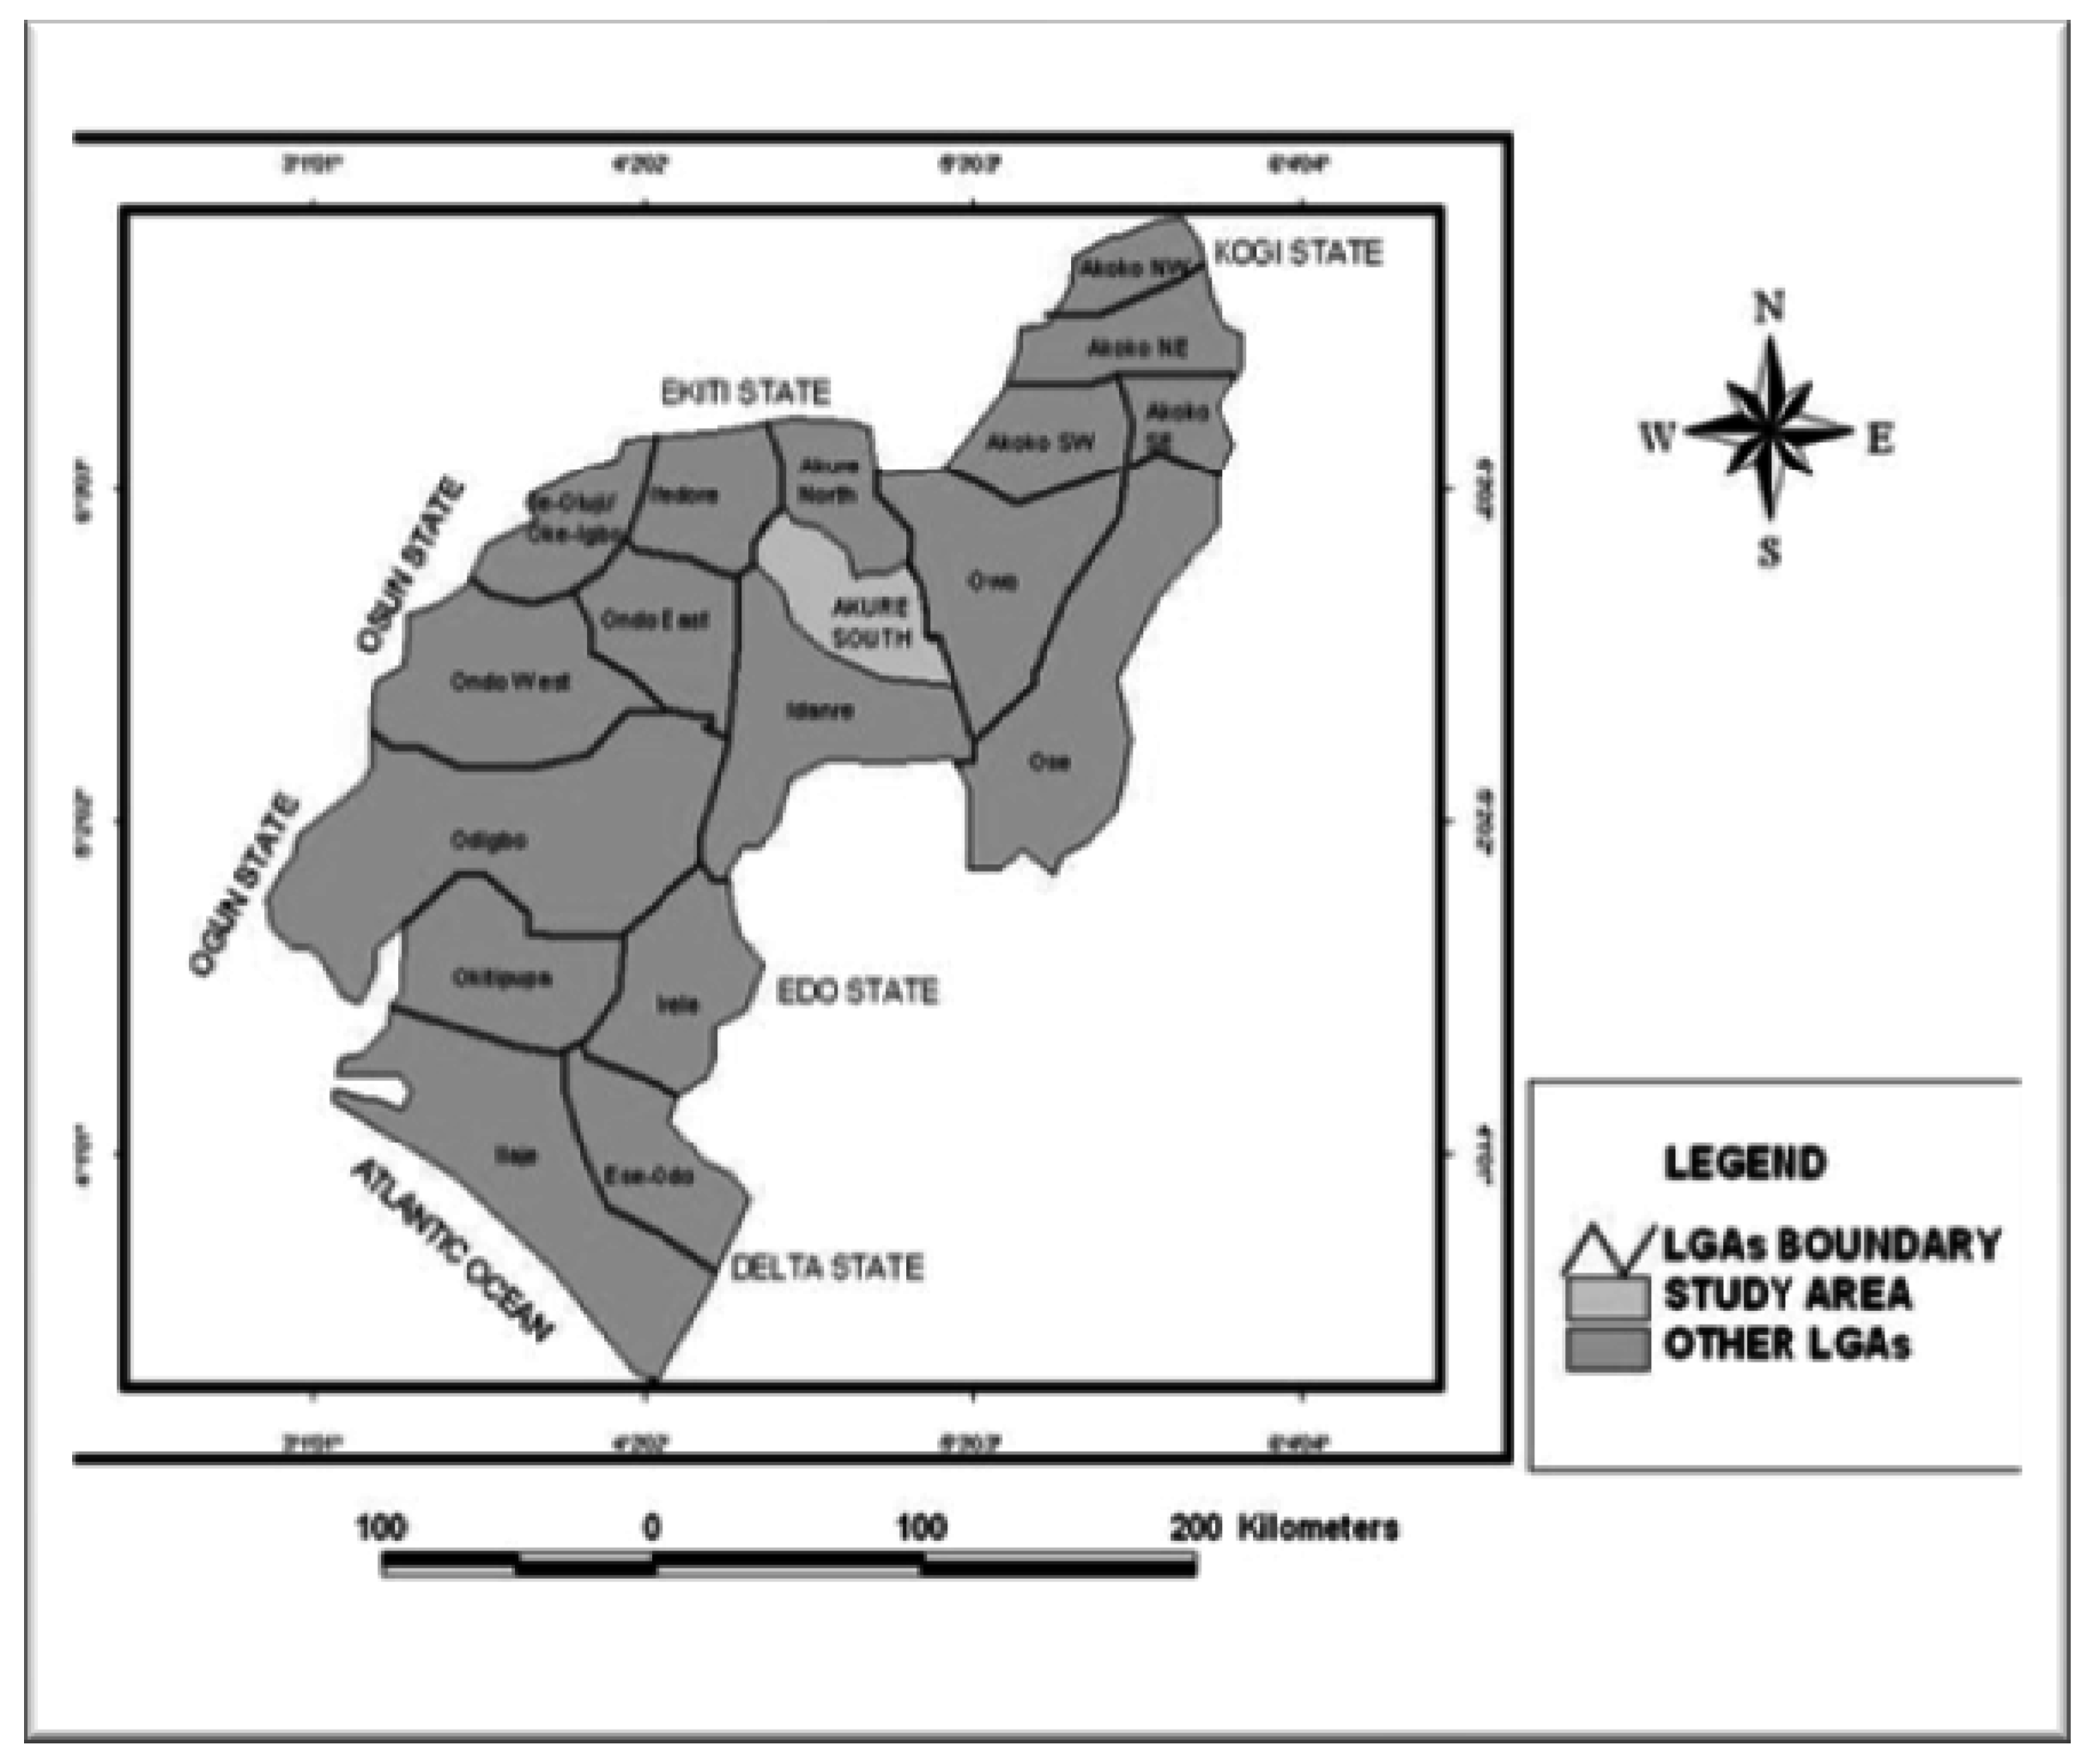
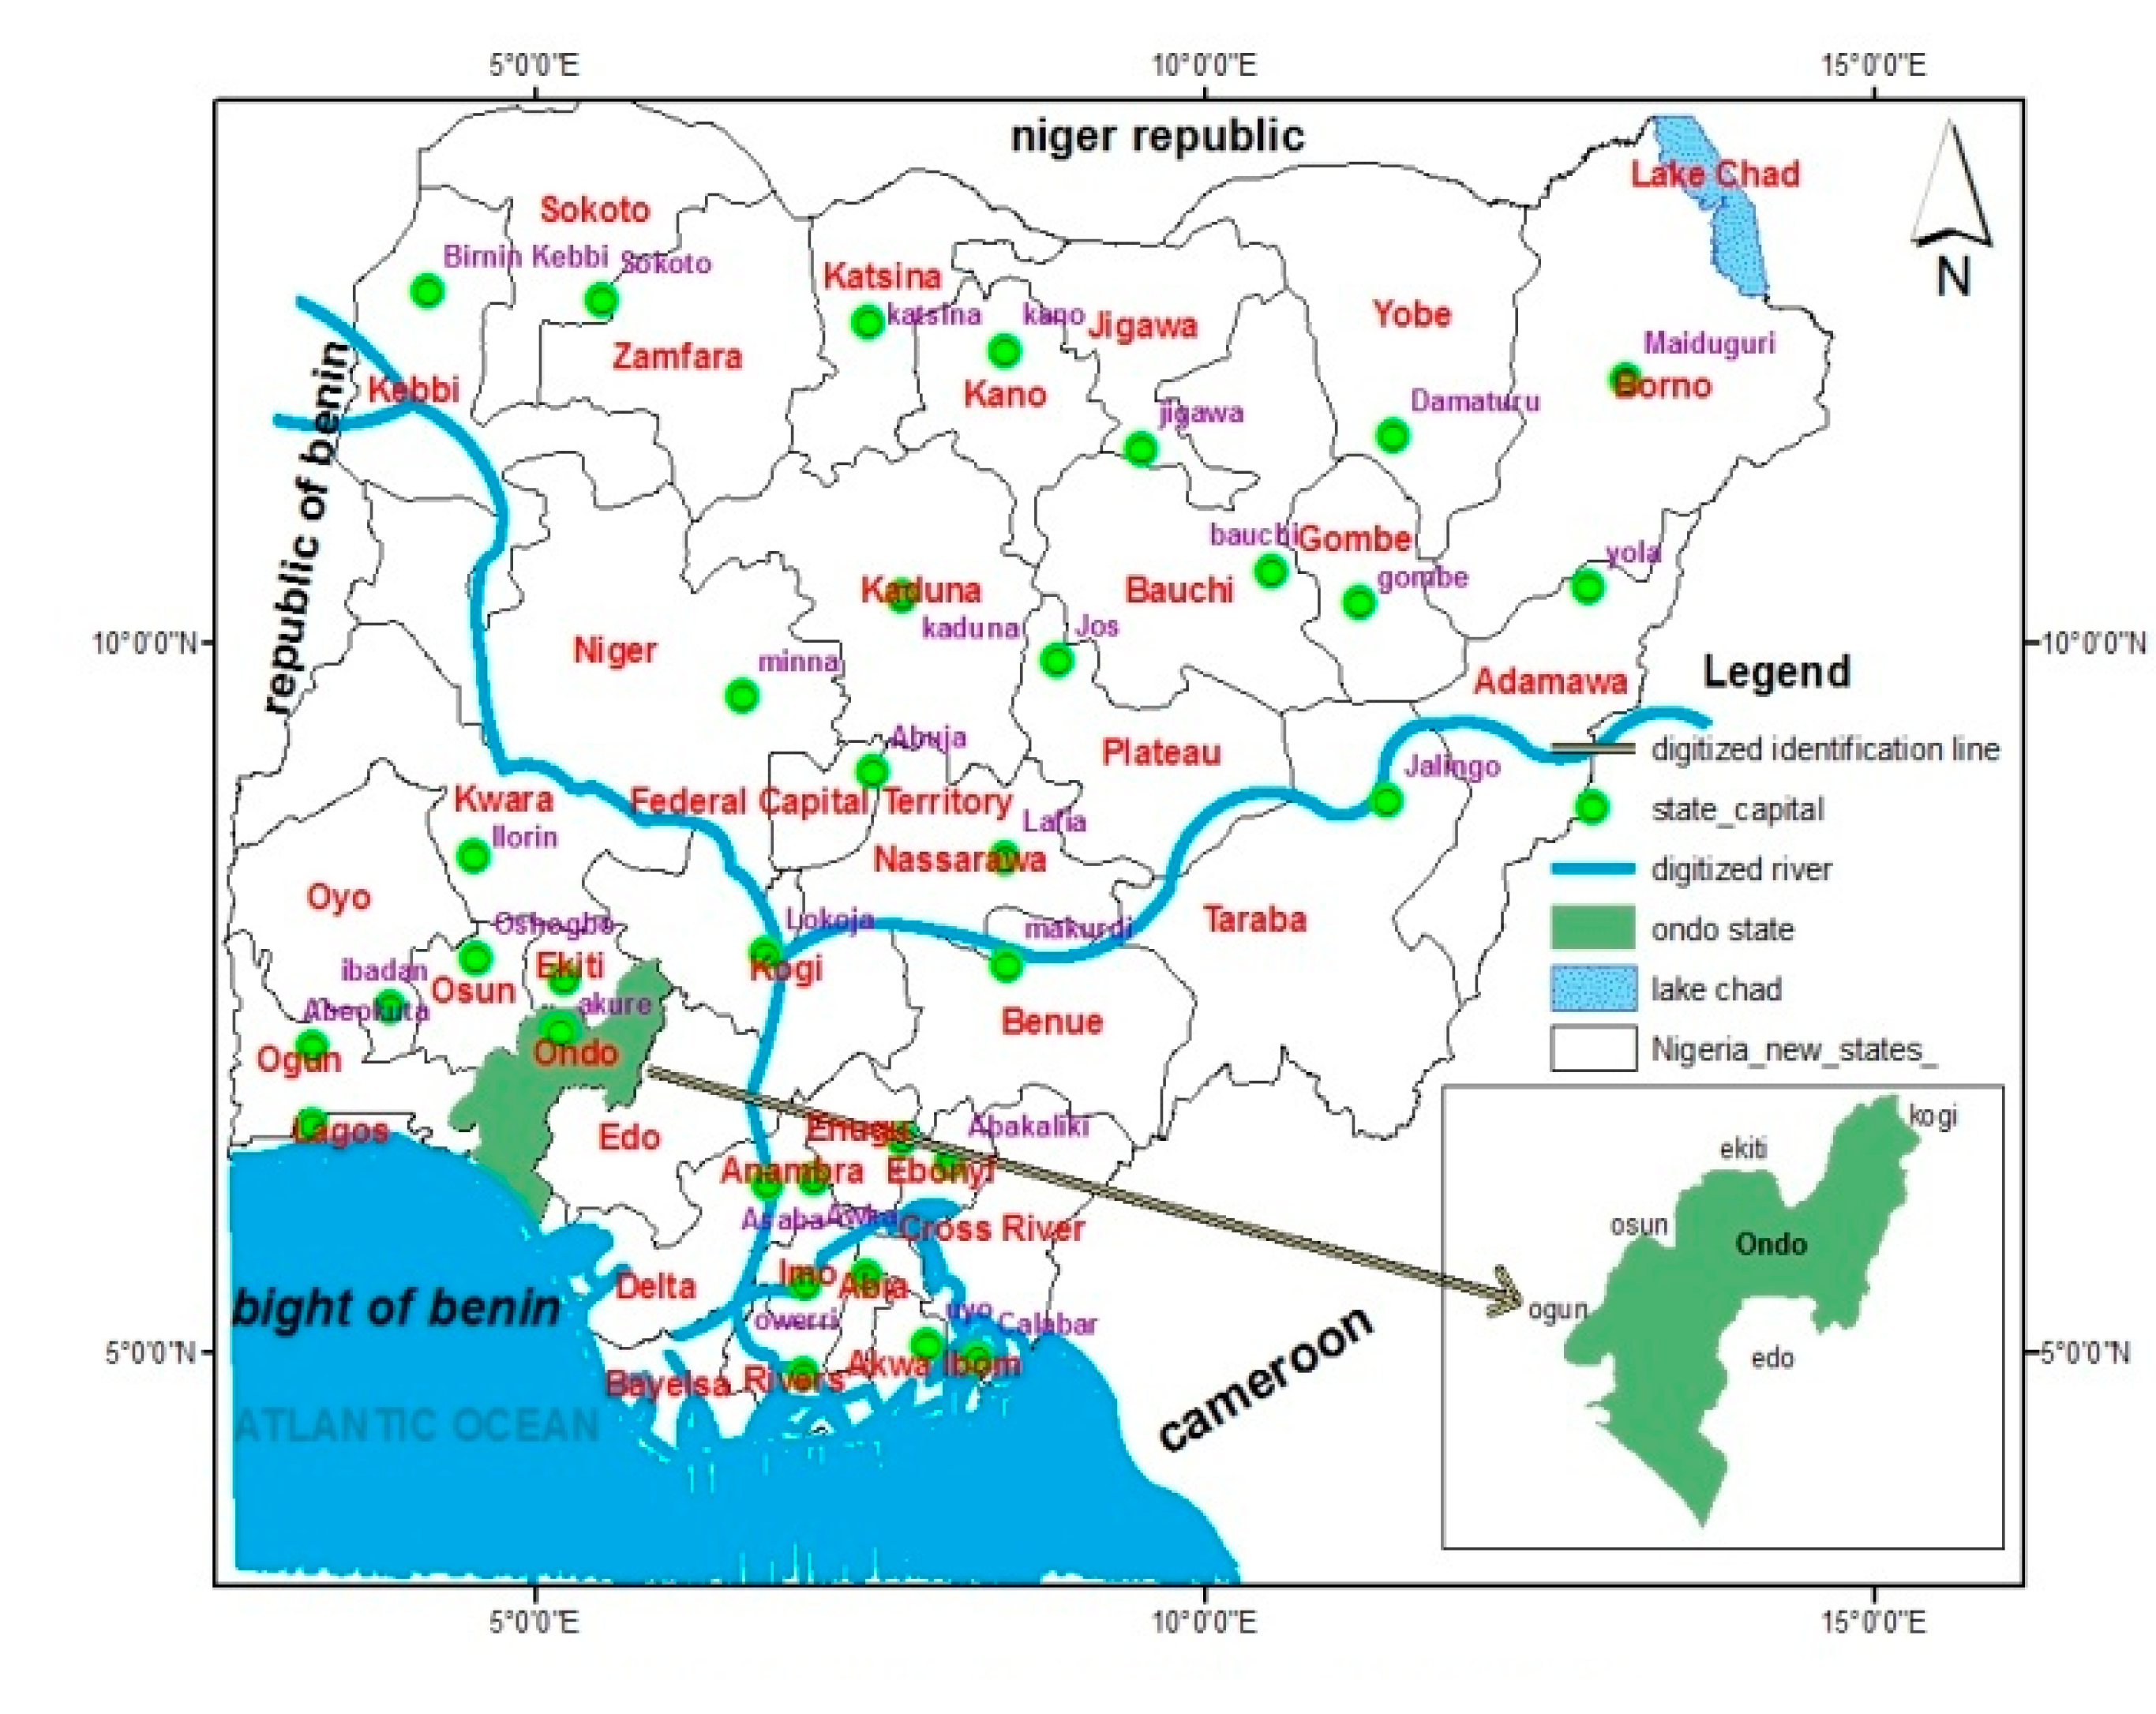
3. Study Area
The study area is Akure. This is one of the traditional Yoruba cities located in South-Western part of Nigeria (
Figure 1). Akure is located on longitude 4.944055°E and 5.82864°E, and latitude 7.491780°N and 6.96375°N (
Figure 2). It is approximately 700 km to South-West of Abuja, the Federal Capital Territory of Nigeria.
Akure has a tropical humid climate with two distinct seasons, namely, wet and dry season. The wet season usually lasts seven months starting from April and ends in October. There are, sometimes, one or more cases of heavy rain in either January, February and March from the East-West line squalls. It is this early rainstorm that enables farmers to hoe their farms in preparation for the planting season that starts in late March. According to the Ondo State Ministry of Agriculture [
39], the total of the annual rainfall ranges between 1300 mm and 1650 mm. Temperatures are generally high during the day especially in March and April. Along the river valleys, these temperatures plus high relative humidity produce debilitating weather conditions. Average maximum and minimum daily temperature of 38 °C and 27 °C in the wet season and 39 °C and 23 °C respectively were recorded.
The land is generally low-lying (average 100 m–270 m) and gently undulating with occasional land rising to about 1500 m in the Northern part. Other areas have average gradient of less than 3° and they are made up of interfluves, broad open valleys and flood plains. The dominant rivers in Akure as noted by [
40] include River Ala, Omi Ebo, Aledi-Moponyin, Ijala and Ukere.
Figure 1.
Nigeria showing Ondo State.
Figure 1.
Nigeria showing Ondo State.
Figure 2.
Ondo State showing Akure.
Figure 2.
Ondo State showing Akure.
Akure falls within the Kukuruku Hills; a part of the South Western highland with structurally developed basement complex rocks which comprises ancient igneous and metamorphic rocks that are dominated by porphyritic granites, migmatites, diorites, pegmatites and gneisses. Most of the basement complexes are sedimentary rocks that have been deeply weathered to produce regolith of several meters deep. These rocks are rich in solid minerals which are yet to be mined [
41].
The soils of Akure are mainly oxisols and utisols (tropical ferrugineous) which vary over space with respect to texture, drainage and gravel content [
42]. The vegetation type of Akure is forest vegetation, which is categorized as: forests, Gallery forests and Forest reserves. In these forests, typical rain forest trees such as Mahogany, Obeche, Iroko, Afara,
etc. are present and used for timber. Other economic trees include African pear, Bamboo, Raffia palm, Oil palm, Orange, Mango and Coconut. The persistent clearance of the vegetation in and around Akure has led to the development of derived forest around the town [
40].
According to National Population Commission [
43], the national population projection for the year 1996 and 2000 puts Akure South population and Akure North population at 269,207 and 298,712 respectively. However, a sharp increase was recorded in the 2006 census, at 353,211 and 131,587 respectively.
The predominant tribes in Akure are Yoruba, Igbira, Ibo, Edo and Hausa among others and the language spoken are Yoruba and Ondo dialect among others. The increase in land mass and population is evident in economic activities which include the daily trade in commodities carried out in a network of traditional and modern markets, hotels and guest houses, dotting the landscape of both inner and outskirts of the city. More than 50% of the people are farmers and it is not uncommon to find the people combining this practice with other formal occupations such as, civil servants, private workers and traders among others. The people of Akure also engage in the few small indigenous industries such as Gaari production, Block and Bakery industries and also in local traditional cloth weaving practices.
However, Akure morphology has changed over time to assume its present status with its attendant land problems as experienced in similar medium sized urban centers in Nigeria. The increased relative political influence of Akure as a state capital since 1976 has greatly promoted its rapid growth and increased socio-economic activities resulting in its spatial expansion from an area of about 16 km2 in 1980 to about 30 km2 in 2000 and currently 50 km2 in 2011.
5. Results and Discussion
5.1. Monthly Temperature and Heat-Rash in Akure during 2003 and 2012
Table 1 presents the monthly data on minimum and maximum temperature of Akure, Ondo State, Nigeria. It is established that minimum temperature in this location generally fall between 20.6 °C and 25 °C while the maximum temperature ranges between 30.1 °C and 35.7 °C. The monthly rainfall data presented in
Table 2 depicts July as the month that receives highest rain all through the year. The information on temperature data in the study area show that May was the month that received the least of the minimum temperature in the year 2003, while September received the highest minimum temperature in year 2008. In respect of the recorded maximum temperature in this study, August and March had the least maximum temperature (30.1 °C) in 2006 and 2007 respectively, whereby 35.7 °C in April 2008 was recorded as the highest maximum temperature in this area. The heat risk as indicated by the temperature data has exposed human to different skin diseases among which is heat-rash. Interestingly, [
31] revealed that a majority of studies have found that most of the excess deaths that occurred during periods of intense heat were not attributed to natural causes but considered to be weather-related, such as heat stroke.
Table 3 presents recorded data on incidence of heat-rash where every month under consideration were affected. This shows that heat-rash is one of the common heat-related skin diseases, especially in Akure where it has prevalent impact among the people. This scenario generally indicates the fact that temperature varies and this could in most cases subject people to excessive sweating that usually result in skin irritation.
5.2. Trends of the Monthly Temperature, Rainfall and Heat-Rash in Akure
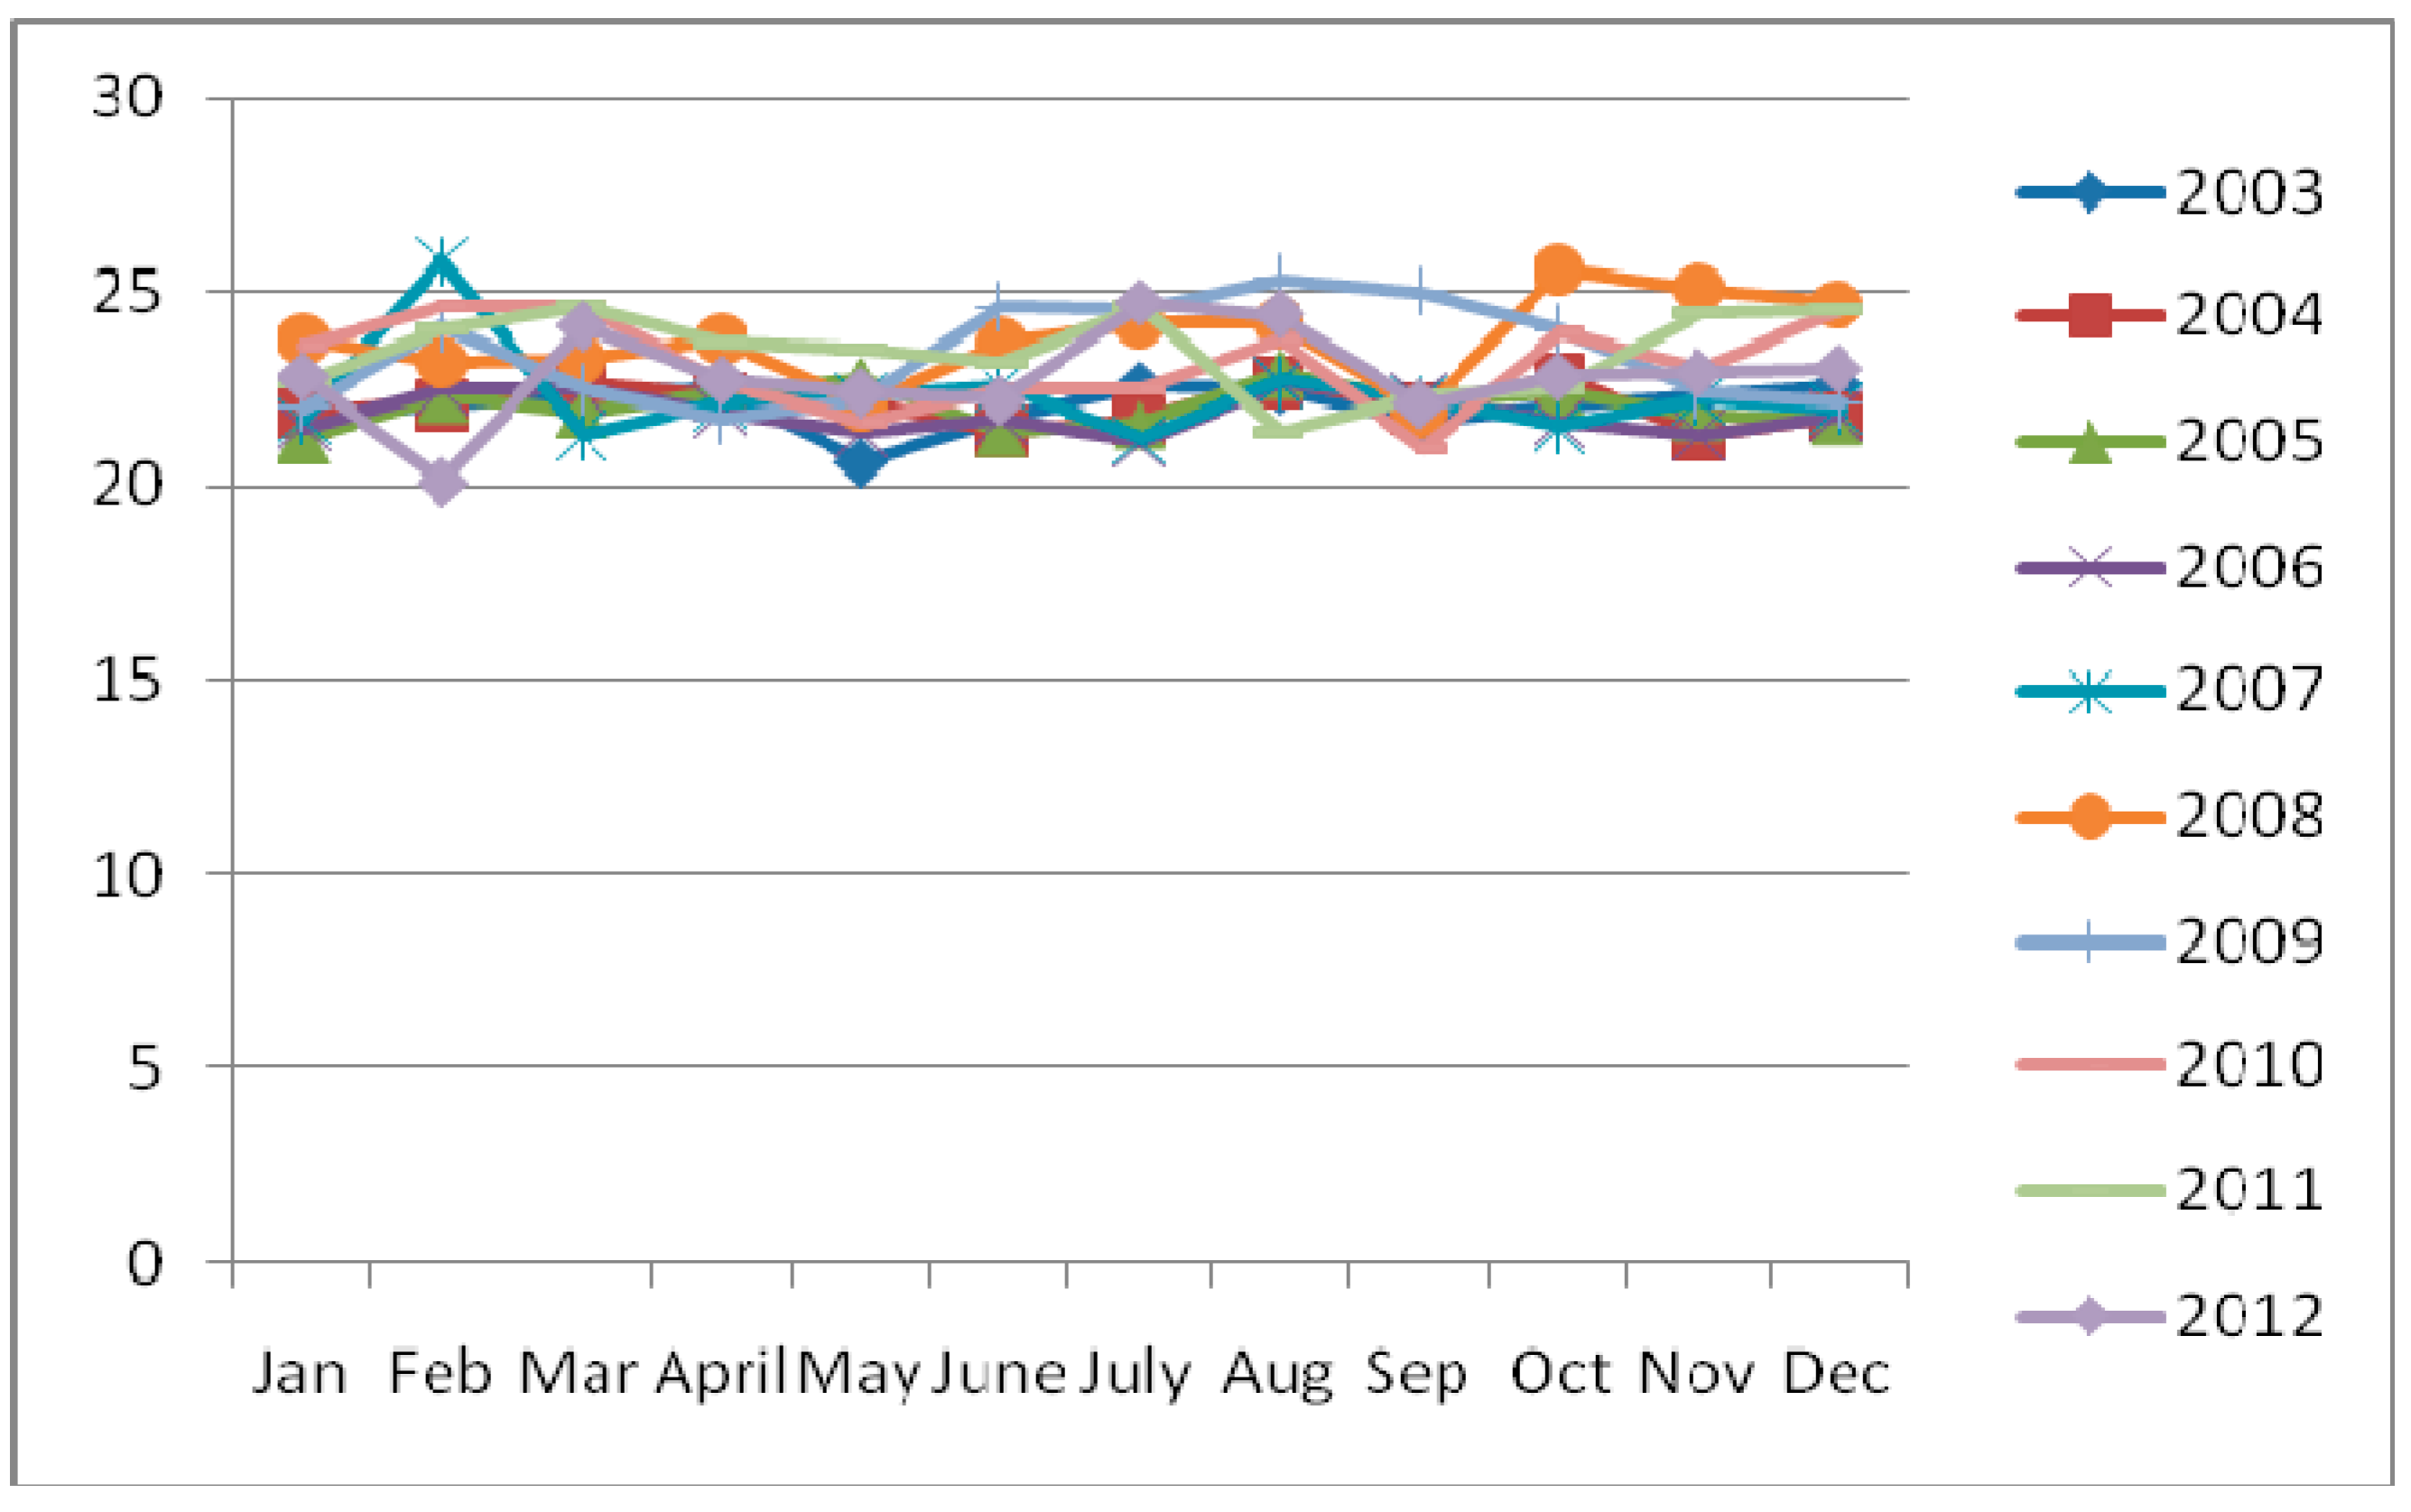
It was observed in
Figure 3 that the minimum monthly temperature in 2008 and 2007 have similar trend with increasing temperature in January, February, March and April but dropped sharply in May, although, the trend of the temperature in 2008 rose again from July to September with sharp drop in September, but rose continuously to December. Report indicates that minimum temperature in 2007 dropped consistently from July to December.
Obviously, temperature in 2009 rose in June to October and dropped in the rest part of the year to December. Monthly temperature in 2012 dropped from 22.3 °C to 20 °C in January and February respectively, though there was a rise from June to September; it was sharply dropped between September and December all through the year.
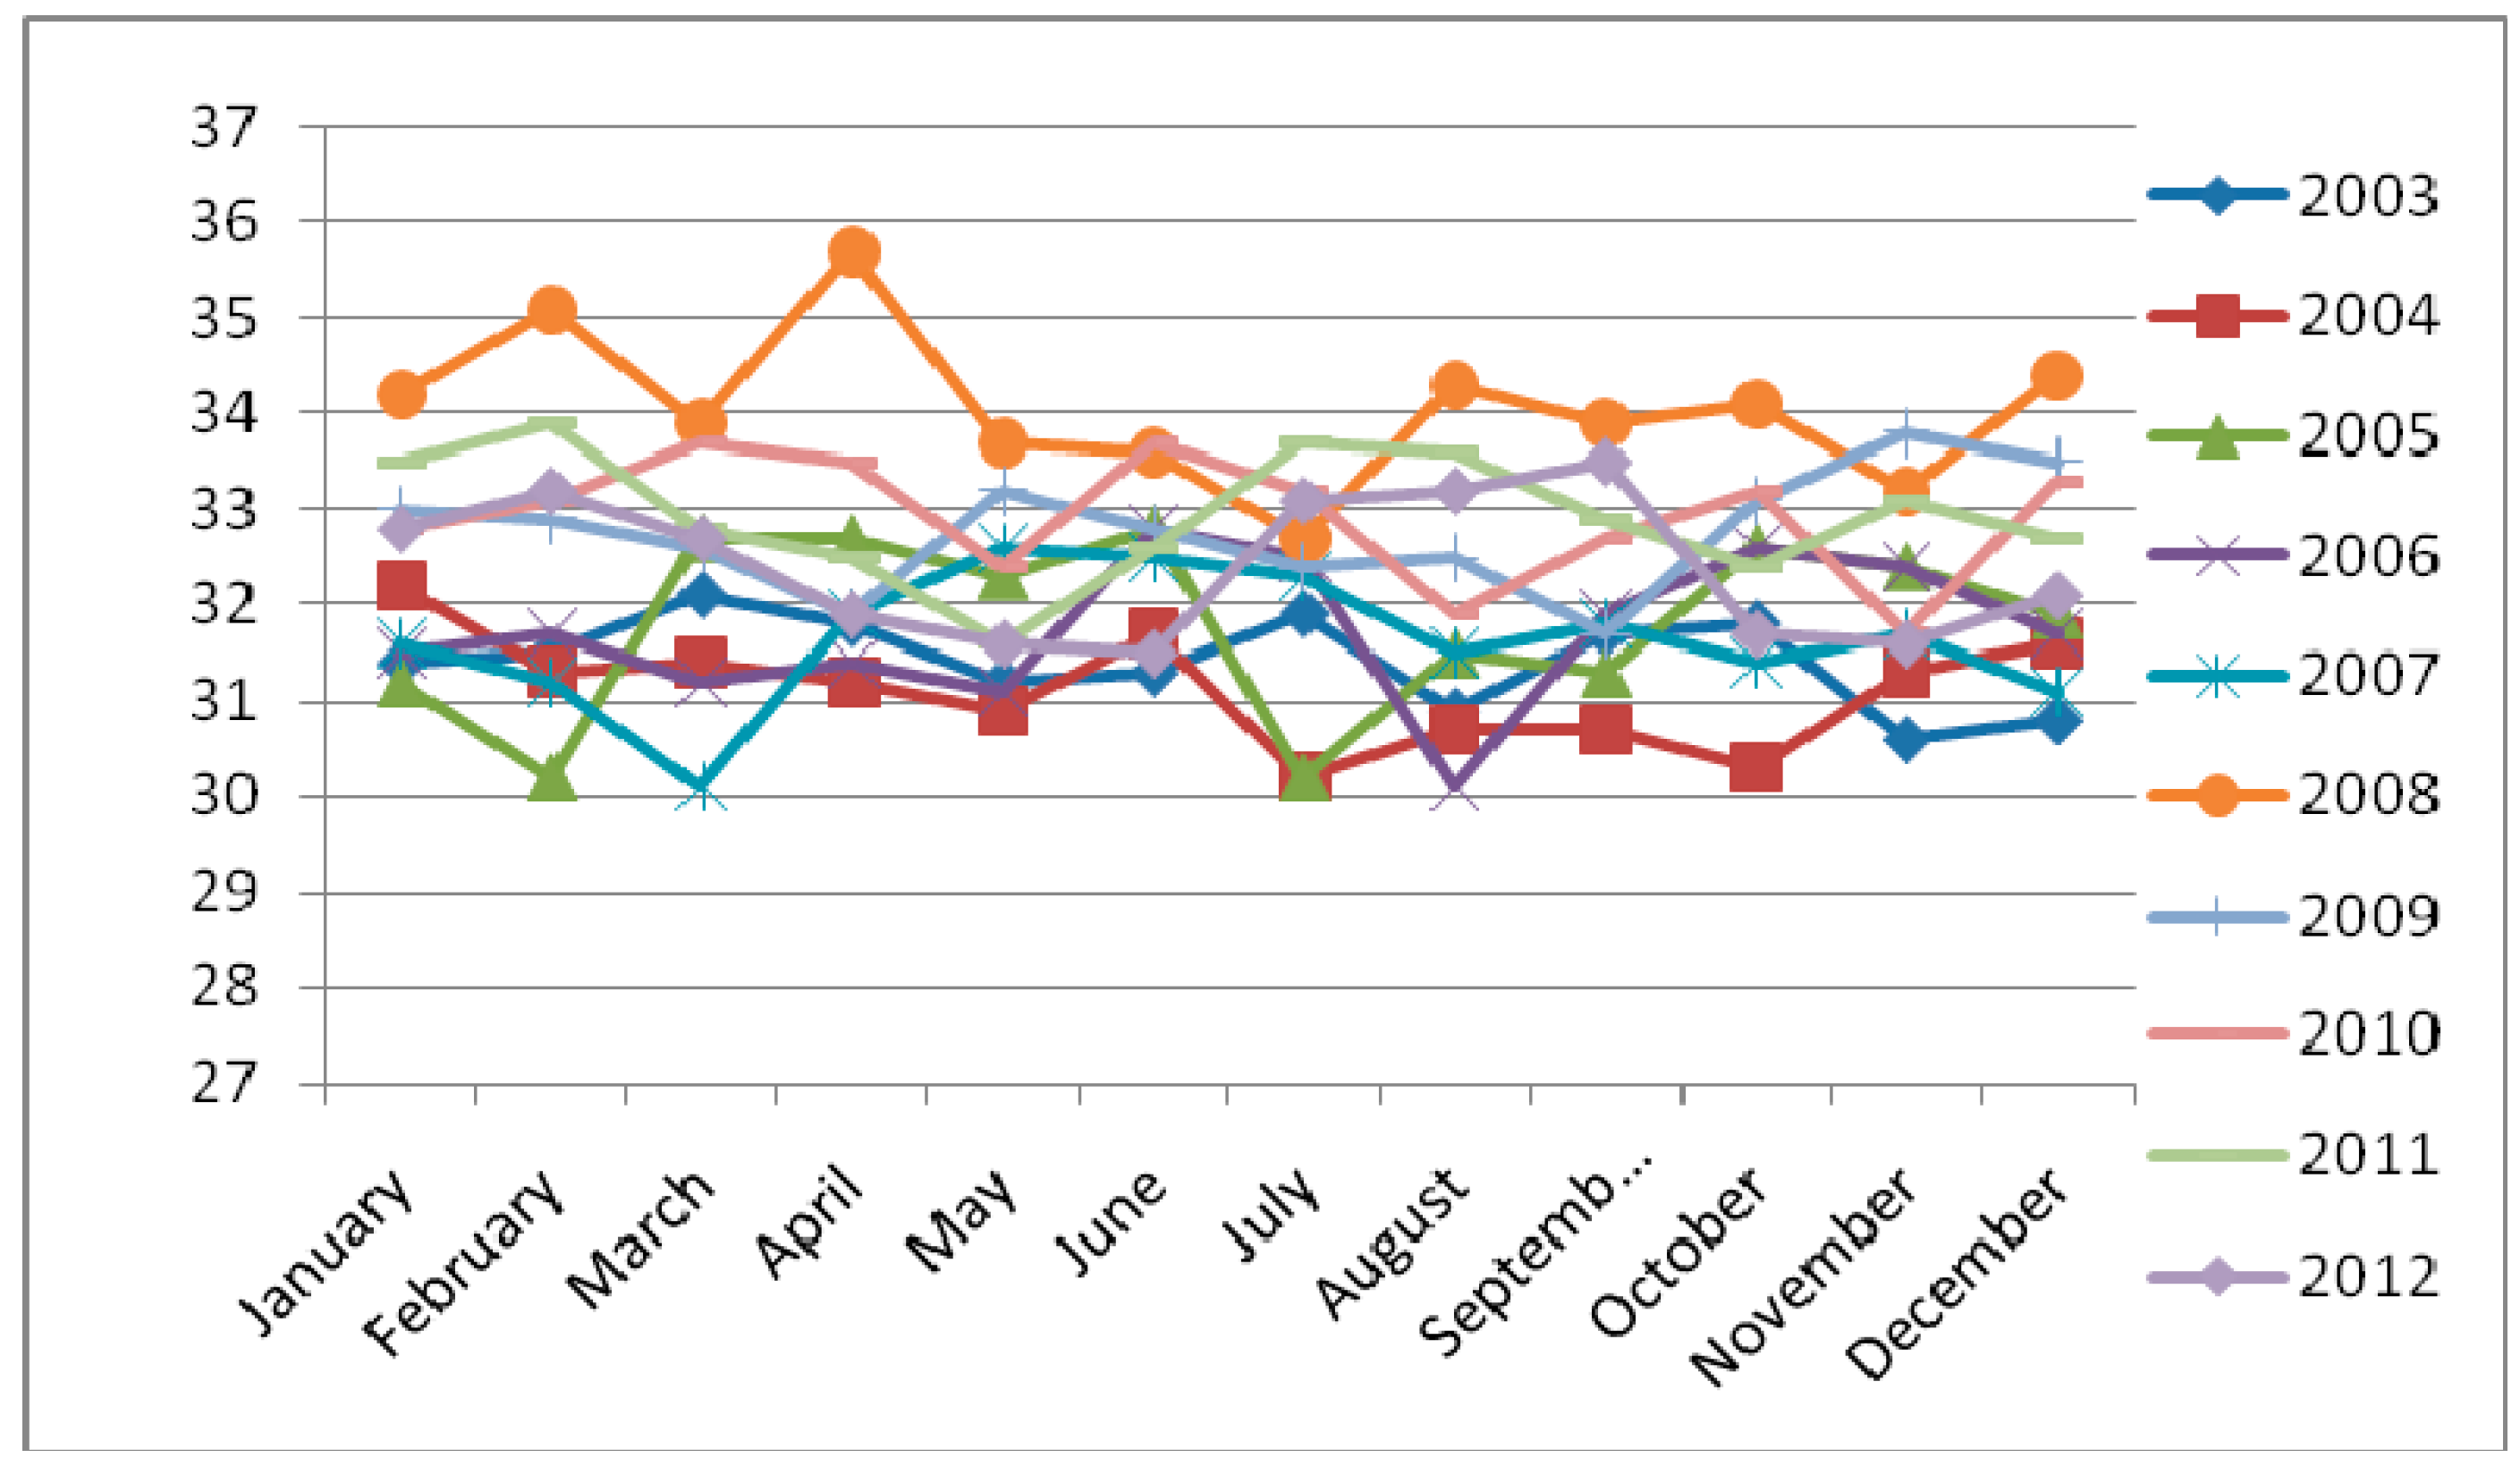
Monthly maximum temperature is generally high in 2008 (
Figure 4), it has drastic drop from May to August and November. In 2004, temperature was consistently low, though it demonstrates slight increase in January (32 °C), June (31.5 °C), November (30 °C) and December (31.5 °C). These observations generally show that the monthly temperature of Akure was above 20 °C from January to December within the selected periods, but it was below 36 °C during the month in the same years.
Table 1.
Monthly temperature of Akure from 2003 to 2012.
Table 1.
Monthly temperature of Akure from 2003 to 2012.
| Month | 2003 (°C) | 2004 (°C) | 2005 (°C) | 2006 (°C) | 2007 (°C) | 2008 (°C) | 2009 (°C) | 2010 (°C) | 2011 (°C) | 2012 (°C) |
|---|
| Min | Max | Min | Max | Min | Max | Min | Max | Min | Max | Min | Max | Min | Max | Min | Max | Min | Max | Min | Max |
|---|
| January | 21.9 | 31.4 | 21.9 | 32.2. | 21.2 | 31.2 | 21.5 | 31.5 | 21.7 | 31.6 | 23.8 | 34.2 | 22 | 33.0 | 23.6 | 32.8 | 22.7 | 33.5 | 22.8 | 32.8 |
| February | 22.1 | 31.5 | 22.1 | 31.3 | 22.1 | 30.2 | 22.1 | 31.7 | 21.4 | 31.2 | 25.8 | 35.1 | 23.2 | 32.9 | 24.1 | 33.1 | 24.6 | 33.9 | 24 | 33.2 |
| March | 22.4 | 32.1 | 22.6 | 31.4 | 21.9 | 32.7 | 22.5 | 31.2 | 21.3 | 30.1 | 23.3 | 33.9 | 22.5 | 32.6 | 24.6 | 33.7 | 24.6 | 32.8 | 24.1 | 32.7 |
| April | 22.5 | 31.8 | 22.3 | 31.2 | 22.4 | 32.7 | 21.9 | 31.4 | 22.1 | 31.9 | 23.8 | 35.7 | 21.7 | 31.9 | 22.7 | 33.5 | 23.7 | 32.5 | 22.7 | 31.9 |
| May | 20.6 | 31.2 | 22.1 | 30.9 | 22.7 | 32.3 | 21.4 | 31.1 | 22.3 | 32.6 | 22.1 | 33.7 | 22.2 | 33.2 | 21.7 | 32.4 | 23.5 | 31.6 | 22.4 | 31.6 |
| June | 21.7 | 31.3 | 21.4 | 31.7 | 21.4 | 32.8 | 21.7 | 32.8 | 22.6 | 32.5 | 23.7 | 33.6 | 24.6 | 32.8 | 22.5 | 33.7 | 23.2 | 32.6 | 22.2 | 31.5 |
| July | 22.6 | 31.9 | 21.7 | 30.2 | 21.6 | 30.2 | 21.1 | 32.5 | 21.2 | 32.3 | 24.2 | 32.7 | 24.5 | 32.4 | 22.5 | 33.2 | 24.6 | 33.7 | 24.7 | 33.1 |
| August | 22.5 | 30.9 | 22.7 | 30.7 | 22.9 | 31.5 | 22.7 | 30.1 | 22.7 | 31.5 | 24.2 | 34.3 | 25.3 | 32.5 | 23.8 | 31.9 | 21.4 | 33.6 | 24.5 | 33.2 |
| September | 21.6 | 31.7 | 22.1 | 30.7 | 22.3 | 31.3 | 22.2 | 31.9 | 21.9 | 31.8 | 25 | 33.9 | 21 | 31.7 | 22.3 | 32.7 | 22.1 | 32.9 | 24.8 | 33.5 |
| October | 22.1 | 31.8 | 22.8 | 30.3 | 22.4 | 32.6 | 21.6 | 32.6 | 21.5 | 31.4 | 25.6 | 34.1 | 24 | 33.1 | 23.9 | 33.2 | 22.3 | 32.4 | 22.8 | 31.7 |
| November | 22.3 | 30.6 | 21.3 | 31.3 | 21.8 | 32.4 | 21.3 | 32.4 | 22.2 | 31.7 | 25.1 | 33.2 | 22.4 | 33.8 | 23 | 31.7 | 24.4 | 33.1 | 22.9 | 31.6 |
| December | 22.6 | 30.8 | 21.8 | 31.6 | 21.7 | 31.9 | 21.8 | 31.7 | 22.0 | 31.1 | 24.7 | 34.4 | 22.1 | 33.5 | 24.5 | 33.3 | 24.5 | 32.7 | 22.7 | 32.1 |
Table 2.
Monthly rainfall data of Akure from 2003 to 2012.
Table 2.
Monthly rainfall data of Akure from 2003 to 2012.
| Year | January | February | March | April | May | June | July | August | September | October | November | December |
|---|
| 2003 | 123.3 | 142.2 | 139.1 | 141.1 | 145.3 | 147.4 | 149.1 | 136.1 | 144.4 | 146.3 | 135.3 | 116.1 |
| 2004 | 129.2 | 120.3 | 123.3 | 125.4 | 119.2 | 130.4 | 139.1 | 127.3 | 128.2 | 131.3 | 127.5 | 120.2 |
| 2005 | 122.5 | 133.1 | 129.2 | 132.2 | 130.2 | 132.1 | 136.3 | 131.2 | 133.2 | 132.1 | 130.4 | 127.2 |
| 2006 | 114.4 | 132.2 | 132.1 | 133.1 | 129.3 | 130.2 | 138.1 | 131.3 | 132.3 | 134.1 | 130.1 | 125.2 |
| 2007 | 185.1 | 180.2 | 185.2 | 184.1 | 187.3 | 183.1 | 196.2 | 192.2 | 191.3 | 193.1 | 189.2 | 181.1 |
| 2008 | 135.3 | 131.1 | 125.3 | 135.2 | 133.2 | 132.1 | 138.1 | 136.4 | 129.1 | 131.5 | 135.2 | 120.1 |
| 2009 | 193.1 | 133.2 | 195.2 | 189.2 | 190.1 | 187.7 | 197.9 | 194.5 | 191.5 | 195.7 | 193.2 | 188.1 |
| 2010 | 125.2 | 132.1 | 135.2 | 123.1 | 135.5 | 136.1 | 138.3 | 130.2 | 131.1 | 129.4 | 132.1 | 127.2 |
| 2011 | 170.3 | 171.6 | 169.3 | 165.2 | 171.3 | 166.4 | 175.3 | 167.1 | 171.4 | 172.4 | 170.1 | 160.1 |
| 2012 | 127.4 | 119.2 | 139.1 | 141.1 | 137.3 | 139.3 | 147.2 | 143.2 | 141.2 | 145.1 | 141.1 | 135.2 |
Table 3.
Monthly Incidence of Heat-rash in Akure from 2003 to 2012.
Table 3.
Monthly Incidence of Heat-rash in Akure from 2003 to 2012.
| Month | 2003 | 2004 | 2005 | 2006 | 2007 | 2008 | 2009 | 2010 | 2011 | 2012 |
|---|
| January | 77 | 81 | 63 | 60 | 52 | 67 | 49 | 72 | 55 | 61 |
| February | 55 | 62 | 51 | 65 | 44 | 45 | 41 | 40 | 35 | 30 |
| March | 32 | 30 | 42 | 47 | 32 | 51 | 57 | 61 | 27 | 35 |
| April | 47 | 45 | 61 | 37 | 46 | 44 | 40 | 39 | 44 | 55 |
| May | 35 | 33 | 44 | 51 | 50 | 47 | 43 | 42 | 41 | 47 |
| June | 43 | 54 | 17 | 12 | 22 | 26 | 44 | 32 | 48 | 44 |
| July | 93 | 87 | 60 | 39 | 28 | 17 | 49 | 40 | 53 | 62 |
| August | 135 | 45 | 54 | 69 | 69 | 74 | 45 | 48 | 68 | 97 |
| September | 145 | 100 | 40 | 30 | 44 | 59 | 54 | 76 | 92 | 108 |
| October | 120 | 97 | 39 | 71 | 50 | 62 | 51 | 48 | 120 | 161 |
| November | 131 | 88 | 42 | 69 | 54 | 67 | 44 | 51 | 131 | 112 |
| December | 121 | 47 | 32 | 44 | 120 | 171 | 67 | 88 | 110 | 131 |
Figure 3.
Trend of monthly minimum temperature of Akure from 2003 to 2012.
Figure 3.
Trend of monthly minimum temperature of Akure from 2003 to 2012.
Figure 4.
Trend of monthly maximum temperature of Akure from 2003 to 2012.
Figure 4.
Trend of monthly maximum temperature of Akure from 2003 to 2012.
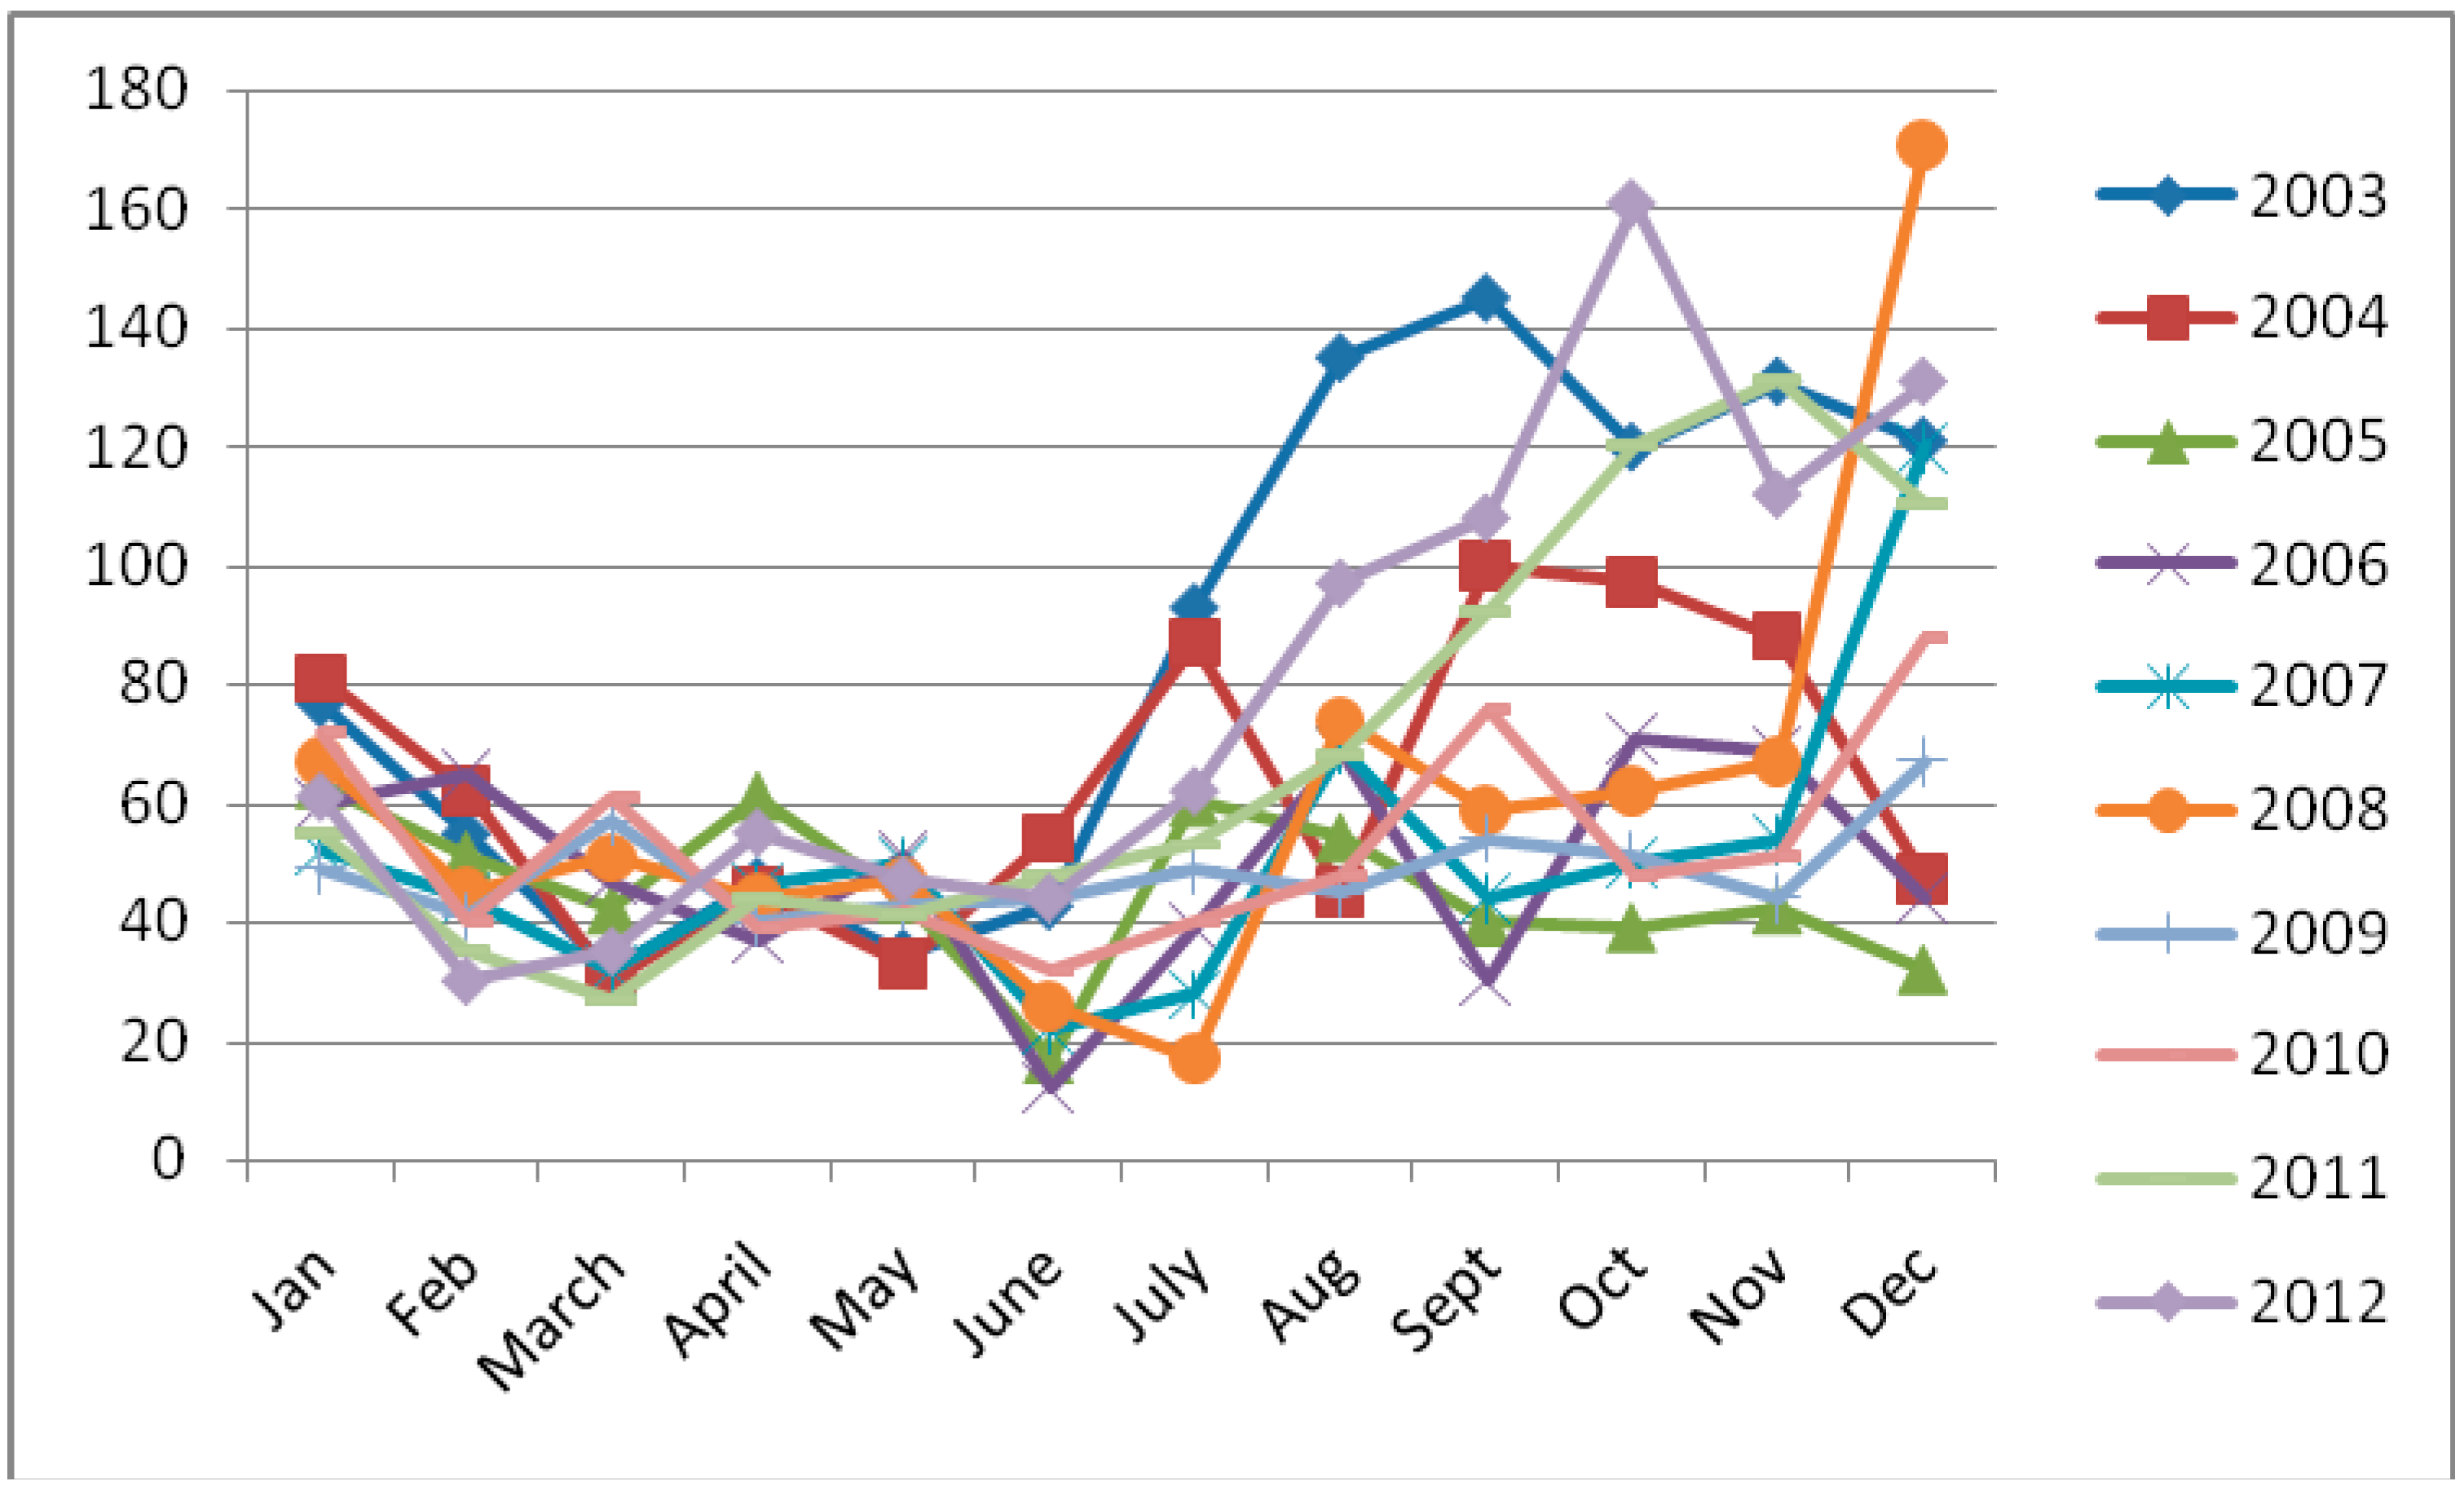
The effect of increased monthly temperature observed in 2008 on the incidence of heat-rash rose to 174 patients in December (
Figure 5). Meanwhile, the result did reveal that the incidence of heat-rash recorded between June and July in the same year was low due to impact rainfall. It was also observed that heat-rash has significant increase during September in 2003 and 2004; while similar trend was equally observed during December, November and October in 2007, 2011, and 2012 respectively. This study shows that apart from the high record of heat-rash in the last four months of the year, the increased activities of high temperature in September, October, November and December were also on increase. However, another major observation revealed high level of heat-rash occurrence in October but dropped low in December 2012.
Figure 5.
Monthly Incidence of heat-rash in Akure from 2003 to 2012.
Figure 5.
Monthly Incidence of heat-rash in Akure from 2003 to 2012.
Table 4.
Calculated Mean value for temperature, rainfall and heat-rash.
Table 4.
Calculated Mean value for temperature, rainfall and heat-rash.
| Month | Temperature (°C) | Rainfall (mm) | Heat-rash |
|---|
| January | 33.1 | 142.6 | 80.3 |
| February | 32.8 | 139.5 | 90.2 |
| March | 32.3 | 147.3 | 62.2 |
| April | 30.8 | 146.9 | 62.6 |
| May | 31.0 | 147.9 | 56.9 |
| June | 29.9 | 148.4 | 50.4 |
| July | 27.8 | 155.6 | 53.3 |
| August | 31.9 | 148.9 | 50.1 |
| September | 30.4 | 149.4 | 48.8 |
| October | 30.1 | 151.1 | 52.7 |
| November | 32.2 | 148.4 | 60.3 |
| December | 32.3 | 140.1 | 68.2 |
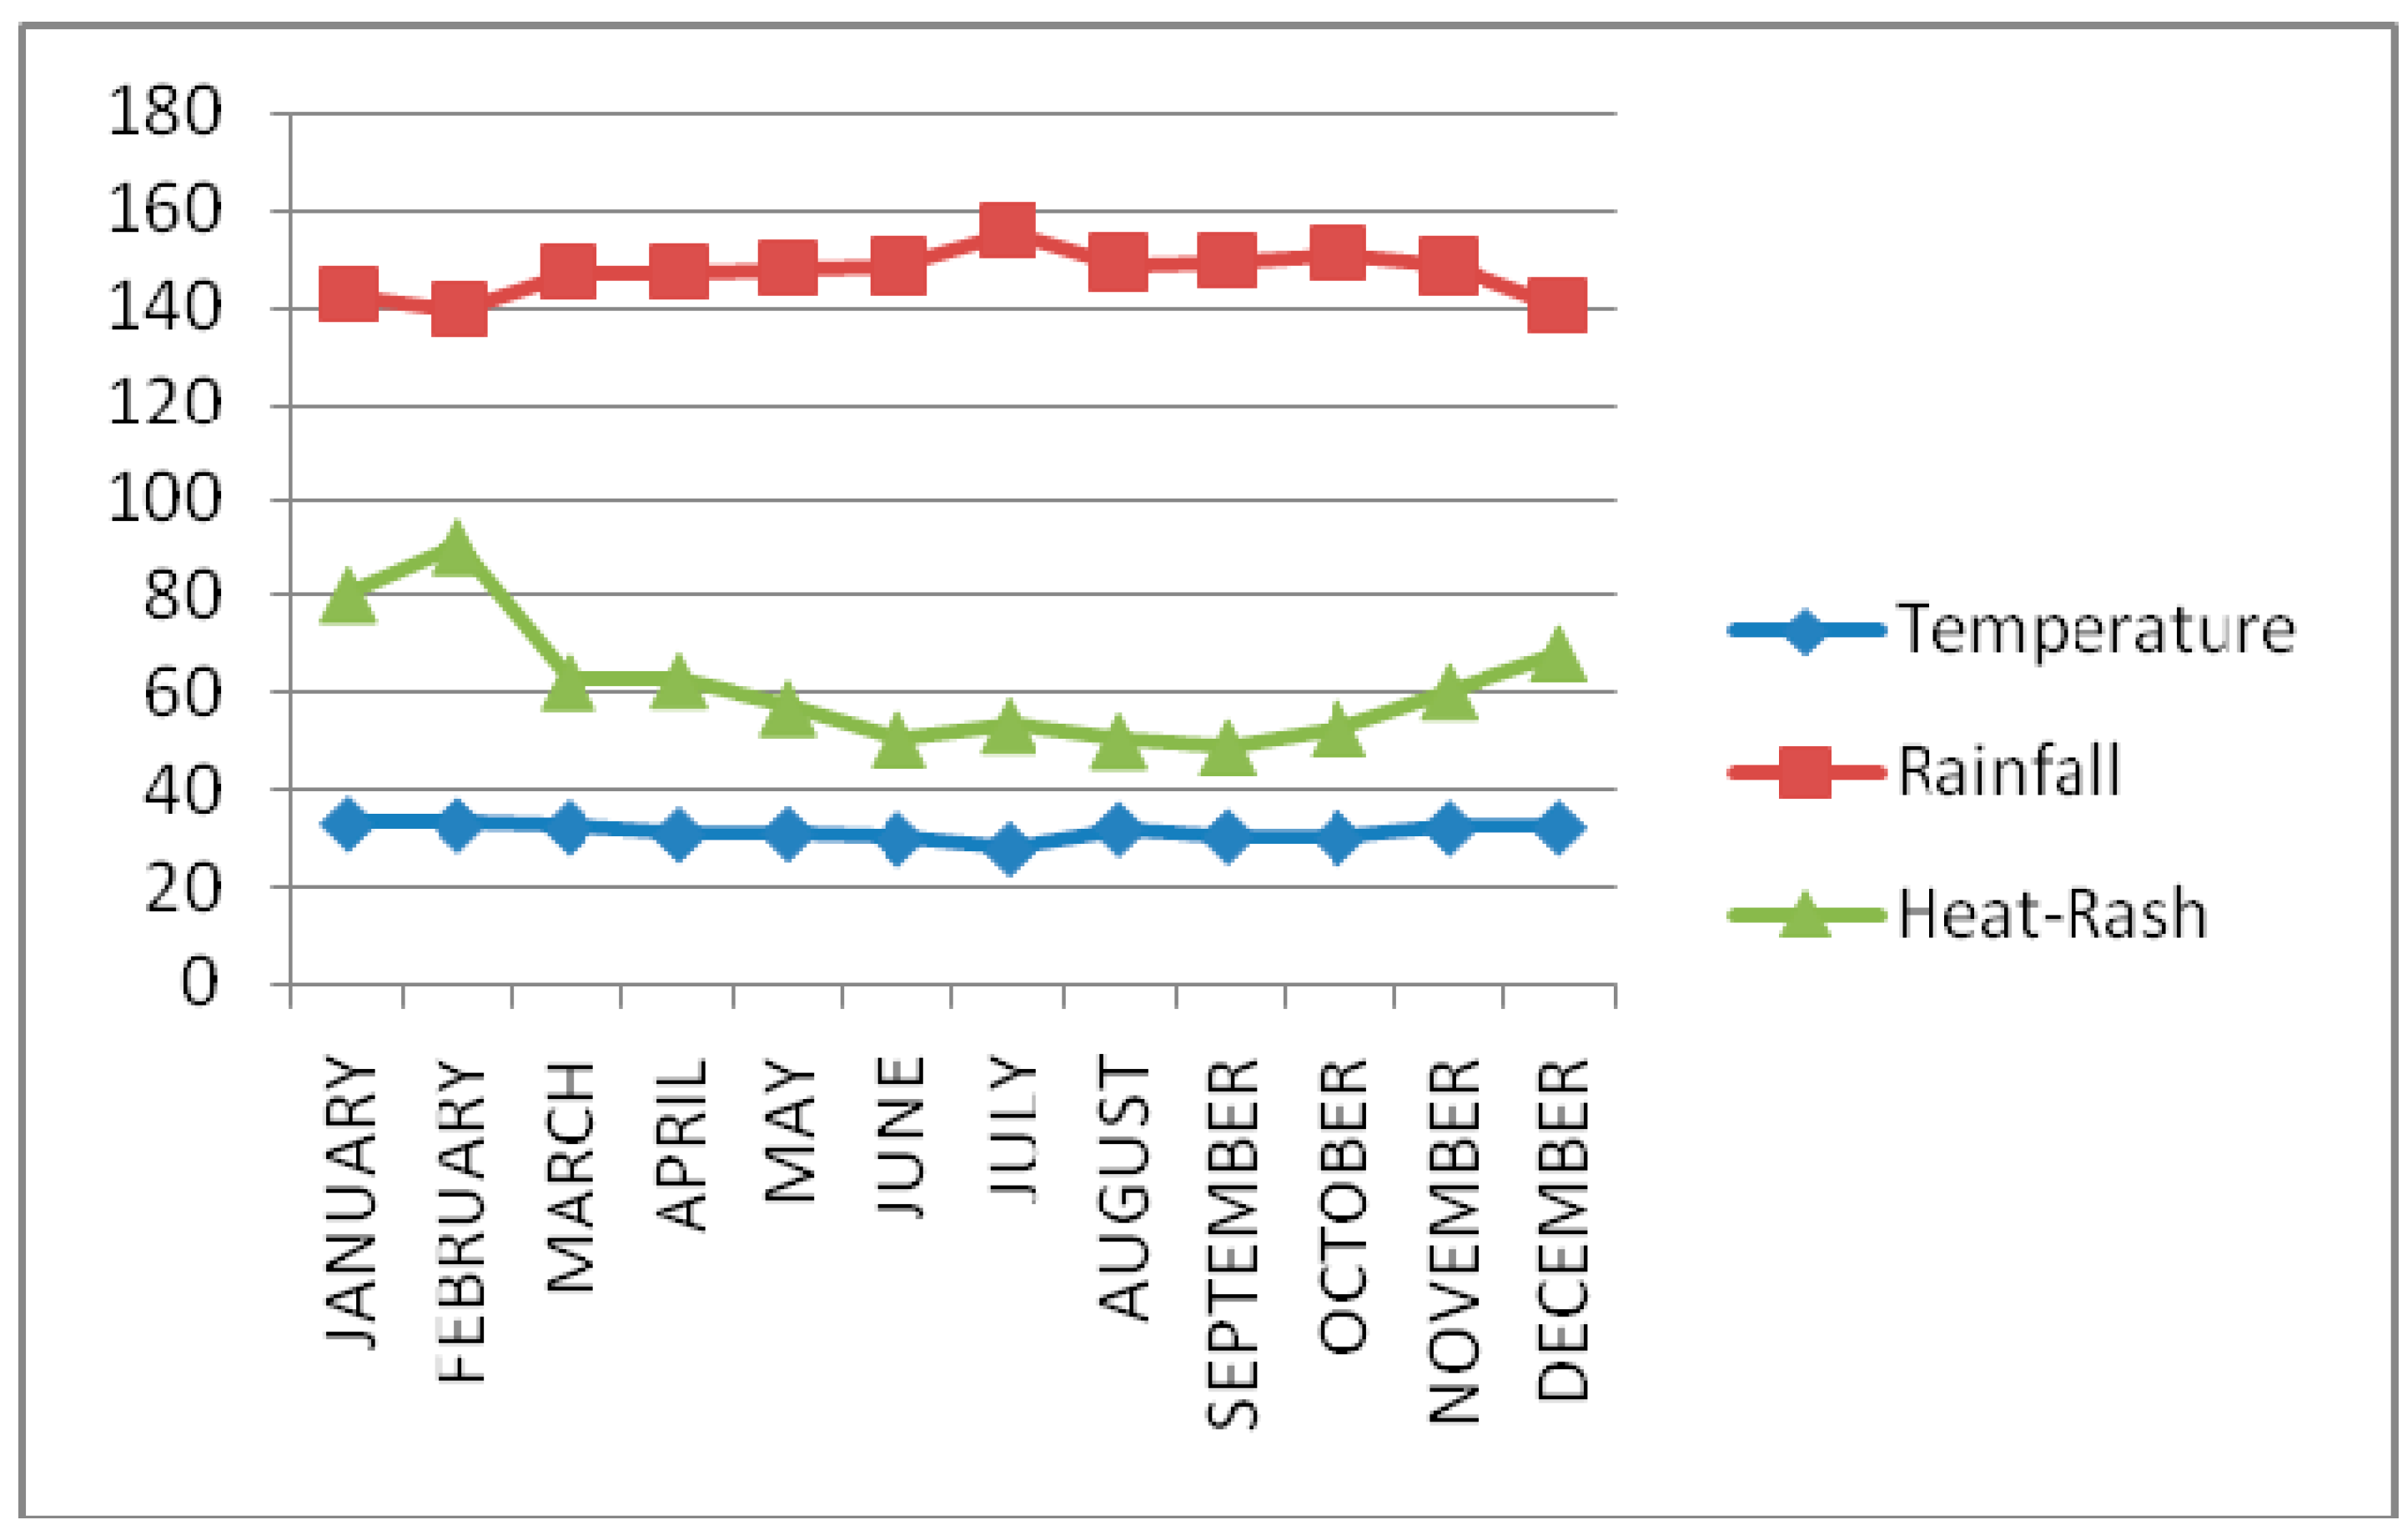
Figure 6.
Graph showing trend of temperature, rainfall and heat-rash.
Figure 6.
Graph showing trend of temperature, rainfall and heat-rash.
The general mean values computed for the temperature, rainfall and incidence of heat-rash data were presented in
Table 4 and
Figure 6. The study observed that the three variables have direct influence on each other. For instance, the impact of low rainfall between January and April, November and October induced high temperature level in the months. To this, [
17] opined that studies do not attribute large variations in mortality to extreme events, but rather to the normal seasonal changes in weather. It was further observed that the mean values for the heat-rash between 60.3 and 90.2 present January, February, March, April, November and December as the prominent months; while May, June, July, August, September and October were with reduced impact with mean values ranged between 48.8 and 56.9.
This assertion could be supported with the fact that most rains received in the years are within May and October, which serve as cooling factor that reduce intense influence of increased temperature. According to [
26,
27,
28], it appears that hot weather extremes have a more substantial impact than cold, and many “heat stress” indices have been developed to assess the degree of impact.
5.3. Relationship between Monthly Temperature and Heat-Rash
Correlation analysis was carried out for incidence of heat-rash and heat data representing monthly temperature between the period of 2003 and 2012, which indicate intra and inter-relationships among the variables.
Table 5 shows that out of 260 pairs in correlation matrix, 88 pairs showed significant relationships among the incidence of heat-rash and temperature data respectively.
The result of this analysis indicates positive significant relationships among the data on temperature during the month of January with February (0.95), March (0.67), April (0.65), July (0.67), August (0.87), September (0.74), and December (0.86) within the period of the study. Considering this relationship, it shows that the monthly temperature has direct influence on other months of the year. This situation, to some extent, reflects how important the influence of temperature in support of human comfort is. For instance, it has been observed that eight (8) months in the year have positive influence on incidence of heat-rash in January. The reason for this may not be disconnected from the fact that January period is usually dry and reflects hot temperature that stimulates unhealthy influence on human body. Though, the correlation analysis indicates that January heat-rash has significant relationship with the temperature in July (0.71), this does not defile the fact that July is a major wettest month of the year, which also serves as major factor that regulates excess heat throughout the year.
Unlike the case of January where the relationship between the temperature and the incidence of heat-rash are only positive but not significant, February temperature has significant impact on the incidence of heat-rash in the month. Aside this, March (0.66), April (0.66), August (0.84), September (0.86) and December (0.81) have significant relationship with February temperature. The prevailing heat condition observed in February is associated with the incidence of heat-rash that was likely to repeat itself in May, July, August, September, and December.
As revealed in
Table 5, heat situation in March, April, August, October and December are significantly correlated but has negative influence on incidence of heat-rash in May (−0.03) and June (−0.08). This depicts that the influence of temperature on incidence of heat-rash during this period was not detrimental to human health.
In addition, the observed temperature in April show negative relationship with occurrence of heat-rash in May, June, July, September, and October. This is more so with the fact that April is believed as the major seasonal boundary between dry and wet season of the study area. During the month of April, there is always a reduced impact of hot temperature that produces harsh weather in the previous months of the year. An activity of heat-rash looks similar during the month of May and June. For instance, most of the months with significant influence on May are equally significant to June heat-rash. Such months include, July (0.94), August (0.76), September (0.79), October (0.81), November (0.82) and December (0.77). The exception is observed where the May temperature has a negative influence on October but has significant relationship with the heat-rash of the month. This observation reflects major fact that established the early and latter rainfall and its influence on cold and heat generation. Rainfall is somehow increasing in May and its latter impact is observed in October with drastic influence on temperature. This suggests that the prevailing cold weather will prevent hot temperature between May and October. By this, heat-rash usually reduces during the raining months in the study area.
In relation to the impact of temperature on heat-rash, result from the correlation analysis in
Table 5 further shows that June temperature (−0.45) does not influence incidence of the skin-disease in the study area. However, the study indicates that the June temperature has significant relationship with October (0.79) and December (0.64), but, incidence of rash is similar to July (0.91), August (0.84), September (0.68), October (0.72) November (0.66) and December (0.64).
The case of heat-rash in July and August looks similar as both are significantly related with September, October, November and December. In terms of heat influence, temperature in July reduces while it increases in October. It was observed that every other month in the year is being influenced by July because of the cooling impact of this month where major rain of the year is experienced.
Table 5.
Correlation analysis showing relationship between temperature and heat-rash.
Table 5.
Correlation analysis showing relationship between temperature and heat-rash.
| Variable | Jantemp | Janrash | Febtemp | Febrash | Martemp | Marrash | Apriltemp | Aprilrash | Maytemp | Mayrash | Junetemp | Junerash | Julytemp | Julyrash | Augtemp | Augrash | Septemp | Seprash | Octtemp | Octrash | Novtemp | Novrash | Dectemp | Decrash | |
|---|
| Jantemp | 1 | | | | | | | | | | | | | | | | | | | | | | | | |
| Janrash | 0.49 | 1 | | | | | | | | | | | | | | | | | | | | | | | |
| Febtemp | 0.95 ** | 0.51 | 1 | | | | | | | | | | | | | | | | | | | | | | |
| Febrash | 0.86 ** | 0.62 | 0.83 ** | 1 | | | | | | | | | | | | | | | | | | | | | |
| Martemp | 0.67 * | 0.43 | 0.66 * | 0.49 | 1 | | | | | | | | | | | | | | | | | | | | |
| Marrash | 0.51 | 0.83 ** | 0.54 | 0.59 | 0.31 | 1 | | | | | | | | | | | | | | | | | | | |
| Aptemp | 0.65 * | −0.03 | 0.66 * | 0.47 | 0.73 * | −0.09 | 1 | | | | | | | | | | | | | | | | | | |
| Aprash | 0.35 | 0.42 | 0.31 | 0.67* | 0.01 | 0.17 | −0.00 | 1 | | | | | | | | | | | | | | | | | |
| Mtemp | 0.51 | -0.09 | 0.46 | 0.64* | 0.43 | −0.06 | 0.73 * | 0.36 | 1 | | | | | | | | | | | | | | | | |
| Mrash | −0.04 | 0.65 * | 0.02 | 0.14 | −0.03 | 0.71 * | −0.40 | −0.07 | −0.32 | 1 | | | | | | | | | | | | | | | |
| Jutemp | 0.42 | −0.05 | 0.40 | 0.44 | 0.46 | −0.31 | 0.69 * | 0.46 | 0.69 * | −0.48 | 1 | | | | | | | | | | | | | | |
| Jurash | −0.16 | 0.58 | −0.17 | 0.02 | −0.08 | 0.44 | −0.40 | −0.04 | −0.36 | 0.88 ** | −0.45 | 1 | | | | | | | | | | | | | |
| Jlytemp | 0.67 * | 0.73 * | 0.63 | 0.79 ** | 0.24 | 0.73 * | 0.12 | 0.48 | 0.22 | 0.41 | −0.13 | 0.37 | 1 | | | | | | | | | | | | |
| Jlyrash | 0.04 | 0.71* | 0.12 | 0.19 | 0.05 | 0.66 * | −0.23 | −0.06 | −0.29 | 0.94 ** | −0.40 | 0.91 ** | 0.49 | 1 | | | | | | | | | | | |
| Autemp | 0.87 ** | 0.49 | 0.84 ** | 0.83 ** | 0.66 * | 0.59 | 0.68 * | 0.22 | 0.61 | 0.06 | 0.32 | −0.09 | 0.68 * | 0.16 | 1 | | | | | | | | | | |
| Aurash | 0.03 | 0.73* | 0.07 | 0.14 | 0.13 | 0.49 | −0.13 | 0.00 | −0.33 | 0.76 * | −0.20 | 0.84 ** | 0.38 | 0.90 ** | 0.15 | 1 | | | | | | | | | |
| Septemp | 0.74 * | 0.53 | 0.86 ** | 0.69 * | 0.61 | 0.54 | 0.68 * | 0.11 | 0.41 | 0.23 | 0.34 | 0.04 | 0.55 | 0.39 | 0.81 ** | 0.37 | 1 | | | | | | | | |
| Seprash | 0.25 | 0.69* | 0.22 | 0.39 | 0.26 | 0.74 * | −0.02 | −0.00 | 0.04 | 0.79 ** | −0.15 | 0.68 * | 0.47 | 0.78 ** | 0.48 | 0.76 * | 0.44 | 1 | | | | | | | |
| Octemp | 0.51 | 0.05 | 0.59 | 0.49 | 0.71 * | 0.02 | 0.77 ** | 0.23 | 0.72 * | −0.30 | 0.79 ** | −0.49 | −0.05 | −0.29 | 0.52 | −0.24 | 0.58 | −0.02 | 1 | | | | | | |
| Octrash | 0.18 | 0.77 ** | 0.18 | 0.30 | 0.19 | 0.78 ** | −0.14 | −0.01 | −0.19 | 0.81 ** | −0.29 | 0.72* | 0.49 | 0.84 ** | 0.40 | 0.86 ** | 0.42 | 0.95 ** | −0.17 | 1 | | | | | |
| Notemp | 0.57 | 0.10 | 0.49 | 0.61 | 0.36 | 0.24 | 0.39 | 0.44 | 0.62 | −0.24 | 0.62 | −0.49 | 0.10 | −0.37 | 0.55 | −0.35 | 0.29 | 0.16 | 0.66 * | −0.01 | 1 | | | | |
| Norash | 0.42 | 0.89 ** | 0.49 | 0.53 | 0.29 | 0.90 ** | −0.03 | 0.14 | −0.13 | 0.82 ** | −0.24 | 0.66 * | 0.72 * | 0.88 ** | 0.526 | 0.79 ** | 0.65 * | 0.83 ** | −0.03 | 0.89 ** | −0.00 | 1 | | | |
| Dectemp | 0.86 ** | 0.31 | 0.81 ** | 0.77 ** | 0.78 ** | 0.24 | 0.76 * | 0.37 | 0.73 * | −0.18 | 0.73 * | −0.28 | 0.33 | −0.16 | 0.73 * | −0.13 | 0.61 | 0.16 | 0.79 ** | −0.01 | 0.74 * | 0.16 | 1 | | |
| Decrash | 0.39 | 0.95 ** | 0.47 | 0.55 | 0.33 | 0.85 ** | −0.03 | 0.28 | −0.11 | 0.77 ** | −0.12 | 0.64 * | 0.68 * | 0.84 ** | 0.48 | 0.82 ** | 0.63 | 0.78 ** | 0.05 | 0.86 ** | 0.02 | 0.97 ** | 0.19 | 1 | 1 |


