Technical Note

Small and Medium-Sized Enterprises Climate Accounting Made Easy

by
Hans Sanderson
1,*,
Mariana Costa Moreira Maia
1,
Frank Akowuge Dugasseh
1,
Delove Abraham Asiedu
1 and
Annabeth Aagaard
2
1
Department of Environmental Science, Aarhus University, 399 Frederiksborgvej, 4000 Roskilde, Denmark
2
Department of Management, Aarhus BSS, Aarhus University, Fuglesangs Allé 4, 8210 Aarhus V, Denmark
*
Author to whom correspondence should be addressed.
Climate 2026, 14(1), 26; https://doi.org/10.3390/cli14010026
Submission received: 19 December 2025 / Revised: 13 January 2026 / Accepted: 19 January 2026 / Published: 21 January 2026

Abstract

The European Union’s decarbonization strategy relies on transparent and accurate climate data across value chains. Yet, existing sustainability reporting frameworks mainly target large companies, often neglecting small and medium-sized enterprises (SMEs). Although SMEs are largely exempt from mandatory reporting under recent regulatory simplifications, they play a critical role in Scope 3 emissions, which dominate the carbon footprints of larger firms. This paper presents two complementary, freely accessible digital tools designed to support credible carbon accounting. The first tool, Climate Compass, is a government-sanctioned tool that aligns with the GHG Protocol and has been used by >10,000 SMEs in Denmark to calculate Scopes 1, 2, and 3 emissions through a user-friendly interface. The second, a newly developed online cradle-to-gate life cycle assessment (LCA) tool, supports product-level carbon footprinting using open-source emission factor databases. The cradle-to-gate approach reflects typical SME production profiles and emphasizes embodied CO2e from raw materials, transport, and energy consumption. Together, these tools enable researchers to effectively assess SMEs emissions in the value chain and thus support decarbonization while supplying reliable data to larger companies. The tool democratizes emissions analysis and supports regulatory and market demands and strengthens SMEs contribution to Europe’s low-carbon transition.

1. Introduction

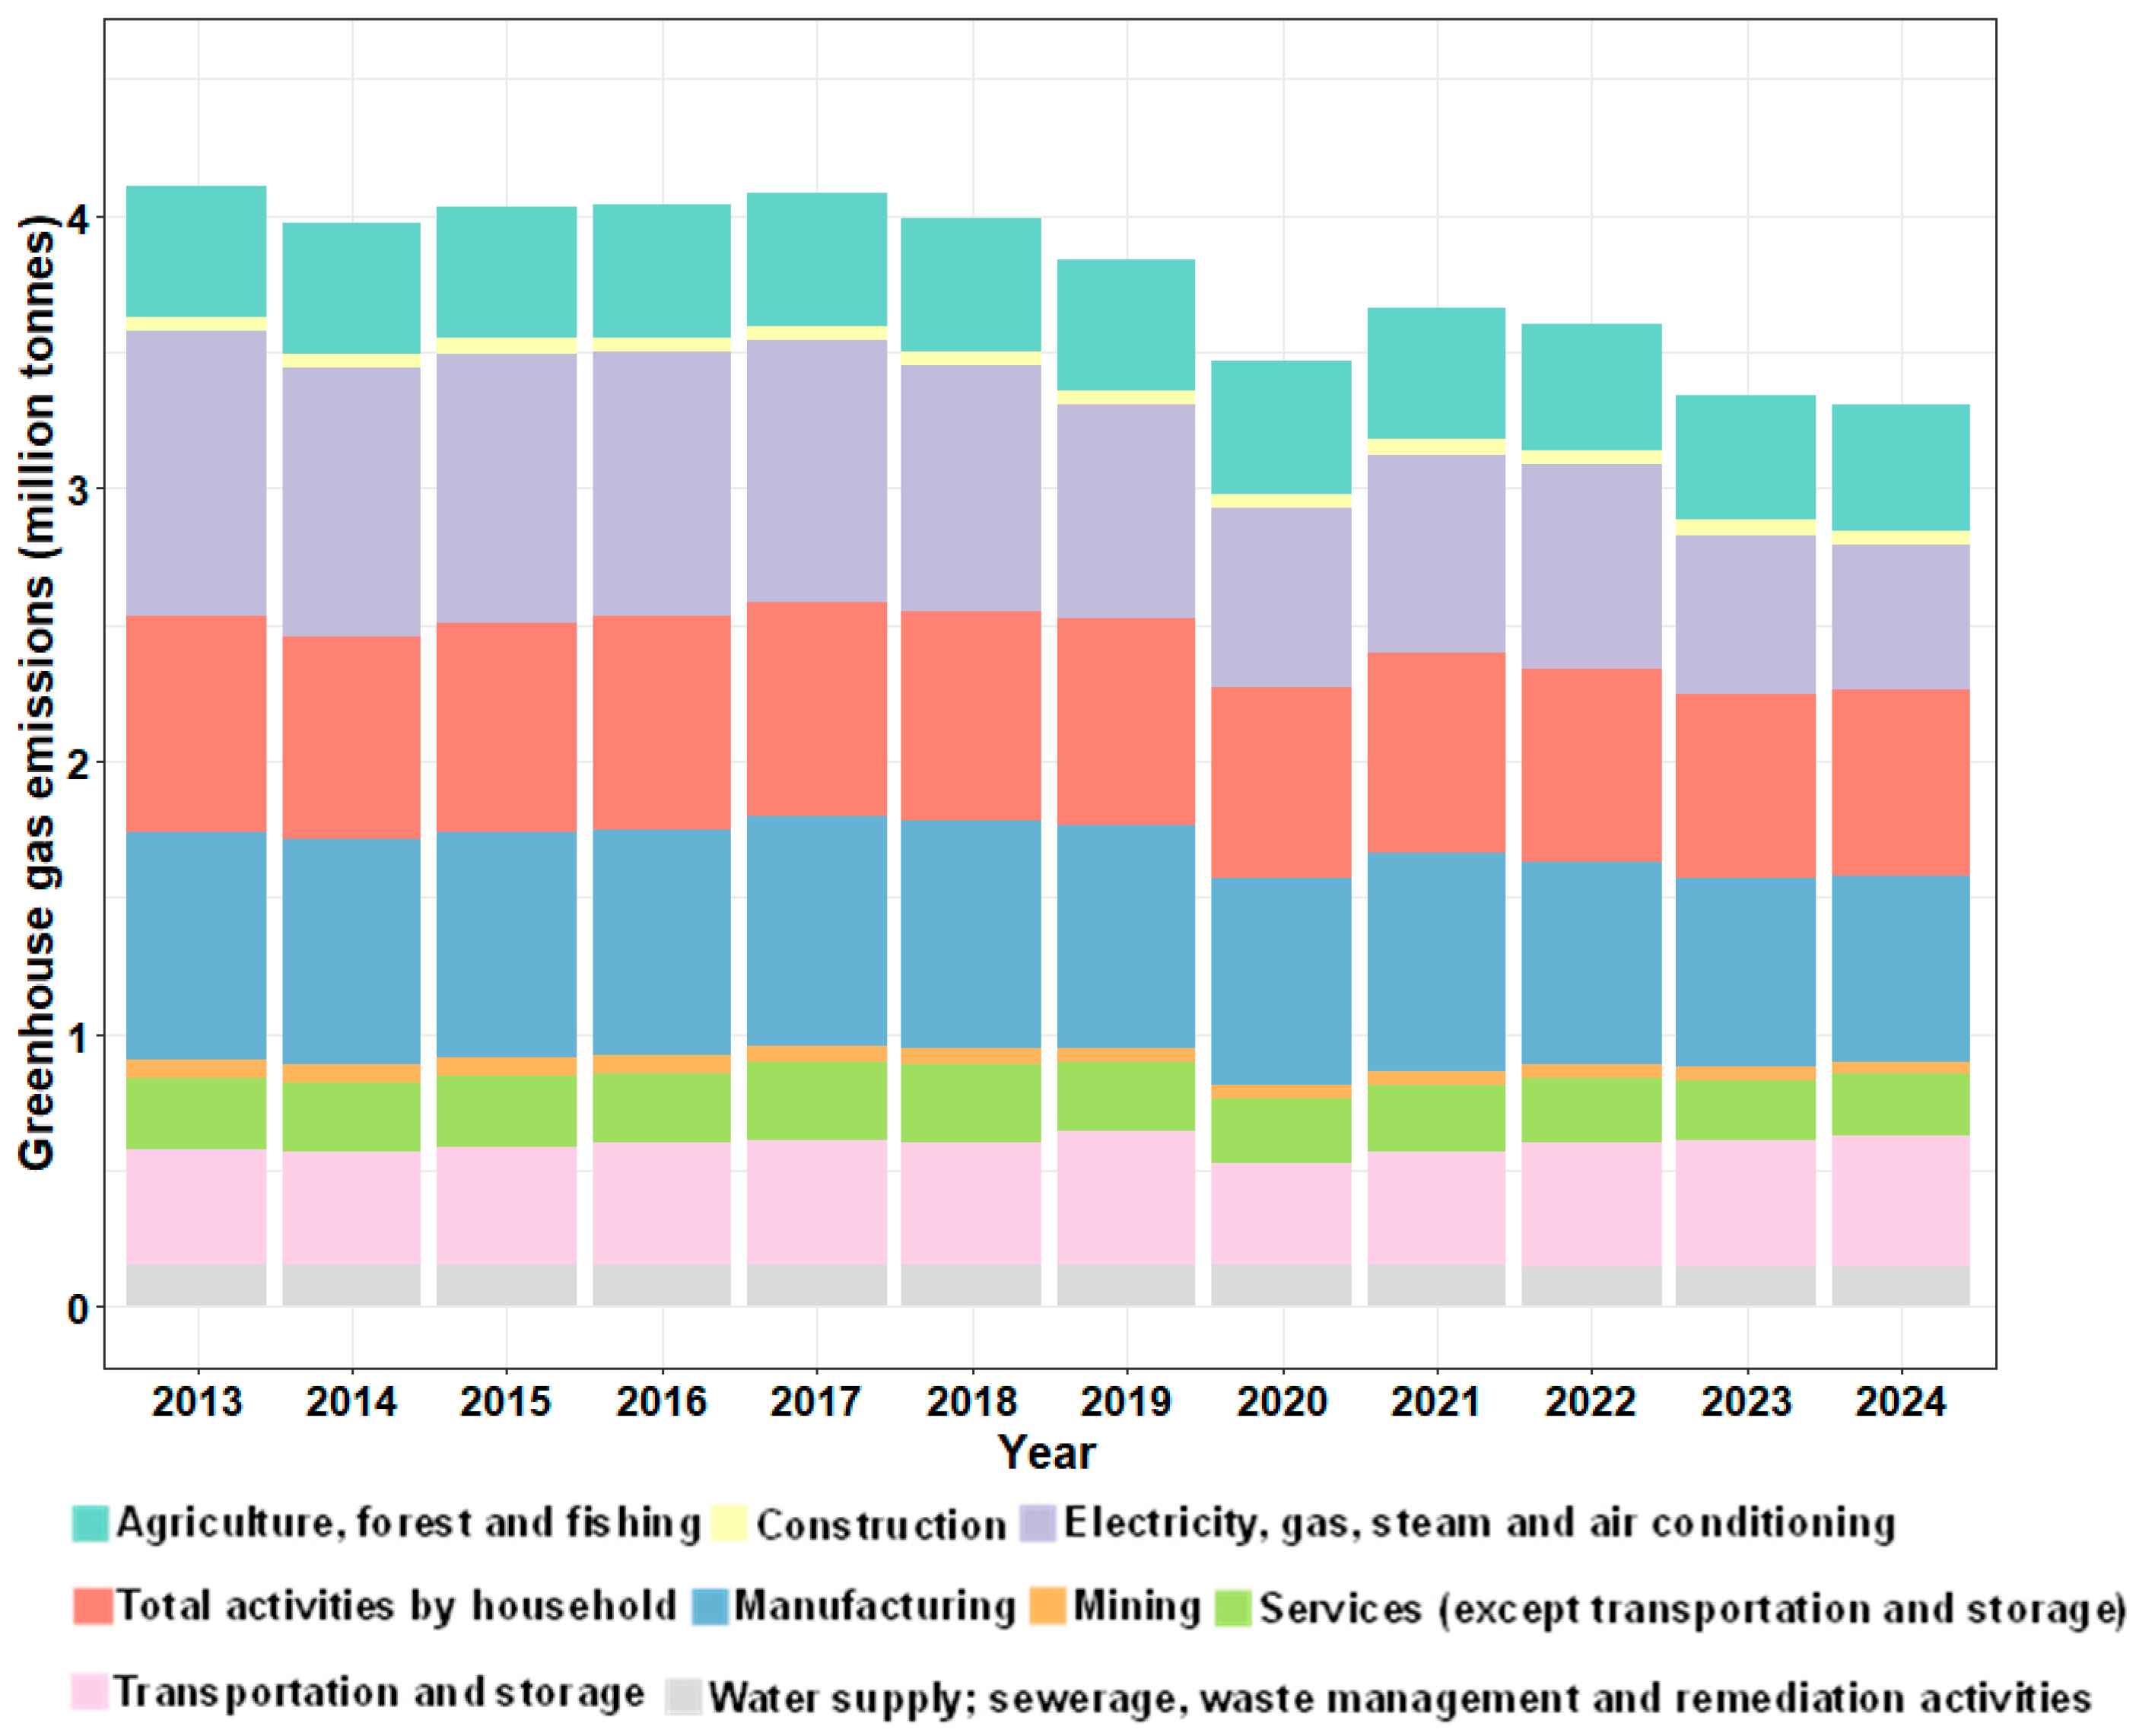
There is a need to decarbonize the European economy, which is underscored by the Green Deal and the Clean Industrial Deal of the European Union (EU) [1]. In 2024, manufacturing, accounted for a significant part (approximately 21%) of the total Greenhouse gas (GHG) emissions in the EU (27), with 0.688 million tonnes of CO2e emitted (Figure 1) [2].
One of the objectives of the European Green Deal and the Clean Industrial Deal is to promote long-termism in finance and support investments targeted at reducing CO2e emission and transitional climate risks [3]. For this to work, transparency regarding climate risk information for investors is required under the EU Taxonomy Regulation [4]. The taxonomy requires quantitative data and metrics, which are provided by the Corporate Sustainability Reporting Directive (CSRD) [5]. The focus of the taxonomy and the CSRD is on large-listed enterprises, where financial risks are most significant for investors. Small and medium-sized enterprises (SMEs) had a simpler Voluntary Sustainability Reporting Standard (VSME). The VSME was developed and submitted to public consultation in 2024 [6]. The highlight of the public consultation was the general need for additional digital tools, a simplified structure and language, and guidance on the actual reporting [7]. The EU has, in response, revised the sustainability and climate reporting requirements through the omnibus regulation, which simplifies the reporting requirements first proposed in the CSRD, in particular, for SMEs with less than 1000 employees [8]. The objective of the simplification is to reduce the administrative burden. The CSRD reporting addresses the full Environmental, Social and Governance (ESG) aspects, with climate and CO2e emissions among the parameters under Environment. While the omnibus regulation excludes reporting requirements for SMEs, the EU’s continued commitment to decarbonize its economy underscores the importance of holistically addressing CO2e across the value chain [9].
SMEs represent over 99% of all companies in the EU and account for approximately 30% of CO2 emissions from manufactured products based on output weight [10,11]. Overall, SMEs account for more than 63% of corporate CO2 emissions in the EU [12]. Also, most CO2e emissions from large companies, particularly Scope 3.1 emissions under the GHG Protocol [13], originate in their supply chains, which largely comprise SMEs exempt from emission reporting requirements [12]. According to Business House Zealand, less than 10% of SMEs in Denmark currently document their climate footprint [14]. The low level of reporting was attributed to challenges in obtaining an overview of the legislation and requirements tailored to their specific industry and unique operations.
Given the large share of SMEs in the EU economy and the significant dependence of large companies on SMEs in their supply chains, achieving EU emission targets would require a substantial reduction in CO2e emissions by SMEs [12]. As an essential step towards reducing emissions, SMEs must be able to measure, calculate, verify and report their emission [15]. This emission data can subsequently be shared with larger companies for their value chain emission accounting.
The aim of this technical note is to present two digital tools designed to support SMEs, consultants and researchers working with companies in assessing carbon footprints in accordance with the GHG Protocol. This addresses stakeholder feedback during the public consultation on the VSME, particularly the need for complementary digital tools, clearer guidance on sustainable reporting and a reduction in excessive data requests, such as full life cycle assessment (LCA), often imposed on SMEs by large companies. While various commercial services are available for this purpose [16], we highlight the only currently freely accessible, government-sanctioned digital tool that enables comprehensive GHG accounting for SMEs across the Scope 1 (direct), Scope 2 (indirect) and Scope 3 (total value chain) in accordance with the GHG Protocol. Additionally, we provide a free-of-charge, user-friendly online cradle-to-gate LCA tool we developed for SMEs to support value-chain discussion of embodied CO2e [9]. These two online tools combined address the needs for guidance and online tools highlighted during the VSME consultation.

2. Technical Approach

In 2024, we conducted a series of case studies involving 25 SMEs in Denmark as part of the ESG project [17] to assess their needs for reducing CO2e emissions. The first conclusion of these case studies was, of course, that if they cannot measure their emissions, they cannot manage them. To address this challenge, we used the digital tool Climate Compass (Klima kompasset), provided by the Danish government [18], to assess the CO2e emissions of SMEs in accordance with the GHG Protocol. We further developed a user-friendly digital cradle-to-gate LCA tool, ESG-Cradle to Gate, specifically designed to calculate product-specific carbon footprints for SMEs [19]. Through hands-on guidance, these tools enabled the participating SMEs to establish reliable emission inventories and identify priority areas for reduction.
This technical note highlights the two tools to support other SMEs, consultants and researchers engaged in CO2e mitigation efforts. In the following sections, we provide a detailed overview of the two freely accessible online tools. First, we describe ESG-Gradle to Gate [19], detailing its design process, functionality and practical application for calculating CO2e emissions. We then describe the application of the freely accessible, government-sanctioned digital tool for comprehensive GHG accounting under the GHG Protocol’s Scope 1, Scope 2, and Scope 3. By making these robust yet accessible tools widely known, we aim to accelerate the adoption of emission measurement among SMEs, a critical step towards sustainability and competitiveness.

2.1. Description of ESG-Cradle to Gate

There are different methods for assessing the carbon footprint and global warming potential of products based on LCA [12,20]. SMEs largely produce elements and components that are parts of larger products assembled by larger companies. These consist of relatively few raw materials and a negligible in-use or end-of-life carbon footprint when the products are recycled. The majority of emissions stem from the cradle-to-gate phase of the product’s life cycle.
A cradle-to-gate life-cycle model is a partial LCA approach that assesses the environmental footprint of a product until it leaves the factory [21]. It covers the raw material acquisition, production, and transportation stages, but does not account for the emission factors of the product used by consumers and its end-of-life (i.e., waste, recycling and upcycling) [21,22]. The cradle-to-gate model is based on the LCA framework defined in ISO 14040 and ISO 14044, which includes defining the goals and scope, gathering inventory data, determining environmental impacts, and interpreting emission results [22].
We therefore developed ESG-Cradle to Gate for SMEs that manufacture relatively simple elements and products using fewer raw materials. The tool provides a reliable and freely accessible database that enables SMEs to calculate and report their CO2e emissions. Adoption of the tools will support SMEs in reducing their emissions and associated environmental impacts, as well as manufacturing costs, through the selection of alternative raw materials, optimization of production processes, retooling and comprehensive review of operational practices [23]. In addition, it will facilitate GHG emission accounting for larger companies by providing readily accessible, supply-specific carbon footprint data.

2.2. Emission Factor Data for ESG-Cradle to Gate

We used emission factors from different open-source databases, including the Climate Compass database [18], AUS LCI [24] and Climatiq [25]. We used these databases to extract curated values for the ESG-Cradle to Gate database. Data from the curated databases include metadata and detailed documentation. We also included non-curated data for non-essential materials [26]. However, non-curated data were included to address data gaps for non-essential materials, as well as new or emerging products.
ESG Cradle to Gate, contains 622 precise and accurate emission factors derived from the databases [18,24,25]. Notably, the emission factors from Climate Compass are continuously expanded and updated by the Danish Energy Agency. The curated dataset primarily provides the essential data for SME’s, including information on plastics, metals, building materials, chemicals, cardboard, and glass. In addition to the curated data, we used 4378 non-curated data from open-source databases, including BONSAI [27]. This includes emission factors across different categories, such as food production and mined minerals, that are missing from the curated database.

2.3. Application of ESG-Cradle to Gate

To use ESG Cradle to Gate, users must first create an account or log in with their company’s credentials and then select the relevant product type. The tool is structured into three input panels: (1) materials, (2) transportation and (3) processing.

2.3.1. Materials Panel of ESG-Cradle to Gate

This panel address the upstream raw materials needed to produce a product. Users are required to select the specific raw materials, the quantity used for the product and the associated emission factor. Supplier-specific emissions factors should be used wherever available, as they provide the highest data quality and specificity in accordance with ISO14044 data quality and the requirements of the Greenhouse Gas Protocol. If supplier-specific emission factors are unavailable, the tool provides default emission factor values based on the raw material type.

2.3.2. Transportation Panel of ESG-Cradle to Gate

This panel captures transportation processes with the cradle-to-gate scope of the product system. Users must enter the transportation mode(s) and the transport distance associated with the delivery of raw materials and intermediate goods. Only transportation activities that are paid for and controlled by the user should be included in this panel. Again, supplier-specific emissions data is preferred; otherwise, the tool has default average emission values based on data from the Department for Environment, Food and Rural Affairs (DEFRA, UK) [28].

2.3.3. Energy Panel of ESG-Cradle to Gate

This panel addresses the manufacturing and conversion process within the user’s operational boundary. Users are required to enter the energy consumed during the conversion of raw materials into the final product. The energy used is expressed as kilowatt-hours (kWh). The energy consumed should be measured directly from production equipment, where available. If direct energy measurements are not available, energy consumption may be estimated using an allocation approach based on the product’s share of sales. Users are also required to provide the associated emission factor per kWh from their utility provider. If site-specific emission factors are unavailable, users may obtain default values from Climate Compass [18]. If the SME does not have a direct measurement, they should use the company’s total Scope 1 and Scope 2 emissions (e.g., using the Climate Compass Mini Calculator) and assign the corresponding percentage of this to the product’s total economic sale. For instance, if the product represents 10% of the total sales, then it is assigned 10% of the total Scope 1 and 2 emissions.
The incorporation of this stepwise approach into the ESG-Cradle to Gate would enable SMEs to estimate their products’ carbon footprints.

2.4. Description of Climate Compass (Klima Kompasset)

Most companies follow the GHG Protocol to account for their CO2e emissions. The Climate Compass (klima kompasset) is a freely accessible tool that aligns with the GHG Protocol [13,25]. It contains a database with CO2 emission factors and a user-friendly web-based interface that enables companies to obtain a comprehensive overview of their GHG emissions under scopes 1, 2, and 3, as defined by the GHG Protocol. The results provide insights that help companies identify emission hotspots and develop strategies to reduce their overall carbon footprint. The tool is developed and maintained by the Danish Business Authority in cooperation with the Danish Energy Agency, which collects, estimates and documents the emission factors used. Climate Compass is the only government-developed and maintained free tool available in the EU. It has been used by more than 10,000 primarily SMEs in Denmark over the years [29]. The tool generates a full carbon report based on the input data in accordance with the GHG-Protocol.
Since Climate Compass is a voluntary tool rather than a reporting system, the results generated depend on the objectives and ambitions defined by the end user. For most companies, a carbon footprint is calculated using two types of data: activity data and emission factors. Activity data refers to the company’s activities, e.g., how many kWh of electricity the company has consumed or how much money the company has spent on purchasing items. Activity data must then be multiplied by emission factors to estimate the amount of CO2e emitted based on the activity—this can be obtained from the supplier via a default value from the emission factor database in the tool. Emissions can be calculated in two ways: (1) using the Climate Compass Mini calculator, which allows for simplified calculations across only scopes 1 and 2 without requiring login, or (2) accessing the full Climate Compass platform through login.

2.5. Application of Climate Compass Mini Calculator

The Mini calculator covers only scopes 1 and 2 and focuses on five critical company activities: electricity, district heating, fuels, process emissions and transport from owned and leased vehicles. Users can enter data directly into the relevant fields and the tool automatically calculates total emissions in tonnes of CO2e. The calculator uses the latest available emission factors (2023) and aligns with the VSME framework. By streamlining carbon footprint calculations, the Mini calculator enhances the accessibility and efficiency of sustainable reporting for SMEs. The Mini calculator is also useful for the ESG-Cradle to Gate tool.

2.6. Application of Climate Compass Full Calculator

The full Climate Compass platform covers activities across scopes 1, 2 and 3, which includes GHG emissions not directly controlled by the company’s value chain. Scopes 1 and 2 include emissions from energy use and industrial processes, such as electricity, district heating, and fossil fuel consumption. It also includes emissions related to purchased goods, materials and services; transportation (including, own and leased transportation, employee transportation, transport of goods to and from the company); waste management and reuse (internally generated waste, handling of waste and internally recycled material); and sold products (including, processing of sold products, use of sold and used leased products, and end-of-life treatment of product). Scope 3 comprises 15 categories and allows users to apply default emission factors from the database or customized emission factors based on company-specific data. Given its extensive scope, the full Climate Compass enables users to calculate and compare climate footprints over multiple years, forecast future emissions and set climate targets for the company. In addition, the platform supports sharing calculations with third parties, provides access to practical guides and inspiration catalogues, and allows users to download emission factors.

3. Results and Discussion

Europe is undergoing a twin transition in which digital technologies are being exploited to empower citizens and businesses to drive the shift towards reducing climate transition risks [9], sustainability, and climate neutrality [30]. A key component of this transition is the availability of practical digital tools that empower all actors in the value chain, including both large corporations and SMEs, to reduce their GHG emissions, thereby contributing to Europe’s decarbonization ambitions. The adoption of commercial tools for CO2e accounting by both large companies and SMEs has already been shown to significantly reduce GHG emissions [12]. However, these commercial tools usually come with a high implementation cost, especially for SMEs [31]. Moreover, the stakeholder feedback received during the public consultation on the VSME highlighted, in particular, the need for complementary digital tools for assessment and reporting.
To address stakeholder feedback during the public consultation on the VSME and enable researcher access to tools to work with SMEs to account for and reduce their GHG footprint, we have provided two user-friendly, freely accessible online tools: (1) ESG-Cradle to Gate and, (2) Climate Compass. Together, the ESG-Cradle to Gate and Climate Compass tool offer SMEs an accessible pathway into credible carbon accounting, which was previously limited by cost, capacity, and complexity.
ESG-Cradle to Gate and Climate Compass are transparent, and standardized digital tools developed to support researchers and SMEs to reliably account for embodied CO2e. By focusing on upstream and core production emissions, these tools support practical carbon management while contributing to the EU’s broader transition towards a low-carbon, competitive, and sustainable economy [1,30]. These tools address several technical and theoretical limitations identified in existing carbon calculators, including poor reference data quality, methodological gaps, poorly defined scopes and boundaries, and a lack of verification through field testing [32]. This was achieved by robust data collection and testing, and by adopting a co-creation approach with SMEs through a living lab model. In contrast to more complex tools [31,33,34,35,36], ESG-Cradle to Gate and Climate Compass prioritized a user-friendly interface and a straightforward calculation approach. This design significantly reduces the time, expertise, and resource burden typically associated with life cycle-based CO2e assessment, barriers that often discourage adoption among SMEs.
There are other carbon footprint calculation tools developed for particular sectors such as agri-food systems [31], construction [32], tourism [33], and foundries [37]. While these tools may be necessary for unique sector requirements or uncertain contributions, as observed in the digital industry, they often lead to increased costs, data incompatibility, fragmented reporting, and weaker cross-sector insights [38]. The ESG-Cradle to Gate and Climate Compass tools address these challenges by providing a standardized approach that can be used across different sectors. A review of sectors utilizing these tools includes manufacturing, transport, retail, construction, consultancy, agriculture, real estate, finance, culture, and ICT [29]. Notably, manufacturing, transport, and construction sectors that have adopted these tools are among the largest contributors to CO2e emissions in Europe [29].
Climate Compass has been adopted by more than 10,000 users, mostly SMEs in Denmark alone, to calculate and document their CO2e emissions within 2 years of its introduction [29]. This underscores the importance of freely accessible, authoritative digital tools for GHG accounting, especially for SMEs. The adoption of this tool, together with the ESG-Cradle to Gate across Europe, would enable harmonised, voluntary carbon-emissions accounting and reduction practices, thereby supporting the EU Taxonomy and broader sustainability reporting requirements [39]. Adopting these tools would also help standardize information management processes, enabling regular internal audits and technical reviews while strengthening brand positioning through transparent and credible reporting [40].
The integration of verified data alongside broader open-source databases enables the tools to balance accuracy with the flexibility needed to address data gaps, especially for diverse materials and emerging product types. Their alignment with the GHG Protocol and cradle-to-gate LCA ensures methodological robustness, while their simplicity allows SMEs to engage in carbon accounting without specialized expertise or costly commercial systems.

4. Conclusions

Industries contribute significantly to GHG emissions in the EU and SMEs represent 99% of companies. Their ability to decarbonize is impaired by inadequate access to digital tools to account for their emissions, which poses a barrier to achieving EU climate targets. The development and deployment of the Climate Compass and cradle-to-gate LCA tools address these challenges by providing researchers and SMEs with free, user-friendly, and methodologically robust solutions aligned with the GHG Protocol. These tools enable researchers to work with SMEs on their carbon accounting, enabling SMEs to measure, manage, and report emissions effectively while reducing financial and technical burdens. Their adoption by thousands of SMEs demonstrates their practical value and potential to transform supply chain transparency and compliance. Data generated by these tools can also provide insights into SMEs commitment to decarbonization outside Denmark and the EU, as well as allowing SMEs to become front-runners within their sectors.
Future developments include expanding these tools for global applicability and integrating AI-driven features to enhance updating, accuracy, automation, and ease of use. Incorporating multilingual capabilities through large language models would further improve accessibility and internationalization. Global applications would enable the tools to incorporate country-specific emission factors and regional datasets, making them relevant for global supply chains and allowing suppliers outside Europe to meet emerging Scope 3 requirements from EU companies in global value and supply chains [9]. These enhancements and tools would enable researchers to work with SMEs to make their carbon accounting easier and to manage their emissions across their value chain.

Author Contributions

Conceptualization: H.S., A.A. and M.C.M.M.; Methodology, software, validation, formal analysis, investigation, resources, data curation, Writing-original draft preparation, writing-review and editing, visualization: H.S. M.C.M.M.; F.A.D.; D.A.A. and A.A.; Supervision, project administration, funding acquisition: A.A. and H.S. All authors have read and agreed to the published version of the manuscript.

Funding

This research was funded by the Danish Industry Foundation for the project, ‘ESG—from reporting to business’: https://esg-projekt.aucenterforsmv.dk.

Data Availability Statement

All data supporting the tools provided can be located following the links in the references [17,18,19,24,25,27,28,29] provided for the specific tools and databases.

Acknowledgments

Project partners Maria Dahl Andersen (AU BSS) and Cradle-to-Gate website developers at Gejst Studio Jakob B Lauritsen and Jeppe H Olesen.

Conflicts of Interest

The sponsors had no role in the design, execution, interpretation, or writing of the study.

Abbreviations

The following abbreviations are used in this manuscript:
EUEuropean Union
LCALife Cycle Assessment
CO2Carbon dioxide
CO2e Carbon Dioxide Equivalent
GHGGreenhouse Gas
SMESmall Scale Enterprises
VSMEVoluntary Sustainable standard for SMEs
CSRD Corporate Sustainability Reporting Directive
ESGEnvironment Social and Governance

References

  1. European Commission. The Clean Industrial Deal: A Joint Roadmap for Competitiveness and Decarbonisation. 2025. Available online: https://op.europa.eu/en/publication-detail/-/publication/b5543d22-f4fb-11ef-b7db-01aa75ed71a1/ (accessed on 5 December 2025).
  2. Greenhouse Gas Emission Accounts. Available online: https://ec.europa.eu/eurostat/statistics-explained/index.php?title=Greenhouse_gas_emission_accounts (accessed on 7 January 2026).
  3. European Commission; Directorate-General for Environment; adelphi; COWI; EnergyPro; Eunomia. Study on the potential of green bond finance for resource-efficient investments. In Study on the Potential of Green Bond Finance for Resource-Efficient Investments; Publications Office: Brussels, Belgium, 2016. [Google Scholar] [CrossRef]
  4. European Commission. Taxonomy: Final Report of the Technical Expert Group on Sustainable Finance. Technical Expert Group on Sustainable Finance. 2020. Available online: https://finance.ec.europa.eu/system/files/2020-03/200309-sustainable-finance-teg-final-report-taxonomy_en.pdf (accessed on 18 January 2026).
  5. BDO. EU Reporting: Corporate Sustainability Reporting Directive—Summary of Scope and Requirements. International Sustainability Reporting Bulletin 2024/04. 2024. Available online: https://www.bdo.global/getmedia/9db92e93-403c-41fc-a1cc-2bacc4d69cd2/ISRB2024_04_CSRD_Updated-11-Sept-2024.pdf?ext=.pdf (accessed on 6 January 2026).
  6. European Financial Reporting Advisory Group. Voluntary Sustainability Reporting Standard for Non-Listed SMEs (VSME Standard). 2024. Available online: https://www.efrag.org/sites/default/files/sites/webpublishing/SiteAssets/VSME%20Standard.pdf (accessed on 5 December 2025).
  7. European Financial Reporting Advisory Group. Executive Summary: Online Survey Responses to the VSME Public Consultation. EFRAG. 2023. Available online: https://www.efrag.org/system/files/sites/webpublishing/Meeting%20Documents/2407040934029343/05-03%20-%20Executive%20summary%20Online%20Survey%20Responses%20VSME%20public%20consultation.pdf (accessed on 5 December 2025).
  8. European Commission. Simplifying for Sustainable Competitiveness. 2025, pp. 1–9. Available online: https://environment.ec.europa.eu/document/download/502b572e-4ac3-47a8-95a7-ce619ec3e0ba_en?filename=COM_2025_980_1_EN_ACT_part1_v8.pdf (accessed on 6 January 2026).
  9. Sanderson, H. Who is responsible for embodied CO2? Climate 2021, 9, 41. [Google Scholar] [CrossRef] [Scilit]
  10. Brodny, J.; Tutak, M. Digitalization of Small and Medium-Sized Enterprises and Economic Growth: Evidence for the EU-27 Countries. J. Open Innov. Technol. Mark. Complex. 2022, 8, 67. [Google Scholar] [CrossRef] [Scilit]
  11. Marchese, M.; Medus, J. Assessing Greenhouse Gas Emissions and Energy Consumption in SMEs: Towards a Pilot Dashboard of SME Greening and Green Entrepreneurship Indicators; OECD SME and Entrepreneurship Papers; OECD: Paris, France, 2023; Volume 42. [Google Scholar] [CrossRef] [Scilit]
  12. Eleftheriadis, I.; Anagnostopoulou, E. Developing a Tool for Calculating the Carbon Footprint in SMEs. Sustainability 2024, 16, 1905. [Google Scholar] [CrossRef] [Scilit]
  13. World Business Council for Sustainable Development; World Resources Institute. The Greenhouse Gas Protocol: A Corporate Accounting and Reporting Standard (Revised ed.). 2004. Available online: http://pdf.wri.org/ghg_protocol_2004.pdf (accessed on 6 January 2026).
  14. Erhvershus Sjæland. Available online: https://ehsj.dk/content/ydelser/50-mio-kr-skal-hjaelpe-fere-smver-med-den-baeredygtige-omstilling/39b1f85b-e4dc-477f-82c0-7d6a772c8f6a/ (accessed on 26 November 2025).
  15. Yu, F.; Yuan, Q.; Sheng, X.; Liu, M.; Chen, L.; Yuan, X.; Zhang, D.; Dai, S.; Hou, Z.; Wang, Q.; et al. Understanding carbon footprint: An evaluation criterion for achieving sustainable development. Chin. J. Popul. Resour. Environ. 2024, 22, 367–375. [Google Scholar] [CrossRef] [Scilit]
  16. Niemann, L.; Morssinkhof, S.; van der Linden, M.J.; de Vries, K. Data Requests in Value Chains: The Effects of Corporate Sustainability Reporting on SMEs in The Netherlands. Sustainability 2025, 17, 8029. [Google Scholar] [CrossRef] [Scilit]
  17. ESG Project. Available online: https://esg-projekt.aucenterforsmv.dk/ (accessed on 26 November 2025).
  18. Climate Compass. Available online: https://klimakompasset.dk/klimakompasset/ (accessed on 26 November 2025).
  19. ESG-Cradle to Gate. Available online: https://esg-ctg.aucenterforsmv.dk/ (accessed on 26 November 2025).
  20. Ziemińska-Stolarska, A.; Sobulska, M.; Pietrzak, M.; Zbiciński, I. Application of Life Cycle Assessment to Analysis of Fibre Composite Manufacturing Technologies in Shipyards Industry. Processes 2024, 12, 461. [Google Scholar] [CrossRef] [Scilit]
  21. Ibrahim, R.A.; Inan, H.; Fahim, I.S. A comparative cradle-to-gate life cycle assessment of three cotton stalk waste sustainable applications. Sci. Rep. 2023, 13, 20781. [Google Scholar] [CrossRef] [Scilit] [PubMed]
  22. Üçtuğ, F.G.; Ediger, V.; Küçüker, M.A.; Berk, İ.; İnan, A.; Moghadasi Fereidani, B. Cradle-to-gate life cycle assessment of heavy machinery manufacturing: A case study in Türkiye. Int. J. Life Cycle Assess. 2025, 30, 939–955. [Google Scholar] [CrossRef] [Scilit]
  23. Olekanma, O.; Rodrigo, L.S.; Adu, D.A.; Gahir, B. Small- and medium-sized enterprises’ carbon footprint reduction initiatives as a catalyst for green jobs: A systematic review and comprehensive business strategy agenda. Bus. Strategy Environ. 2024, 33, 6911–6939. [Google Scholar] [CrossRef] [Scilit]
  24. Australian LCI Inventory. Available online: https://www.auslci.com.au/ (accessed on 15 November 2025).
  25. Climatiq. Available online: https://www.climatiq.io/ (accessed on 15 November 2025).
  26. Cannon, R.C.; Howell, F.W.; Goddard, N.H.; De Schutter, E. Non-curated distributed databases for experimental data and models in neuroscience. Netw. Comput. Neural Syst. 2002, 13, 415–428. [Google Scholar] [CrossRef]
  27. BONSAI. Available online: https://bonsai.uno/ (accessed on 15 November 2025).
  28. Greenhouse Gas Reporting. Available online: https://www.gov.uk/government/publications/greenhouse-gas-reporting-conversion-factors-2025 (accessed on 5 December 2025).
  29. DBA. The Danish Climate Compass-Emission Factor Database and Tool for Calculating Corporate Climate Footprints. 2024. Available online: https://finance.ec.europa.eu/document/download/75bce320-e4a7-4cdd-934f-cceefe7c49e5_en?filename=finance-events-240516-presentation-danish-climate-compass_en.pdf&prefLang=mt (accessed on 5 December 2025).
  30. European Union. Towards a Green & Digital Future: Key Requirements for Successful Twin Transitions in the European Union; Publications Office of the European Union; European Union: Brussels, Belgium, 2022. [Google Scholar] [CrossRef]
  31. Alromaizan, M.; Afy-Shararah, M.; Jagtap, S.; Litos, L.; Salonitis, K. Developing a Carbon Accounting Tool for SMEs in the Agri-Food Sector. Procedia CIRP 2023, 116, 492–497. [Google Scholar] [CrossRef] [Scilit]
  32. Ottaviani, A.; de Melo, D.; Bruni, L.; Gupta, R.; Nelsen, C. 10 years of carbon calculator use: What have we learned for the future? In Geotechnical Engineering Challenges to Meet Current and Emerging Needs of Society, 1st ed.; CRC Press: Boca Raton, FL, USA, 2024. [Google Scholar] [CrossRef] [Scilit]
  33. Fernandes, M.; Neves, P.; Araújo, P.; Brás, I.; Ferreira Silva, M.E. Carbon Footprint of Tourism Sector in Portugal Calculator Development. J. Tour. Hosp. Manag. 2021, 9, 365–380. Available online: https://davidpublisher.com/Public/uploads/Contribute/61f36b99d9701.pdf (accessed on 7 January 2026). [CrossRef] [Scilit]
  34. Moore, C.; Allasia-Grau, S.; de Santana, T.; Sauras-Yera, T.; Sabate-Jorba, S. A review and development of an enhanced carbon footprint calculator to facilitate knowledge of individual carbon emissions. J. Clean. Prod. 2025, 522, 146292. [Google Scholar] [CrossRef] [Scilit]
  35. Setyaningsih, S.; Widjojo, R.; Kelle, P. Challenges and opportunities in sustainability reporting: A focus on small and medium enterprises (SMEs). Cogent Bus. Manag. 2024, 11, 2298215. [Google Scholar] [CrossRef] [Scilit]
  36. Jiménez, E.; de la Cuesta-González, M.; Boronat-Navarro, M. How Small and Medium-Sized Enterprises Can Uptake the Sustainable Development Goals through a Cluster Management Organization: A Case Study. Sustainability 2021, 13, 5939. [Google Scholar] [CrossRef] [Scilit]
  37. Alieva, E. Analysis of Emissions in Foundries with Carbon Footprint Calculator. 2023. Available online: https://aaltodoc.aalto.fi/items/d1f1d8a1-f516-4e51-934c-94fe9559d16e (accessed on 7 January 2026).
  38. Samuel, G.; Lucivero, F.; Knowles, B.; Wright, K. Carbon Accounting in the Digital Industry: The Need to Move towards Decision Making in Uncertainty. Sustainability 2024, 16, 2017. [Google Scholar] [CrossRef] [Scilit] [PubMed]
  39. Putri, A.N.A.; Hermawan, P.; Mirzanti, I.R.; Meadows, M.; Sadraei, R. Unpacking green growth in SMEs: A framework for dynamic capabilities, value co-creation, and sustainable performance. Sustain. Futures 2025, 10, 100840. [Google Scholar] [CrossRef] [Scilit]
  40. Aykaç Özen, H.; Vayiç, B.; Çoruh, S. Assessment of organizational carbon footprints in a denim-washing company: A systematic approach to indirect non-energy emissions. Environ. Sci. Pollut. Res. 2024, 31, 35897–35907. [Google Scholar] [CrossRef] [Scilit] [PubMed]
Figure 1. Greenhouse gas emissions by economic activities in the EU (27), 2013–2024. Source: Eurostat dataset-env_ac_ainah r2, 2025 [2].
Climate 14 00026 g001
Disclaimer/Publisher’s Note: The statements, opinions and data contained in all publications are solely those of the individual author(s) and contributor(s) and not of MDPI and/or the editor(s). MDPI and/or the editor(s) disclaim responsibility for any injury to people or property resulting from any ideas, methods, instructions or products referred to in the content.