Article

Combining Multi-Source Satellite Data with a Microclimate Model to Analyze the Microclimate of an Urban Park

by
Yi Pan
1,*,
Takehiro Morimoto
2 and
Toshiaki Ichinose
3
1
Graduate School of Science and Technology, University of Tsukuba, 1-1-1 Tennodai, Tsukuba 305-8572, Ibaraki, Japan
2
Institute of Life and Environmental Sciences, University of Tsukuba, 1-1-1 Tennodai, Tsukuba 305-8572, Ibaraki, Japan
3
Social Systems Division, National Institute for Environmental Studies (NIES), Graduate School of Environmental Studies, Nagoya University, NIES 16-2 Onogawa, Tsukuba 305-8506, Ibaraki, Japan
*
Author to whom correspondence should be addressed.
Climate 2024, 12(12), 197; https://doi.org/10.3390/cli12120197
Submission received: 15 October 2024 / Revised: 17 November 2024 / Accepted: 23 November 2024 / Published: 25 November 2024

Abstract

Cities concentrate many people, and studies have shown that resultant urban heat islands can be intense. Urban parks can function as “cool islands” that mitigate heat island effects. This study used the microclimate model ENVI-met 5.1 to assess the cooling effect of Panyu Park in the center of Shanghai, China. The primary objectives were to increase the diversity of data sources and to conduct a microclimate analysis. Two scenarios were examined: the actual park and no park. The results indicated that (1) the integration of satellite technology enhanced the data sources for ENVI-met and thereby increased the efficiency of urban modeling and (2) the simulated results for the park correlated well with the actual data observed at weather stations. The presence of the park resulted in a decrease in the maximum air temperature by 0.1 °C at 1.4 m above ground, a decrease in the wind speed by 1.67 m/s, a maximum increase of 0.2% in relative humidity, and a reduction of 1.94 in the Predicted Mean Vote. The results demonstrated the applicability of multi-source satellite data in microclimate research, saved time on data collection, and provided valuable information for studies undertaken in areas where the collection of field data is challenging and/or historical data are unavailable.

1. Introduction

Cities occupy 2% of the earth’s surface, but their inhabitants consume 75% of the world’s energy resources, and the rapid development of urbanization has led to a series of problems, such as the intensification of the urban heat island effect, which directly threatens residents’ health [1,2]. In recent years, advancements in machine learning, cloud computing, and related technologies have spurred more studies on urban heat islands [3,4,5]. These studies have often focused on land-use classification and surface temperature inversion using high-resolution satellite data (e.g., the Landsat series) to explore their correlation. Numerous studies have demonstrated a close relationship between land surface temperature, land-use types, and the morphology of urban building clusters, with urban green spaces acting as “cool islands.” However, some researchers [6] have noted that the occurrence of satellite imaging at only specific times, such as around 10:30 a.m. Beijing time in the study area, makes it challenging to accurately capture diurnal variations in surface temperature. In addition, satellite data, generated based on surface reflectance, offer only two-dimensional information and do not reflect the air temperature above the surface. Their 30 m spatial resolution is also insufficient for analyzing urban microclimates.
ENVI-met is a three-dimensional microclimate model developed [7] in Germany. It offers a spatial resolution of 0.5–10 m. Based on computational fluid dynamics (CFD) and thermodynamics, the model accurately simulates interactions between the atmosphere, vegetation, and urban surfaces. Because of its high predictive accuracy, ENVI-met has been used widely in urban microclimate research [8,9,10].
In the past, the construction of urban models in ENVI-met has often relied on vector data manually drawn from Google Maps. Some studies [11,12,13] have utilized government building data, OpenStreetMap data, or web scraping techniques for gathering building information. Nevertheless, these methods face limitations, such as insufficient government data, missing OpenStreetMap data, and anti-scraping technology issues. These studies have also focused on building data and neglected surface materials and vegetation. For these types of data, some studies [14,15] have used WUDAPT (spatial resolution: 100 m) and GEE for land-use/land cover classification but have encountered issues with spatial resolution in park-scale studies.
The fact that data such as air temperature, relative humidity, soil temperature, and soil moisture in ENVI-met models are typically obtained through field observations or drones [16] can potentially introduce issues. These issues include susceptibility to external factors such as pandemic policies or external interference that may result in incomplete data. In addition, simulating and predicting historical conditions in the study area may suffer from inadequate parameter inputs that reduce the accuracy of the simulation.
In summary, although the Monde module in ENVI-met facilitates better integration with GIS by supporting the import of vector files, there are still some challenges:
  • The fact that vector files for roads, buildings, etc., are usually sourced from government data or OpenStreetMap leads to data insufficiencies in certain areas.
  • The existing land surface material data are challenged by insufficient spatial resolution at the scale of urban parks. This limitation hampers accurate modeling and analysis and therefore requires more refined data sources to enhance the quality of environmental simulations.
  • Parameter data in ENVI-met studies come mainly from field observations, which are susceptible to external influences.
This study sought to combine the high precision, three-dimensional, long-duration modeling capabilities of ENVI-met with the strengths of multi-source satellite data. These data sources included NASA’s SMAP (Soil Moisture Active Passive) for soil moisture detection [17], NASA’s Global Land Data Assimilation System Version 2 for soil temperature detection [18], and high-quality surface vector data derived from Google Maps using image segmentation technology. Our goal was to use multi-source satellite data to simplify the ENVI-met modeling process, broaden data sources, and validate the method’s effectiveness by analyzing the microclimate around urban parks.
This study references previous ENVI-met research [19] by setting up two scenarios—with and without the park—to analyze the cooling effect of the park through scenario comparison. However, unlike traditional ENVI-met studies, this study assumes a situation in which on-site observation is not feasible due to certain constraints, and where the study area lacks specific surface vector data (such as land-use and building data). In such a case, conventional ENVI-met research methods are clearly unsuitable. Instead, NASA’s SMAP data can fill the gap in soil moisture data for the study area, while NASA’s Global Land Data Assimilation System Version 2 provides information on depths of 0–10 cm, 10–40 cm, 40–100 cm, and 100–200 cm, which roughly correspond to the soil temperature layers set in ENVI-met.
To address the lack of surface vector data, traditional methods often use hand-drawing maps in ENVI-met, while this study innovatively introduces image segmentation technology. In the context of the widespread application of machine learning technology in GIS, this study also offers a new approach to integrating ENVI-met with machine learning.
In the following sections, we first select the Panyu Park in Shanghai and its surrounding 200 m buffer zone as a study area. In the Data and Methods Section, we introduce the application of image segmentation techniques, meteorological data, and remote sensing soil moisture/temperature data in ENVI-met. In the Results and Analysis Section, we perform an accuracy assessment of the simulation values to validate the effectiveness of the proposed method and conduct a visual analysis of the simulation results. In the Discussion Section, we compare this study with previous related research, highlighting the innovative aspects, address the limitations, and provide prospects for future research directions. In the Conclusions Section, we further summarize the research findings and contributions.

2. Study Area

Shanghai (30°40′–31°53′ N, 120°51′–122°12′ E) is situated on the delta of the Yangtze River, which is formed of sediment deposits. The city’s terrain is predominantly flat, and it lies within a typical subtropical monsoon climate zone. According to data from the Shanghai Meteorological Bureau, the lowest average temperature in 2022 was 5.6 °C, recorded in February, and the highest average temperature, 31.1 °C, was recorded in August. There is a significant cooling trend from the peak in August until mid-to-late September. Shanghai is the largest city in China and has been striving to develop into a “green city” as its economy grows. By 2023, Shanghai had 832 parks, 447 of which were classified as urban parks.
A study [20] using remote sensing analysis concluded that the cooling effect of parks in the main urban area of Shanghai can extend up to 200 m. However, the study did not consider factors such as wind speed and temperature. The present study focused on Panyu Park, which is located in Shanghai’s central urban area. Our goal was to conduct a three-dimensional climate analysis of the park. Because the center of Panyu Park is approximately 1 km from the Shanghai Meteorological Bureau, the Bureau’s meteorological data were highly useful. In addition, the park is surrounded predominantly by residential areas, with a hospital to the north, and thereby plays a significant role in the daily lives of the local population. In this study, we extracted the coordinates of Panyu Park from Baidu Maps (https://map.baidu.com/, accessed on 24 June 2024) and established a 200 m buffer zone around it. The research area was constructed using the extreme x and y points as boundaries (Figure 1).

3. Data and Methods

The ENVI-met simulation required two distinct input files: an area input (.inx) file and a parameter input (.simx) file.
In this study, the area input (.inx) file comprised four main components: buildings, land surface materials, vegetation, and terrain. Vector files for the area input could be generated by capturing a screenshot of the study area from Google Maps, saving it in BMP image format, and importing it into ENVI-met’s “Space” module for manual drawing and modeling. However, this process was time-consuming and cumbersome. To expedite data preparation, we processed geographic geometric data using the “Monde” module and then imported the output into the “Space” module for automated modeling. The “Monde” module enables users to import shapefiles and offers tools for defining coordinates, cropping boundaries, and specifying surface materials. With built-in terrain data such as SRTM GL 1 Arc Sec (approx. 30 m resolution, NASA), the “Monde” module primarily requires data for buildings, land surface materials, and vegetation. However, the “Monde” module only converts shapefiles into models and lacks comprehensive geographic data collection and processing capabilities. Effectively managing geographic data is thus crucial.
The parameter input (.simx) files encompassed primarily meteorological data, including solar altitude, cloud cover, wind velocity, air temperature, and relative humidity. They also included soil data, such as soil temperature and moisture. The solar altitude is automatically calculated based on the forecast time and geo-projected coordinates defined in the “Monde” module. However, data such as soil temperature, soil moisture, and air temperature are often gathered through field observations, which are highly susceptible to external influences. It is thus essential to diversify the sources of these data.
Given the limitations of the modules, the goal of this study was to integrate multi-source satellite data to expand ENVI-met’s data sources, simplify the process, and address gaps in historical data.

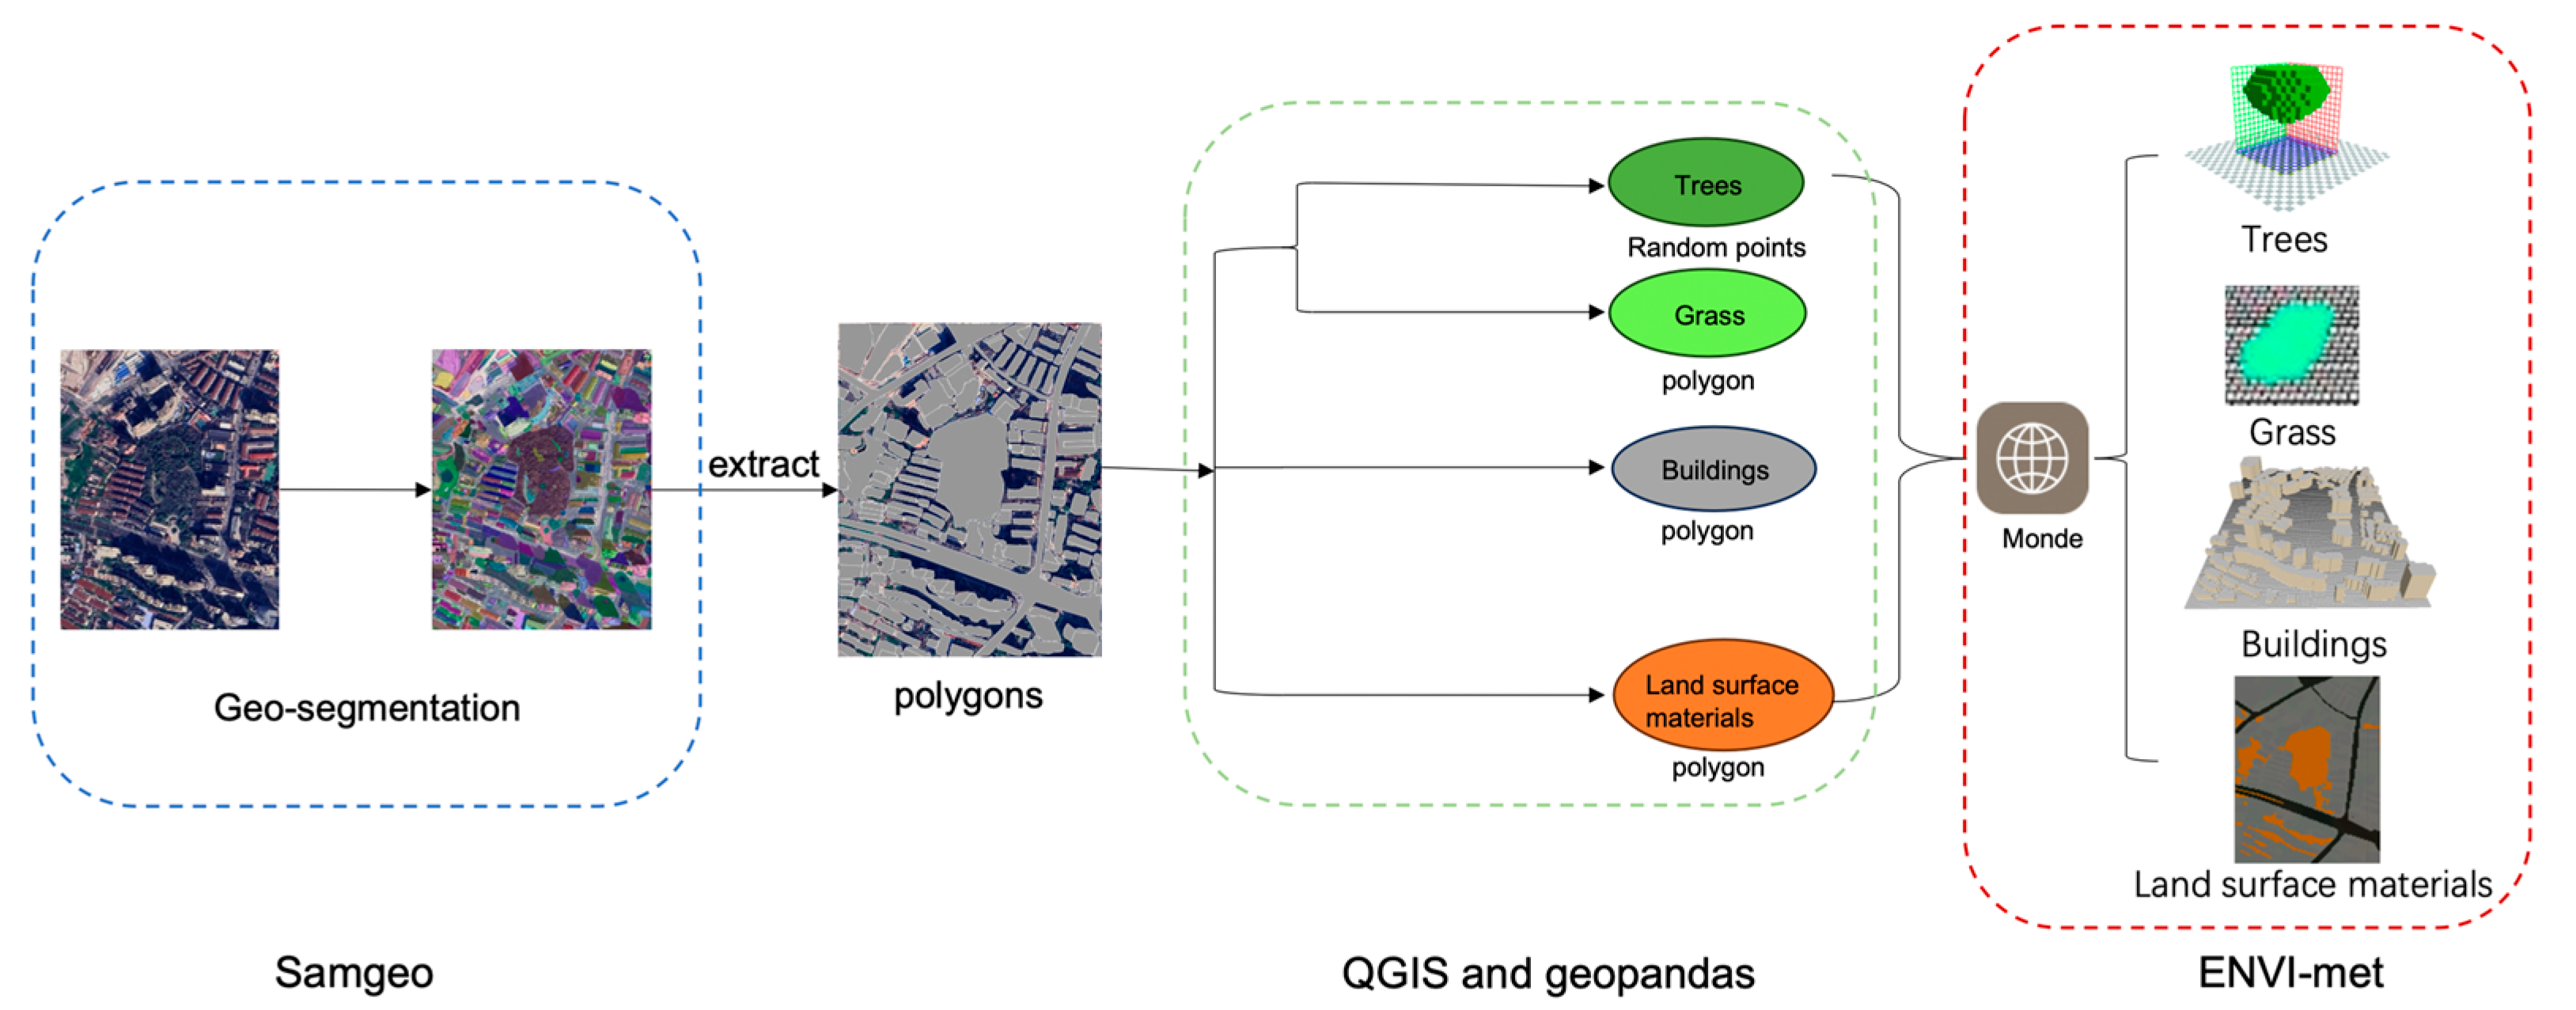
3.1. Area Input: Land Surface Material and Buildings

In the field of remote sensing, the Landsat and Sentinel series are widely used because of their high spatial resolution (Landsat 30 m; Sentinel 10 m), multiple spectral bands, extensive temporal coverage, and free accessibility. These attributes have enabled the creation of a variety of land-use datasets [21,22]. However, for small-scale microclimate studies, such as those focused on parks, the spatial resolution of 30 m or 10 m for surface material data is inadequate.
Samgeo [23,24] is a Python library developed on top of the segment-anything-eo library by Aliaksandr Hancharenka. It uses machine learning-based image segmentation techniques to simplify geospatial data analysis using the Segment Anything Model (SAM). Some studies [25] have applied it to monitor disease risks and have demonstrated the accuracy of the segmentation results. As an open-source Python library, it can be used for local TIF image segmentation. In the absence of high-quality datasets, it can also directly extract and segment research areas from Google Maps. The fact that the results can be exported as vector files in multiple formats (e.g., shapefiles, geojson) greatly facilitates the acquisition of geographic information.
Running Samgeo requires robust support from a graphics processing unit (GPU). In this study, Samgeo was executed on Google Colab (GPU T4) to crop and segment Google Maps images of the research area and generate higher-quality land-use data. These data were then imported into QGIS3.36 for further processing to extract building and land-use information. In addition, queries were made to a real estate website to determine the number of building floors in the study area (https://sh.lianjia.com/, accessed on 24 June 2024). A conversion factor of 3 m per floor [26] was used to calculate building heights. The result was building data with height information.
In ENVI-met, various building materials and surface materials are assigned corresponding codes. Based on the modeling requirements, this study selected the appropriate codes for each surface material and type of building wall (Table 1). Finally, GeoPandas 0.14.4 was used to define the material attributes of the shapefiles for building and land surface material data. Because the segmentation results from Google Maps are exported as polygons and the trees as point data, we used GeoPandas 0.14.4 to generate several random points within the grass polygons. These random points were then designated as trees. The specific process is shown in Figure 2 as a flow chart.
The processed files were then imported into the Monde module of ENVI-met5.1 to complete the Scenario 1 modeling of the study area. In Scenario 2, the central park’s vegetation was replaced with asphalt to alter the surface material as specified in the scenario’s requirements (Figure 3).

3.2. Parameter Input: Weather and Soil Temperature/Moisture Data

3.2.1. Weather Data

We used the 2022 annual data from the Shanghai Meteorological Bureau (NOAA: ftp://ftp.ncdc.noaa.gov/pub/data/noaa/isd-lite/, accessed on 24 June 2024) and chose 7 September 2022, to be the simulation date (Figure 4). On that day, the weather was clear with no clouds. The highest temperature, 35 °C, occurred at 3 p.m. The wind blew predominantly from the south, and the average wind speed was 3 m/s. Humidity ranged from 39.04% to 94.15% throughout the day. The simulation period extended from 8 a.m. to 10 p.m.

3.2.2. Soil Temperature and Moisture

In studies using ENVI-met, researchers have frequently focused on meteorological data and often neglected soil data. Research results have indicated that including soil data is important for accurate model simulation [27]. However, the complexity of certain research areas can lead to instances where some persons obstruct observation work [28], and regional lockdowns due to pandemic policies have further complicated data collection. While sample point observations ensure data accuracy, they represent only specific locations and do not reflect the conditions of an entire area. Satellite data can effectively overcome these obstacles. Although satellite soil data are global in scale and their spatial resolution is often in kilometers, they still provide an overall view of soil temperature and moisture conditions for a study area. In scenarios where the collection of field data is difficult, satellite data have therefore proven to be an excellent alternative.
Google Earth Engine (GEE), an online cloud computing platform, has been widely applied in remote sensing analysis in recent years [29,30,31] because of its extensive satellite data resources, capability to process satellite imagery without downloading, fast and efficient processing, and support for various machine learning algorithms. This study used the Changning District, where Panyu Park is located, as the region of interest (ROI). We used the NASA GLDAS-2 soil temperature dataset and NASA SMAP soil moisture dataset in GEE to calculate the average soil temperature and moisture in the study area on 7 September 2022. We then used these values as parameters in the soil settings for ENVI-met.
At this point, the preparation of data for the model was complete. Table 2 shows the values of specific parameters.

4. Results and Analysis

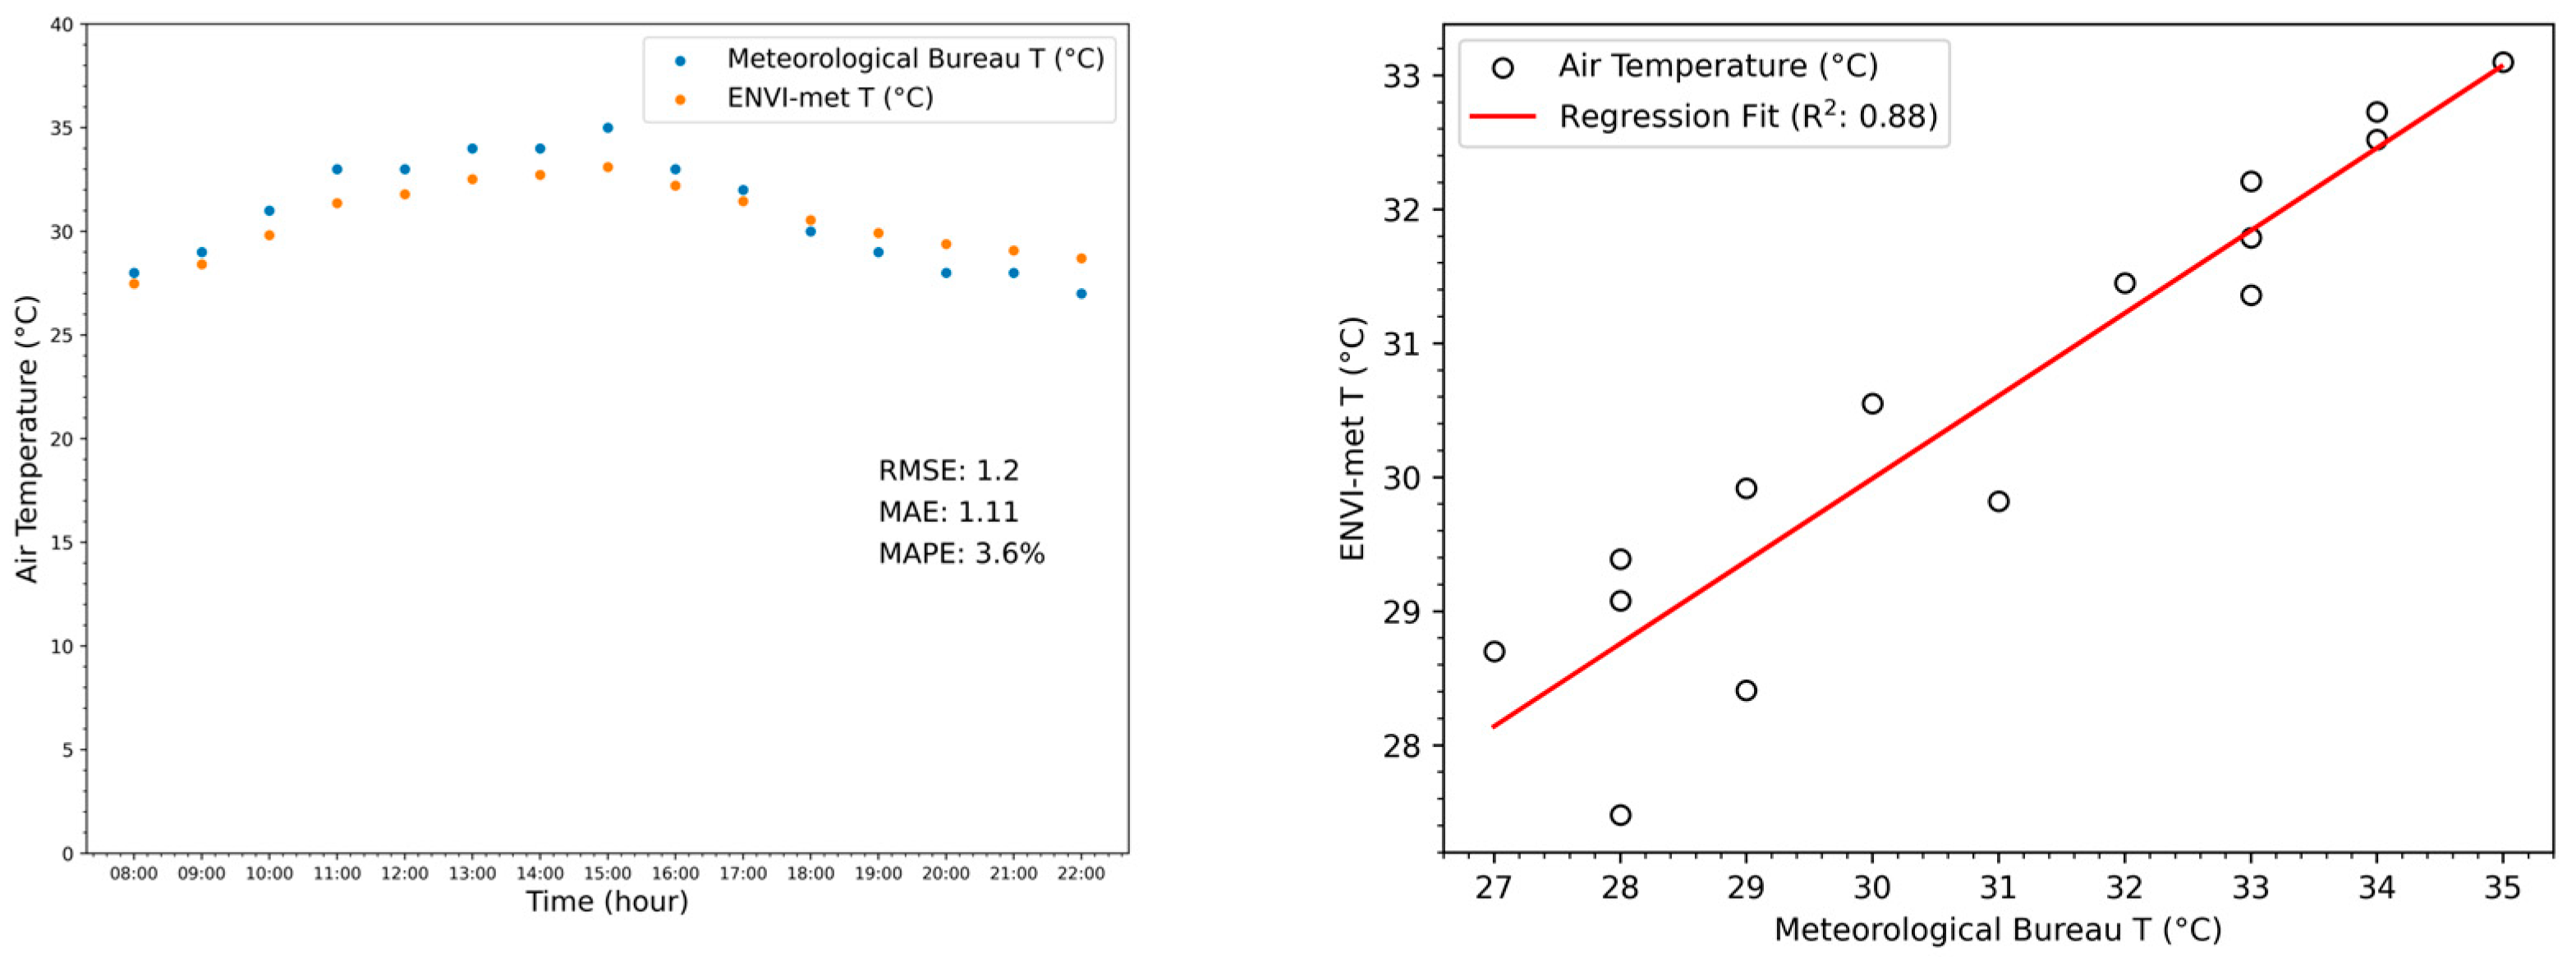
4.1. Simulation Accuracy Evaluation

Numerous studies have validated the accuracy of values simulated with ENVI-met. In this study, the root mean square error (RMSE, Equation (1)), mean absolute error (MAE, Equation (2)), and mean absolute percentage error (MAPE, Equation (3)) were used to assess the simulated results by comparing the simulated hourly temperatures with corresponding meteorological station observations, RMSE, MAE, and MAPE can represent a range of values from 0 to infinity, with values closer to zero indicating more accurate predictions. In addition, we calculated the coefficient of determination (R2, Equation (4)) between the simulated and observed temperatures to evaluate the degree of fit [32,33,34,35,36,37]. The results (Figure 5) indicated that, although the overall amplitude of peak changes in the ENVI-met simulation was relatively smooth, the agreement with real meteorological station observations was good. The implication was that ENVI-met’s simulated results could effectively capture the microclimate changes in this study area.
R M S E = i = 1 n ( y i ^ y i ) 2 n
M A E = 1 n i = 1 n y i ^ y i
M A P E = 1 n i = 1 n y i ^ y i y i × 100 %
R 2 = 1 i = 1 n ( y i y i ^ ) 2 i = 1 n ( y i y i m e a n ) 2
In Equations (1)–(4), y i ^ denotes simulated values, y i denotes observed values, y i m e a n is the mean of the observed values, and n is the number of observations.

4.2. Results of Analysis

According to the actual temperatures recorded by the meteorological station and the temperatures simulated from ENVI-met, the highest temperature on 7 September 2022 occurred around 3 p.m. We compared the temperature, wind speed, Mean Radiant Temperature (MRT), and Predicted Mean Vote (PMV) for park Scenarios 1 and 2 at this time to explore the impact of changes in park surface materials on the thermal comfort of surrounding residents. Temperature, wind speed, and MRT values were automatically calculated based on the initial input values; PMV was calculated by entering the temperature, wind speed, MRT, and relative humidity and then setting the human attributes in the ENVI-met “BIO-met” module. In this study, the human attributes for PMV were set to a 35-year-old male, 1.75 m tall, wearing summer clothing, and walking at a speed of 1.34 m/s.
Subsequent data processing and analysis were facilitated by the fact that ENVI-met offers a “Geodata to ENVI-met” plugin for QGIS that supports visualization and conversion to TIF files via QGIS. In this study, all ENVI-met simulation result files were converted to TIF files using QGIS (Figure 6), and Python libraries such as GDAL3.8.5 and rioxarray0.15.5 were used to digitize and slice the TIF files for further analysis.
Previous ENVI-met studies have used primarily point-based data collection. One or more sample points are set to observed values of temperature, and other data at different time points reflect microclimate changes. While this method is effective for specific points of interest, such as under trees or at street corners, it lacks spatial continuity. In this study, the center of the park, also the center of the entire study area, was used as a reference. Because the prevailing winds are southerly, a straight meridian line was drawn through the center point. By extracting pixel values along this centerline from the TIF files, we obtained continuous data. Because the horizontal spatial resolution was set to 5 m, the distance between each pair of data was converted to 5 m. The data pre-processing, extraction, and conversion were thus completed (Figure 7, Figure 8, Figure 9, Figure 10 and Figure 11).
A comparison of the results from the two scenarios revealed that the presence of the park led to notable changes in environmental conditions. Specifically, the park caused a maximum temperature drop of 0.1 °C at a height of 1.4 m above the ground, a maximum decrease in MRT by 23.5 °C, a maximum reduction in wind speed of 1.67 m/s, a maximum increase in relative humidity by 0.2%, and a maximum reduction in PMV of 1.94. These findings suggested that while the park’s impact on temperature and relative humidity was modest, it significantly affected MRT because of its loamy soil, shading by trees, and grassy surface. As a result, ground-level heat radiation was considerably lower from the park than from asphalt surfaces. Furthermore, the vegetation in the park increased surface friction, which in turn reduced wind speed and weakened the northward flow of hot air.
In the analysis of the results, this study adopted the centerline method, which made microclimate differences caused by surface variations in the park more pronounced along the centerline. Compared to the point sampling methods used in most studies, the centerline approach demonstrated better spatial coherence. Furthermore, in terms of visualization, this study fully utilized the ENVI-met plugin in QGIS to convert the results into TIF files and visualized them with Google Maps as the base map. This approach made the geographic spatial distribution of the results more intuitive. The result maps were arranged side by side in a vertical layout with the centerline analysis maps, allowing a direct comparison. In the “changed area” sections of the two scenarios, the result value differences are more noticeable. The improvements in the analysis methods and result visualization make the differences under various park scenarios more distinct, helping people better understand the outcomes. This provides a reference for urban planners in potential policy applications.

5. Discussion

This study primarily explored how to expand ENVI-met data sources and simplify the modeling process by integrating multi-source satellite data. Scenario analyses were conducted for a specific park. The results showed the following:
(1)
Using Samgeo for image segmentation of Google Maps: Compared to traditional ENVI-met modeling methods, this approach significantly reduced the time required for manual map drawing in the absence of existing vector data and increased the flexibility of handling geographic geometric data.
While large shadows cast by buildings due to the low angle of the sun affected segmentation accuracy in some areas, this issue was resolved in post-processing by refining the retained vector data using QGIS.
(2)
Using global soil datasets such as NASA GLDAS-2 and NASA SMAP: These datasets provided excellent temporal continuity and data integrity, effectively reflecting the overall soil conditions of the study area. When field observations are challenging, these datasets can serve as model inputs, leading to relatively accurate simulation results.
(3)
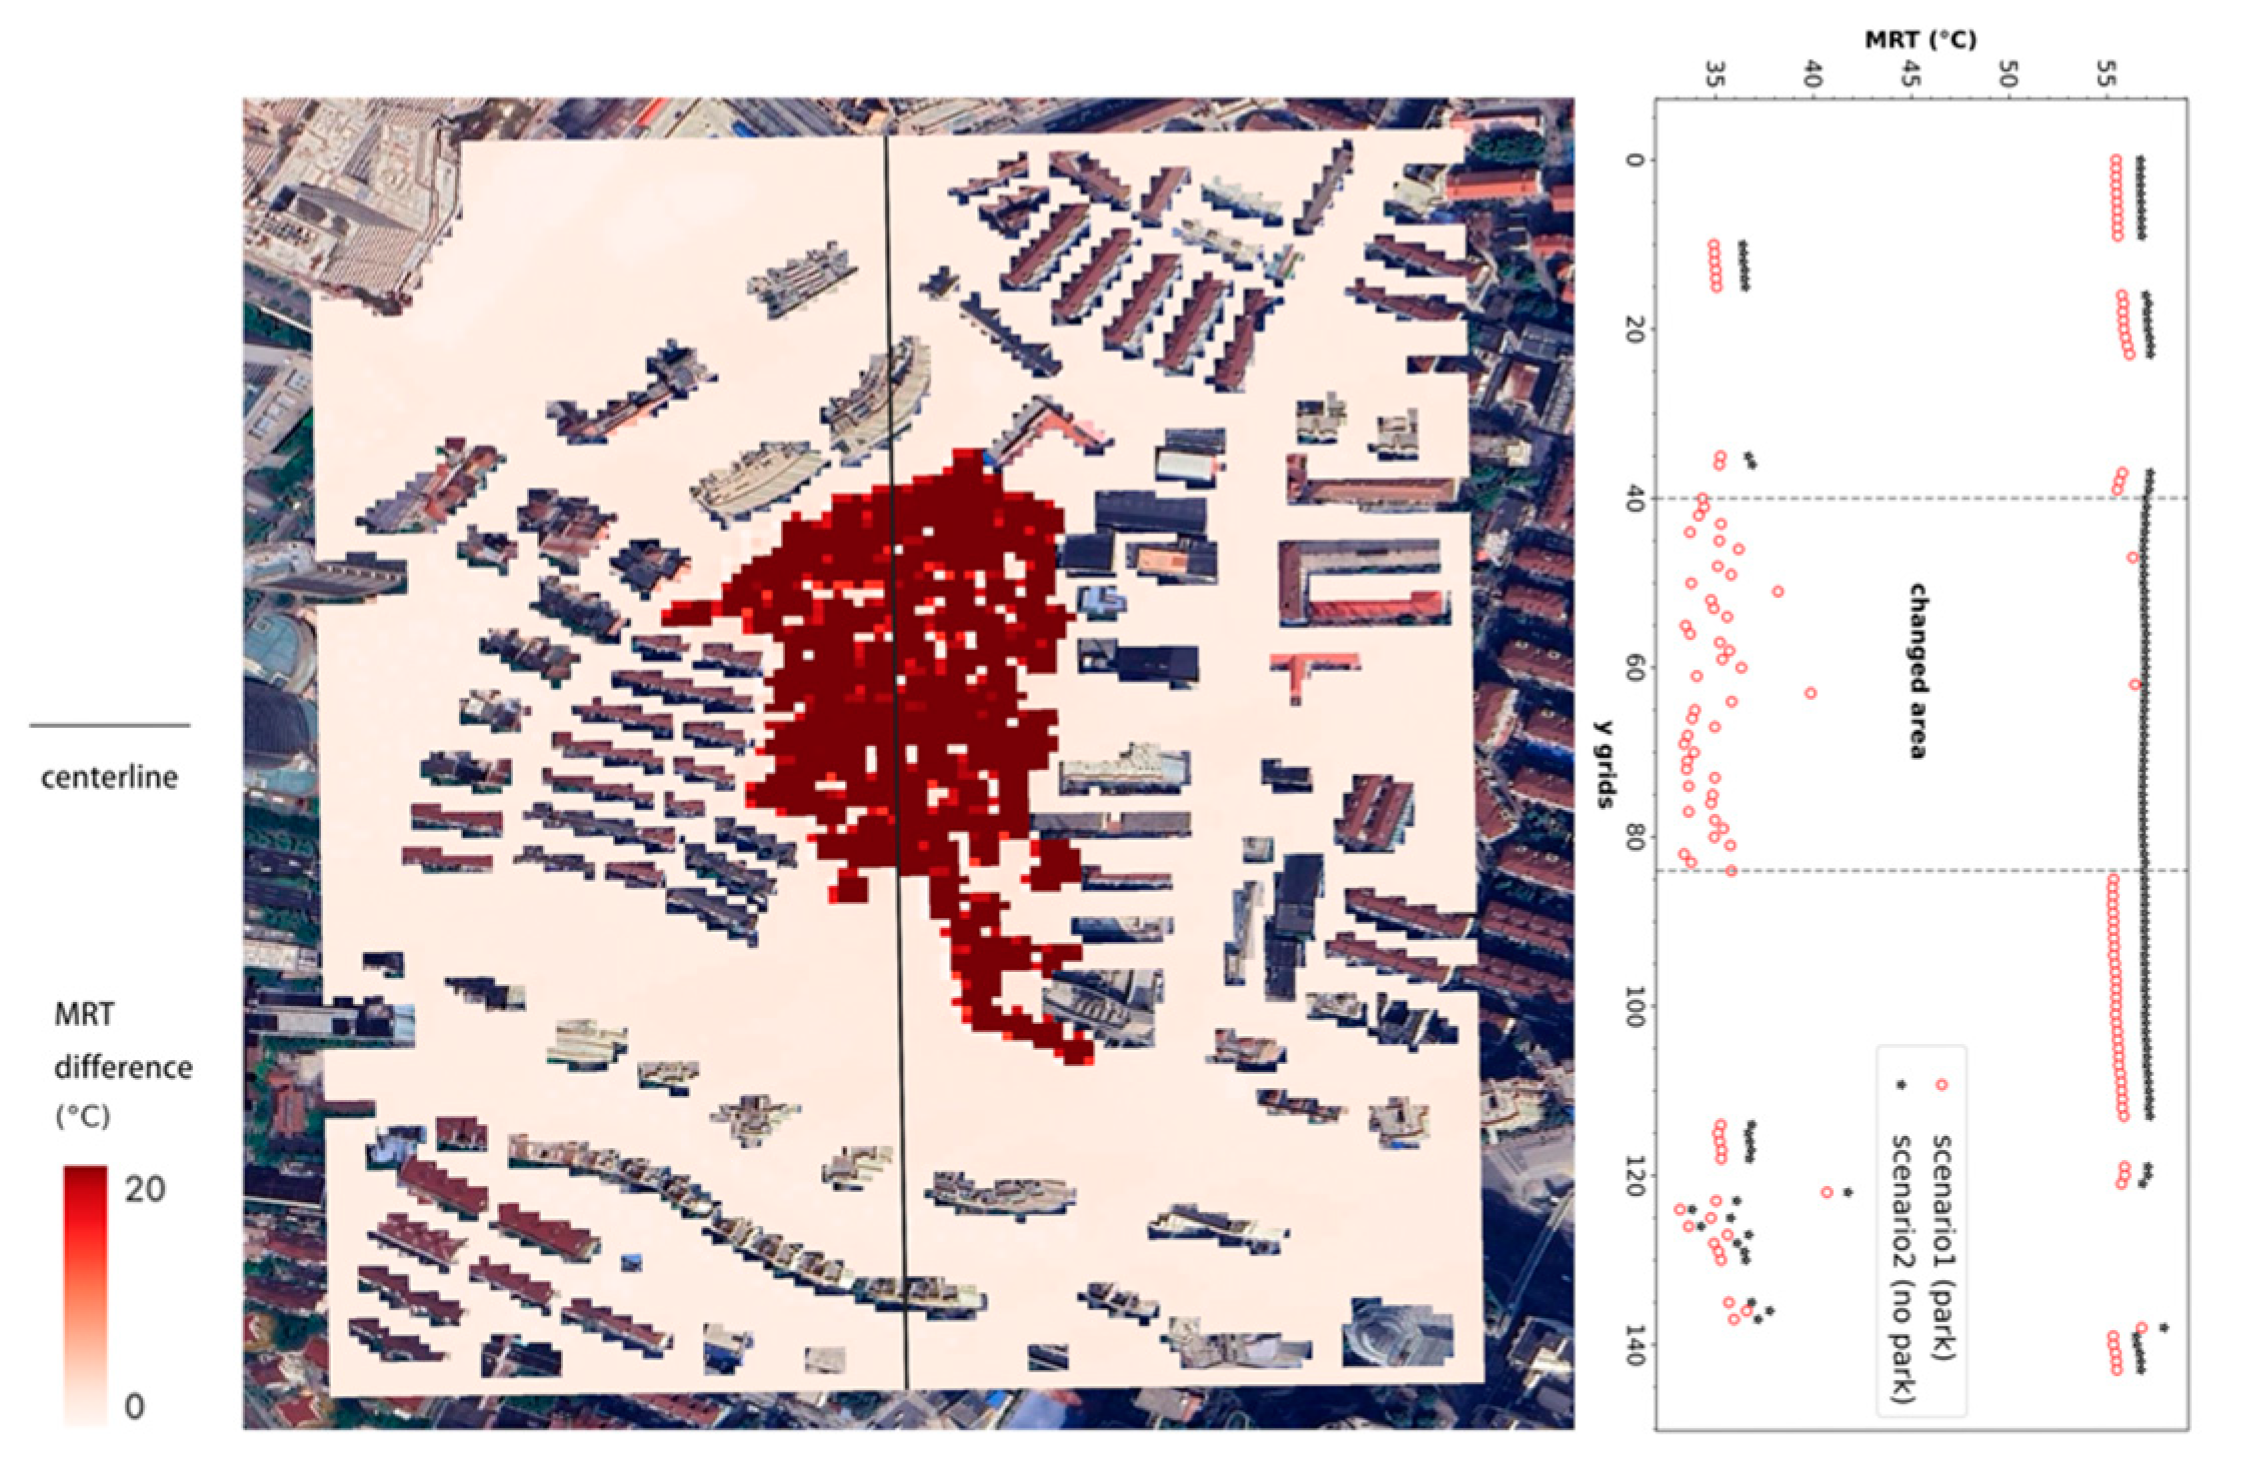
To consider the applicability to the general population, the simulation data at a vertical height of 1.4 m were analyzed via horizontal and longitudinal slicing. The results indicated that, compared to the assumed asphalt road scenario, the real park provided a cooling effect because of tree shading and increased the relative humidity of the air because of plant transpiration. In addition, the vegetation in the park increased surface friction and thereby significantly reduced the wind speed and suppressed the northward flow of hot air. In contrast, the high-rise buildings in the southern part of the study area formed a barrier-like structure that trapped the hot air and created a “mini heat island”.
Compared to traditional ENVI-met studies investigating the cooling effect of parks, this study introduces innovations in research methodology, specifically the incorporation of soil remote sensing data and image segmentation technology. These innovations address the issues of lacking observational data due to constraints and the absence of high-precision land-use and building vector data. The contribution of this study lies in expanding ENVI-met’s data sources and simplifying the modeling process.
However, in this study, we mainly focused on the innovative nature of the research methodology, conducted scenario analysis for only one park, and set up just two scenarios, which present certain limitations. In future related studies, we look forward to exploring more scenario settings, such as with and without soil parameter inputs, varying building forms, and more complex surface materials, to further validate the feasibility of integrating remote sensing data with ENVI-met.
The methodology of this study also has limitations, primarily due to the quality of the available remote sensing data. For example, the resolution of soil remote sensing data is often coarse, which typically only provides an overall view of the soil conditions within a large area, leading to spatial resolution issues when applied to specific study areas. Additionally, while image segmentation technology provides strong vector data support for research, segmentation results are easily affected by the quality of the original images. Due to varying image capture times, the quality of Google Maps also differs across regions. In some areas, the shadows cast by high-rise buildings are elongated due to the sun’s angle, forming large shadow areas. These shadowed regions cause data gaps in the segmentation results. In this study, this issue was resolved through post-processing of the vector data in QGIS.
Despite these shortcomings, with advancements in the field of remote sensing, it is believed that the accuracy of remote sensing data processing techniques and image segmentation technology will improve in the future, leading to better integration with ENVI-met urban microclimate modeling.

6. Conclusions

The data sources in this study were expanded by using multi-source data to provide soil temperature/moisture data and Samgeo satellite image segmentation technology to provide high-definition vector data of buildings and land cover. The effectiveness of the method was validated using RMSE, MAE, MAPE, and fitting coefficients R2. In addition, through a comparison of study areas under different scenarios, the importance of parks in enhancing the thermal comfort of residents was emphasized. The analysis also highlighted how high-rise buildings tended to create local “mini-heat islands” by obstructing air circulation. Addressing the public health impacts of extreme heat is essential. Future urban planning should contribute to the healthy development of urban areas by underscoring the importance of parks and increasing the spacing between high-rise buildings to facilitate air flow.
In this study, we used a novel method for broadening ENVI-met data sources and simplifying modeling procedures that will benefit future ENVI-met studies. The simulated results provided valuable information for urban planners and policymakers when they formulate urban development plans.

Author Contributions

Y.P., T.M. and T.I. conceived and designed this study. Y.P. obtained and organized the data. Y.P. conducted the scenario-based modeling. Y.P. processed the statistical analyses. Y.P. analyzed the results and wrote this manuscript. T.M. and T.I. reviewed and edited this manuscript. All authors have read and agreed to the published version of this manuscript.

Funding

This work was supported by JSPS KAKENHI Grant Number 21H01468 (Thermal physiological analysis with remote sensing and big data for urban design. PI: Toshiaki Ichinose). This achievement was also supported by JST SPRING, Grant Number JPMJSP2124.

Data Availability Statement

The original contributions presented in this study are included in this article. Further inquiries can be directed to the corresponding author(s).

Acknowledgments

The authors sincerely thank the Shanghai Meteorological Bureau for providing data support, the National Institute for Environmental Studies (NIES) for providing the ENVI-met simulation software, and the anonymous reviewers for their valuable comments and suggestions.

Conflicts of Interest

The authors declare no conflicts of interest.

References

  1. Gago, E.J.; Roldan, J.; Pacheco-Torres, R.; Ordóñez, J. The city and urban heat islands: A review of strategies to mitigate adverse effects. Renew. Sustain. Energy Rev. 2013, 25, 749–758. [Google Scholar] [CrossRef]
  2. Rizwan, A.M.; Dennis, L.Y.; Chunho, L.I.U. A review on the generation, determination and mitigation of Urban Heat Island. J. Environ. Sci. 2008, 20, 120–128. [Google Scholar] [CrossRef] [PubMed]
  3. He, J.F.; Liu, J.Y.; Zhuang, D.F.; Zhang, W.; Liu, M.L. Assessing the effect of land use/land cover change on the change of urban heat island intensity. Theor. Appl. Climatol. 2007, 90, 217–226. [Google Scholar] [CrossRef]
  4. Ogashawara, I.; Bastos, V.D.S.B. A quantitative approach for analyzing the relationship between urban heat islands and land cover. Remote Sens. 2012, 4, 3596–3618. [Google Scholar] [CrossRef]
  5. Ravanelli, R.; Nascetti, A.; Cirigliano, R.V.; Di Rico, C.; Leuzzi, G.; Monti, P.; Crespi, M. Monitoring the impact of land cover change on surface urban heat island through Google Earth Engine: Proposal of a global methodology, first applications and problems. Remote Sens. 2018, 10, 1488. [Google Scholar] [CrossRef]
  6. Hirano, Y.; Ichinose, T.; Ohashi, Y.; Shiraki, Y.; Onishi, A.; Yoshida, Y. Simulation of urban surface temperature and surface heat balance in the Tokyo metropolitan area. Sustain. Cities Soc. 2024, 112, 105596. [Google Scholar] [CrossRef]
  7. Bruse, M.; Fleer, H. Simulating surface–plant–air interactions inside urban environments with a three dimensional numerical model. Environ. Model. Softw. 1998, 13, 373–384. [Google Scholar] [CrossRef]
  8. Middel, A.; Häb, K.; Brazel, A.J.; Martin, C.A.; Guhathakurta, S. Impact of urban form and design on mid-afternoon microclimate in Phoenix Local Climate Zones. Landsc. Urban Plan. 2014, 122, 16–28. [Google Scholar] [CrossRef]
  9. Ren, J.; Yang, J.; Zhang, Y.; Xiao, X.; Xia, J.C.; Li, X.; Wang, S. Exploring thermal comfort of urban buildings based on local climate zones. J. Clean. Prod. 2022, 340, 130744. [Google Scholar] [CrossRef]
  10. Kotharkar, R.; Dongarsane, P. Investigating outdoor thermal comfort variations across Local Climate Zones in Nagpur, India, using ENVI-met. Build. Environ. 2024, 249, 111122. [Google Scholar] [CrossRef]
  11. Heldens, W.; Heiden, U.; Esch, T.; Mueller, A.; Dech, S. Integration of remote sensing based surface information into a three-dimensional microclimate model. ISPRS J. Photogramm. Remote Sens. 2017, 125, 106–124. [Google Scholar] [CrossRef]
  12. Ensari, E.; Kobaş, B. Web scraping and mapping urban data to support urban design decisions. A|Z ITU J. Fac. Archit. 2018, 15, 5–21. [Google Scholar] [CrossRef]
  13. Cilek, M.U.; Cilek, A. Analyses of land surface temperature (LST) variability among local climate zones (LCZs) comparing Landsat-8 and ENVI-met model data. Sustain. Cities Soc. 2021, 69, 102877. [Google Scholar] [CrossRef]
  14. Shi, L.; Ling, F. Local climate zone mapping using multi-source free available datasets on google earth engine platform. Land 2021, 10, 454. [Google Scholar] [CrossRef]
  15. Sigler, L.; Gilabert, J.; Villalba, G. Exploring methods for developing local climate zones to support climate research. Climate 2022, 10, 109. [Google Scholar] [CrossRef]
  16. Song, B.; Kim, S.H.; Park, G.; Park, K. Comparison of urban physical environments and thermal properties extracted from unmanned aerial vehicle images and ENVI-met model simulations. Build. Environ. 2024, 261, 111705. [Google Scholar] [CrossRef]
  17. Reichle, R.; De Lannoy, G.; Koster, R.D.; Crow, W.T.; Kimball, J.S.; Liu, Q.; Bechtold, M. SMAP L4 Global 3-Hourly 9 km EASE-Grid Surface and Root Zone Soil Moisture Analysis Update, Version 7; data set; NASA National Snow and Ice Data Center Distributed Active Archive Center: Boulder, CO, USA, 2022. [Google Scholar]
  18. Rodell, M.; Houser, P.R.; Jambor, U.E.; Gottschalck, J.; Mitchell, K.; Meng, C.J.; Arsenault, K.; Cosgrove, B.; Radakovich, J.; Bosilovich, M.; et al. The global land data assimilation system. Bull. Am. Meteorol. Soc. 2004, 85, 381–394. [Google Scholar] [CrossRef]
  19. Cruz, J.A.; Blanco, A.C.; Garcia, J.J.; Santos, J.A.; Moscoso, A.D. Evaluation of the cooling effect of green and blue spaces on urban microclimate through numerical simulation: A case study of Iloilo River Esplanade, Philippines. Sustain. Cities Soc. 2021, 74, 103184. [Google Scholar] [CrossRef]
  20. Junjie, R. Effect of Urban Parks on Thermal Environment in Summer: A Case Study in Shanghai. Ecol. Environ. Sci. 2016, 25, 1663–1670. [Google Scholar]
  21. Yang, J.; Huang, X. The 30 m annual land cover dataset and its dynamics in China from 1990 to 2019. Earth Syst. Sci. Data 2021, 13, 3907–3925. [Google Scholar] [CrossRef]
  22. Zanaga, D.; Van De Kerchove, R.; De Keersmaecker, W.; Souverijns, N.; Brockmann, C.; Quast, R.; Wevers, J.; Grosu, A.; Paccini, A.; Vergnaud, S.; et al. ESA WorldCover 10 m 2020 v100. Zenodo 2021. [Google Scholar] [CrossRef]
  23. Wu, Q.; Osco, L. samgeo: A Python package for segmenting geospatial data with the Segment Anything Model (SAM). J. Open Source Softw. 2023, 8, 5663. [Google Scholar] [CrossRef]
  24. Osco, L.P.; Wu, Q.; de Lemos, E.L.; Gonçalves, W.N.; Ramos, A.P.M.; Li, J.; Junior, J.M. The Segment Anything Model (SAM) for remote sensing applications: From zero to one shot. Int. J. Appl. Earth Obs. Geoinf. 2023, 124, 103540. [Google Scholar] [CrossRef]
  25. Trujillano, F.; Jimenez, G.; Manrique, E.; Kahamba, N.F.; Okumu, F.; Apollinaire, N.; Carrasco-Escobar, G.; Barrett, B.; Fornace, K. Using image segmentation models to analyse high-resolution earth observation data: New tools to monitor disease risks in changing environments. Int. J. Health Geogr. 2024, 23, 13. [Google Scholar] [CrossRef]
  26. Chen, Y.; Wang, C.; Hu, Y. Energy Consumption and Outdoor Thermal Comfort Characteristics in High-Density Urban Areas Based on Local Climate Zone—A Case Study of Changsha, China. Sustainability 2024, 16, 7157. [Google Scholar] [CrossRef]
  27. Salata, F.; Golasi, I.; de Lieto Vollaro, R.; de Lieto Vollaro, A. Urban microclimate and outdoor thermal comfort. A proper procedure to fit ENVI-met simulation outputs to experimental data. Sustain. Cities Soc. 2016, 26, 318–343. [Google Scholar] [CrossRef]
  28. Yang, J.; Hu, X.; Feng, H.; Marvin, S. Verifying an ENVI-met simulation of the thermal environment of Yanzhong Square Park in Shanghai. Urban For. Urban Green. 2021, 66, 127384. [Google Scholar] [CrossRef]
  29. Gorelick, N.; Hancher, M.; Dixon, M.; Ilyushchenko, S.; Thau, D.; Moore, R. Google Earth Engine: Planetary-scale geospatial analysis for everyone. Remote Sens. Environ. 2017, 202, 18–27. [Google Scholar] [CrossRef]
  30. Amani, M.; Ghorbanian, A.; Ahmadi, S.A.; Kakooei, M.; Moghimi, A.; Mirmazloumi, S.M.; Moghaddam, S.H.; Mahdavi, S.; Ghahremanloo, M.; Parsian, S.; et al. Google earth engine cloud computing platform for remote sensing big data applications: A comprehensive review. IEEE J. Sel. Top. Appl. Earth Obs. Remote Sens. 2020, 13, 5326–5350. [Google Scholar] [CrossRef]
  31. Zhao, Q.; Yu, L.; Li, X.; Peng, D.; Zhang, Y.; Gong, P. Progress and trends in the application of Google Earth and Google Earth Engine. Remote Sens. 2021, 13, 3778. [Google Scholar] [CrossRef]
  32. Stunder, M.; Sethuraman, S. A statistical evaluation and comparison of coastal point source dispersion models. Atmos. Environ. 1986, 20, 301–315. [Google Scholar] [CrossRef]
  33. Chatterjee, S.; Khan, A.; Dinda, A.; Mithun, S.; Khatun, R.; Akbari, H.; Kusaka, H.; Mitra, C.; Bhatti, S.S.; Van Doan, Q.; et al. Simulating micro-scale thermal interactions in different building environments for mitigating urban heat islands. Sci. Total Environ. 2019, 663, 610–631. [Google Scholar] [CrossRef] [PubMed]
  34. Yilmaz, S.; Külekçi, E.A.; Mutlu, B.E.; Sezen, I. Analysis of winter thermal comfort conditions: Street scenarios using ENVI-met model. Environ. Sci. Pollut. Res. 2021, 28, 63837–63859. [Google Scholar] [CrossRef] [PubMed]
  35. Lai, Y.; Ning, Q.; Ge, X.; Fan, S. Thermal regulation of coastal urban forest based on Envi-Met Model—A case study in Qinhuangdao, China. Sustainability 2022, 14, 7337. [Google Scholar] [CrossRef]
  36. Abuzaid, A.S.; El-Komy, M.S.; Shokr, M.S.; El Baroudy, A.A.; Mohamed, E.S.; Rebouh, N.Y.; Abdel-Hai, M.S. Predicting Dynamics of Soil Salinity and Sodicity Using Remote Sensing Techniques: A Landscape-Scale Assessment in the Northeastern Egypt. Sustainability 2023, 15, 9440. [Google Scholar] [CrossRef]
  37. Vivas, E.; Allende-Cid, H.; Salas, R. A systematic review of statistical and machine learning methods for electrical power forecasting with reported mape score. Entropy 2020, 22, 1412. [Google Scholar] [CrossRef]
Figure 1. (a) The location of Shanghai, (b) the location of Panyu Park in Shanghai, and (c) the location of the study area.
Climate 12 00197 g001
Figure 2. The process workflow of the area input data.
Climate 12 00197 g002
Figure 3. Modeling of the study area in ENVI-met, Scenario 1: actual park (left) and Scenario 2: no park (right).
Climate 12 00197 g003
Figure 4. Temperature and relative humidity on 7 September 2022.
Climate 12 00197 g004
Figure 5. Simulated versus actual weather station observations in Scenario 1 (left), and values fit by regression (right).
Climate 12 00197 g005
Figure 6. Comparison of results at a height of 1.4 m in the study area between Scenario 1 (left panels) and Scenario 2 (right panels): (a-1,a-2) air temperature, (b-1,b-2) wind speed, (c-1,c-2) Mean Radiant Temperature, (d-1,d-2) relative humidity, and (e-1,e-2) Predicted Mean Vote.
Climate 12 00197 g006
Figure 7. Variation in air temperature (AT) at a height of 1.4 m in Scenario 2 compared to Scenario 1 (left) and comparison of centerline cross-sections (right).
Climate 12 00197 g007
Figure 8. Variation in wind speed (WS) at a height of 1.4 m in Scenario 2 compared to Scenario 1 (left) and comparison of centerline cross-sections (right).
Climate 12 00197 g008
Figure 9. Variation in MRT at a height of 1.4 m in Scenario 2 compared to Scenario 1 (left) and comparison of centerline cross-sections (right).
Climate 12 00197 g009
Figure 10. Variation in relative humidity (RH) at a height of 1.4 m in Scenario 2 compared to Scenario 1 (left) and comparison of centerline cross-sections (right).
Climate 12 00197 g010
Figure 11. Variation in PMV at a height of 1.4 m in Scenario 2 compared to Scenario 1 (left) and comparison of centerline cross-sections (right).
Climate 12 00197 g011
Table 1. The code of land surface materials.
CategoryTypeDescriptionCode
BuildingPolygonHeavy concrete wall000C1
Land Surface MaterialPolygonAsphalt road0100ST
PolygonArtificial pavement0000PD
PolygonNatural pavement000000
VegetationPointHeart-shaped, large trunk, dense, medium (15 m)01HLDM
Polygon25 cm height grass0100xx
Table 2. Input settings and meteorological parameters for the microclimate simulation of the scenario models in ENVI-met.
ParametersValues Used
Simulation date7 September 2022
Simulation time8:00 a.m.–10:00 p.m.
Total simulation hours14 h
Resolution (x, y, z) 5,5,2 m
Grid (x,y,z)113,144,90
Wind speed3 m/s
Wind direction180
Cloud cover0
Specific humidity in 2500 m (g/kg)8.00
Roughness length0.01
Initial air temperature range23–35 °C
Initial relative humidity range39.04–94.15%
Temperature of soil level(0–20 cm)26.67 °C
(20–50 cm)25.8 °C
(50–200 cm)25.4 °C
(>200 cm)24.96 °C
Soil moisture 19.5%
Disclaimer/Publisher’s Note: The statements, opinions and data contained in all publications are solely those of the individual author(s) and contributor(s) and not of MDPI and/or the editor(s). MDPI and/or the editor(s) disclaim responsibility for any injury to people or property resulting from any ideas, methods, instructions or products referred to in the content.

