

Analyzing Temperature, Precipitation, and River Discharge Trends in Afghanistan’s Main River Basins Using Innovative Trend Analysis, Mann–Kendall, and Sen’s Slope Methods


Abstract
1. Introduction
2. Materials and Methods
2.1. Physiography and Climate
- Arid Hot Desert (BWh): Predominately in the southwest, parts of the Amu Darya Basin, and the south;
- Arid Steppe Cold (BSk): Covering a broad central area;
- Temperate and Cold Summer Regions (Csa, Csb): Found in mid-elevation areas;
- Cold, Dry, Hot Summer (Dsa) and Cold, Dry, Warm Summer (Dsb): These are located at high elevations;
- Tundra (ET): Present in the highest elevations, lacking a true summer season.
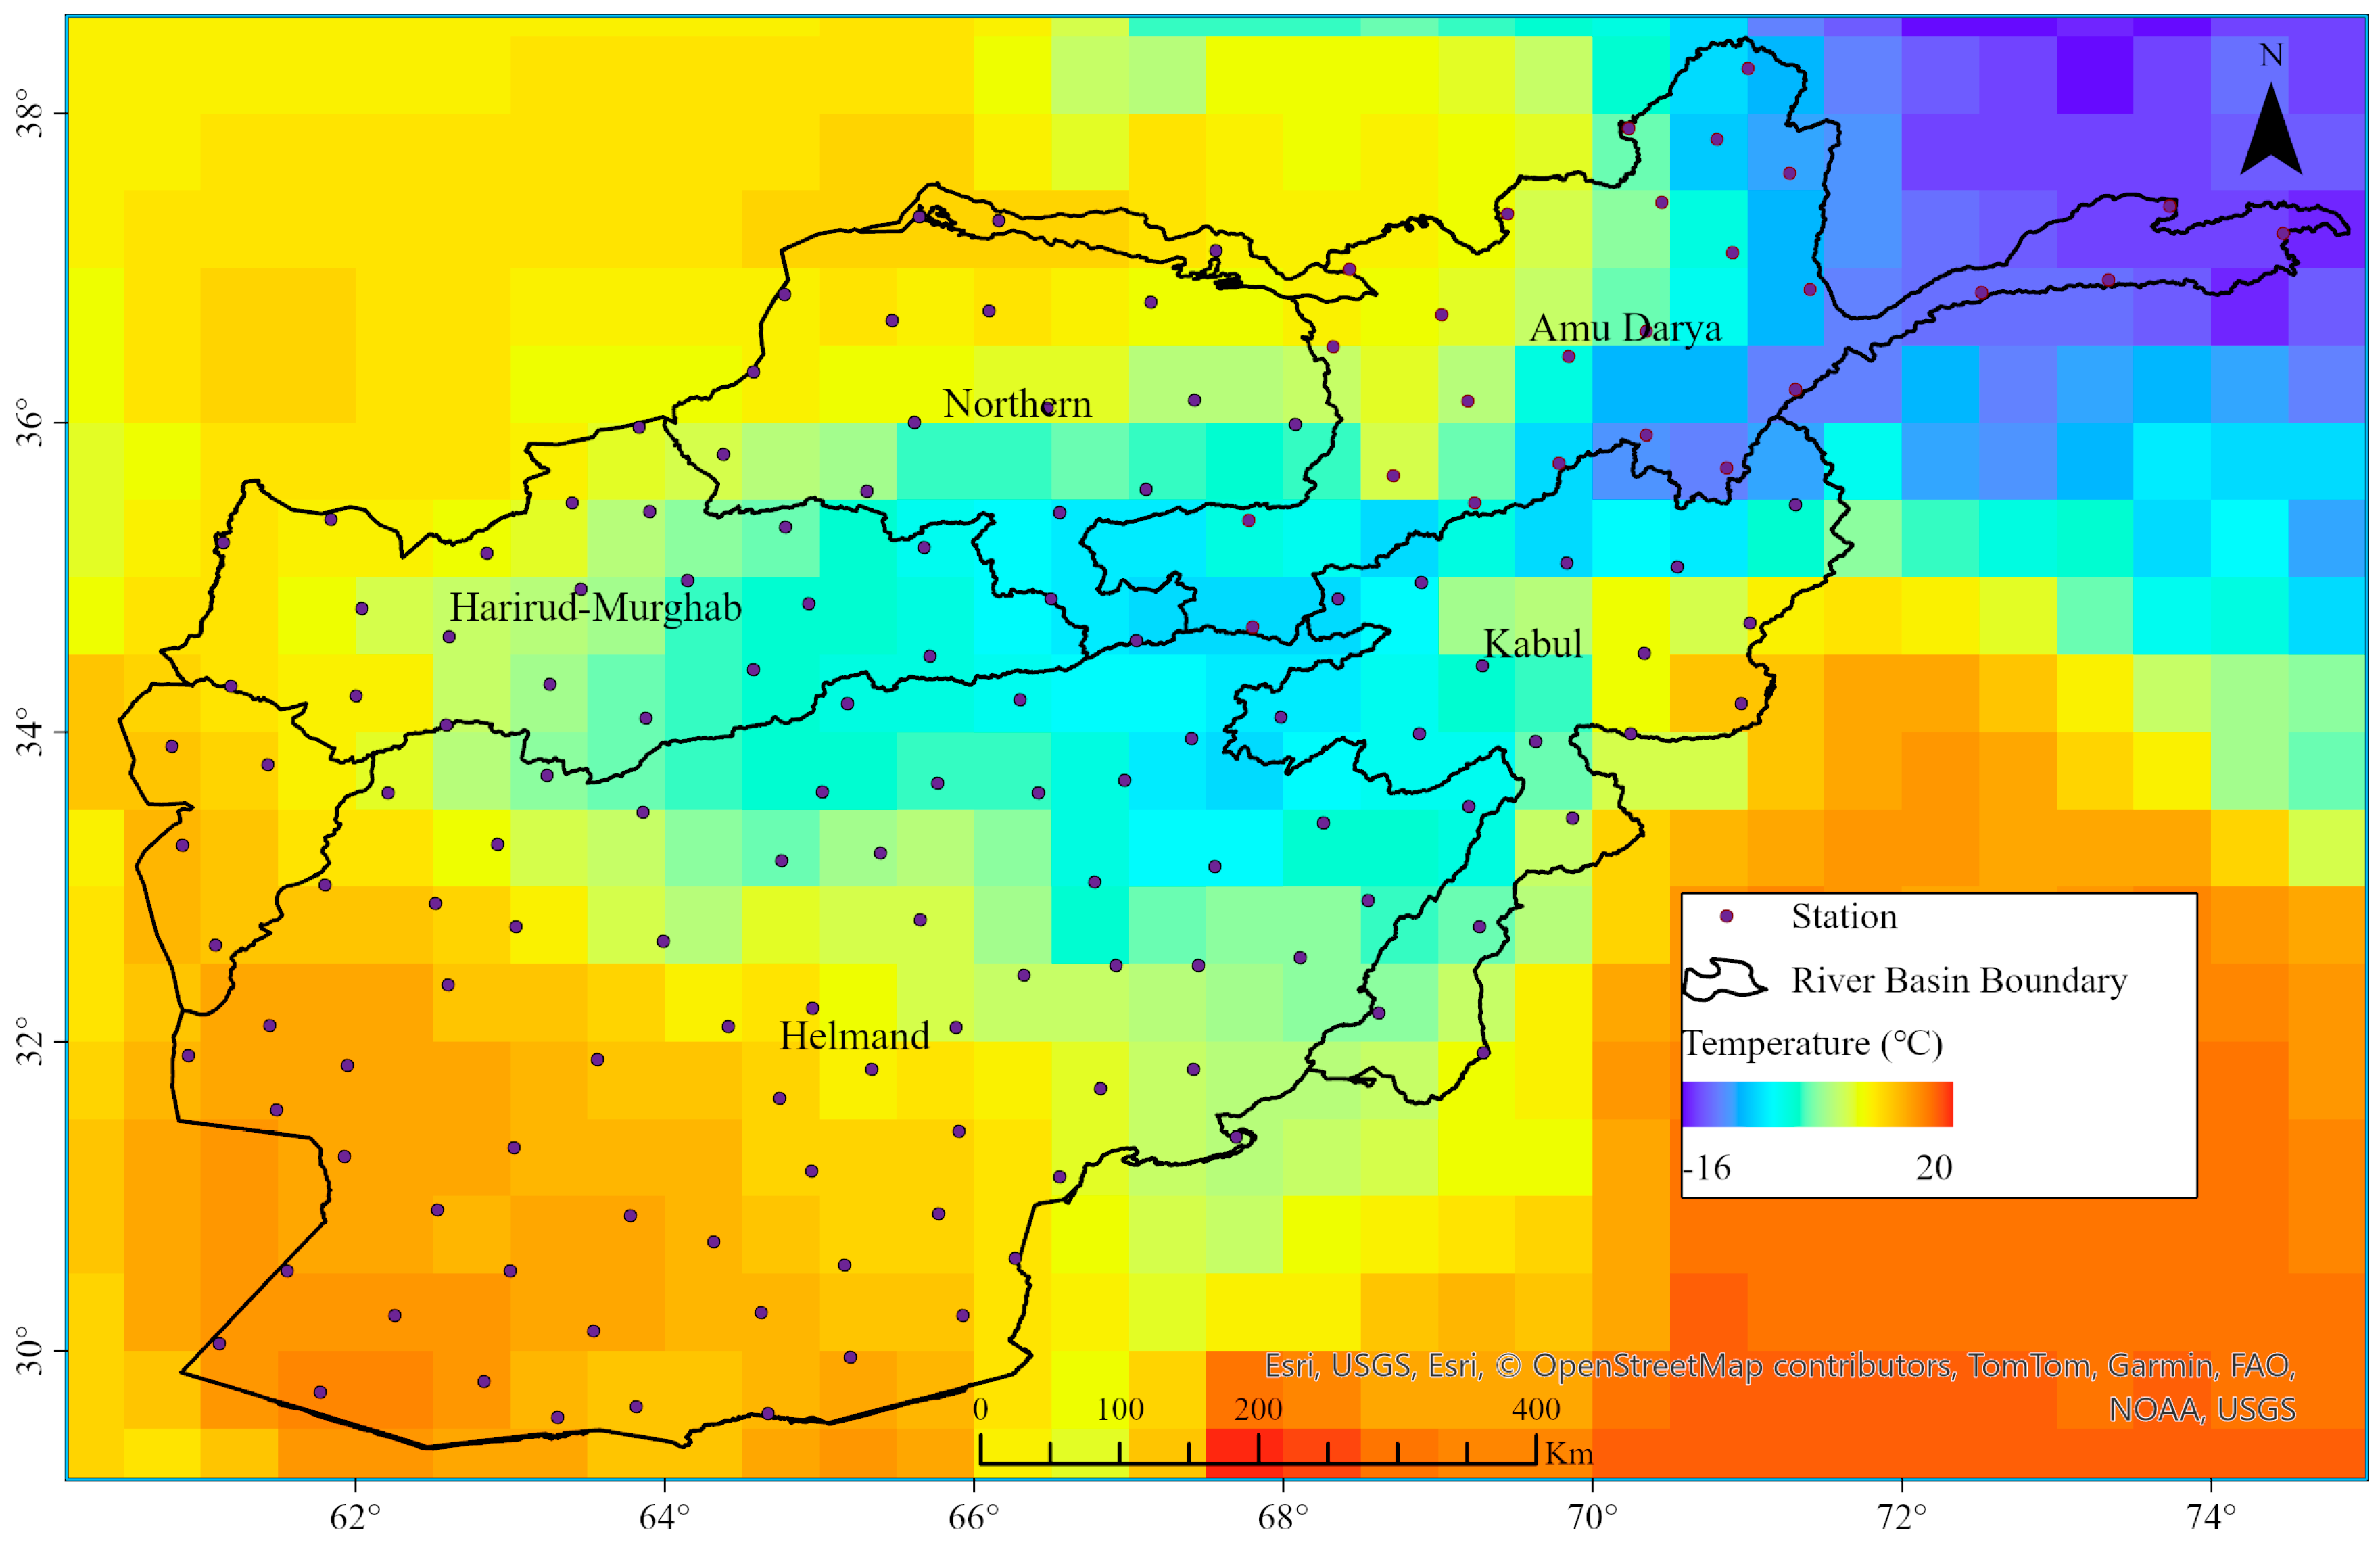
2.1.1. Temperature
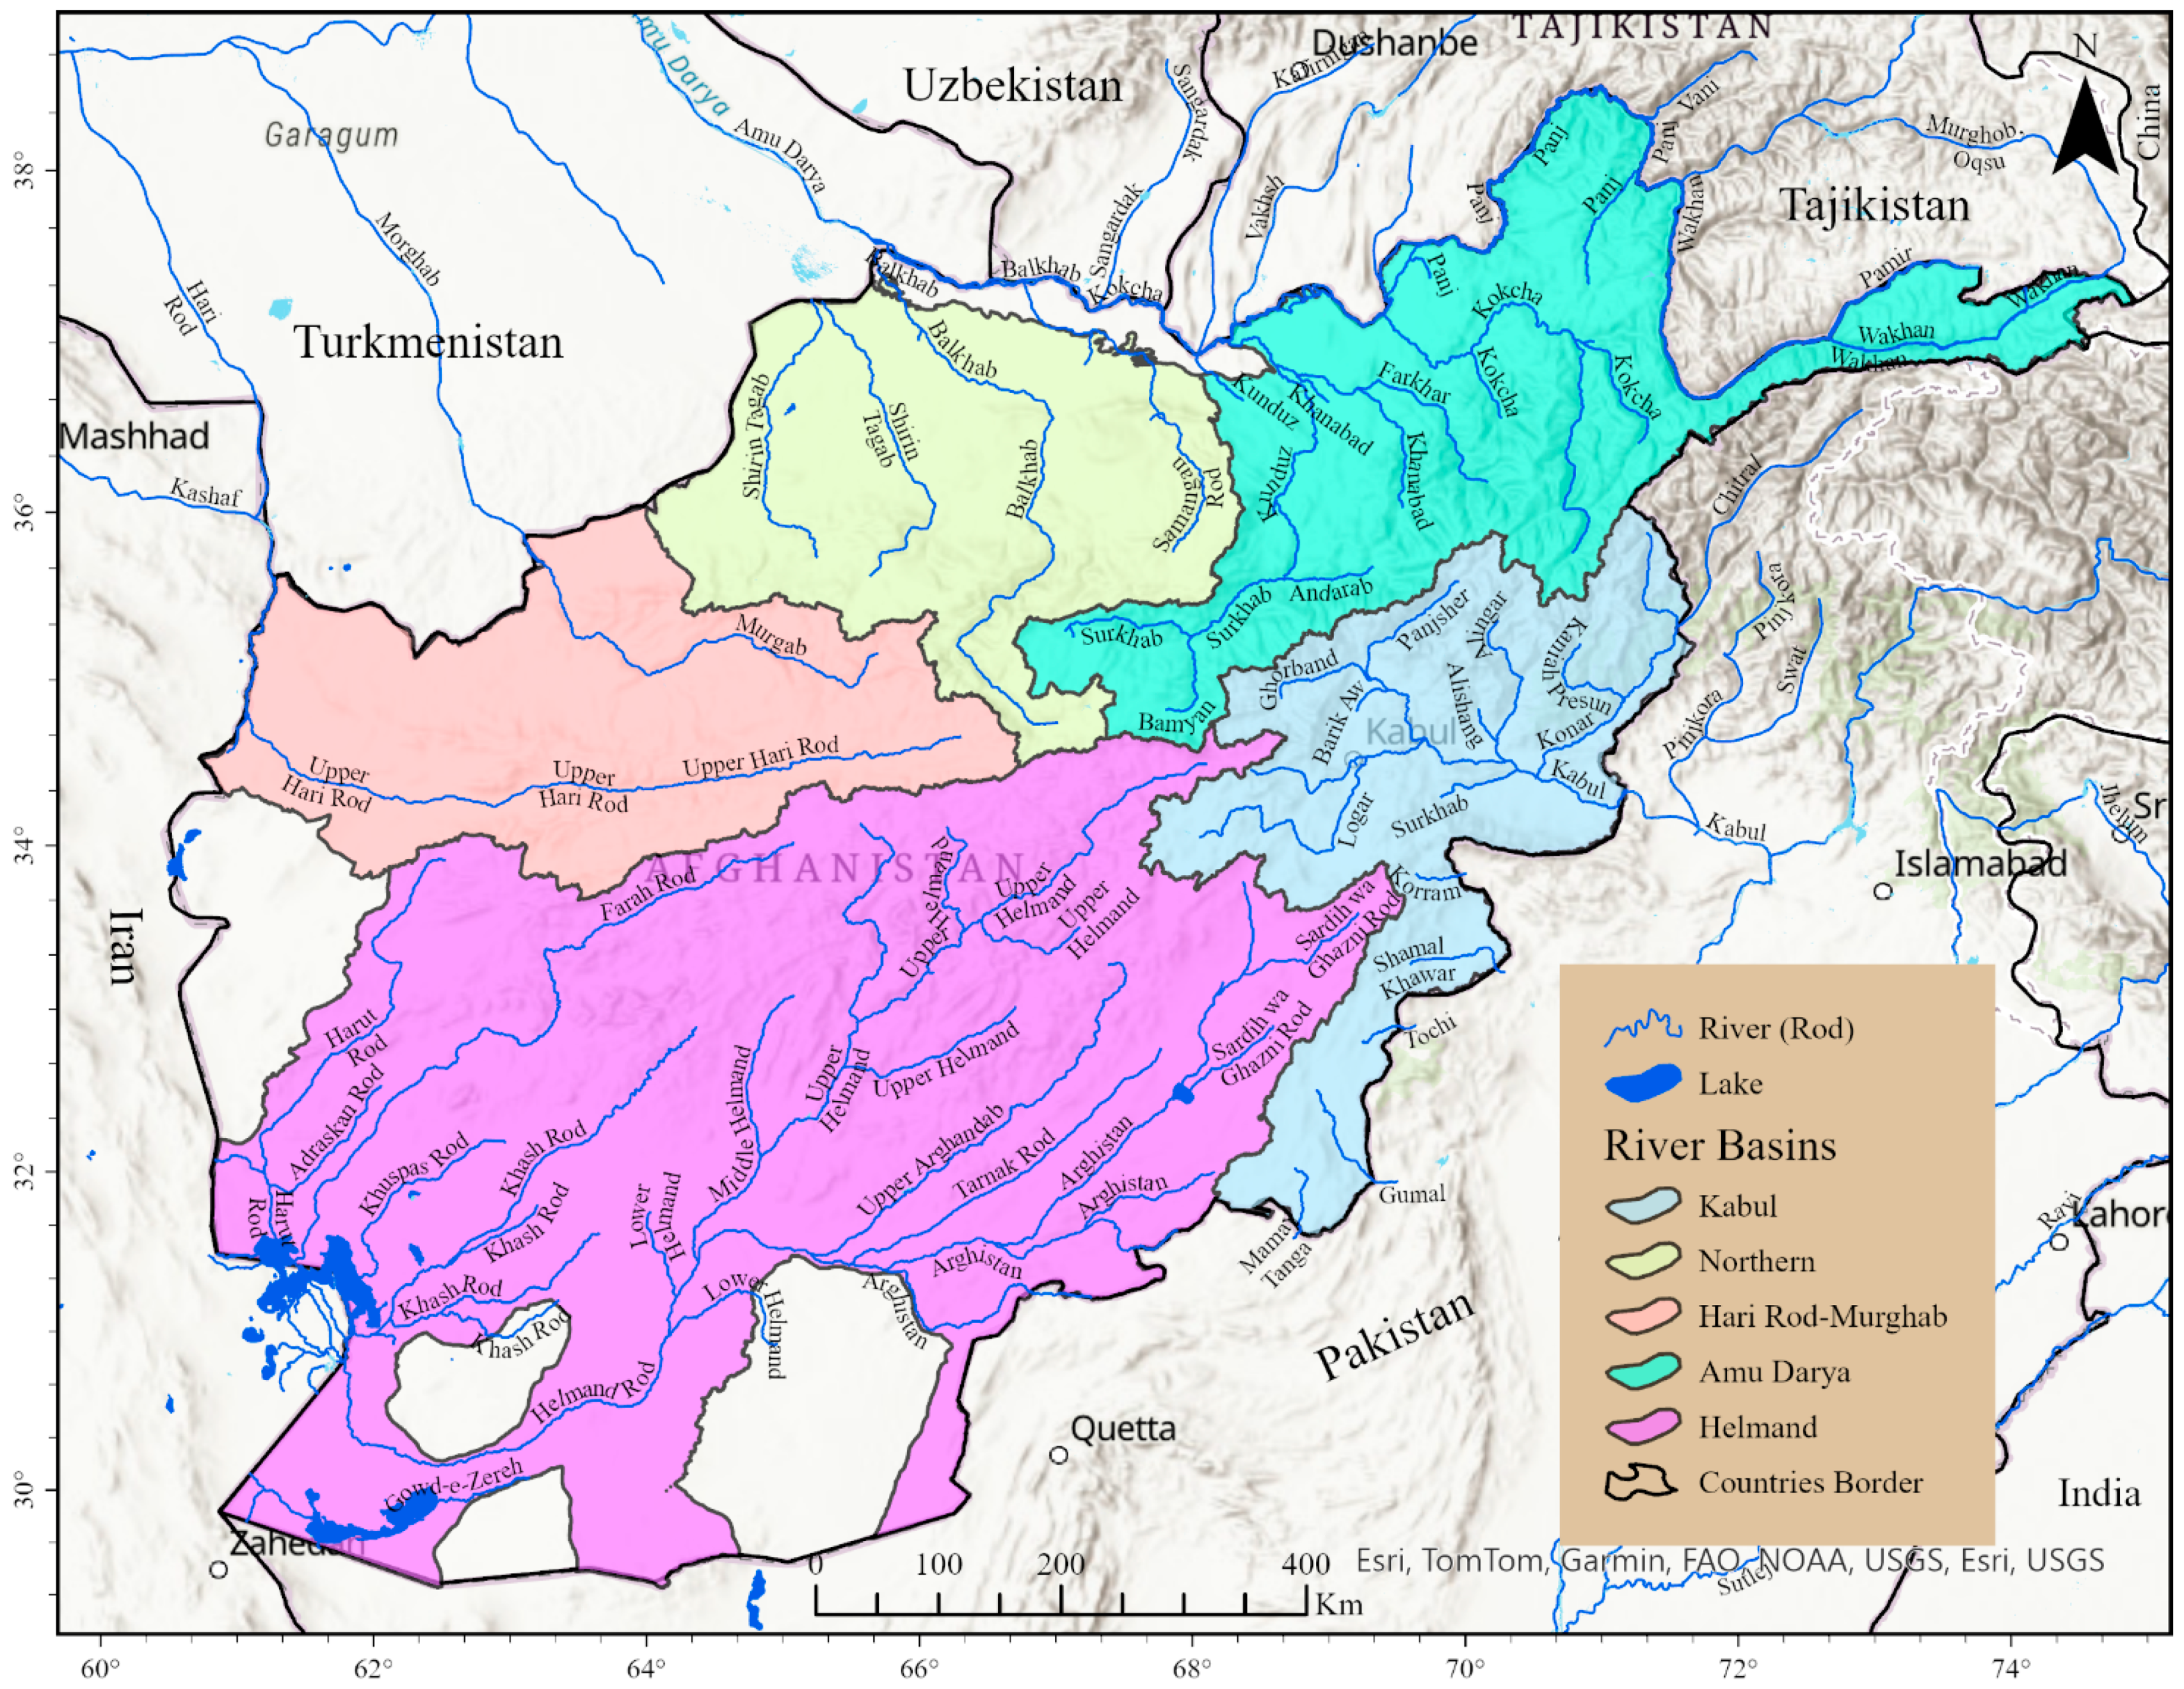
2.1.2. Hydrology
- Kabul River Basin: This basin covers 71,266 km2 and drains into the Indus River, contributing to flows that reach the Arabian Sea;
- Amu Darya River Basin: One of Central Asia’s longest rivers, covering 95,946 km2 in Afghanistan, essential for agriculture in the region and historically connected to the Aral Sea;
- Helmand River Basin: This basin is the largest in Afghanistan, covering 327,662 km2 (51% of the country). The Helmand River flows about 1290 km before reaching the Hamun Wetlands on the Afghanistan–Iran border;
- Harirud-Murghab River Basin: Spanning 78,060 km2, it flows through Herat and forms part of the Afghanistan–Iran border before entering Turkmenistan;
- Northern Basin: The smallest of the five, covering 70,995 km2, drains entirely within Afghanistan and does not contribute to transboundary flows.
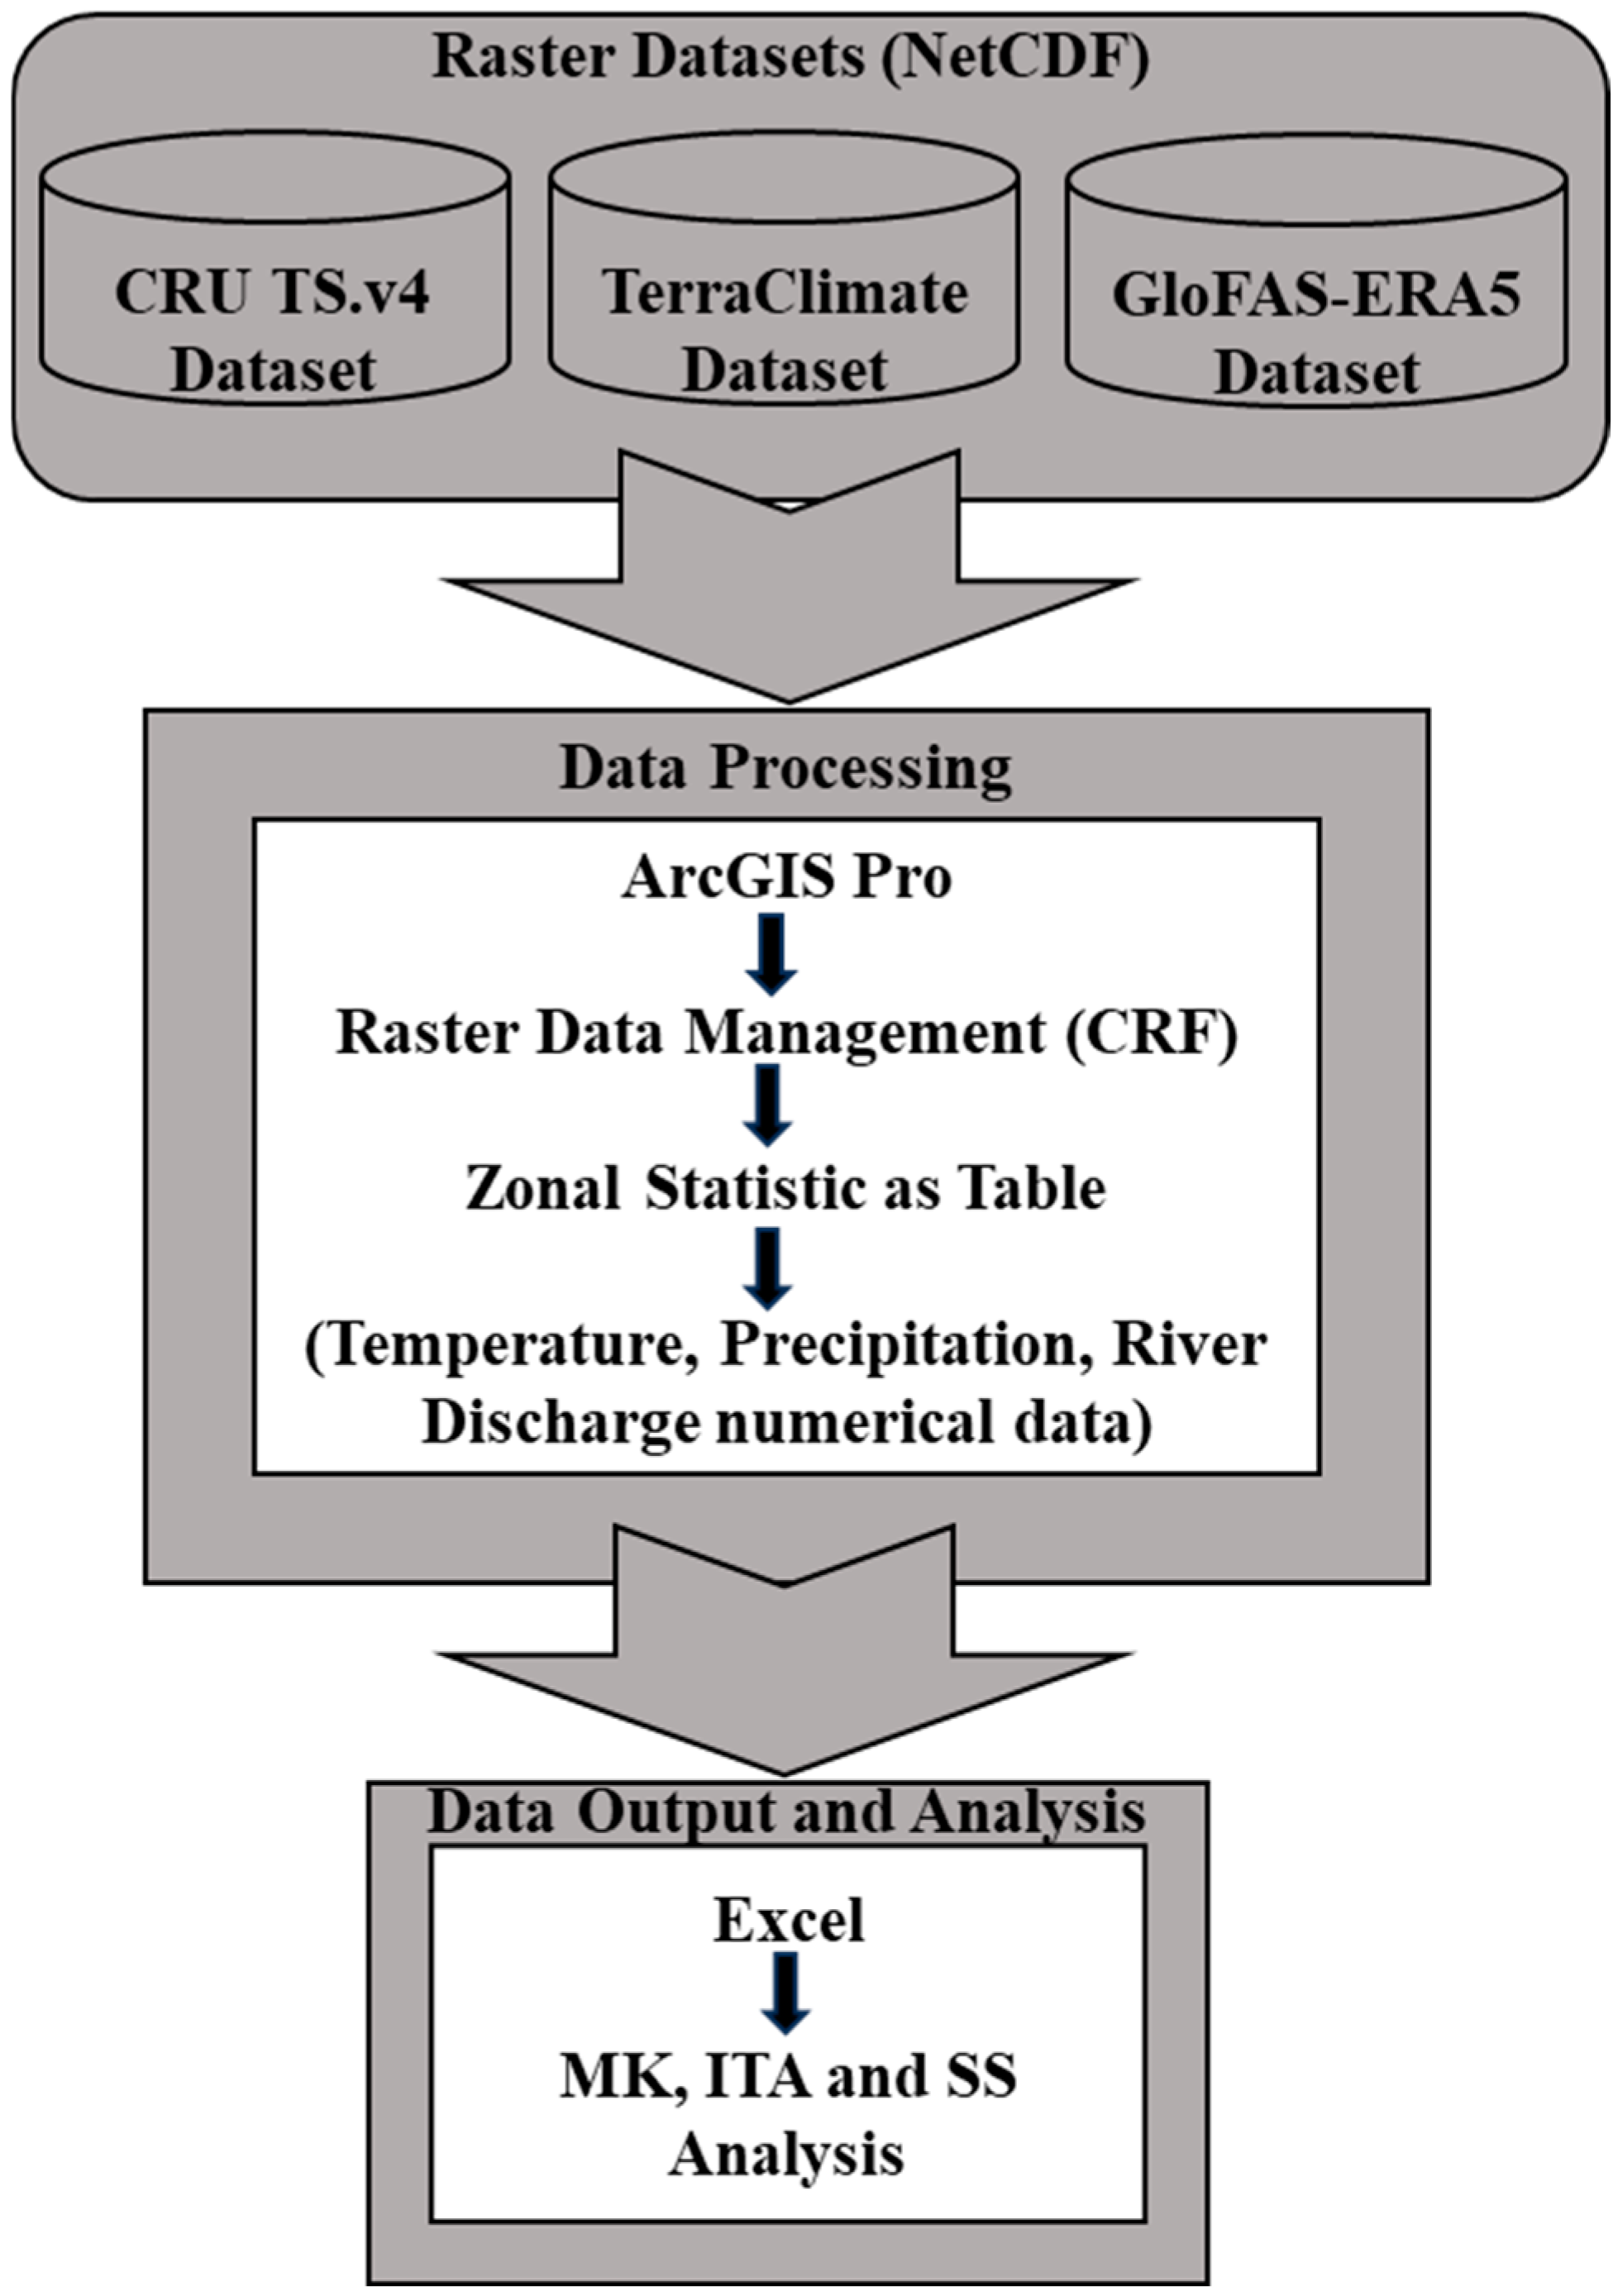
2.2. Data
2.2.1. Temperature
2.2.2. Precipitation
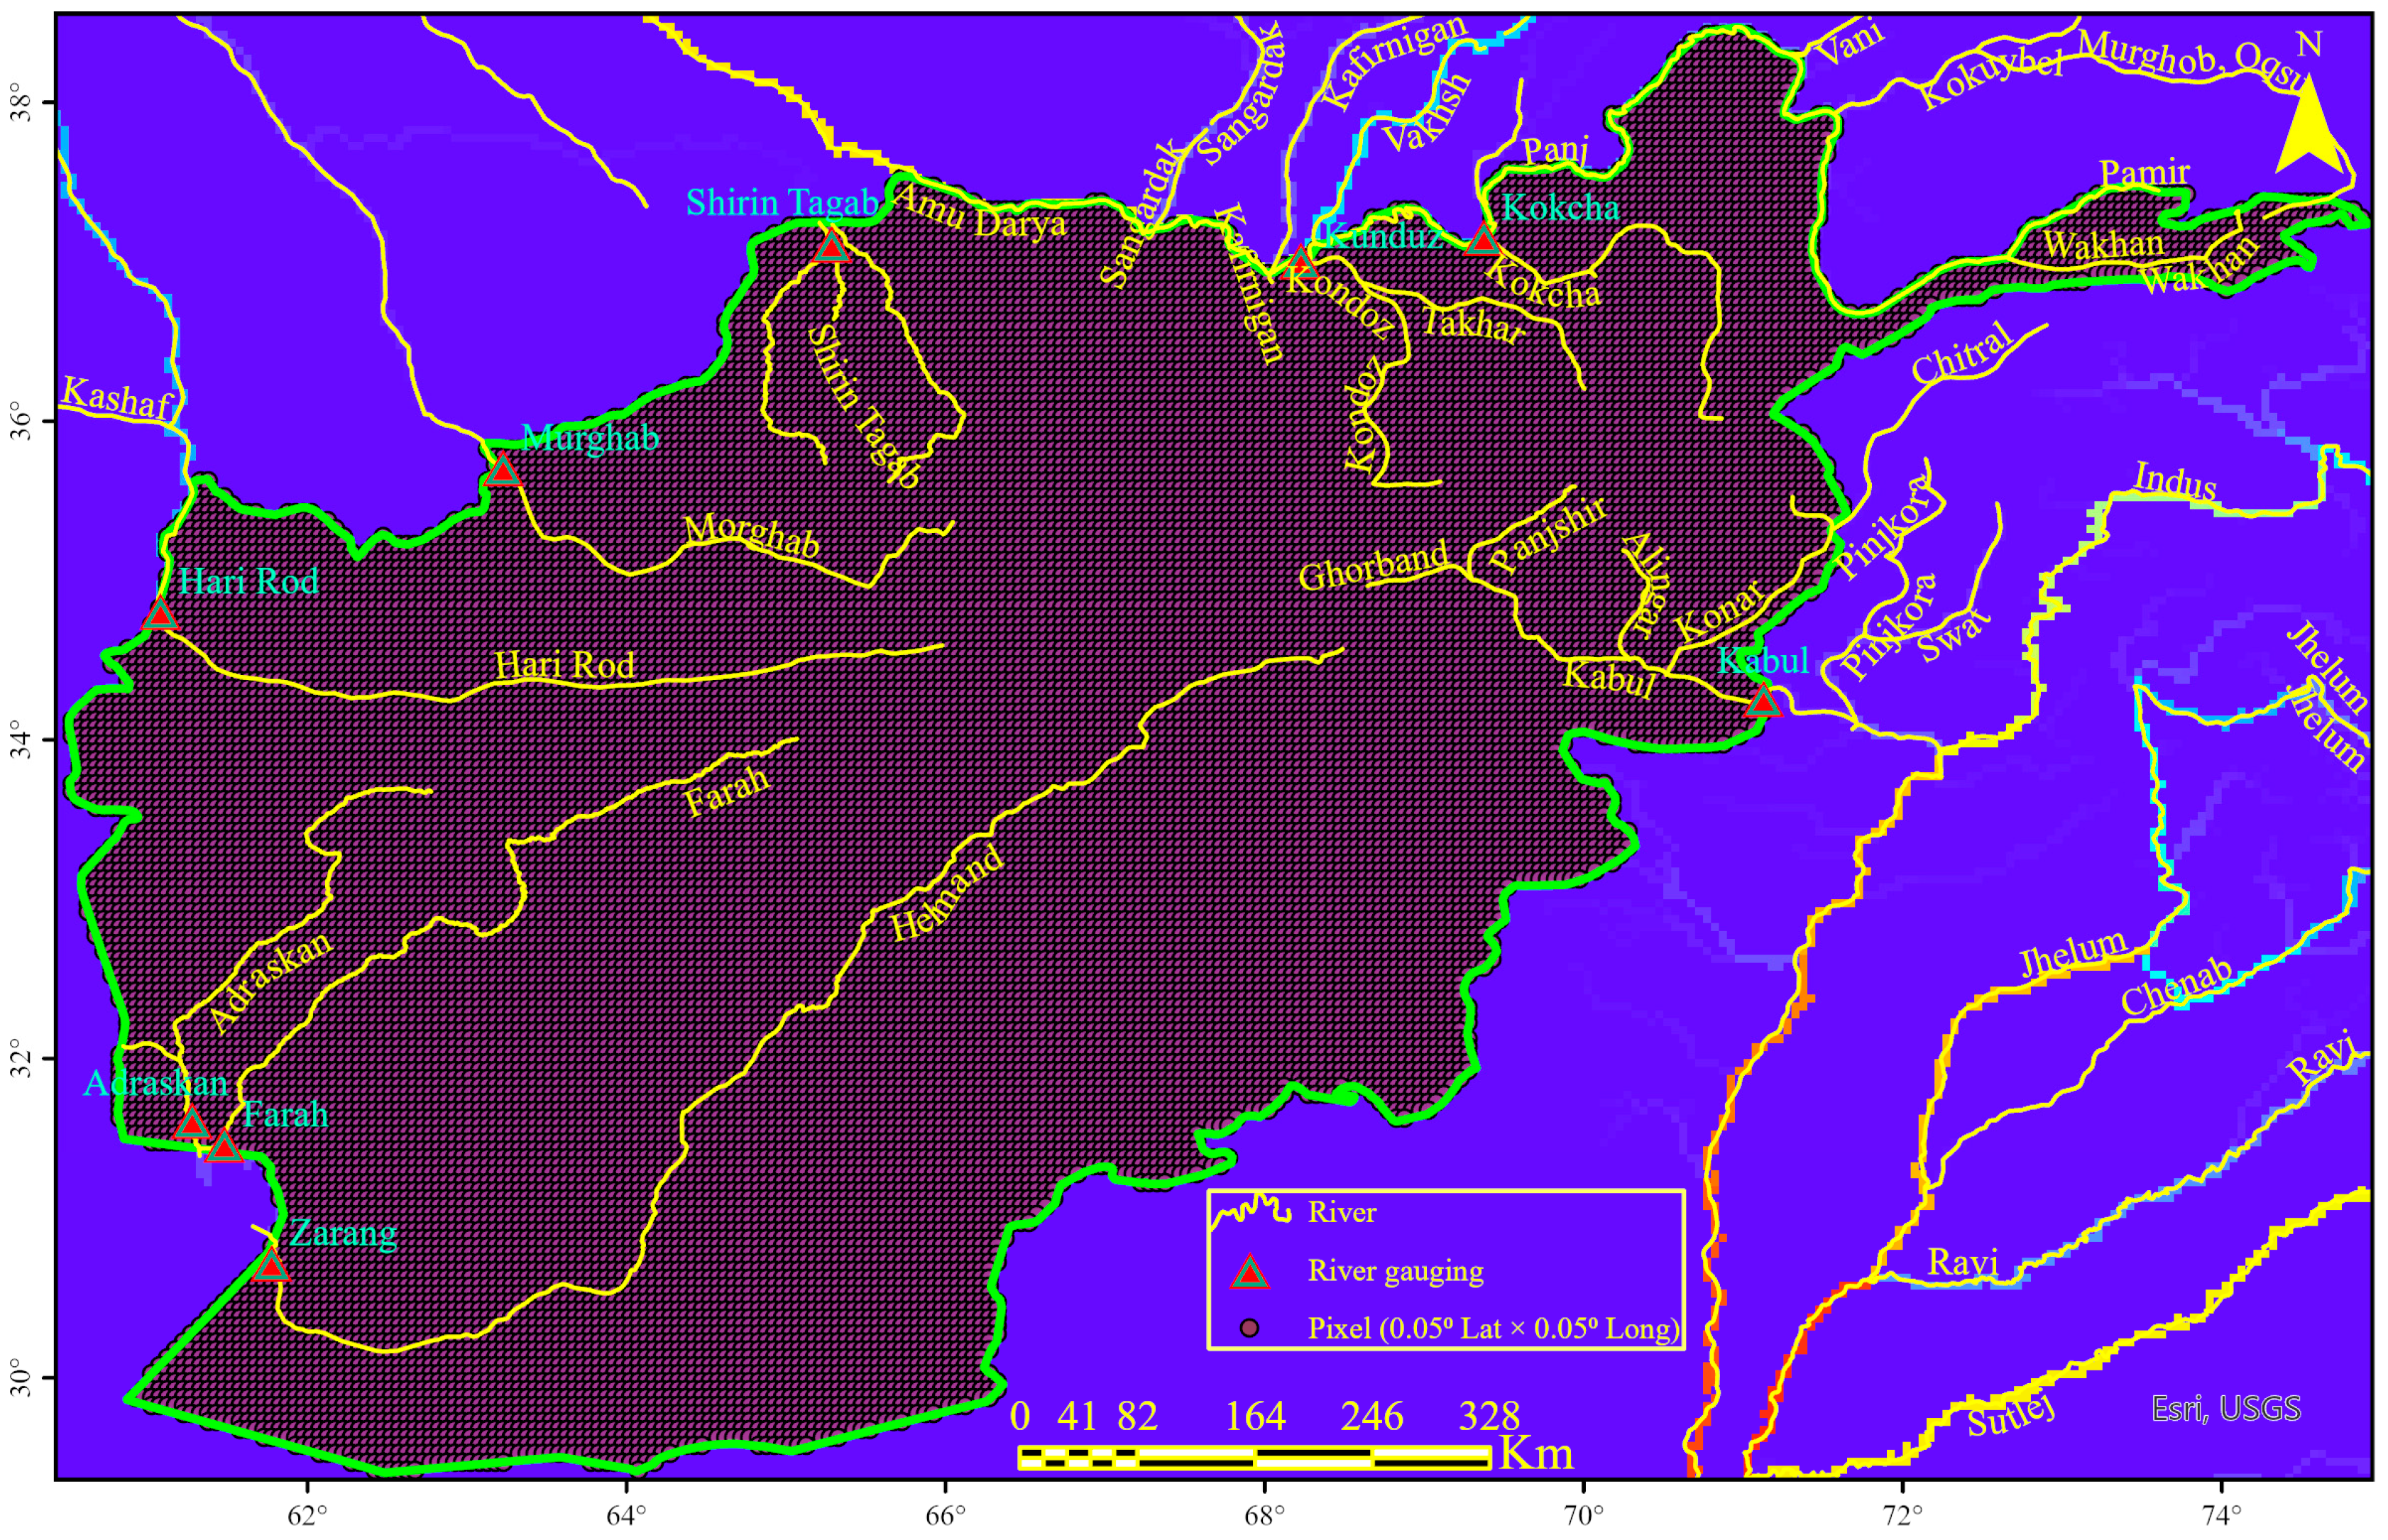
2.2.3. River Discharge
2.3. Analysis Methods
2.3.1. Innovative Trend Analysis (ITA)
2.3.2. Mann–Kendall (MK) Trend Analysis
- Null hypothesis (H0): This assumes no significant trend or effect in the data;
- Alternative hypothesis (H1): This suggests a significant trend (increasing or decreasing) exists.
2.3.3. Sen’s Slope (SS) Analysis
2.4. Data Process and Analysis
3. Results
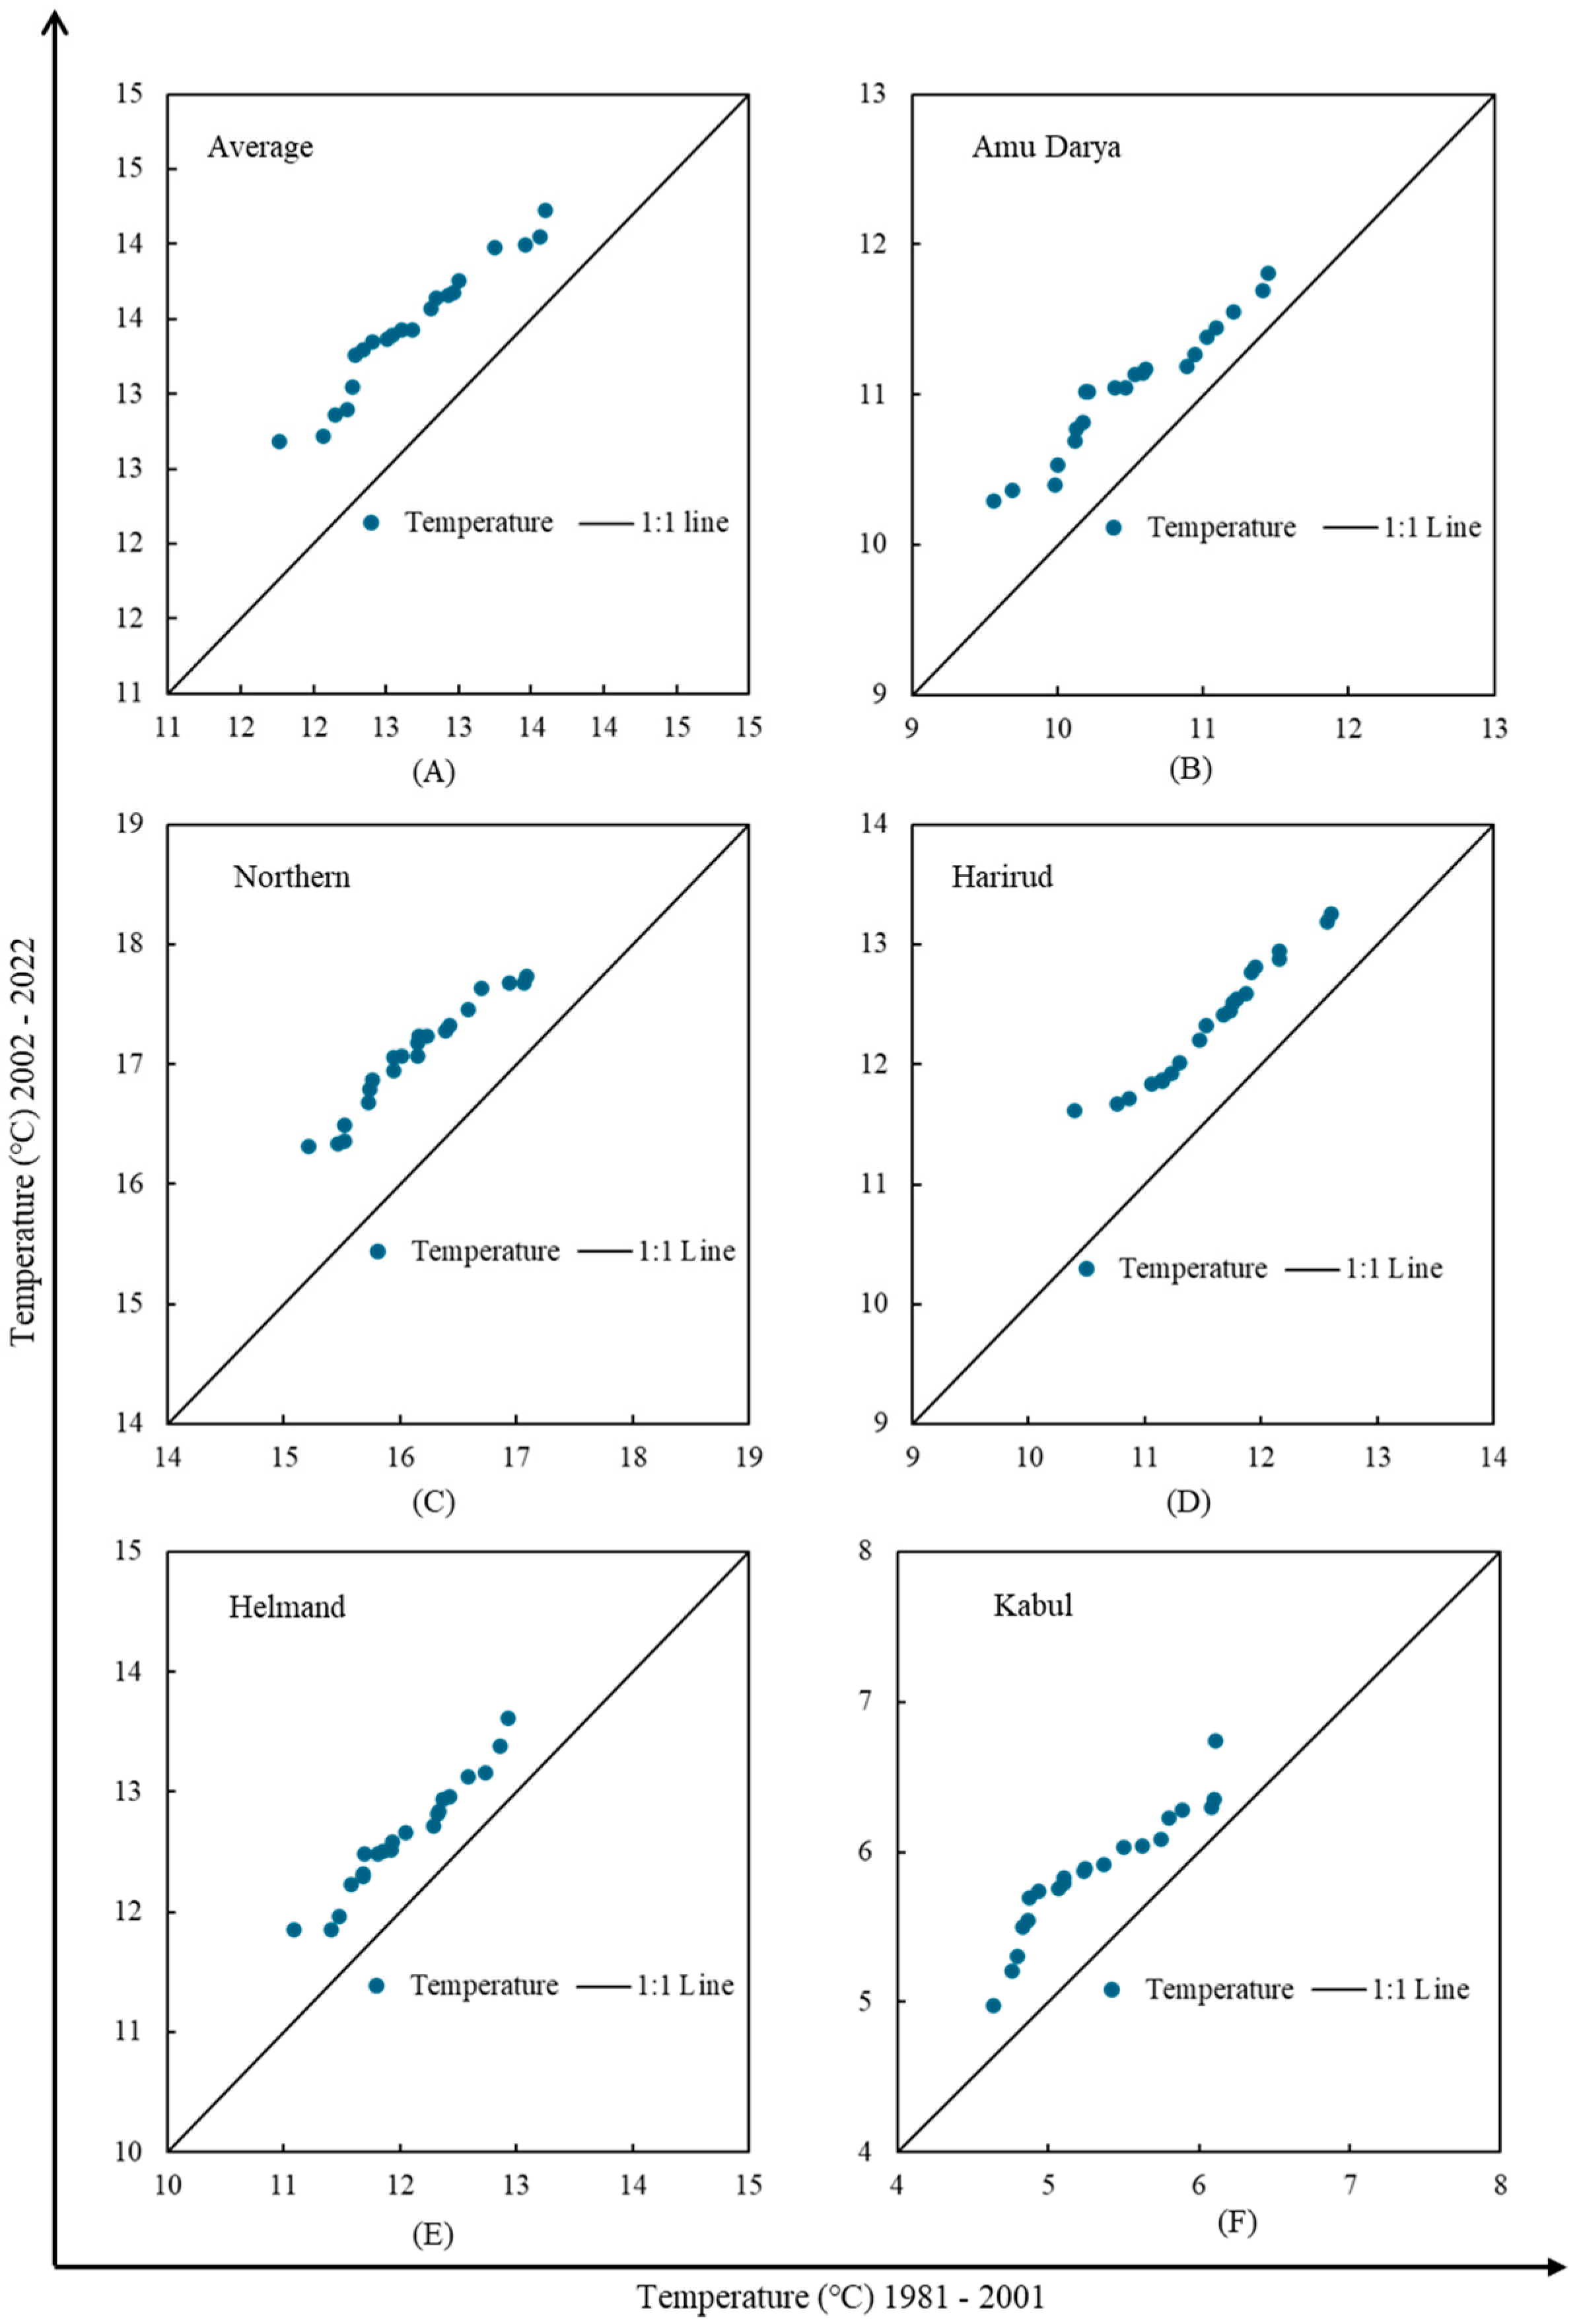
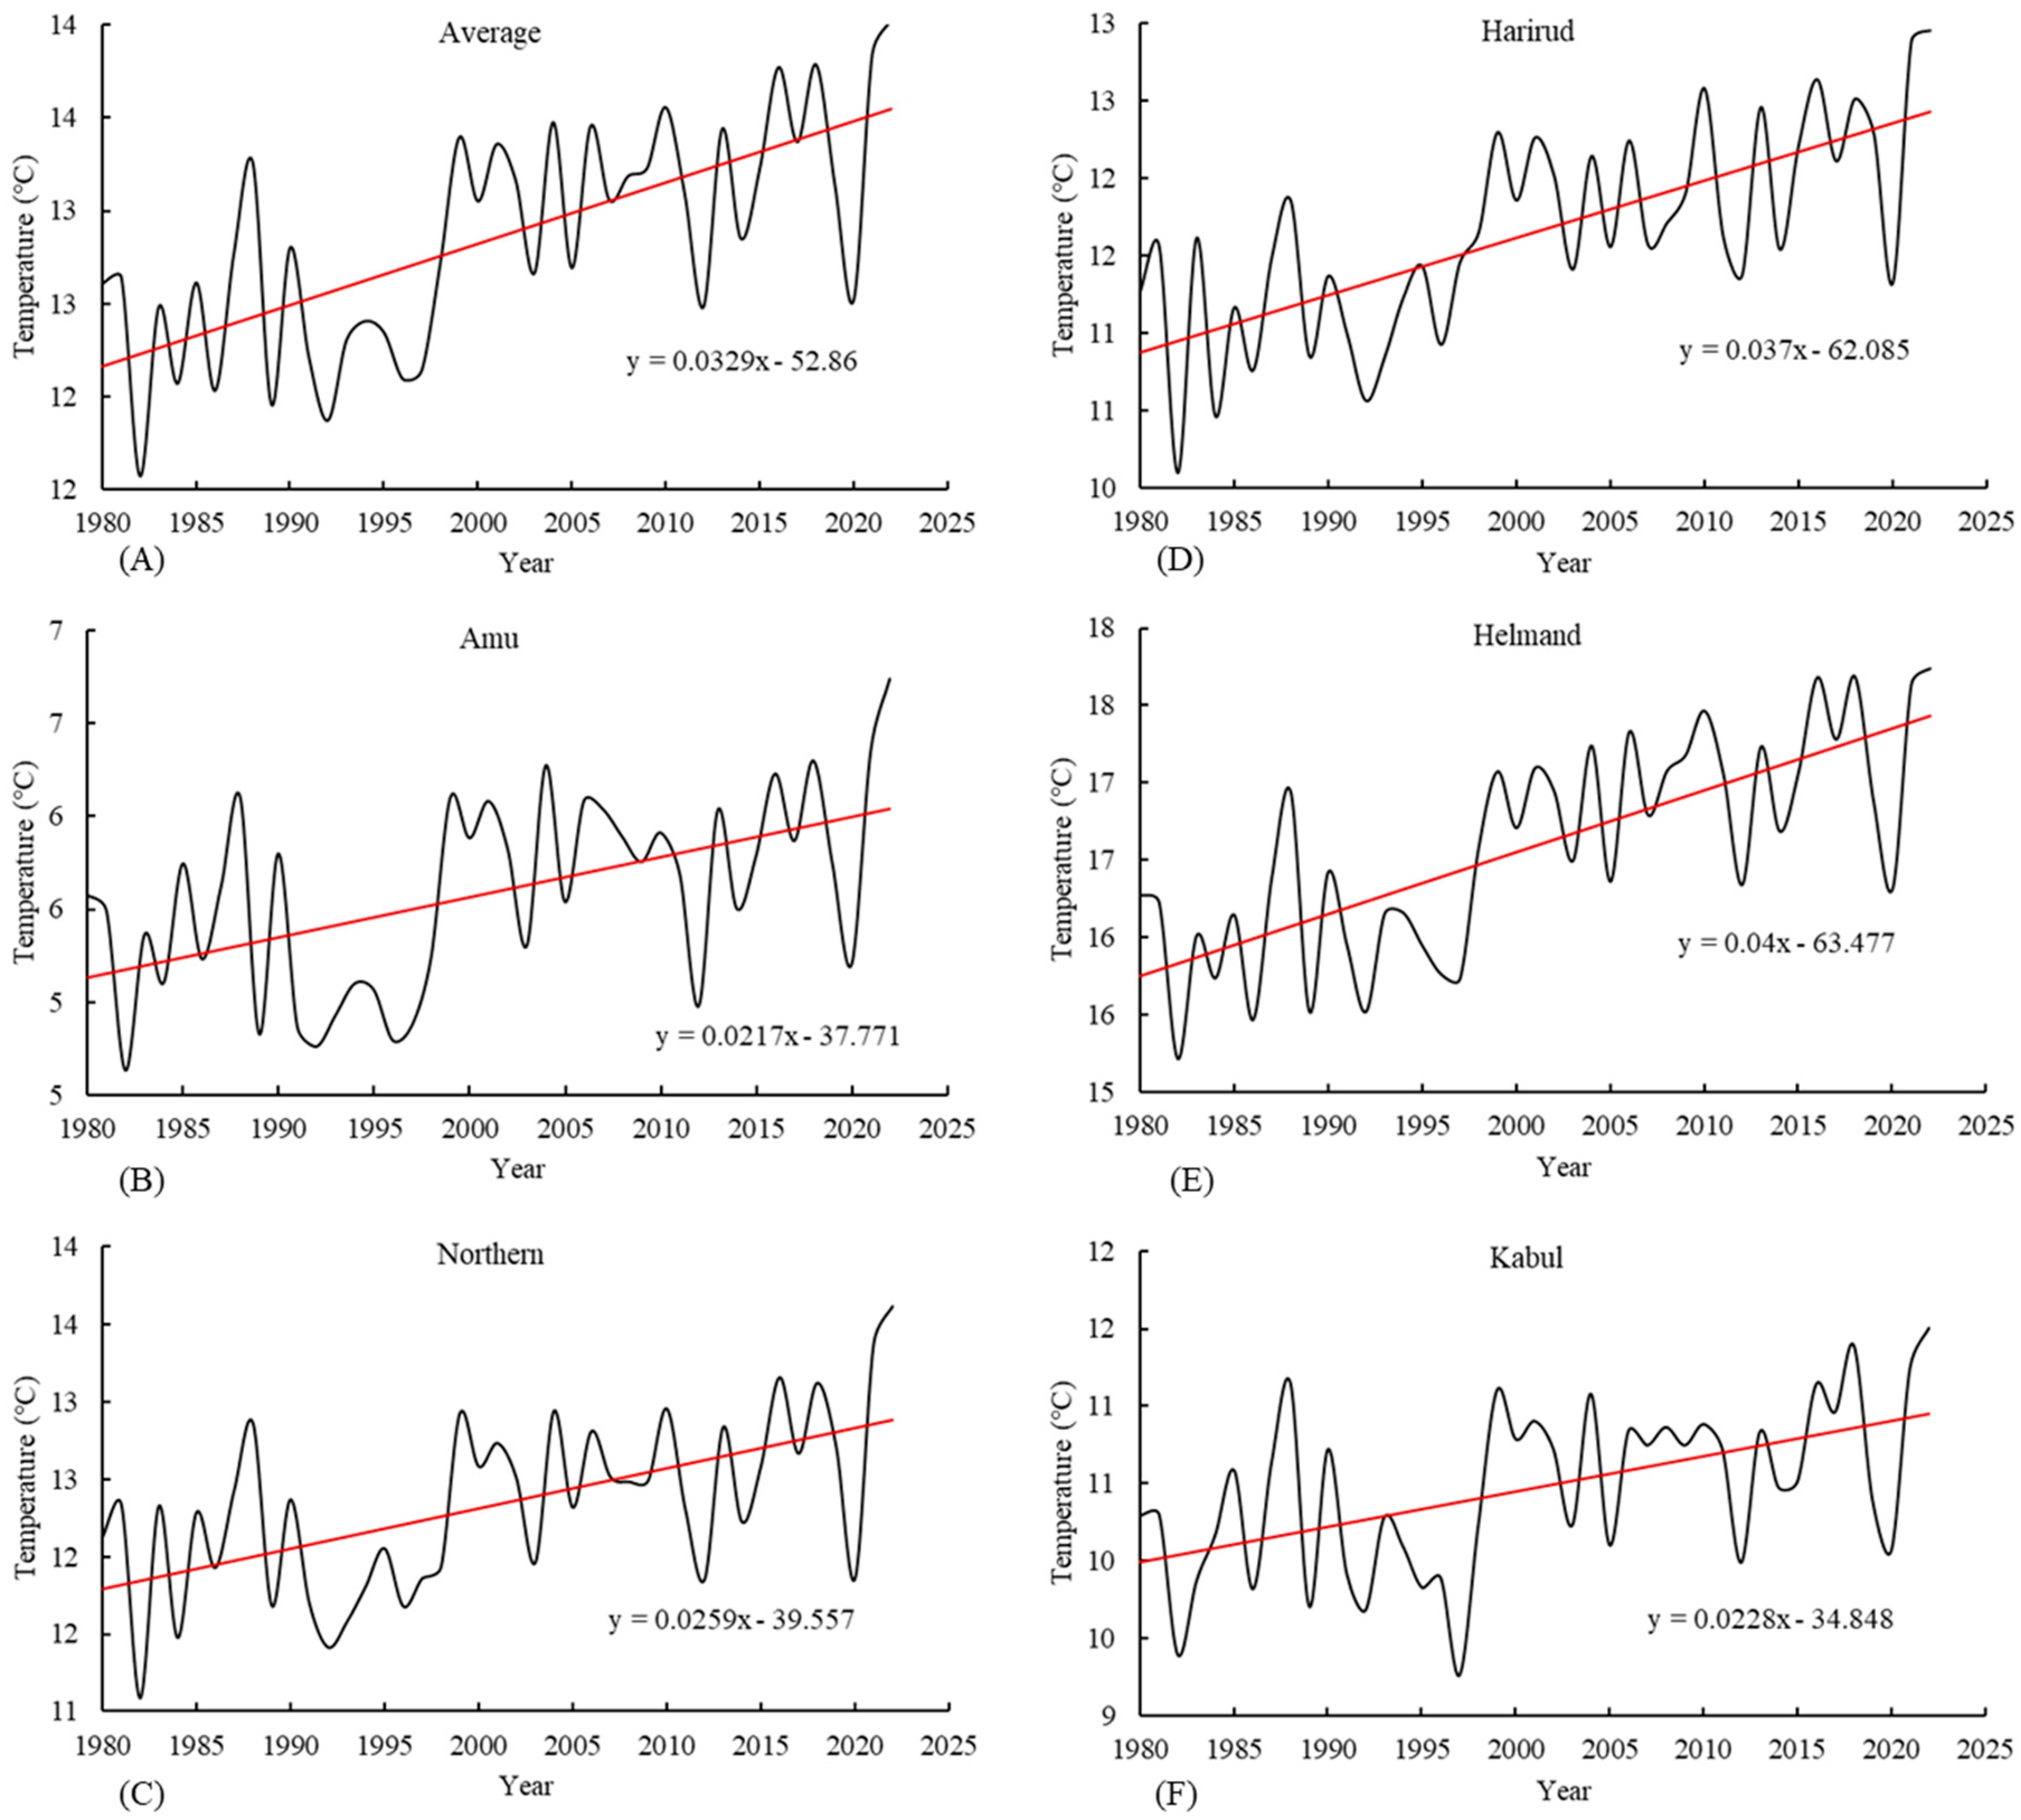
3.1. Temperature Trends
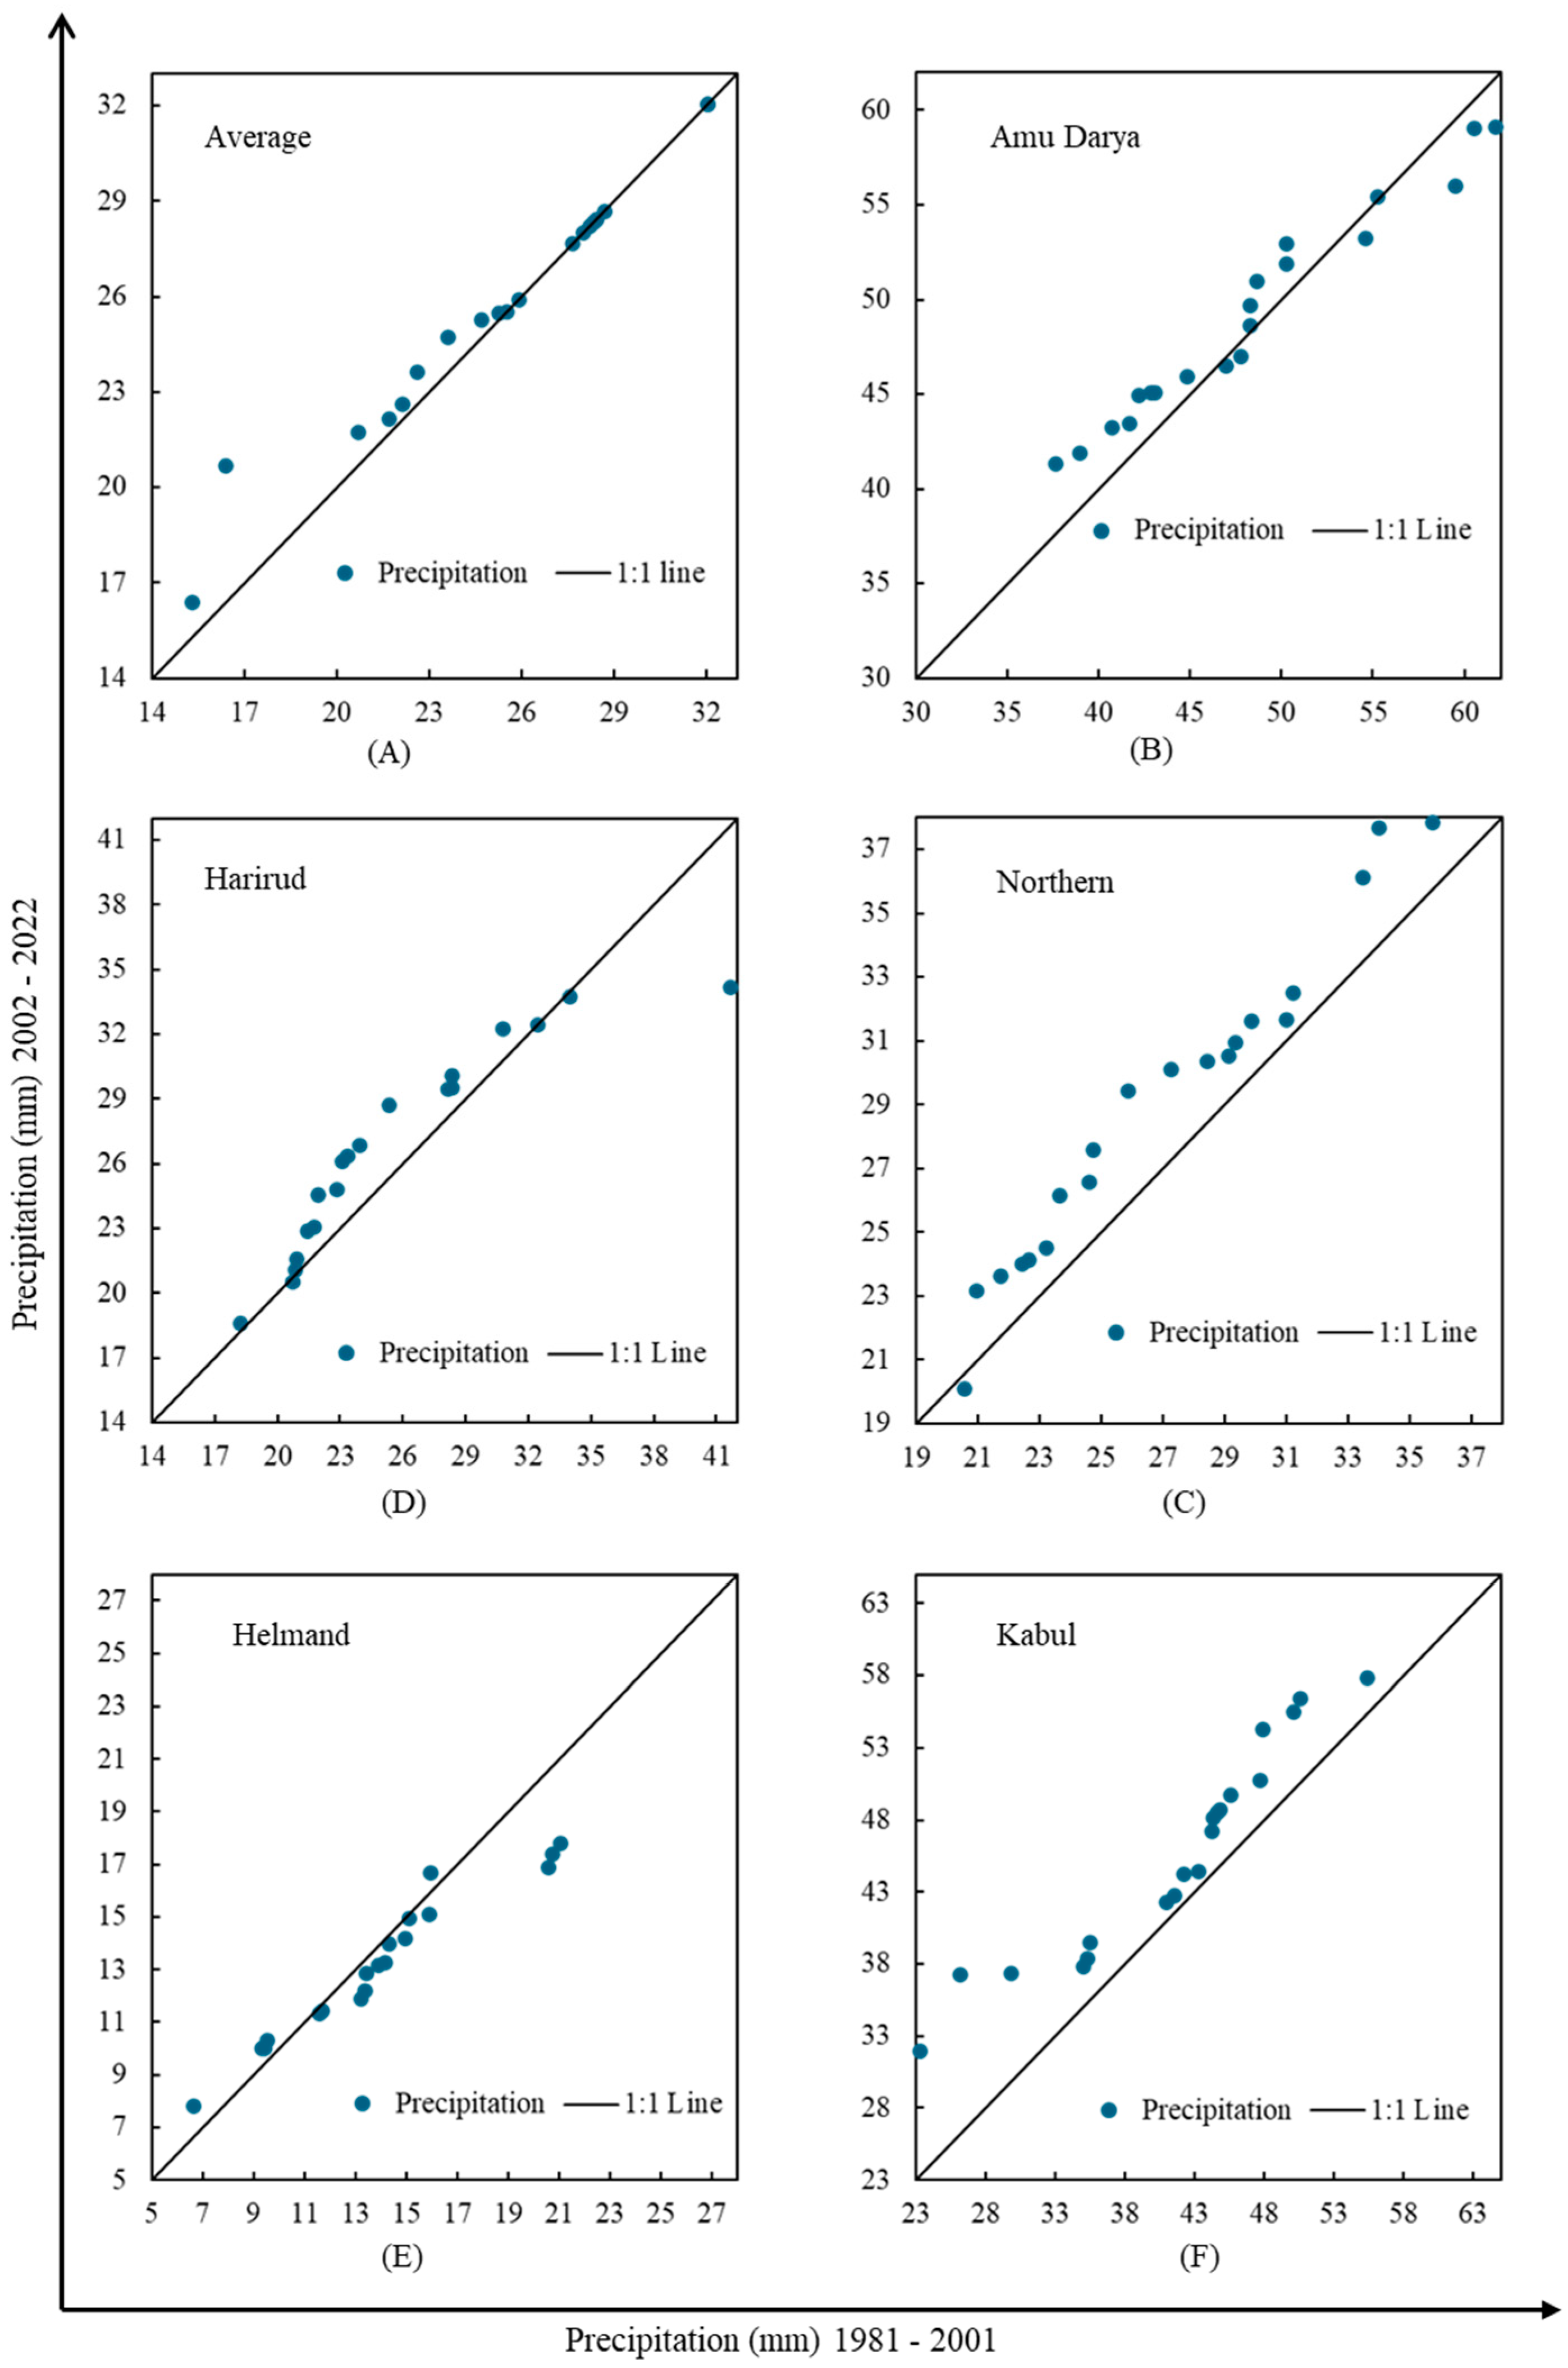
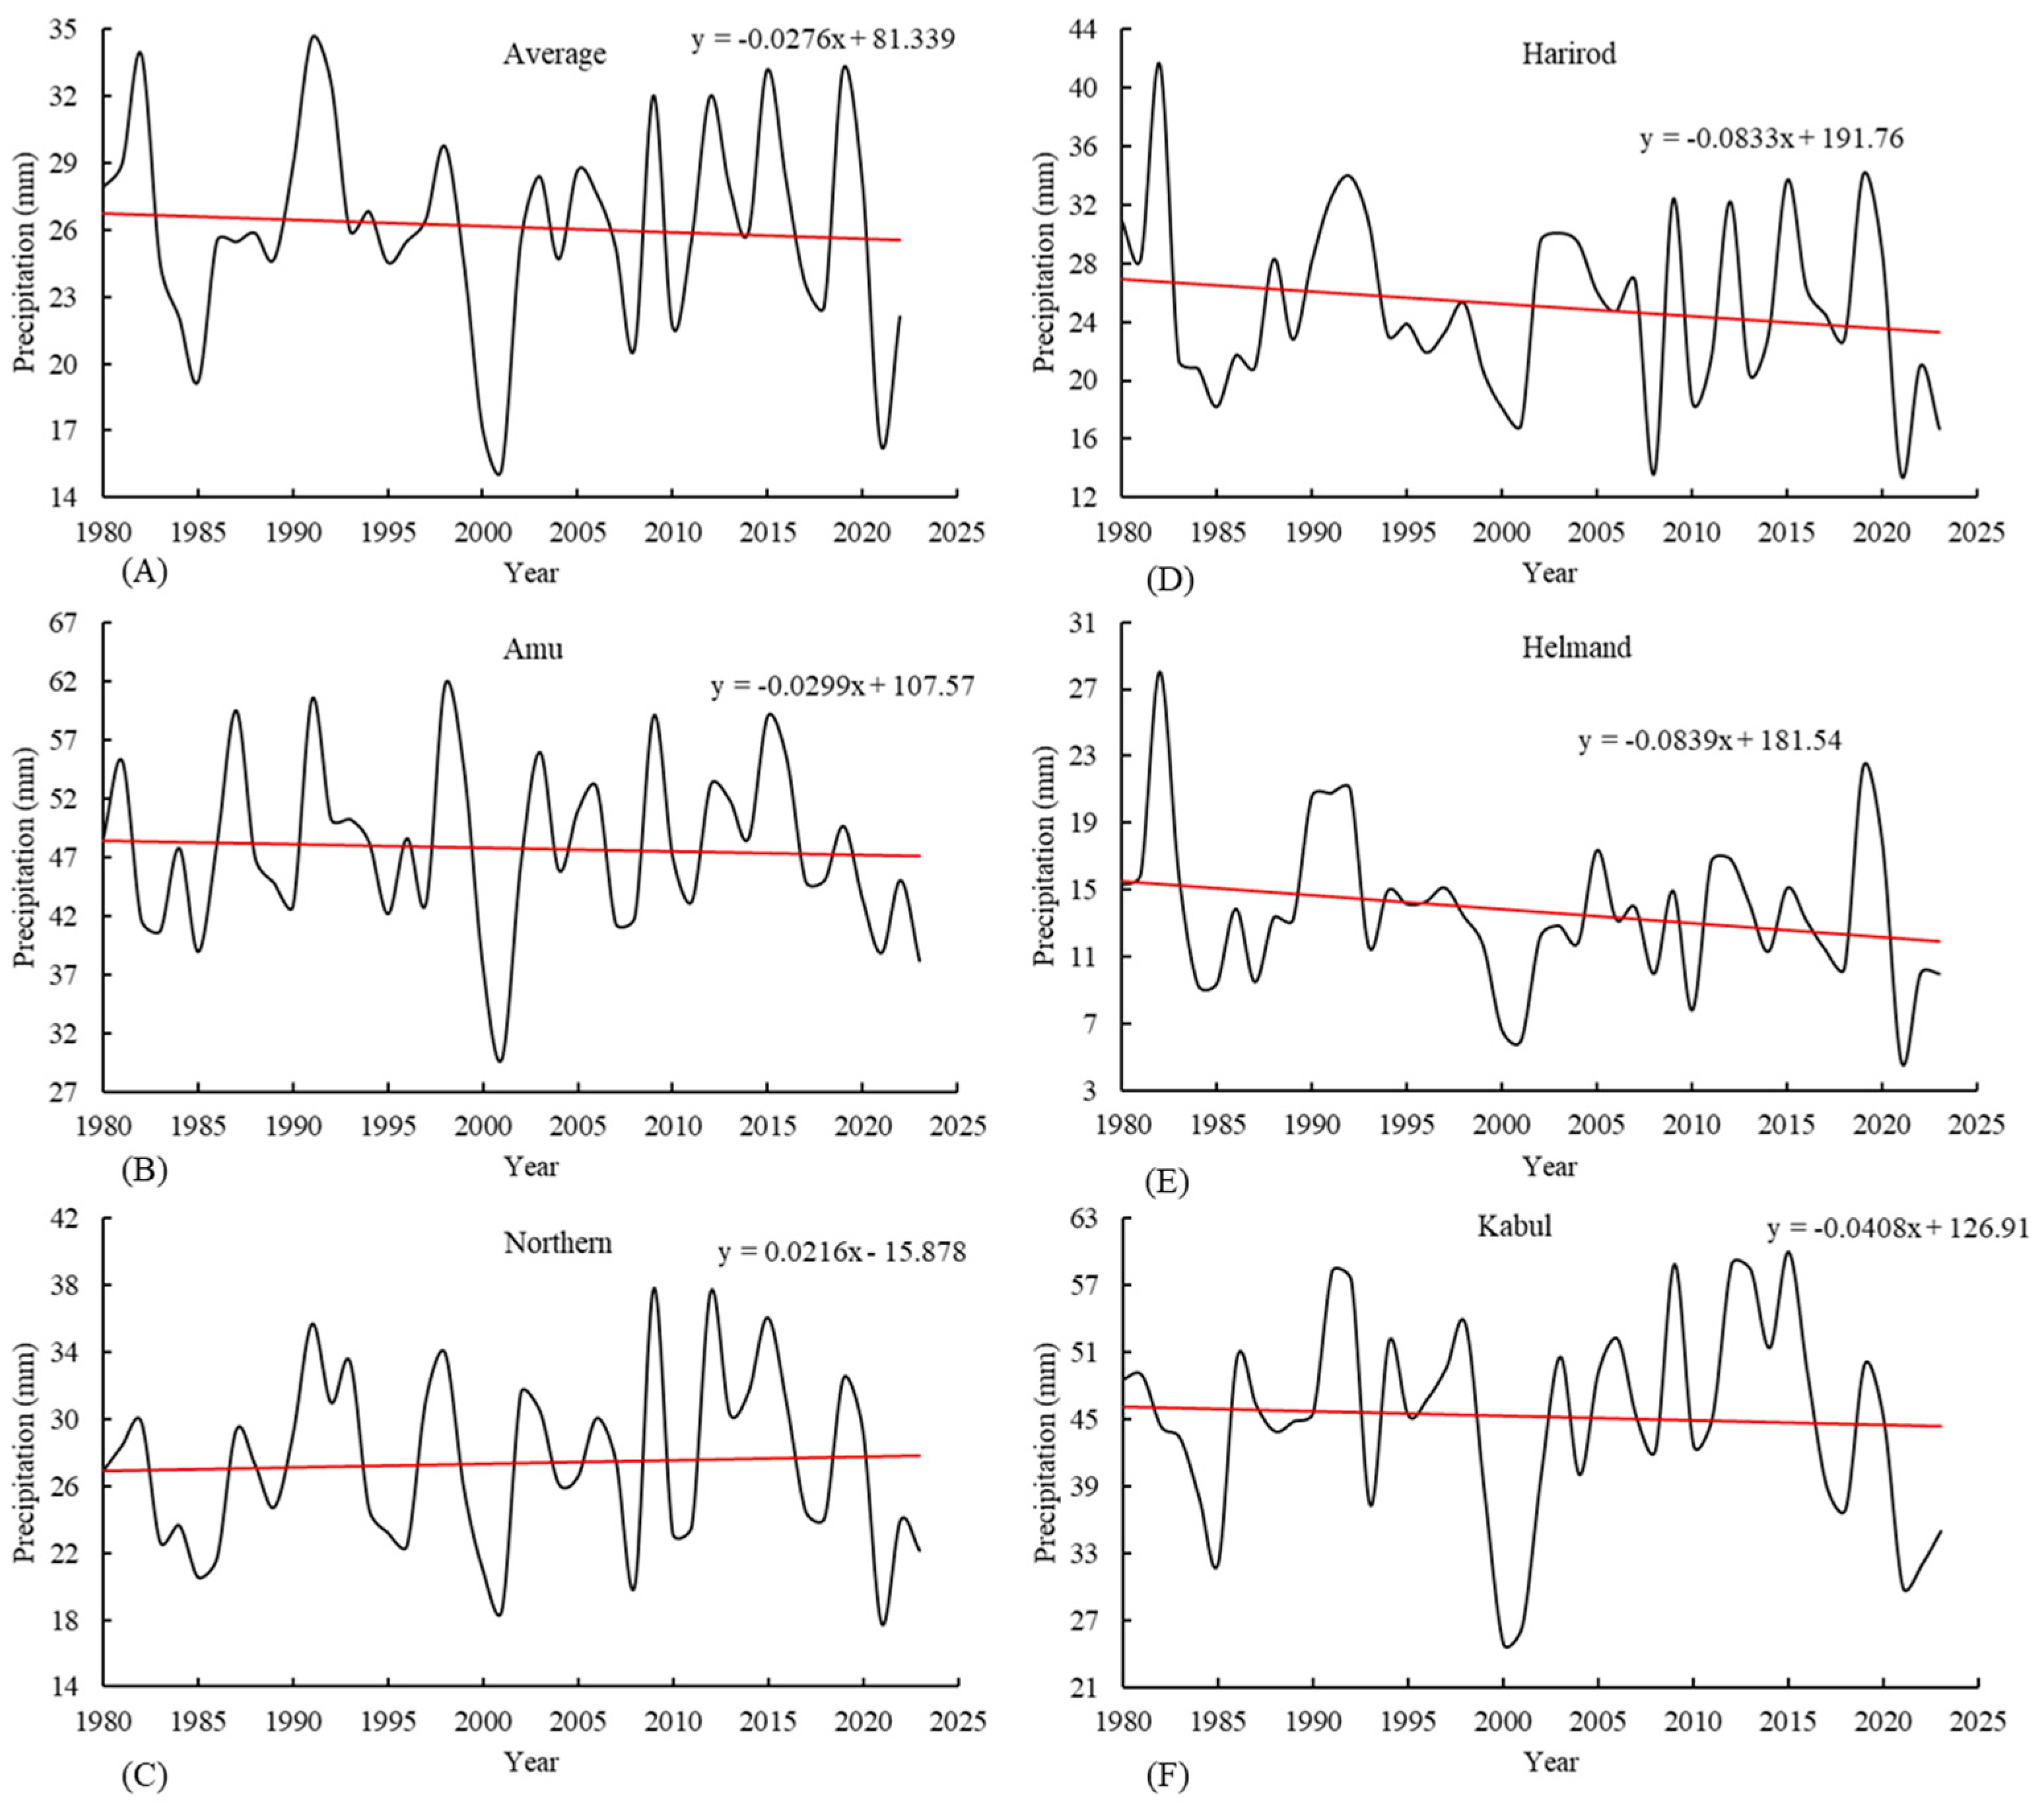
3.2. Precipitation Trends
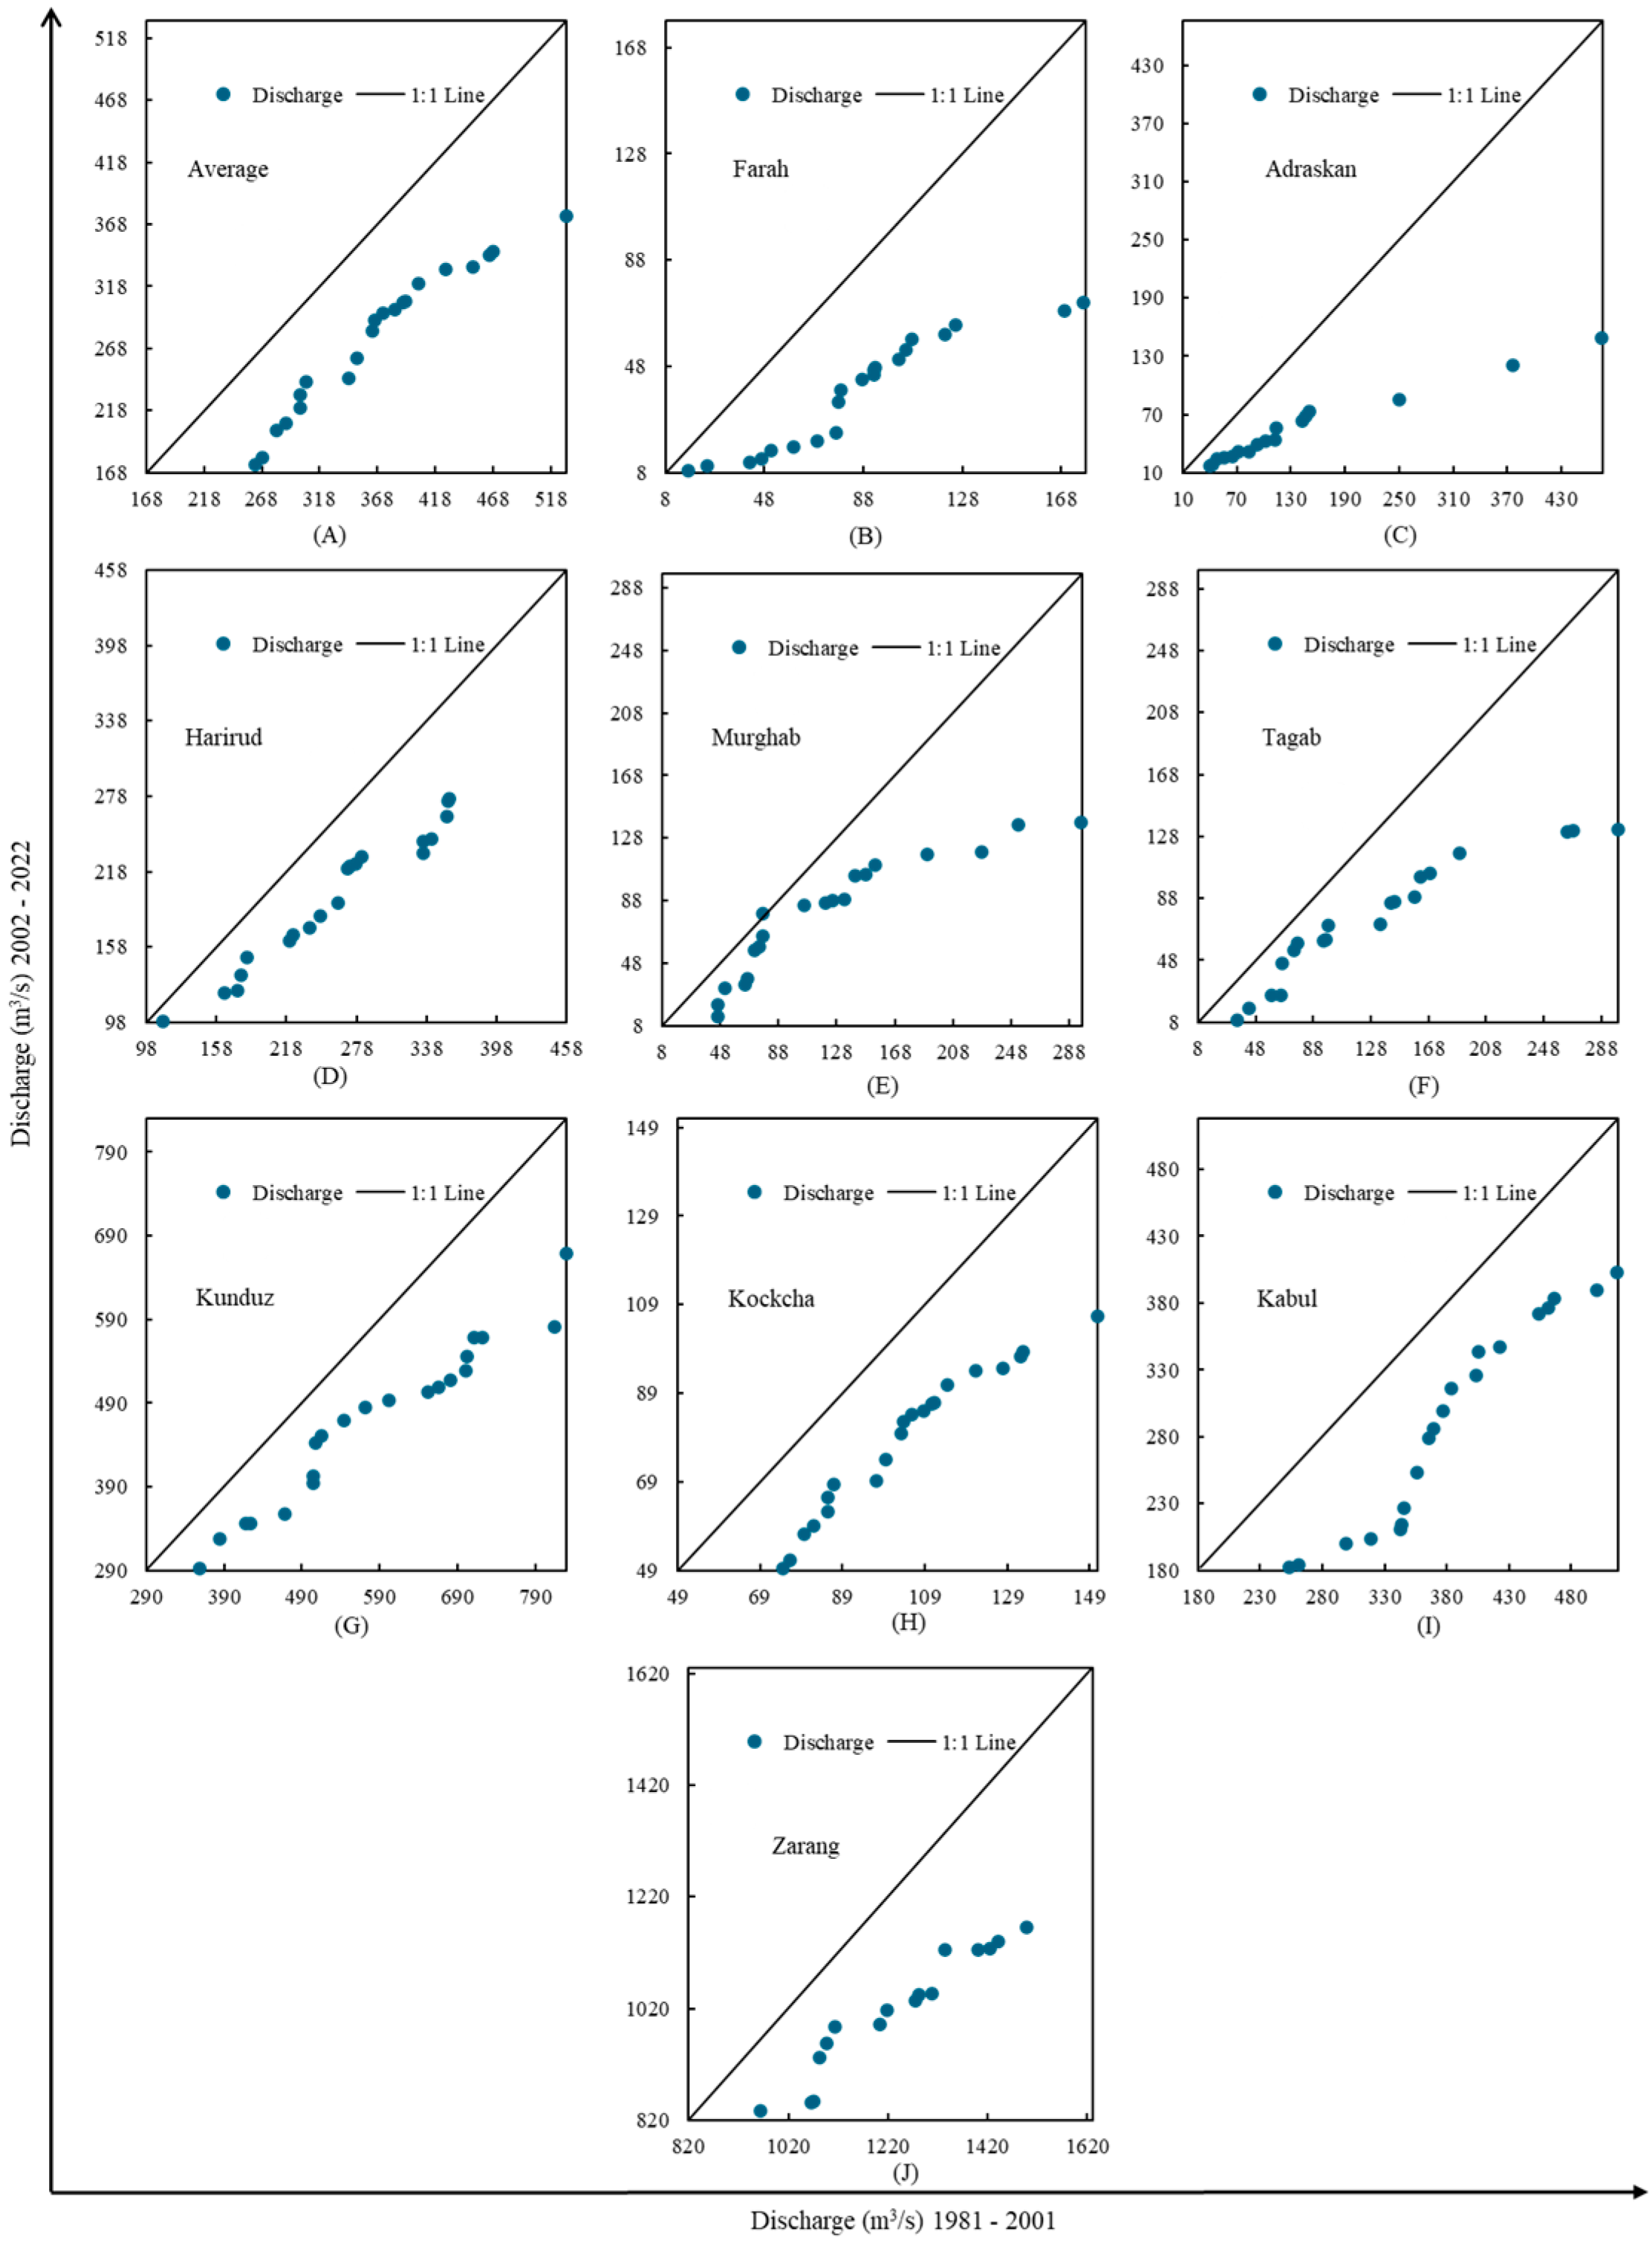
3.3. River Discharge Trend
4. Discussion
- Temperatures Rise and Regional Variations
- Precipitation Decrease and Spatial Heterogeneity
- River Discharge Decreases and Downstream Impacts
5. Limitations
6. Conclusions
Funding
Data Availability Statement
Acknowledgments
Conflicts of Interest
References
- Forster, P.M.; Smith, C.; Walsh, T.; Lamb, W.F.; Lamboll, R.; Hall, B.; Hauser, M.; Ribes, A.; Rosen, D.; Gillett, N.P.; et al. Indicators of Global Climate Change 2023: Annual Update of Key Indicators of the State of the Climate System and Human Influence. Earth Syst. Sci. Data 2024, 16, 2625–2658. [Google Scholar] [CrossRef]
- Calvin, K.; Dasgupta, D.; Krinner, G.; Mukherji, A.; Thorne, P.W.; Trisos, C.; Romero, J.; Aldunce, P.; Barrett, K.; Blanco, G.; et al. Summary for Policymakers in: Climate Change 2023: Synthesis Report. In Contribution of Working Groups I, II, and III to the Sixth Assessment Report of the Intergovernmental Panel on Climate Change; Arias, P., Bustamante, M., Elgizouli, I., Flato, G., Howden, M., Méndez-Vallejo, C., Pereira, J.J., Pichs-Madruga, R., Rose, S.K., Saheb, Y., et al., Eds.; Intergovernmental Panel on Climate Change (IPCC): Geneva, Switzerland, 2023. [Google Scholar]
- WMO. State of the Climate in Asia 2022; World Meteorological Organization (WMO): Geneva, Switzerland, 2023. [Google Scholar]
- Shaw, R.; Luo, Y.; Cheong, T.S.; Abdul Halim, S.; Chaturvedi, S.; Hashizume, M.; Insarov, G.E.; Ishikawa, Y.; Safari, M.; Kitoh, A.; et al. Asia. In: Climate Change 2022: Impacts, Adaptation and Vulnerability. Contribution of Working Group II to the Sixth Assessment Report of the Intergovernmental Panel on Climate Change. In IPCC Sixth Assessment Report Impacts, Adaptation and Vulnerability; Pörtner, H.-O., Roberts, D.C., Tignor, M., Poloczanska, E.S., Mintenbeck, K., Alegría, A., Craig, M., Langsdorf, S., Löschke, S., Möller, V., et al., Eds.; Cambridge University Press: Cambridge, UK; New York, NY, USA, 2022; pp. 1457–1578. [Google Scholar] [CrossRef]
- Mukherji, A.; Molden, D.; Nepal, S.; Rasul, G.; Wagnon, P. Himalayan Waters at the Crossroads: Issues and Challenges. Int. J. Water Resour. Dev. 2015, 31, 151–160. [Google Scholar] [CrossRef]
- Yao, T.; Bolch, T.; Chen, D.; Gao, J.; Immerzeel, W.; Piao, S.; Su, F.; Thompson, L.; Wada, Y.; Wang, L.; et al. The Imbalance of the Asian Water Tower. Nat. Rev. Earth Environ. 2022, 3, 618–632. [Google Scholar] [CrossRef]
- Shroder, J.F. Hydrogeography (Drainage Basins and Rivers) of Afghanistan and Neighboring Countries. In Transboundary Water Resources in Afghanistan: Climate Change and Land-Use Implications; Elsevier Inc.: Amsterdam, The Netherlands, 2016; pp. 23–40. ISBN 9780128018866. [Google Scholar]
- Saidmamatov, O.; Rudenko, I.; Pfister, S.; Koziel, J. Water-Energy-Food Nexus Framework for Promoting Regional Integration in Central Asia. Water 2020, 12, 1896. [Google Scholar] [CrossRef]
- Bolch, T.; Shea, J.M.; Liu, S.; Azam, F.M.; Gao, Y.; Gruber, S.; Immerzeel, W.W.; Kulkarni, A.; Li, H.; Tahir, A.A.; et al. Status and Change of the Cryosphere in the Extended Hindu Kush Himalaya Region. In The Hindu Kush Himalaya Assessment: Mountains, Climate Change, Sustainability and People; Wester, P., Mishra, A., Mukherji, A., Shrestha, A.B., Eds.; Springer International Publishing: Cham, Switzerland, 2019; pp. 209–255. ISBN 978-3-319-92288-1. [Google Scholar]
- Savage, M.; Dougherty, B.; Hamza, M.; Butterfield, R.; Bharwani, S. Socio-Economic Impacts of Climate in Afghanistan: A Report to the Department for International Development; Stockholm Environment Institute: Stockholm, Sweden, 2009. [Google Scholar]
- Hayat, E.; Tayfur, G. Meteorological Drought and Trend Effects on Transboundary River Basins in Afghanistan. Theor. Appl. Climatol. 2023, 154, 1253–1275. [Google Scholar] [CrossRef]
- Akhundzadah, N.A.; Soltani, S.; Aich, V. Impacts of Climate Change on the Water Resources of the Kunduz River Basin, Afghanistan. Climate 2020, 8, 102. [Google Scholar] [CrossRef]
- Mehrad, A.T. Assessment of Climate Change Impacts on Environmental Sustainability in Afghanistan. In Proceedings of the E3S Web of Conferences; EDP Sciences, Yekaterinburg, Russia, 28–29 September 2020; Volume 208. [Google Scholar] [CrossRef]
- Bajracharya, S.R.; Maharjan, S.B.; Shrestha, F.; Guo, W.; Liu, S.; Immerzeel, W.; Shrestha, B. The Glaciers of the Hindu Kush Himalayas: Current Status and Observed Changes from the 1980s to 2010. Int. J. Water Resour. Dev. 2015, 31, 161–173. [Google Scholar] [CrossRef]
- Miller, J.D.; Immerzeel, W.W.; Rees, G. Climate Change Impacts on Glacier Hydrology and River Discharge in the Hindu Kush–Himalayas. Mt. Res. Dev. 2012, 32, 461–467. [Google Scholar] [CrossRef]
- Chen, Y.; Taylor, P.; Cuddy, S.; Wahid, S.; Penton, D.; Karim, F. Inferring Vegetation Response to Drought at Multiscale from Long-Term Satellite Imagery and Meteorological Data in Afghanistan. Ecol. Indic. 2024, 158, 111567. [Google Scholar] [CrossRef]
- Ikram, Q.D.; Jamalzi, A.R.; Hamidi, A.R.; Ullah, I.; Shahab, M. Flood Risk Assessment of the Population in Afghanistan: A Spatial Analysis of Hazard, Exposure, and Vulnerability. Nat. Hazards Res. 2023, 4, 46–55. [Google Scholar] [CrossRef]
- Shroder, J.F. Hazards and Disasters in Afghanistan. In Natural Resources in Afghanistan; Elsevier Inc.: Amsterdam, The Netherlands, 2014; pp. 234–275. ISBN 978-0-12-800135-6. [Google Scholar]
- World Bank. Islamic Republic of Afghanistan Agricultural Sector Review: Revitalizing Agriculture for Economic Growth Job Creation and Food Security; World Bank: Washington, DC, USA, 2014. [Google Scholar]
- Safi, L.; Mujeeb, M.; Sahak, K.; Mushwani, H.; Hashmi, S.K. Climate Change Impacts and Threats on Basic Livelihood Resources, Food Security and Social Stability in Afghanistan. GeoJournal 2024, 89, 85. [Google Scholar] [CrossRef]
- Rubin, B.R. Afghanistan: The Last Cold-War Conflict, the First Post-Cold-War Conflict. In War, Hunger, and Displacement; Oxford University Press: Oxford, UK, 2011; Volume 2, pp. 23–52. [Google Scholar]
- Grau, L.W. Rodric Braithwaite, Afgantsy: The Russians in Afghanistan 1979–1989. J. Power Inst. Post-Sov. Soc. 2011. [Google Scholar] [CrossRef]
- GoIRA. GoIRA Afghanistan National Development Strategy; Goverment of Islamic Republic Afghanistan (GoIRA): Kabul, Afghanistan, 2013.
- Marsden, P.; Samman, E. Afghanistan: The Economic and Social Impact of Conflict. In War and Underdevelopment; Oxford University Press: Oxford, UK, 2000; Chapter 2; pp. 21–55. [Google Scholar]
- Mena, R.; Hilhorst, D.; Peters, K. Disaster Risk Reduction and Protracted Violent Conflict: The Case of Afghanistan; Overseas Development Institute: London, UK, 2019. [Google Scholar]
- Peters, L.E.R. Beyond Disaster Vulnerabilities: An Empirical Investigation of the Causal Pathways Linking Conflict to Disaster Risks. Int. J. Disaster Risk Reduct. 2021, 55, 102092. [Google Scholar] [CrossRef]
- GoIRA. Water Sector Strategy; Goverment of Islamic Republic Afghanistan (GoIRA): Kabul, Afghanistan, 2007.
- Parkinson, C.L. Satellite Contributions to Climate Change Studies. Proc. Am. Philos. Soc. 2017, 161, 208–225. [Google Scholar]
- Yang, J.; Gong, P.; Fu, R.; Zhang, M.; Chen, J.; Liang, S.; Xu, B.; Shi, J.; Dickinson, R. The Role of Satellite Remote Sensing in Climate Change Studies. Nat. Clim. Chang. 2013, 3, 875–883. [Google Scholar] [CrossRef]
- Bulletin, I.; Hussaini, S.M.B.; Sidle, R.C.; Kazimi, Z.; Khan, A.A.; Rezaei, A.Q.; Ghulami, Z.; Buda, T.; Rastagar, R.; Fatimi, A.A.; et al. Seasonal Drought Pattern Changes Due to Climate Variability: Case Study in Afghanistan. Water 2018, 11, 1096. [Google Scholar] [CrossRef]
- Hussaini, S.M.B.; Sidle, R.C.; Kazimi, Z.; Khan, A.A.; Rezaei, A.Q.; Ghulami, Z.; Buda, T.; Rastagar, R.; Fatimi, A.A.; Muhmmadi, Z. Drought Tolerant Varieties of Common Beans (Phaseolus Vulgaris) in Central Afghanistan. Agronomy 2021, 11, 2181. [Google Scholar] [CrossRef]
- Raoufi, H.; Jafari, H.; Sarhadi, W.A.; Salehi, E. Assessing the Impact of Climate Change on Agricultural Production in Central Afghanistan. Reg. Sustain. 2024, 5, 100156. [Google Scholar] [CrossRef]
- Glantz, M.H. Water, Climate, and Development Issues in the Amu Darya Basin. Mitig. Adapt. Strateg. Glob. Chang. 2005, 10, 23–50. [Google Scholar] [CrossRef]
- Noorali, H.; Abbas Ahmadi, S.; Campana, M.; Barroudi, M. Evaluation of Environmental Factors Affecting Hydropolitics of Helmand Transboundary Basin Using Remote Sensing Images. Forthcom. Iran. Cauc. J. 2023, 2–14. [Google Scholar] [CrossRef]
- Chen, Y.; Li, Z.; Fang, G.; Li, W. Large Hydrological Processes Changes in the Transboundary Rivers of Central Asia. J. Geophys. Res. Atmos. 2018, 123, 5059–5069. [Google Scholar] [CrossRef]
- Hajihosseini, M.; Hajihosseini, H.; Morid, S.; Delavar, M.; Booij, M.J. Impacts of Land Use Changes and Climate Variability on Transboundary Hermand River Using Swat. J. Water Clim. Chang. 2020, 11, 1695–1711. [Google Scholar] [CrossRef]
- Gao, T.; Wang, X.; Wei, D.; Wang, T.; Liu, S.; Zhang, Y. Transboundary Water Scarcity under Climate Change. J. Hydrol. 2021, 598, 126453. [Google Scholar] [CrossRef]
- Iqbal, M.S.; Dahri, Z.H.; Querner, E.P.; Khan, A.; Hofstra, N. Impact of Climate Change on Flood Frequency and Intensity in the Kabul River Basin. Geosciences 2018, 8, 114. [Google Scholar] [CrossRef]
- Harrigan, S.; Zsoter, E.; Alfieri, L.; Prudhomme, C.; Salamon, P.; Wetterhall, F.; Barnard, C.; Cloke, H.; Pappenberger, F. GloFAS-ERA5 Operational Global River Discharge Reanalysis 1979–Present. Earth Syst. Sci. Data 2020, 12, 2043–2060. [Google Scholar] [CrossRef]
- FAO. Land Cover Atlas of the Islamic Republic of Afghanistan; Food and Agriculture Organization (FAO): Rome, Italy, 2016. [Google Scholar]
- Abdullah, S.; Azimi, N.; Arsalang, A.; Girowal, M.; Dronov, V.I.; Kafarsky, A.K.; Salah, A.; Sobat, N.; Stazihilo-Alekseev, K.F.; Teleshev, G.I.; et al. Chapter 1: Outline of Physical Geological of Afghanistan. In Geology and Mineral Resources of Afghanistan; British Geological Survey Occasional Publication: Nottingham, UK, 2008; pp. 19–31. [Google Scholar]
- FAO. Afghanistan: Geography, Climate and Population; FAO: Rome, Italy, 2012. [Google Scholar]
- Beck, H.E.; McVicar, T.R.; Vergopolan, N.; Berg, A.; Lutsko, N.J.; Dufour, A.; Zeng, Z.; Jiang, X.; van Dijk, A.I.J.M.; Miralles, D.G. High-Resolution (1 Km) Köppen-Geiger Maps for 1901–2099 Based on Constrained CMIP6 Projections. Sci. Data 2023, 10, 724. [Google Scholar] [CrossRef]
- USGS EROS Archive-Digital Elevation-Global 30 Arc-Second Elevation (GTOPO30). Available online: https://www.usgs.gov/centers/eros/science/usgs-eros-archive-digital-elevation-global-30-arc-second-elevation-gtopo30?qt-science_center_objects=0#qt-science_center_objects (accessed on 20 November 2024).
- CSO. Afghanistan Statistical Yearbook; The Goverment of Islamic Republic Afghanistan, Central, Statistic Office: Kabul, Afghansitan, 2018.
- Sinfield, L.; Shroder, J.F. Ground-Water Geology of Afghanistan. In Transboundary Water Resources in Afghanistan: Climate Change and Land-Use Implications; Elsevier Inc.: Amsterdam, The Netherlands, 2016; pp. 41–90. ISBN 9780128018866. [Google Scholar]
- Shokory, J.A.N.; Schaefli, B.; Lane, S.N. Water Resources of Afghanistan and Related Hazards under Rapid Climate Warming: A Review. Hydrol. Sci. J. 2023, 68, 507–525. [Google Scholar] [CrossRef]
- Harris, I.; Osborn, T.J.; Jones, P.; Lister, D. Version 4 of the CRU TS Monthly High-Resolution Gridded Multivariate Climate Dataset. Sci. Data 2020, 7, 109. [Google Scholar] [CrossRef]
- Harris, I.; Jones, P.D.; Osborn, T.J.; Lister, D.H. Updated High-Resolution Grids of Monthly Climatic Observations—The CRU TS3.10 Dataset. Int. J. Climatol. 2014, 34, 623–642. [Google Scholar] [CrossRef]
- CRU. High-Resolution Gridded Datasets (and Derived Products). Available online: https://crudata.uea.ac.uk/cru/data/hrg/ (accessed on 6 March 2024).
- Abatzoglou, J.T.; Dobrowski, S.Z.; Parks, S.A.; Hegewisch, K.C. TerraClimate, a High-Resolution Global Dataset of Monthly Climate and Climatic Water Balance from 1958–2015. Sci. Data 2018, 5, 170191. [Google Scholar] [CrossRef]
- Abatzoglou, J.T.; Dobrowski, S.Z.; Parks, S.A.; Hegewisch, K.C. Monthly Climate and Climatic Water Balance for Global Terrestrial Surfaces from 1958–2015. Available online: https://data.nkn.uidaho.edu/dataset/monthly-climate-and-climatic-water-balance-global-terrestrial-surfaces-1958-2015 (accessed on 20 November 2024).
- CDS. River Discharge and Related Historical Data from the Global Flood Awareness System. Available online: https://cds.climate.copernicus.eu/cdsapp#!/dataset/cems-glofas-historical?tab=overview (accessed on 6 March 2024).
- Şen, Z. Innovative Trend Analysis Methodology. J. Hydrol. Eng. 2012, 17, 1042–1046. [Google Scholar] [CrossRef]
- Wang, Y.; Xu, Y.; Tabari, H.; Wang, J.; Wang, Q.; Song, S.; Hu, Z. Innovative Trend Analysis of Annual and Seasonal Rainfall in the Yangtze River Delta, Eastern China. Atmos. Res. 2020, 231, 104673. [Google Scholar] [CrossRef]
- Şen, Z. Innovative Trend Significance Test and Applications. Theor. Appl. Climatol. 2017, 127, 939–947. [Google Scholar] [CrossRef]
- Mann, H.B. Nonparametric tests against trend1. J. Econom. Soc. 1945, 13, 245–259. [Google Scholar]
- Kendall, M.G. Rank Correlation Methods. Biometrika 1957, 44, 298. [Google Scholar] [CrossRef]
- Frimpong, B.F.; Koranteng, A.; Molkenthin, F. Analysis of Temperature Variability Utilising Mann–Kendall and Sen’s Slope Estimator Tests in the Accra and Kumasi Metropolises in Ghana. Environ. Syst. Res. 2022, 11, 24. [Google Scholar] [CrossRef]
- Yue, S.; Wang, C. The Mann-Kendall Test Modified by Effective Sample Size to Detect Trend in Serially Correlated Hydrological Series. Water Resour. Manag. 2004, 18, 201–218. [Google Scholar] [CrossRef]
- Yi, X.; Li, G.; Yin, Y. Spatio-Temporal Variation of Precipitation in the Three-River Headwater Region from 1961 to 2010. J. Geogr. Sci. 2013, 23, 447–464. [Google Scholar] [CrossRef]
- Kendall, M.G. A New Measure of Rank Correlation. Biometrika 1938, 30, 81–93. [Google Scholar] [CrossRef]
- Puka, L. Kendall’s Tau. Int. Encycl. Stat. Sci. 2014, 713–715. [Google Scholar] [CrossRef]
- Andrade, C. The P Value and Statistical Significance: Misunderstandings, Explanations, Challenges, and Alternatives. Indian J. Psychol. Med. 2019, 41, 210–215. [Google Scholar] [CrossRef] [PubMed]
- Kumar Sen, P. Estimates of the Regression Coefficient Based on Kendall’s Tau. J. Am. Stat. Assoc. 1968, 63, 1379–1389. [Google Scholar]
- White, C.J.; Tanton, T.W.; Rycroft, D.W. The Impact of Climate Change on the Water Resources of the Amu Darya Basin in Central Asia. Water Resour. Manag. 2014, 28, 5267–5281. [Google Scholar] [CrossRef]
- Banks, D. Hydrogeological Atlas of Faryab, Afghanistan, 1st ed.; Afghan Ministry of Rural Rehabilitation & Development (MRRD): Kabul, Afghanistan, 2014.
- Rahil, M.U.; Ahmad, S.; Khan, M.W.; Mubeen, A.; Dahri, Z.H.; Ahmad, K.; Arshad, M.; Wahdatyar, R. Developing High Resolution Monthly Gridded Precipitation Dataset for Afghanistan. Theor. Appl. Climatol. 2024, 155, 5107–5128. [Google Scholar] [CrossRef]
- Hollmann, R.; Merchant, C.J.; Saunders, R.; Downy, C.; Buchwitz, M.; Cazenave, A.; Chuvieco, E.; Defourny, P.; De Leeuw, G.; Forsberg, R.; et al. The ESA Climate Change Initiative: Satellite Data Records for Essential Climate Variables. Bull. Am. Meteorol. Soc. 2013, 94, 1541–1552. [Google Scholar] [CrossRef]
- Teixeira de Aguiar, J.; Lobo, M. Reliability and Discrepancies of Rainfall and Temperatures from Remote Sensing and Brazilian Ground Weather Stations. Remote Sens. Appl. 2020, 18, 100301. [Google Scholar] [CrossRef]
- Esri ArcGIS Pro. Available online: https://www.esri.com/en-us/arcgis/products/arcgis-pro/overview (accessed on 10 July 2024).


| River Gauging Stations | |||||
|---|---|---|---|---|---|
| Station Name | Lat | Long | Elevation (m) | Record Period | N. of Year |
| Zarang | 30.7352 | 61.7735 | 420 | 1980–2022 | 42 |
| Farah | 31.4790 | 61.4775 | 475 | 1980–2022 | 42 |
| Adraskan | 31.6280 | 61.2758 | 450 | 1980–2022 | 42 |
| Hari Rod | 34.8219 | 61.0772 | 710 | 1980–2022 | 42 |
| Murghab | 35.7235 | 63.2250 | 502 | 1980–2022 | 42 |
| Shirin Tagab | 37.1271 | 65.2847 | 260 | 1980–2022 | 42 |
| Kunduz | 37.0225 | 68.2253 | 360 | 1980–2022 | 42 |
| Kokcha | 37.1233 | 69.4296 | 500 | 1980–2022 | 42 |
| Kabul | 34.2762 | 71.1259 | 393 | 1980–2022 | 42 |
| River Basin | Trend | p-Value | Sen’s Slope | τ | S | Var(S) | Z | ITA Slope | Increase in Temperature 1980–2022 (°C) |
|---|---|---|---|---|---|---|---|---|---|
| Average | (+) | 0.000 | 0.034 | 0.495 | 447 | 7275 | 5.229 | 0.036 | 1.46 |
| Kabul | (+) | 0.000 | 0.023 | 0.359 | 322 | 6735 | 3.912 | 0.025 | 0.99 |
| Helmand | (+) | 0.000 | 0.041 | 0.541 | 687 | 7588 | 7.875 | 0.045 | 1.76 |
| Harirud | (+) | 0.000 | 0.040 | 0.508 | 576 | 7440 | 6.666 | 0.037 | 1.72 |
| Northern | (+) | 0.000 | 0.028 | 0.406 | 668 | 7104 | 7.914 | 0.028 | 1.20 |
| Amu Darya | (+) | 0.000 | 0.022 | 0.344 | 747 | 6708 | 9.109 | 0.026 | 0.95 |
| River Basin | Trend | p-Value | Sen’s Slope | ITA Slope | Regression Slope | Decrease in Precipitation 1980–2022 (mm) |
|---|---|---|---|---|---|---|
| Average | (0) | 0.578 | 0.000 | 0.023 | −0.028 | −1.187 |
| Amu Darya | (0) | 0.949 | 0.000 | 0.059 | −0.030 | −1.286 |
| Northern | (+) | 0.499 | 0.050 | 0.085 | 0.022 | 0.929 |
| Harirod | (0) | 0.440 | 0.000 | 0.023 | −0.083 | −3.582 |
| Helmand | (−) | 0.155 | −0.069 | −0.047 | −0.084 | −3.608 |
| Kabul | (0) | 0.918 | 0.000 | 0.213 | −0.041 | −1.754 |
| River Basin | Trend | p-Value | Sen’s Slope | ITA Slope | τ | S | Var(S) | Z | Decrease in River Discharge 1980–2022 (m3/s) |
|---|---|---|---|---|---|---|---|---|---|
| Zarang | (−) | 0.004 | −6.147 | −8.258 | −0.249 | −225 | 1203 | −6.459 | −258.17 m3/s |
| Farah | (−) | 0.000 | −1.531 | −1.998 | −0.333 | −301 | 4963 | −4.258 | −64.30 m3/s |
| Adraskan | (−) | 0.039 | −1.347 | −2.902 | −0.229 | −207 | 3738 | −3.369 | −56.57 m3/s |
| Hari Rod | (−) | 0.008 | −2.182 | −2.918 | −0.240 | −217 | 1203 | −6.228 | −91.64 m3/s |
| Murghab | (0) | 0.109 | −1.125 | −1.581 | −0.169 | −153 | 3282 | −2.653 | −47.25 m3/s |
| Tagab | (−) | 0.019 | −1.38 | −2.341 | −0.225 | −203 | 2295 | −4.217 | −57.96 m3/s |
| Kundoz | (−) | 0.013 | −6.962 | −7.992 | −0.262 | −237 | 1203 | −6.805 | −292.40 m3/s |
| Kokcha | (−) | 0.019 | −3.829 | −4.524 | −0.238 | −215 | 2295 | −4.467 | −160.82 m3/s |
| Kabul | (−) | 0.015 | −2.716 | −3.592 | −0.227 | −205 | 3282 | −3.561 | −114.07 m3/s |
| Average | (−) | 0.000 | −3.058 | −4.012 | −0.331 | −299 | 3736 | −4.876 | −128.06 m3/s |
Disclaimer/Publisher’s Note: The statements, opinions and data contained in all publications are solely those of the individual author(s) and contributor(s) and not of MDPI and/or the editor(s). MDPI and/or the editor(s) disclaim responsibility for any injury to people or property resulting from any ideas, methods, instructions or products referred to in the content. |
© 2024 by the author. Licensee MDPI, Basel, Switzerland. This article is an open access article distributed under the terms and conditions of the Creative Commons Attribution (CC BY) license (https://creativecommons.org/licenses/by/4.0/).
Share and Cite
Akhundzadah, N.A. Analyzing Temperature, Precipitation, and River Discharge Trends in Afghanistan’s Main River Basins Using Innovative Trend Analysis, Mann–Kendall, and Sen’s Slope Methods. Climate 2024, 12, 196. https://doi.org/10.3390/cli12120196
Akhundzadah NA. Analyzing Temperature, Precipitation, and River Discharge Trends in Afghanistan’s Main River Basins Using Innovative Trend Analysis, Mann–Kendall, and Sen’s Slope Methods. Climate. 2024; 12(12):196. https://doi.org/10.3390/cli12120196
Chicago/Turabian StyleAkhundzadah, Noor Ahmad. 2024. "Analyzing Temperature, Precipitation, and River Discharge Trends in Afghanistan’s Main River Basins Using Innovative Trend Analysis, Mann–Kendall, and Sen’s Slope Methods" Climate 12, no. 12: 196. https://doi.org/10.3390/cli12120196
APA StyleAkhundzadah, N. A. (2024). Analyzing Temperature, Precipitation, and River Discharge Trends in Afghanistan’s Main River Basins Using Innovative Trend Analysis, Mann–Kendall, and Sen’s Slope Methods. Climate, 12(12), 196. https://doi.org/10.3390/cli12120196