Article

Climate Patterns Affecting Cold Season Air Pollution of Ulaanbaatar City, Mongolia

by
Erdenesukh Sumiya
1,
Sandelger Dorligjav
1,*,
Myagmartseren Purevtseren
1,2,
Gantulga Gombodorj
1,2,
Munkhbat Byamba-Ochir
3,
Oyunchimeg Dugerjav
3,
Munkhnaran Sugar
1,2,
Bolormaa Batsuuri
1,2 and
Bazarkhand Tsegmid
1,2
1
Department of Geography, Division of Natural Sciences, School of Arts and Sciences, National University of Mongolia, Ulaanbaatar 14200, Mongolia
2
Research Laboratory of Land Planning and Survey, Graduate School, National University of Mongolia, Ulaanbaatar 14200, Mongolia
3
Research Division of Climate Change and Resources, Information and Research Institute of Meteorology, Hydrology and Environment, Ulaanbaatar 15160, Mongolia
*
Author to whom correspondence should be addressed.
Climate 2023, 11(1), 4; https://doi.org/10.3390/cli11010004
Submission received: 31 October 2022 / Revised: 18 December 2022 / Accepted: 20 December 2022 / Published: 24 December 2022

Abstract

:
Many studies have been conducted on air pollution in Ulaanbaatar city. However, most have focused on the sources of pollutants and their characteristics and distribution. Although the location of the city subjects it to unavoidable natural conditions where air pollution accumulates during the cold season, nature-based solutions have not yet been considered in the projects implemented to mitigate air pollution levels. Therefore, this study aims to determine the combined influence of geography and atmospheric factors on cold season air pollution. The spatiotemporal variations in the variables were investigated using meteorological observation data from 1991 to 2020 in the different land-use areas. Then, atmospheric stagnation conditions and air pollution potential parameters were estimated from daily radiosonde data. Subsequently, the temporal variations in air pollutants were studied and correlated with estimates of the above parameters. In the Ulaanbaatar depression, the stable cold air lake (colder than −13.5 °C), windless (34–66% of all observations), and poor turbulent mixing conditions were formed under the near-surface temperature inversion layer in the cold season. Moreover, due to the mountain topography, the winds toward the city center from all sides cause polluted air to accumulate in the city center for long periods. Air pollution potential was categorized as very high and high (<4000 m2·s−1), in the city in winter, indicating the worst air quality. Thus, further urban planning policy should consider these nature factors.

1. Introduction

In recent decades, Asian countries have experienced high industrial, economic, and population growth [1]. This socioeconomic process leads to environmental pollution issues due to urbanization and population agglomeration in developed and developing countries [2]. Mongolia, between Russia and China, is one example of a developing country facing such issues (Figure 1a). Significantly, since the 1990s, when the country transitioned from socialism to democracy, the challenges related to environmental problems in urban and rural areas of Mongolia have been continuously increasing [3,4,5]. Several studies have found that Ulaanbaatar, the capital of Mongolia, is one of the most air-polluted cities in the world in the cold season from October to March [3,6,7,8,9]. Socioeconomic precursors of the city’s air pollution are urban expansion and growth in population density, and these factors are showing an increasing trend in Ulaanbaatar city [10,11,12]. About 46% of the Mongolian population lives in Ulaanbaatar city, the coldest capital city in the world. Due to the growing population density of the city, environmental pollution has drastically increased and negatively affected the country’s economy, social development, and human habitats, and health [3,6,13,14,15,16]. Several studies on Ulaanbaatar have shown that the air pollutant concentrations exceed the national air quality standard values for total annual measurements by more than 50% [8,13,17]. Allen et al. [16] concluded that the fine particulates in the air of Ulaanbaatar have contributed to 28.8% of deaths due to cardiovascular disease and lung diseases, 39.9% to lung cancer, and 9.2% of the total mortality rate for the city’s population. Therefore, air pollution remains a challenging issue for Ulaanbaatar city.
Following the socioeconomic development of Mongolia, the number of households and vehicles in the capital city has increased year to year. This results in a rise in the combustion of solid and liquid fuels and increases the primary and secondary sources of air pollution in Ulaanbaatar [3,4,18,19]. Especially since 2007, several new air pollution monitoring stations have been established to create a research database due to the implementation of various projects and programs to support air pollution reduction under the Mongolian Government. Researchers have been intensively producing many academic works in this field. Soyol-Erdene et al. [3] classified air-pollution-related studies on Ulaanbaatar city into several main categories according to their direction or the types of air pollutants and their characteristics: (a) impact of climate and topographic conditions, (b) particulate matter (PM2.5 and PM10) and its concentrations, composition, and physical properties, and (c) gaseous pollutants including sulfur dioxide (SO2), nitrogen oxides (NO, NO2 and NOx), volatile organic compounds (VOCs) and surface ozone (O3). From the research method point of view, for Ulaanbaatar city, the distribution, chemical composition, and diurnal, seasonal and spatial variations of air pollutant sources [7,8,15,16,18,19,20], and their impact on human health [6,14], the statistical relationships between pollutants, and socioeconomic and climatic factors [4,21,22,23,24], the possibility of forecasting air pollution [25], and the mitigation of reduced air quality [13,26] have been studied. However, few studies, except that of Wang et al. [22], have focused on meteorological factors affecting winter air pollution in Ulaanbaatar for a shorter period of data.
During winter, 80% of air pollution in Ulaanbaatar is caused by furnaces/ stoves of households in the ger area and about 3200 heating furnaces of enterprises and organizations, 10% by the 400,000 vehicles on the road, 5–6% by thermal power plants, and 4% by ash ponds and roads and other sources, such as dust and open litter [17,27]. Furthermore, according to the “Master plan to reduce air pollution in Ulaanbaatar city” by Sumiya et al. [28], the city experiences unavoidable natural conditions where air pollution accumulates due to geographical factors and the effect of the near-surface temperature inversion under the Asian anticyclones during the cold season. In other words, Ulaanbaatar city is surrounded by high mountains, and in the residential ger areas, the primary sources of pollutants are located on the upwind side of the city, and the wind speeds in the city center are low because of overbuilding [22,28,29,30,31]. On the other hand, to reduce air pollution in larger cities, economically high-cost measures, such as reducing the sources of pollutants, decentralizing cities, and using liquid and solid eco-fuel and refined alternatives are still being implemented [13,32]. Therefore, the following measures were established in the Ulaanbaatar city development plan to reduce air pollution [33]: (1) technological innovation in thermal power plants, ban on low-pressure boiler/heating of homes and entities using raw coal, and reduction of toxic smoke emissions from other furnaces; (2) limiting the use of public transport diesel buses and cars that have a long service life and emit more emissions than appropriate; (3) intensification of land re-adjustment in slum/ger areas; (4) increasing the greenery of the capital and taking measures to reduce dust by harvesting rainwater and building a water reservoir; (5) providing low-income households with fuel that meets standard requirements to reduce raw coal burning areas, improving air quality control capacity, and increasing the number of hybrid and electric vehicles by supporting them through tax policies.
Moreover, the parliament of Mongolia stated that air pollution will be reduced by systematically implementing the issue of reducing motor vehicle emissions in the capital and intensifying the re-planning of residential areas, and housing areas with high levels of air pollution [34]. However, this has been a long-term issue for economically less developed countries, such as Mongolia. Therefore, the policy measures to decrease air pollution levels in Ulaanbaatar should first aim to reduce the number of air-polluting sources. Nevertheless, researchers have suggested that mitigation actions for air pollution can be managed at a lower cost with a proper plan consisting of climate conditions and geographical factors [28], which are part of nature-based solutions. Therefore, this study aims to explore geography-influenced climate patterns affecting air pollution in Ulaanbaatar during the cold season from 1991 to 2020. Data used in this research were collected from three weather stations at different land use types, which could be considered to improve the quality of air and environment in cities and settlements by implementing optimal policies for urban planning, development, and land use planning. The objectives are listed as follows:
  • To define the distributions and seasonal regime of the main climate indicators of the city using the weather observation data of 1991–2020;
  • To present diurnal and seasonal variations in the main meteorological parameters affecting air pollution in the city center and suburbs;
  • To study geography and circulation-induced atmospheric factors in detail, including atmospheric stagnation conditions and air pollution potential during the cold season;
  • To correlate air pollutants and meteorological parameters.

2. Materials and Methods

2.1. Study Area

Ulaanbaatar city, extending from west to east, is located approximately 1350 m above the mean sea level in the Tuul river valley (lowest elevation ~1231 m) and is surrounded by mountains that are elevated from 1652 to 2258 m in the skirt of the Khentii mountain range. Ulaanbaatar city, with an area of 4704 km2, exists in a natural transition site from the boreal coniferous taiga to the dry steppe (Figure 1).
In addition to its geographical and climate characteristics, urban factors, directly and indirectly, affect air pollution in Ulaanbaatar. Since 2000, settlement areas in the capital have expanded 1.7 times, and, in addition to settlement areas, construction sites, factories, mining sites, and agricultural fields occupy large areas. The total number of urban parcels and the built area have increased 2–3 times in the 10 years between 2000 and 2010 and, the area for the most types of land uses, except for industrial land use, but especially of urban sprawl/ger areas, has increased [35]. Even though Mongolia has a small population (3.4 million) in a vast land territory (1.5 million square kilometers) representing the lowest density population in the world (2 people per square kilometer), the capital city of Ulaanbaatar has undergone rapid urbanization with a population density of 311 people per square kilometer. The city’s population and population density have grown 2.2 and 1.3 times in the last decade [36]. As of 2020, the built-up area of Ulaanbaatar city exceeds the suitable area of 337 km2 by 16.4% due to population growth [11] and showing a tendency to increase further [10]. Urban land use and human activities under the unique geographical conditions of Ulaanbaatar have produced entirely new factors, such as air pollution and microscale climate, over the last three decades. In other words, the physical geography environment of the city has changed to a human-induced socio-economic geography environment [28]. These increases in social factors are one reason for the issues of environmental pollution.
The main feature of Mongolia’s climate is that there are four distinct seasons with large temperature fluctuations, low precipitation, and apparent latitudinal and altitudinal differences [37]. In particular, Ulaanbaatar city has a harsh continental climate and long cold winters. The spring season lasts for 52 to 75 days from mid-March to mid-May, while summer lasts for 105 to 116 days from late May to early September. The fall or autumn season lasts for 52 to 70 days, from early September to late October, while the long winter lasts 140–150 days, from late October to mid-March [28]. Each season’s beginning and end time and duration are based on the average daily air temperature. For example, during the transition season, the start and end of the heating season are determined by the period during which the average daily air temperature drops below 8 °C for 5 or more days. Similarly, the criteria temperatures determining the cold season and winter durations are 0 °C and −10 °C, respectively, while daily average temperatures above 15 °C for the period are considered the criteria value for summer. However, the criteria temperature for spring and fall seasons ranges between the temperatures for winter and summer. Subsequently, the length of the seasons is estimated by the time corresponding to differences in the criteria temperatures for each season [38,39]. The cold season in Ulaanbaatar city starts in late October and ends in early April. It continues for 147–150 days in the city center and is 7–10 days longer in the suburbs [28]. Therefore, the heating duration is 8–11 days shorter in the city center (~233 days) than in the suburbs. Raw and refined coal are the primary sources of residential heating during the cold season, which lasts about 65% of the duration of the year, and the high consumption of solid fuels is the cause of air pollution in the city [40]. Therefore, Ulaanbaatar city was selected as the case area of this study.

2.2. Data and Methods

The Data Archive Division of the National Agency of Meteorology and Environmental Monitoring of Mongolia (NAMEM) provided surface meteorological and upper air data from 1991 to 2020 and air pollutants data from 2019 to 2020 for hourly and monthly timescales. To illustrate the temporal regimes of the meteorological parameters affecting air pollution, the hourly and monthly weather observation data were statistically processed. Because the weather parameters, especially temperature and wind, vary in the city center and surroundings according to geography, and urban patterns [41,42], three weather stations corresponding to different land use types were selected as the study locations: the University and Ulaanbaatar stations for the city center and the Buyant-Ukhaa station for the suburbs (Table 1, Figure 2). On the other hand, the stations are supposed to spatially represent differences in urban heat and cold islands as well as winds. For this reason, the average cold season air temperature map with a 0.0125° spatial resolution for Ulaanbaatar was plotted using the smoothing spline interpolation technique in ANUSPLIN statistical modeling developed by the Australian National University [43] of the Mongolia-wide climate data from 1991 to 2020.
Since spatiotemporal distributions of temperature, moisture, and wind are the combined result of topographic and atmospheric circulation conditions [29], atmospheric stagnation conditions and air pollution potential were studied using radiosonde data from 2012 to 2020 at the Ulaanbaatar station. The radiosonde provides air temperature, pressure, humidity, wind speed, and direction at different levels. Near-surface temperature inversion and atmospheric ventilation coefficient (VC) indicate a stagnation condition and air pollution potential, respectively [30,44]. Near-surface temperature inversion thickness, intensity and frequency were calculated from daily radiosonde data (00:00 UTC and 12:00 UTC) using a method based on hydrostatic and state equations, which were applied by Sumiya [30] and Wang et al. [22] and analyzed statistically.
The ability of the atmosphere to disperse air pollutants depends on the wind speed and mixing layer thickness on the air pollution potential or ventilation conditions [44]. Winds affect only the horizontal dispersion of air pollutants, whereas the ventilation coefficients involve horizontal and vertical pollutant distributions [45]. The air pollution potential zones are classified according to VC variability [44,46] (Table 2).
The VC is the product of mixing layer height (MLH) and average MLH wind speed (WS) [44,47] (Equation (1)):
VC = MLH · WS ,
where VC is in ms−1, MLH in m and WS is wind speed in m·s−1.
Daily MLHs were estimated using a method deriving the level with a maximum vertical gradient of potential temperature and a minimum vertical gradient of specific humidity from radiosonde data [48,49] (Equation (2)):
MLH = h ( [ θ z ] max , [ q z ] min ) ,
where h or height is the MLH detection function depending on the maximum vertical gradient of potential temperature ( [ θ z ] max )   and a minimum vertical gradient of specific humidity ( [ q z ] min ) :
WS = z i = 0 z i = MLH V z i i ,
where z i   is the level of the wind speed measured below MLH. i is the number of levels. V z i is the wind speed measured at the levels.
After calculating daily MLH, wind speeds below the level were averaged using Equation (3) [44], and VCs were obtained for each radiosonde flight. Subsequently, monthly and cold seasonal average MLH and VCs were calculated and analyzed statistically.
Hourly data on sulfur dioxide (SO2), nitrogen dioxide (NO2), and particulate matter (PM10) were collected from four air quality monitoring sites, Urgakhnaran (suburb), West crossroad (downtown), 100 ail (commercial and mixed-use), and Television (slum/ger area district), in Ulaanbaatar from 2019 to 2020 (Figure 2). The diurnal variations of the pollutants were plotted and correlated with the meteorological variables, stagnation, and air pollution potential parameters.

3. Results and Discussions

3.1. Spatiotemporal Regime of Meteorological Variables around Ulaanbaatar

3.1.1. Climate Patterns of Ulaanbaatar City

Ulaanbaatar’s climate and seasonal circulations are influenced by the topographic conditions around the city in the northeast mountain range of Mongolia [29] (Figure 1). A climate diagram can indicate the place’s seasonal regime of thermal, moisture, and wind. Figure 3 shows the climate diagram of Ulaanbaatar city as an average of three weather stations from 1991 to 2020.
From Figure 3, it can be seen that the annual temperature regime in Ulaanbaatar is symmetric, and the annual average temperature is approximately 0.2 °C. The monthly average air temperature has a minimum of −21.3 °C in January and a maximum of 19.0 °C (absolute maximum temperature ~+38.3 °C) in July. In the cold season, the near-surface temperature inversion layer dominates under the Asian anticyclone [29,30]. The average cold season temperature was −12.2 °C, while the absolute low temperature ranged from −35.0 to −40.0 °C, one of the primary factors contributing to air pollution (Figure 2). Due to the long winter and geography-influenced temperature inversion, heavy and cold air masses settle around Ulaanbaatar. This leads to an increase in the duration of residential heating and exceeding of air quality standards (AQS) [23,28]. During stagnation conditions, wind speeds, which are a dynamic factor, are low and vary 1.1–2.2 m·s−1 in the cold season. Since the average air temperature and wind speeds (~2.8 m·s−1) increase after April (Figure 2), the frequency and intensity of the near-surface temperature inversion layer will weaken dramatically over Ulaanbaatar [30], leading to improved air quality. Because clear weather dominates the stationary air mass during the cold season, total precipitation in the months will be 27.8 mm and 10% of total annual precipitation (272.1 mm). Therefore, the wet deposition of air pollutants will also be scarce for Ulaanbaatar city during this period. Relative humidity presents how close the air is to water vapor saturation. Because the air is compressed and the water vapor content increases and approaches the saturated state due to winter cooling [37], the relative humidity reaches its highest level of 70–75% (50–61% in summer). After air warming, the minimum values of 43% to 58% are reached in the spring months (Figure 3).

3.1.2. Thermal Regime

The atmospheric thermal regime supplied by solar radiation is a primary factor affecting the climate patterns around Ulaanbaatar city (Figure S1). Figure 4 presents the average monthly air temperature variations in the city center and suburbs. The annual average temperature is 0.1 and 0.2 °C at the University and Ulaanbaatar stations in the city center, respectively, and −1.5 °C at the Buyant-Ukhaa suburb station. At the Buyant-Ukhaa station, located in a relatively low elevation valley and 14 km from the city center (Table 1), the monthly average temperatures are 0.1 to 4.2 °C colder than at other stations in the city, except for July. Furthermore, compared with the city center, the temperature at Buyan-Ukhaa station is by 0.0 to 1.0 °C in the warm season and 1.5 to 4.2 °C in the cold season. These represent favorable conditions for urban heat islands due to the combined impact of geography and urban patterns [42].
The average temperature of the cold season is −12.1 to −12.2 °C in the city center and −15.1 °C in the suburbs, where the intensity of the near-surface temperature inversion is high (Figure 4). Currently, residential heating in all parts of Ulaanbaatar city starts on 15 September (office heating on 15 October) and stops on 15 May (heating duration: 273 days). However, the heating lengths are 235, 229, and 231 days for Buyant-Ukhaa, Ulaanbaatar and University stations, respectively. If the above temperature difference is considered for planning the heating period in different parts of the city, it will be the basis for reducing solid and liquid fuel consumption, contributing to air pollution and greenhouse gas emissions, as well as the economy.
Figure 5 shows the spatial distribution of the average cold season air temperature around Ulaanbaatar using the ANUSPLIN model from 1991 to 2020. Byamba-Ochir et al. [50] stated that for modeling the air temperature distribution of Mongolia using ANUSPLIN based on 140 weather station data for the above period, the spatial correlation coefficient is 0.97–1.00, while the mean squared error is 0.24 to 1.03 °C. Data from four weather stations in Ulaanbaatar were used for this study, and the modeling gave a good estimation. Therefore, the modeled data were used for illustrating the spatial distributions of the cold season temperature in the settlement areas of Ulaanbaatar. From this, the average cold season temperature decreases from the city center to the west and east. In particular, the Buyant-Ukhaa station in the river valley exists in the colder belt of −13.5 to −13.0 °C compared with the other stations (Figure 4). Huang et al. [15] stated that the seasonal temperature distributions for different land use areas lead to variations in air pollutant concentrations. The temperature distributions can help in planning the heating temperature and duration and in spatially forecasting air pollution.
Although the air temperature is the lowest before sunset and the highest between 2 and 3 PM in any place and season for continental climate [37], the influence of the metropolitan city is also reflected—for example, artificial surface or urban materials affects the air temperature regime and lead to urban heat islands [41,42]. The biorhythm of city life is adapted to the diurnal and seasonal temperature regimes [51], and the heat distribution load increases during the heating season, affecting the city’s thermal regime and air pollution conditions [40].
Figure 6 presents diurnal variations in the air temperature in different areas of the city in summer and winter. The air temperatures are similar throughout the city in the summer, while there is warming from the suburbs to the city center in the winter from 1991 to 2020. The result is the same as the conclusion of Ganbat et al. [42]. The average daily temperature during the winter is −19.4 to −23.1 °C from the city center to the suburbs, and it increases during the morning and nighttime heating of the house, which contributes to increasing air pollution in the outer zone (slum/ger area) of the city. Because an increase in temperature and wind speed weakens the near-surface temperature inversion layer during the daytime, air pollution level gradually decreases. However, air pollutants accumulate from day to day in the cold season due to the high number of days with a temperature inversion in Ulaanbaatar [22,31].

3.1.3. Surface Wind Regime

The surface wind regime depends on local topographic conditions and atmospheric circulation. Air particles and pollutants are carried by the wind from place to place [49]. In the vicinity of Ulaanbaatar, high pressures (the sea level pressure is 1022.1 hPa in Ulaanbaatar and 1042.2 hPa in Buyant-Ukhaa) are observed in the cold season under the influence of the Asian anticyclone, and they create relatively stable and windless conditions due to the near-surface temperature inversion layer in the river valley [30].
Figure 7 shows diurnal variations in the wind speed in three different land use zones of the city in the summer and winter. During winter, the average hourly wind speed does not exceed 2.1 m·s−1 throughout the city, and the windless conditions are high for the University station in high-rise residential areas with skyscraper buildings in the city center relative to the distant districts from the center. The windless cases are 66% of monthly observations at the University station while 33–34% for Ulaanbaatar and Buyant-Ukhaa stations. During the residential heating period (night), the wind speed is less than 1.5 m·s−1, which contributes to elevating air pollution. The wind patterns under the near-surface temperature inversion layer are conditions that favor the accumulation of air pollutants over Ulaanbaatar city. Wind speeds are higher (maximum hourly value ~2.5–5.0 m·s−1) in summer than in winter (maximum hourly value ~1.5–2.1 m·s−1). However, conditions favoring the accumulation of particulate matter and gaseous pollutants dominate during winter, while the photochemical production of gaseous pollutants, such as ozone, is intensified due to abundant solar radiation in the summer (Figure S1) [23].
Wind direction is an essential variable determining the sources of air pollution [4], and it varies in different parts of the city and by month, season, and day. Figure 8 indicates the dominant frequency of the wind direction under the topographic influence around Ulaanbaatar city. In winter, around Buyant-Ukhaa station, a suburb of the city, 29.4% of the winds blow dominantly from the south (S), and 15.4% of the winds from the southeast (SE), Bogdkhan Mountain, and the wind speed from these directions is about 2.0 m·s−1 (Figure 8c). Although the wind directions at the “University” station in the city center are overly variable, the wind frequency from the west (W) is the highest at 23.6%, and the secondary prevailing wind frequency is 15.6% from the northwest (NW), and when blowing from these directions, the wind speed reaches 2.5 to 2.7 m·s−1. However, almost 66% of the wind measurements at the station, which is blocked by tall buildings, indicate a windless state (Figure 8b). At Ulaanbaatar station, the district of the western slum/ger area with low-height houses, the frequency of winds blowing from the east (E), west (W) and northwest (NW) is the highest at 17.4%, 12.1% and 9.6%, respectively. The wind speed reaches 2.0 to 2.9 m·s−1 when blowing from the west and northwest and 2.3 m·s−1 from the east (Figure 8a). Figure 8 shows that Ulaanbaatar city’s primary sources of air pollution are in the directions upwind of the city in winter. From the previous studies, it is known that weak winds are observed outward from the city in the daytime, while mountain and valley winds directed from all sides to the city center prevail at night, and together with the downward movement under the near-surface temperature inversion layer, air pollutants accumulate in the city center for long periods [8,29,30].

3.2. Atmospheric Stagnation Conditions in Ulaanbaatar City

Figure 9 presents seasonal variations in the vertical distribution of air temperature in the lower troposphere over Ulaanbaatar city using radiosonde data from 1991 to 2020. The temperature decreases vertically in the troposphere, and an abnormal (rising) temperature distribution due to atmospheric stagnation conditions is referred to as a temperature inversion layer [22,49]. The layer is mainly observed over Ulaanbaatar city due to radiation cooling of the land surface during the cold season (Figure 9). Under near-surface temperature inversion, the air becomes very stable or windless. The layer inhibits vertical air movement, such as convection and turbulence, and various air mixtures, such as dust, fumes, condensation cores, and air pollutants, accumulate due to the lack of transport. Thus, the layer is also called an inhibition layer or stagnation [30].
Sumiya [30] investigated the climatology of the frequency, intensity, and thickness of the near-surface temperature inversion layer of Mongolia using data from eight radiosondes (Russian sonde) stations, including Ulaanbaatar city, from 1957 to 2004. The results have not yet been updated, except in the study by Wang et al. [22], where cold season data from 2008 to 2016 were used. Moreover, the radiosonde system at the Ulaanbaatar station was replaced by the Vaisala DigiCORA sounding system [52], which has been accurately measuring since 2012. Radiosonde launches twice per day from Ulaanbaatar station. Therefore, daily radiosonde data from 2012 to 2020 were used in the present study to study atmospheric stagnation conditions, and the results of the recent year were compared with those of Sumiya [30] (Table 3, Table 4 and Table 5).
Table 3 presents the number of days with the near-surface temperature inversion layer over Ulaanbaatar using radiosonde data.
Table 3 shows that the number of days with a temperature inversion layer has decreased from 1 to 11 days for morning and evening flights for each month. In the winter months, days with temperature inversion ranged from 23 to 27 per month by morning measurement and 16 to 23 by evening measurement from 1957 to 2004 [30]. These were 16 to 23 days and 8 to 15 days in the morning and evening measurements, respectively, in winter from 2012 to 2020. In the cold season, days with temperature inversion were 16 ± 4 per month on morning flights and 8 ± 5 on evening flights from 2012 to 2020. However, in the warm season, 3 ± 2 days per month and 1 ± 1 days per month have a near-surface temperature inversion in the morning and evening, respectively (Table 3). We believe that the decrease in days with a near-surface temperature inversion is due to global warming and the heat island effect caused by population growth and concentration in Ulaanbaatar.
The temperature difference in the lower and upper bounds of the inversion layer is called its intensity, which is highly correlated with air pollutant concentrations [22]. The monthly intensities of the near-surface temperature inversion layer are shown in Table 4.
From 1957 to 2004, the annual average of the temperature inversion intensity reaches 4.5 and 3.1 °C in the morning and evening, respectively. In winter, inversion intensities of 7.4–8.8 °C in the morning and 4.3–6.6 °C in the evening are observed [30]. In turn, the annual average intensity was 4.1 °C in the morning and 3.5 °C in the evening from 2012 to 2020. In winter in recent years, the inversion intensity decreased to 6.5–8.2 °C in the morning and 3.4–5.1 °C in the evening. Similarly, Wang et al. [22] showed that winter inversion intensity was 6.1–8.0 °C in the morning from 2008 to 2016. Although the inversion intensity in the morning has weakened due to global warming, an increase in the inversion intensity in the evening may be related to the intensification of dryness and extreme conditions in the transition seasons (Table 4).
Diurnal variations in near-surface temperature inversion intensity for the Buyant-Ukhaa and Ulaanbaatar weather stations in winter are shown in Figure 10. The maximum temperature inversion intensity near the Ulaanbaatar station was 9.5 °C at 07:00 (LST), the minimum value was 2.1 °C at 15:00 (LST), and the average daily temperature inversion intensity was 6.7 °C. The maximum value of winter inversion intensity at the Buyant-Ukhaa station, which is observed between 07:00 and 08:00 (LST) in the morning, is equivalent to the conclusion of previous researchers that the maximum value of the inversion intensity at surface temperature is observed before sunrise [30]. At 07:00 (LST), the inversion intensity was 10.1 °C, while the minimum inversion intensity recorded was 2.5 °C at 15:00 (LST). Figure 10 presents a stronger near-surface temperature inversion around Buyant-Ukhaa due to its relatively low altitude in a river valley. The diurnal variations in the near-surface temperature inversion intensity correspond to the residential heating time and the peak hours of traffic and contribute to elevated air pollution.
The thickness of the temperature inversion depends on many factors, such as the relative height of the surrounding mountains, average altitude above sea level, geographical terrain, landscape and general atmospheric circulation, and absorption of solar radiation [37]. Table 5 shows the near-surface temperature inversion thickness in Ulaanbaatar city.
In the morning and evening, the annual average near-surface temperature inversion thicknesses were 617 and 411 m, respectively, over Ulaanbaatar city from 1957 to 2004. In winter, the morning inversion thickness was 719–796 m, while the evening inversion thickness was 553–732 m for the period [30]. Wang et al. [22] stated that winter inversion thickness was 479–593 m from 2008 to 2016. However, the annual average inversion thickness was 427 m in the morning and 247 m in the evening from 2012 to 2020. In winter, the inversion intensity decreased to 449–549 m in the morning and 419–518 m in the evening for the period. The results illustrate that the thickness of the inversion has decreased significantly because of surface warming around the city. On the other hand, the inversion layer parameters have been measured more accurately due to the reform of the measurement system.

3.3. Air Pollution Potential in Ulaanbaatar City

Winds disperse air pollutants horizontally, while the turbulent mixing process of the boundary layer exchanges them vertically with an upper air mixture. The air exchange process is expressed by MLH, wind speed, and VC estimated from the vertical measurement data of the atmosphere [49]. Because these atmospheric parameters are essential indicators for planning in air-polluted cities [44], the specific categories of VC are called the air pollution potential.
The monthly MLH, the average wind speed below MLH, and the VC over Ulaanbaatar city were calculated using daily radiosonde data from 2012 to 2020 (Figure 11).
The average annual, warm, and cold season MLHs were 613.2, 859.7, and 366.3 m, respectively. Monthly MLH varied from 194.7 to 364.9 m due to air sinking under the near-surface temperature inversion layer in the winter, while it was approximately 899.2–1103.7 m due to surface heating in the summer months (Figure 11a and Figure 12). The locations of the MLH and the top of the temperature inversion layer in the winter are shown in Figure 12a, while its seasonal locations appear in Figure 12b.
When the MLH is below the near-surface temperature inversion layer in the cold season, air pollutant accumulation will increase, and in the opposite case in the warm season, the lower level air can be mixed by turbulent motion; the air pollutants can then be dispersed horizontally and vertically [30].
The mean annual, warm, and cold season mean wind speeds below MLH were 4.2, 5.0 and 3.4 m·s−1, respectively. The mean monthly wind speeds ranged from 0.8 to 4.5 m·s−1 in winter and 3.6 to 5.5 m·s−1 in the summer months (Figure 11b).
VC is the multiplication of the above two variables. The average annual, warm, and cold season VCs were 3072.9, 4507.9 and 1637.8 m2·s−1, respectively. The monthly VCs fluctuated from 256.8 to 1730.7 m2·s−1 in winter and were 3213.3 to 5307.7 m2·s−1 in summer (Figure 11c). Higher values of VC correspond to lower air pollution potential categories indicating cleaner air. According to Table 2 and Figure 11c, the monthly average air pollution potential over Ulaanbaatar is “very high” from mid-November to early April in the cold season. The “high” air pollution potential conditions dominate during June, September, and October, which are dry months. In April to May and July to August, “medium” air pollution potential conditions occur over Ulaanbaatar. However, the “low” and “very low” air pollution potential cases can be observed for a short timescale during the warm season.

3.4. Air Pollutants and Their Correlation with Atmospheric Factors in Ulaanbaatar City

In the warm and cold seasons, the diurnal variations in the concentrations of PM10, NO2, SO2, and carbon monoxide (CO) in the different land use areas of Ulaanbaatar city are shown in Figure 13. From a health perspective, PM2.5 is more critical than PM10. Because PM2.5 concentrations are not measured at 100 ail and Urgakhnaran stations, PM10 concentrations have been used as the particulate matter pollutant. Due to site location or land use type, the diurnal variations in PM10, NO2, CO, and SO2 concentrations differ. For example, because the Urgakhnaran site is located near the road in the eastern suburb of Ulaanbaatar and is distant from the air pollution sources, diurnal NO2 variation shows two maximums during the peak hours of traffic in the morning and evening, and the second maximum corresponds to the photochemistry effect in the afternoon. The same variation of NO2 is observed at the West crossroad station. However, no diurnal variation is apparent for the remaining pollutants due to the remote location from the sources.
Nevertheless, the other three air quality stations, such as Television, 100 ail, and West crossroad, are in the primary air-polluting source belts near the city center. Together, these areas are considered the air pollution accumulation zone. For these three stations in the city center, the diurnal variations of PM10, CO, NO2 and SO2 show two maximums due to peak hours of traffic and residential heating under the atmospheric stagnation conditions and a minimum during the weakening periods of temperature inversion and anthropogenic activity. The diurnal variations in the pollutants are especially evident in Television and 100-ail stations near the slum/ger area districts. However, they are unclear except for NO2 at the West crossroad station in the traffic zone (Figure 13).
In the cold season, the concentrations of air pollutants are markedly higher than in the warm season due to the increase in solid and liquid fuel consumption, and for more than 50% of the annual observations, the concentrations exceed the Mongolian AQS. Furthermore, in the cold season, air pollutant concentrations are increased from the suburb place (Urgakhnaran) to the city center (Television and 100-ail stations), which is the wind convergence or pollutant accumulation zone, due to topography-influenced meteorological processes under atmospheric stagnation conditions (Figure 13).
Figure 14 shows the correlations between monthly average meteorological variables, such as wind speed, relative humidity, the intensity of near-surface temperature inversion, and concentrations of air pollutants, such as PM10, NO2, SO2, and CO. Although meteorological variables and air pollutants were synchronically measured at each air quality monitoring station, the effects of atmospheric stagnation and ventilation conditions were studied by plotting data from the West crossroad air quality monitoring (AQM) and Ulaanbaatar radiosonde stations (Figure 14). The data quality of the West crossroad AQM station was better than of the other stations near the radiosonde station. All pollutants demonstrated a moderate to high positive correlation with relative humidity (R = 0.55–0.77, p < 0.05) and temperature inversion intensity (R = 0.59–0.89, p < 0.01) and a moderate to high negative correlation with wind speed (R = 0.51–0.81, p < 0.05).
PM10 and PM2.5 are toxic particles that cause infection of the lower and upper respiratory tracts in humans [53]. Figure 15 illustrates the relationship between air pollution potential parameters, such as VC and MLH, and particulate pollutants PM2.5 and PM10.
The concentrations of PM10 and PM2.5 highly depend on the MLH and VC and are inversely correlated by the exponential law (R2 = 0.49–0.85, p < 0.001) for time. For example, in the morning (08:00 LST), PM10 and PM2.5 concentrations are high due to intensified temperature inversion and shallow MLH, while these are low because of opposite conditions in the evening (20:00 LST). Therefore, correlations between particulate pollutants and air pollution potential parameters are inversely high at R2 = 0.77–0.85, p < 0.001 in the morning, while inversely medium at R2 = 0.49–0.74, p < 0.001 in the evening. Significantly, compared with PM10, the PM2.5 concentrations are highly correlated with MLH and VC. Very high and high air pollution potential categories are associated with the high PM10 and PM2.5 concentrations (Table 2, Figure 15).

4. Conclusions

  • In Ulaanbaatar, during winter, temperature inversion is stabilized and maintained by surface cooling under the influence of a high air pressure region, which is the primary weather condition favoring the long-term accumulation of pollutants released into the air. Thus, decision makers must consider these climate patterns when planning measures to reduce air pollution.
  • Under the near-surface temperature inversion layer with 6.5–8.2 °C of intensity and 449–549 m of thickness, the average temperatures of the cold season were colder than −13.5 °C, and the residential heating and traffic peak hours matched with the high-intensity hours of the temperature inversion, which contribute to elevated air pollution.
  • In the cold season, around Ulaanbaatar, wind speeds are low, and windless days represented 34–66% of all observations. Due to mountain topography, south (29.4%), west (23.6%), east (17.4%) and northwest (15.6%) winds prevail from all sides of the city, polluting slum areas to the city center. Therefore, the prevailing wind directions should first be considered when selecting the areas for reducing the number of air-polluting sources.
  • In winter, day-to-day winds turn east and southeast at night due to the influence of mountains and valleys, which can lead to the accumulation of pollution from sources in the city’s eastern part, which in turn affects the city center.
  • High-rise buildings in the city center directly impact the city’s microclimate, such as through urban heat islands and windless conditions.
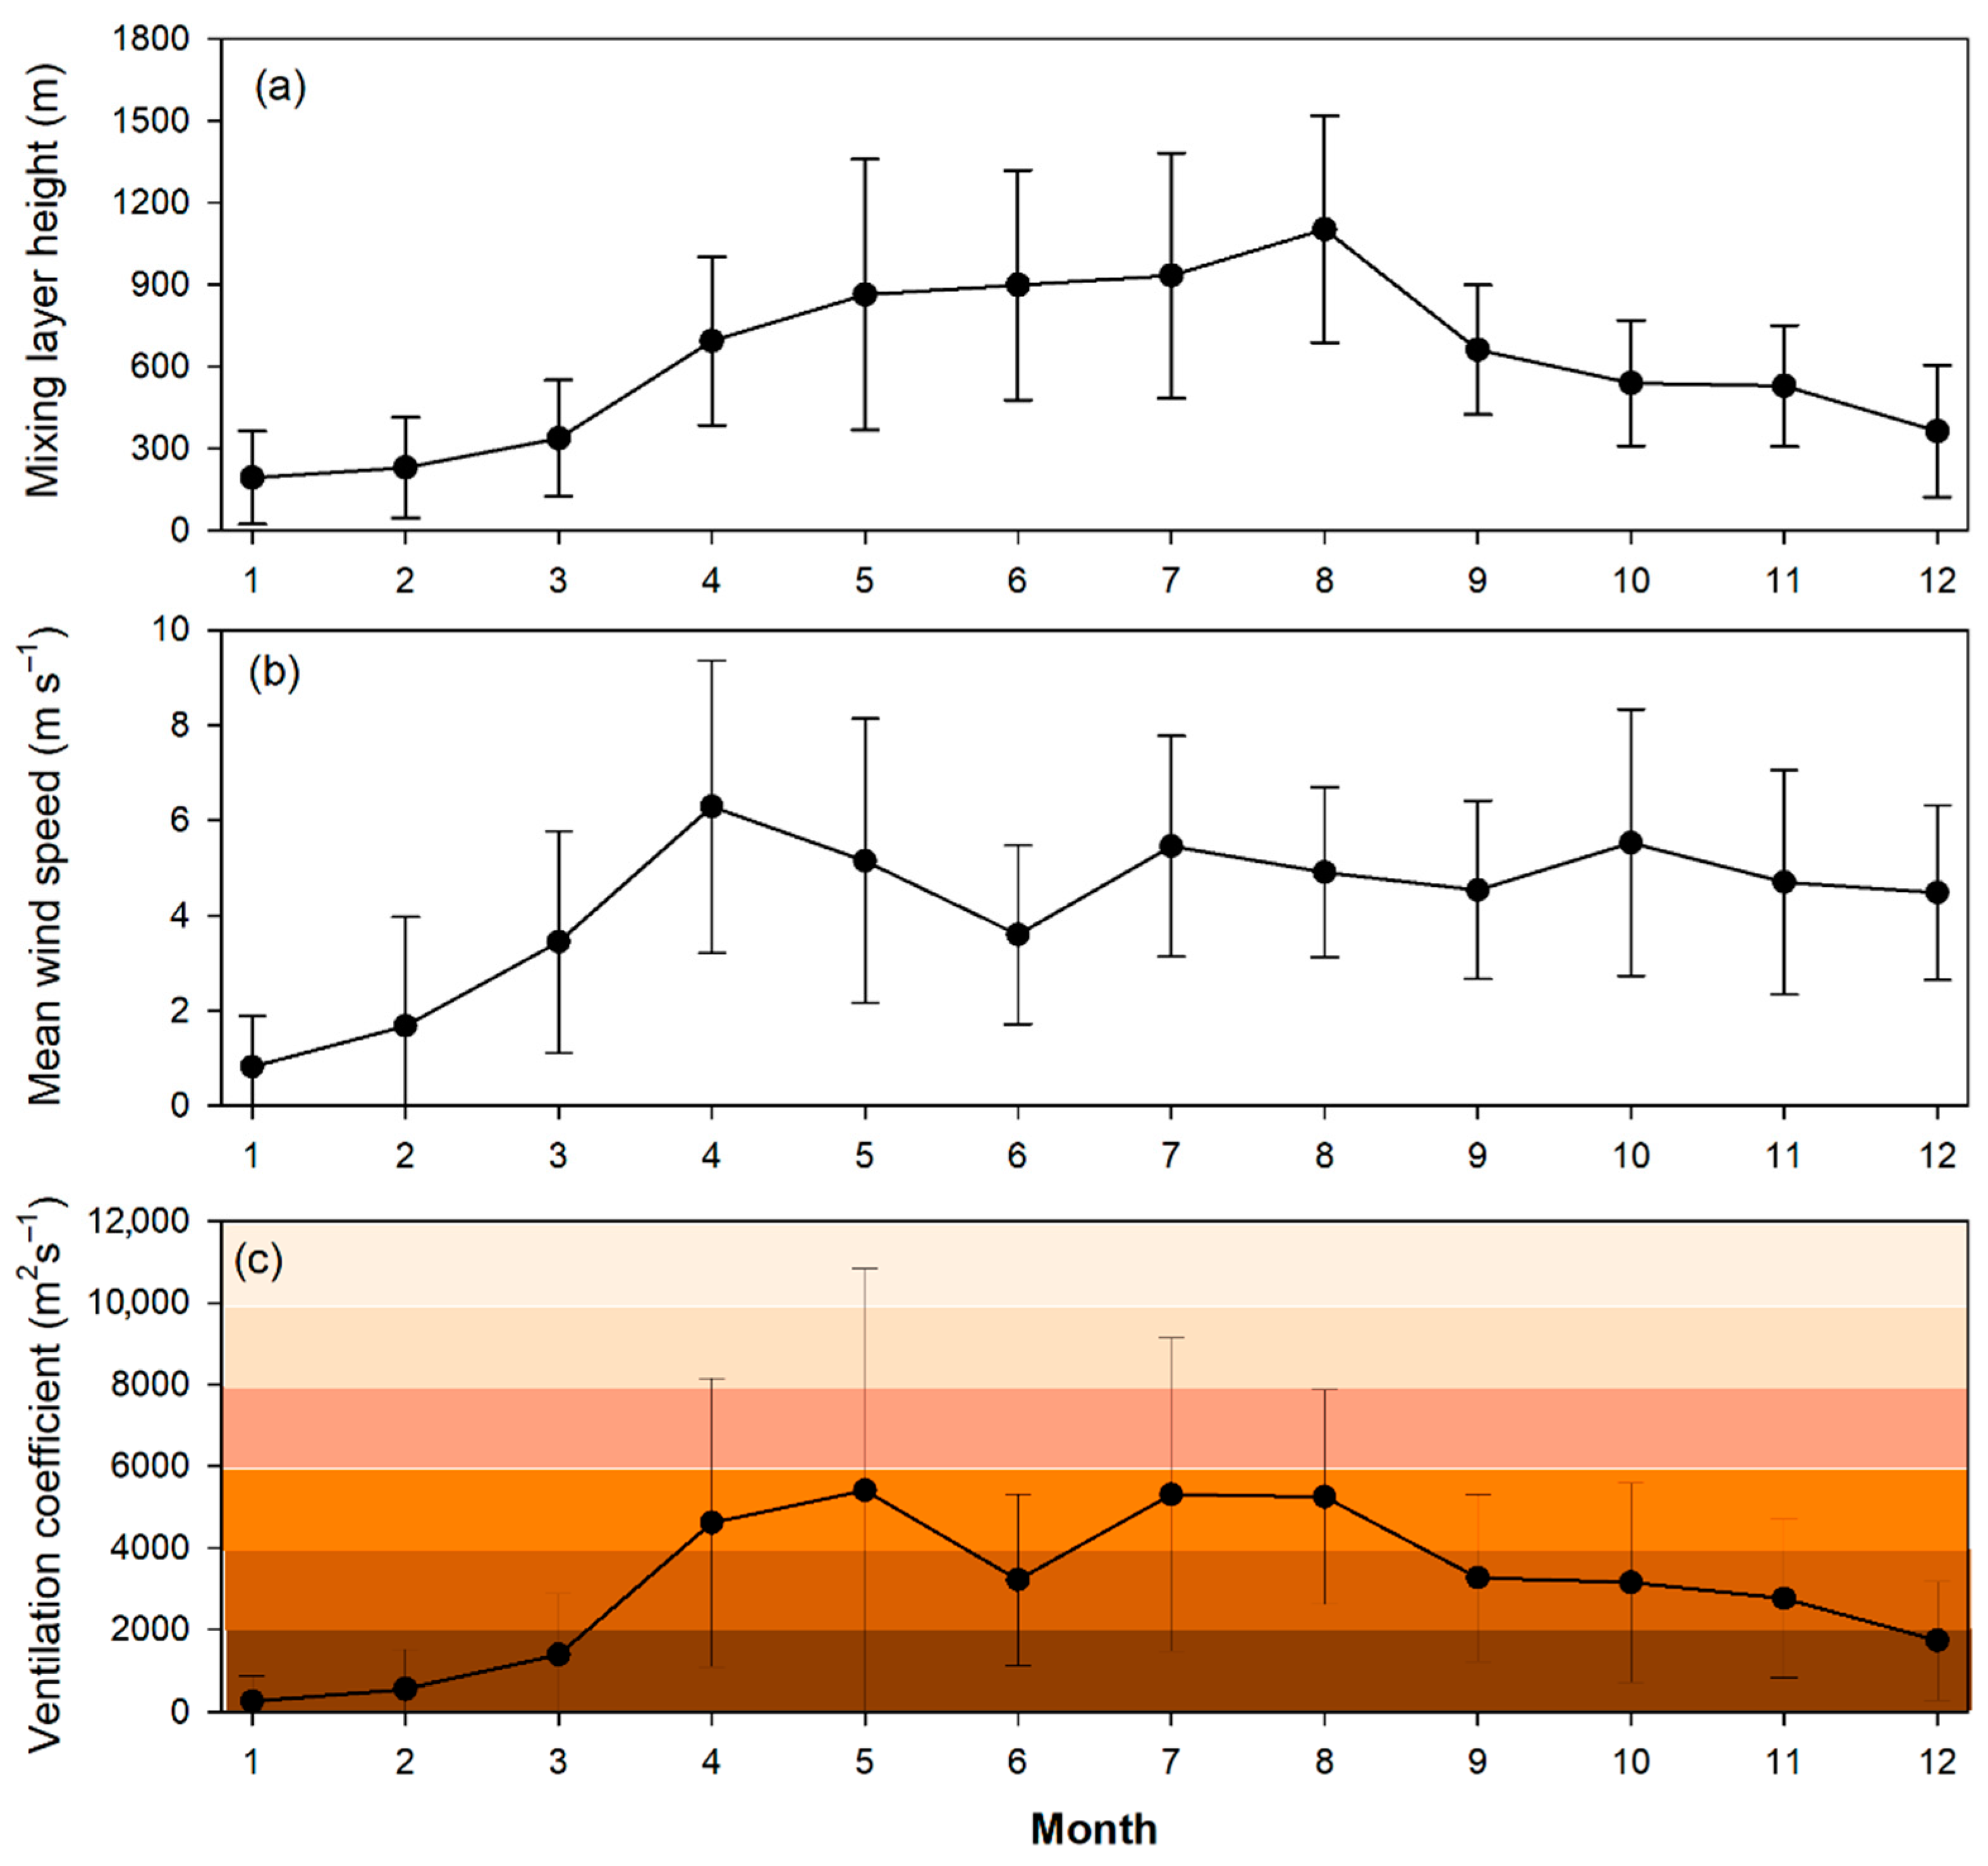
  • In the winter months, MLH ranges from 194.7 to 364.9 m due to air sinking under the near-surface temperature inversion layer. The mean wind speeds of the MLH ranges from 0.8 to 4.5 m·s−1. Monthly VCs range from 256.8 to 1730.7 m2·s−1 in winter. Due to the variability in VC, the city’s air pollution potential is “very high” from mid-November to early April in the cold season. The “high” air pollution potential conditions dominate during June, September, and October, which are dry months. The “high” and “very high” air pollution potential categories mostly correspond to pollutant concentrations exceeding the AQSs.
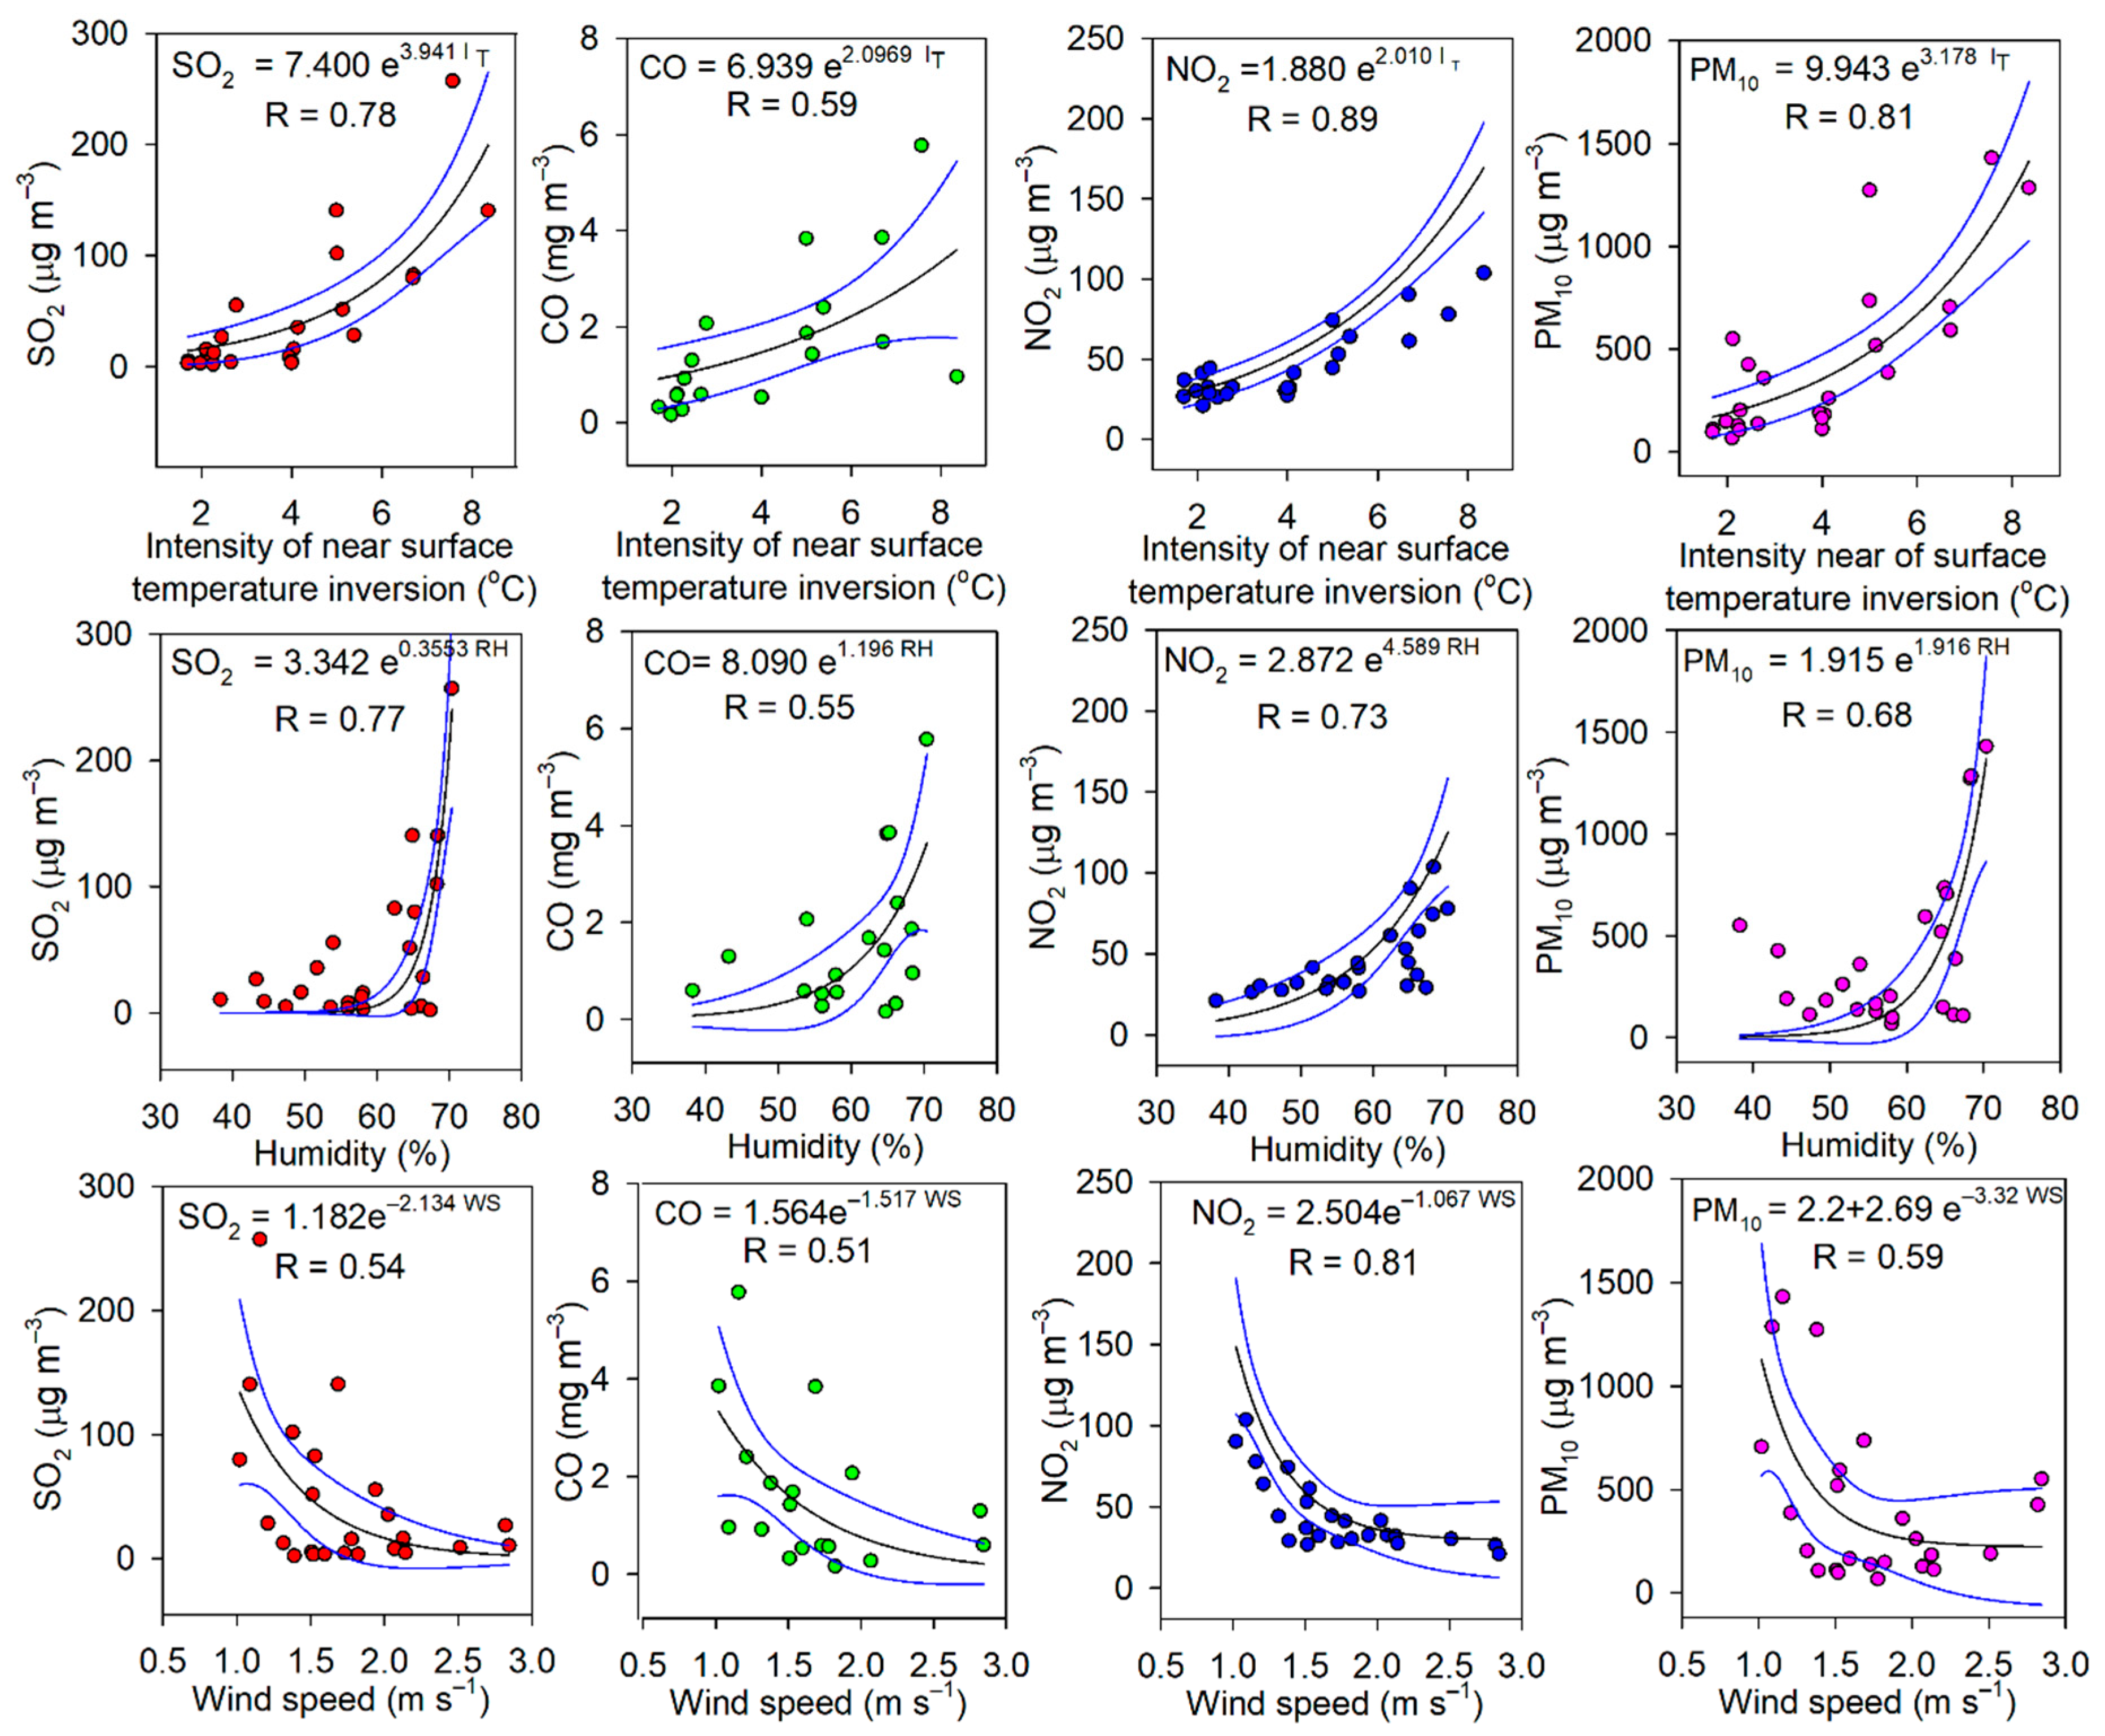
  • The concentrations of PM10, NO2, SO2, and CO show a moderate to high positive correlation with the relative humidity (R = 0.55–0.77) and temperature inversion intensity (R = 0.59–0.89) and a moderate to high negative correlation with wind speed (R = 0.51–0.81). PM10 and PM2.5 concentrations depend highly on the MLH and VC and are inversely correlated by the exponential law (R2 = 0.49–0.85, p < 0.001) for a time of day. Significantly, compared with PM10, the PM2.5 concentrations are highly correlated with MLH and VC. Moreover, the correlation coefficients are lower in the evening than in the morning. Therefore, the forecasting model of air pollution can be developed using these atmospheric parameters and temporal variation patterns.

Supplementary Materials

The following supporting information can be downloaded at: https://www.mdpi.com/article/10.3390/cli11010004/s1, Figure S1: Seasonal variations in sunshine duration and global radiation (1991–2020) [54,55].

Author Contributions

Conceptualization, E.S., S.D., and M.P.; methodology, E.S., S.D., M.P., and O.D.; software, S.D., M.B., and G.G.; validation, E.S., M.P., and G.G.; formal analysis, E.S., S.D., M.P., B.B., and M.S.; investigation, E.S., S.D., and M.B.; resources, M.P., O.D., M.B., B.T., and M.S.; data curation, M.P., B.B., M.S., and B.T.; writing—original draft preparation, E.S., S.D., G.G., and O.D.; writing—review and editing, E.S., B.B., M.S., and B.T.; visualization, S.D., M.B., and G.G.; supervision, E.S., and M.P.; project administration, M.P., and E.S.; funding acquisition, M.P. All authors have read and agreed to the published version of the manuscript.

Funding

This research was funded by the National University of Mongolia (NUM), grant numbers: P2022-4403 and P2022-4385 as well as from research expenses for professors and associate professors by Division of Natural Sciences of School of Arts and Sciences of NUM.

Institutional Review Board Statement

Not applicable.

Informed Consent Statement

Not applicable.

Data Availability Statement

Not applicable.

Acknowledgments

We thank NAMEM for supplying all data used in this study. The authors also acknowledge the National University of Mongolia for providing technical and financial support. Finally, we are highly grateful to the anonymous editors and reviewers for their valuable suggestions and comments that significantly improved the manuscript’s quality.

Conflicts of Interest

The authors declare no conflict of interest.

References

  1. West, J. Asia’s Stunted Economic Development. In Asian Century… on a Knife-Edge: A 360 Degree Analysis of Asia’s Recent Economic Development; West, J., Ed.; Springer: Singapore, 2018; pp. 19–55. [Google Scholar]
  2. Liang, W.; Yang, M. Urbanization, economic growth and environmental pollution: Evidence from China. Sustain. Comput. Inform. Syst. 2019, 21, 1–9. [Google Scholar] [CrossRef]
  3. Soyol-Erdene, T.-O.; Ganbat, G.; Baldorj, B. Urban Air Quality Studies in Mongolia: Pollution Characteristics and Future Research Needs. Aerosol Air Qual. Res. 2021, 21, 210163. [Google Scholar] [CrossRef]
  4. Luvsan, M.-E.; Shie, R.-H.; Purevdorj, T.; Badarch, L.; Baldorj, B.; Chan, C.-C. The influence of emission sources and meteorological conditions on SO2 pollution in Mongolia. Atmos. Environ. 2012, 61, 542–549. [Google Scholar] [CrossRef]
  5. Fan, P.; Chen, J.; John, R. Urbanization and environmental change during the economic transition on the Mongolian Plateau: Hohhot and Ulaanbaatar. Environ. Res. 2016, 144, 96–112. [Google Scholar] [CrossRef] [Green Version]
  6. Nakao, M.; Yamauchi, K.; Ishihara, Y.; Omori, H.; Ichinnorov, D.; Solongo, B. Effects of air pollution and seasons on health-related quality of life of Mongolian adults living in Ulaanbaatar: Cross-sectional studies. BMC Public Health 2017, 17, 594. [Google Scholar] [CrossRef] [Green Version]
  7. Ariunsaikhan, A.; Batbaatar, B.; Dorjsuren, B.; Chonokhuu, S. Air pollution levels and PM2. 5 concentrations in Khovd and Ulaanbaatar cities of Mongolia. Int. J. Environ. Sci. Technol. 2022. [Google Scholar] [CrossRef]
  8. Suriya; Natsagdorj, N.; Aorigele; Zhou, H.; Sachurila. Spatiotemporal Variation in Air Pollution Characteristics and Influencing Factors in Ulaanbaatar from 2016 to 2019. Atmosphere 2022, 13, 990. [Google Scholar] [CrossRef]
  9. Amarsaikhan, D.; Battsengel, V.; Nergui, B.; Ganzorig, M.; Bolor, G. A Study on Air Pollution in Ulaanbaatar City, Mongolia. J. Geosci. Environ. Prot. 2014, 2, 123–128. [Google Scholar] [CrossRef]
  10. Gantumur, B.; Wu, F.; Vandansambuu, B.; Tsegmid, B.; Dalaibaatar, E.; Zhao, Y. Spatiotemporal dynamics of urban expansion and its simulation using CA-ANN model in Ulaanbaatar, Mongolia. Geocarto Int. 2022, 37, 494–509. [Google Scholar] [CrossRef]
  11. Batsuuri, B.; Fürst, C.; Myagmarsuren, B. Estimating the Impact of Urban Planning Concepts on Reducing the Urban Sprawl of Ulaanbaatar City Using Certain Spatial Indicators. Land 2020, 9, 495. [Google Scholar] [CrossRef]
  12. Park, H.; Fan, P.; John, R.; Ouyang, Z.; Chen, J. Spatiotemporal changes of informal settlements: Ger districts in Ulaanbaatar, Mongolia. Landsc. Urban Plan. 2019, 191, 103630. [Google Scholar] [CrossRef]
  13. Ganbat, G.; Soyol-Erdene, T.-O.; Jadamba, B. Recent Improvement in Particulate Matter (PM) Pollution in Ulaanbaatar, Mongolia. Aerosol Air Qual. Res. 2020, 20, 2280–2288. [Google Scholar] [CrossRef]
  14. Enkhmaa, D.; Warburton, N.; Javzandulam, B.; Uyanga, J.; Khishigsuren, Y.; Lodoysamba, S.; Enkhtur, S.; Warburton, D. Seasonal ambient air pollution correlates strongly with spontaneous abortion in Mongolia. BMC Pregnancy Childbirth 2014, 14, 146. [Google Scholar] [CrossRef] [PubMed] [Green Version]
  15. Huang, Y.-K.; Luvsan, M.-E.; Gombojav, E.; Ochir, C.; Bulgan, J.; Chan, C.-C. Land use patterns and SO2 and NO2 pollution in Ulaanbaatar, Mongolia. Environ. Res. 2013, 124, 1–6. [Google Scholar] [CrossRef]
  16. Allen, R.W.; Gombojav, E.; Barkhasragchaa, B.; Byambaa, T.; Lkhasuren, O.; Amram, O.; Takaro, T.K.; Janes, C.R. An assessment of air pollution and its attributable mortality in Ulaanbaatar, Mongolia. Air Qual. Atmos. Health 2013, 6, 137–150. [Google Scholar] [CrossRef] [PubMed] [Green Version]
  17. Government of Mongolia. National Program to Reduce Air and Environmental Pollution; Government of Mongolia: Ulaanbaatar, Mongolia, 2017. [Google Scholar]
  18. Guttikunda, S.K.; Lodoysamba, S.; Bulgansaikhan, B.; Dashdondog, B. Particulate pollution in Ulaanbaatar, Mongolia. Air Qual. Atmos. Health 2013, 6, 589–601. [Google Scholar] [CrossRef]
  19. Davy, P.K.; Gunchin, G.; Markwitz, A.; Trompetter, W.J.; Barry, B.J.; Shagjjamba, D.; Lodoysamba, S. Air particulate matter pollution in Ulaanbaatar, Mongolia: Determination of composition, source contributions and source locations. Atmos. Pollut. Res. 2011, 2, 126–137. [Google Scholar] [CrossRef] [Green Version]
  20. Nishikawa, M.; Matsui, I.; Batdorj, D.; Jugder, D.; Mori, I.; Shimizu, A.; Sugimoto, N.; Takahashi, K. Chemical composition of urban airborne particulate matter in Ulaanbaatar. Atmos. Environ. 2011, 45, 5710–5715. [Google Scholar] [CrossRef]
  21. Enkhbat, E.; Geng, Y.; Zhang, X.; Jiang, H.; Liu, J.; Wu, D. Driving forces of air pollution in ulaanbaatar city between 2005 and 2015: An index decomposition analysis. Sustainability 2020, 12, 3185. [Google Scholar] [CrossRef] [Green Version]
  22. Wang, M.; Kai, K.; Sugimoto, N.; Enkhmaa, S. Meteorological factors affecting winter particulate air pollution in Ulaanbaatar from 2008 to 2016. Asian J. Atmos. Environ. 2018, 12, 244–254. [Google Scholar] [CrossRef]
  23. Dorligjav, S.; Sumiya, E.; Purevjav, G. Influence of photochemistry and meteorology on seasonal variation of surface ozone. Pap. Meteorol. Hydrol. 2015, 35, 48–59. [Google Scholar]
  24. Wang, M.; Kai, K.; Jin, Y.; Sugimoto, N.; Dashdondog, B. Air particulate pollution in Ulaanbaatar, Mongolia: Variation in atmospheric conditions from autumn to winter. Sola 2017, 13, 90–95. [Google Scholar] [CrossRef] [Green Version]
  25. Enebish, T.; Chau, K.; Jadamba, B.; Franklin, M. Predicting ambient PM2.5 concentrations in Ulaanbaatar, Mongolia with machine learning approaches. J. Expo. Sci. Environ. Epidemiol. 2021, 31, 699–708. [Google Scholar] [CrossRef]
  26. Koo, B.; Na, J.-I.; Thorsteinsson, T.; Cruz, A.M. Participatory approach to gap analysis between policy and practice regarding air pollution in ger areas of Ulaanbaatar, Mongolia. Sustainability 2020, 12, 3309. [Google Scholar] [CrossRef] [Green Version]
  27. Urban Planning and Research Institute (UPRI). General Development Plan of Ulaanbaatar Until 2040—Basic Research; UPRI: Ulaanbaatar, Mongolia, 2021; Available online: https://www.ulaanbaatar2040.mn/p/160/suur-sudalgaa. (accessed on 20 October 2022).
  28. Sumiya, E.; Dorligjav, S.; Gombodorj, G.; Dugerjav, O.; Byamba-Ochir, M. Master Plan on Reducing Air Pollution of Ulaanbaatar City; Air Pollution Control Department of Capital City: Ulaanbaatar, Mongolia, 2017. [Google Scholar]
  29. Ganbat, G.; Baik, J.-J. Wintertime winds in and around the Ulaanbaatar metropolitan area in the presence of a temperature inversion. Asia-Pac. J. Atmos. Sci. 2016, 52, 309–325. [Google Scholar] [CrossRef]
  30. Sumiya, E. Study on Near-Surface Temperature Inversion of Mongolia; National University of Mongolia: Ulaanbaatar, Mongolia, 2008; p. 180. [Google Scholar]
  31. Dugerjav, O.; Shagdar, N. Analysis of the relationship between wind direction and air pollutants in Ulaanbaatar city. Pap. Meteorol. Hydrol. 2015, 35, 125–134. [Google Scholar]
  32. Yang, X.; Wang, J.; Cao, J.; Ren, S.; Ran, Q.; Wu, H. The spatial spillover effect of urban sprawl and fiscal decentralization on air pollution: Evidence from 269 cities in China. Empir. Econ. 2022, 63, 847–875. [Google Scholar] [CrossRef]
  33. Urban Planning and Research Institute (UPRI). General Development Plan of Ulaanbaatar Until 2040—Implementing Measures Plan; UPRI: Ulaanbaatar, Mongolia, 2021; Available online: https://www.ulaanbaatar2040.mn/p/159/xogzliin-eronxii-tolovlogoo. (accessed on 20 October 2022).
  34. Parliament of Mongolia. Vision 2050 Mongolia’s Long-Term Development Concept; Parliament of Mongolia: Ulaanbaatar, Mongolia, 2019; Available online: https://legalinfo.mn/mn/detail?lawId=211057&showType=1. (accessed on 12 September 2022).
  35. Purevtseren, M.; Tsegmid, B.; Indra, M.; Sugar, M. The Fractal Geometry of Urban Land Use: The Case of Ulaanbaatar City, Mongolia. Land 2018, 7, 67. [Google Scholar] [CrossRef] [Green Version]
  36. NSO, M. Population. 2021. Available online: https://www.1212.mn/Stat.aspx?LIST_ID=976_L03&type=tables (accessed on 2 September 2022).
  37. Jambaajamts, B. Climate of Mongolia; State Printing House: Ulaanbaatar, Mongolia, 1989; p. 270. [Google Scholar]
  38. Dong, W.; Jiang, Y.; Yang, S. Response of the starting dates and the lengths of seasons in Mainland China to global warming. Clim. Change 2010, 99, 81–91. [Google Scholar] [CrossRef]
  39. Genden, N. Climate and Geophysical Parameters Applying in Construction Planning (Construction Norms and Rules 23-01-09), 2nd ed.; Gantulga, D., Ed.; Ministry of Construction and Urban Development: Ulaanbaatar, Mongolia, 2009; p. 131. [Google Scholar]
  40. Kerimray, A.; Rojas-Solórzano, L.; Amouei Torkmahalleh, M.; Hopke, P.K.; Ó Gallachóir, B.P. Coal use for residential heating: Patterns, health implications and lessons learned. Energy Sustain. Dev. 2017, 40, 19–30. [Google Scholar] [CrossRef]
  41. Oke, T.R. The energetic basis of the urban heat island. Q. J. R. Meteorol. Soc. 1982, 108, 1–24. [Google Scholar] [CrossRef]
  42. Ganbat, G.; Han, J.-Y.; Ryu, Y.-H.; Baik, J.-J. Characteristics of the urban heat island in a high-altitude metropolitan city, Ulaanbaatar, Mongolia. Asia-Pac. J. Atmos. Sci. 2013, 49, 535–541. [Google Scholar] [CrossRef]
  43. Hutchinson, M.F.; McKenney, D.W.; Lawrence, K.; Pedlar, J.H.; Hopkinson, R.F.; Milewska, E.; Papadopol, P. Development and testing of Canada-wide interpolated spatial models of daily minimum–maximum temperature and precipitation for 1961–2003. J. Appl. Meteorol. Climatol. 2009, 48, 725–741. [Google Scholar] [CrossRef]
  44. Kannemadugu, H.B.S.; Dorligjav, S.; Gharai, B.; Seshasai, M.V.R. Satellite-Based Air Pollution Potential Climatology over India. Water Air Soil Pollut. 2021, 232, 365. [Google Scholar] [CrossRef]
  45. Holzworth, G.C. Mixing Depths, Wind Speeds and Air Pollution Potential for Selected Locations in the United States. J. Appl. Meteorol. Climatol. 1967, 6, 1039–1044. [Google Scholar] [CrossRef]
  46. Gross, E. The National Air Pollution Potential Forecast Program; U.S. Dept. of Commerce. 1970. Available online: ftp://ftp.library.noaa.gov/noaa_documents.lib/NWS/National_Meteorological_Center/TM_NMC/TM_NMC_70.pdf (accessed on 2 September 2022).
  47. Lu, C.; Deng, Q.-h.; Liu, W.-w.; Huang, B.-l.; Shi, L.-z. Characteristics of ventilation coefficient and its impact on urban air pollution. J. Cent. South Univ. 2012, 19, 615–622. [Google Scholar] [CrossRef]
  48. Seidel, D.J.; Ao, C.O.; Li, K. Estimating climatological planetary boundary layer heights from radiosonde observations: Comparison of methods and uncertainty analysis. J. Geophys. Res. Atmos. 2010, 115. [Google Scholar] [CrossRef] [Green Version]
  49. Oke, T.R. Boundary Layer Climates, 2nd ed.; Routledge: London, UK, 1987; p. 464. [Google Scholar]
  50. Byamba-Ochir, M.; Purevjav, G.; Sumiya, E.; Dorligjav, S. To estimate air temperature and precipitation of Mongolia (1991–2020) for the high-resolution grid using ANUSPLIN statistical model. J. Geogr. Issues 2022, 22, 92–102. [Google Scholar] [CrossRef]
  51. Ozawa, F.; Nakayoshi, M.; Kitta, S. Seasonal change in biorhythm by continuous measurement on human thermal physiology. In Proceedings of the 10th International Conference on Urban Climate/14th Symposium on the Urban Environment, New York, NY, USA, 6–10 August 2018. [Google Scholar]
  52. Jauhiainen, H.; Lentonen, J.; Survo, P.; Lehtinen, R.; Pietari, T. The implications of Vaisala’s new radiosonde RS41 on improved in-situ observations for meteorological applications. In Proceedings of the AMS Annual Meeting, Indianapolis, IN, USA, 21–23 May 2014. [Google Scholar]
  53. Romieu, I.; Samet, J.M.; Smith, K.R.; Bruce, N. Outdoor Air Pollution and Acute Respiratory Infections Among Children in Developing Countries. J. Occup. Environ. Med. 2002, 44, 640–649. [Google Scholar] [CrossRef]
  54. Kumar, B.; Garg, D.; Swamy, K.; Kumar, P. Clean Energy Production Using Solar Energy Resources. In Sustainable and Clean Energy Production Technologies; Pal, D.B., Jha, J.M., Eds.; Springer Nature Singapore: Singapore, 2022; pp. 269–288. [Google Scholar] [CrossRef]
  55. Chong, W.; Lyu, W.; Zhang, J.; Liang, J.; Yang, X.; Zhang, G. Effects of Air Pollution on Sunshine Duration Trends in Typical Chinese Cities. Atmosphere 2022, 13, 950. [Google Scholar] [CrossRef]
Figure 1. Maps showing location (a) and elevation (b) of Ulaanbaatar city.
Climate 11 00004 g001
Figure 2. Locations of weather and air quality monitoring stations in Ulaanbaatar city.
Climate 11 00004 g002
Figure 3. Climate diagram of Ulaanbaatar city (1991–2020).
Climate 11 00004 g003
Figure 4. Seasonal variations in air temperature of Ulaanbaatar city.
Climate 11 00004 g004
Figure 5. Spatial distribution of the average air temperature of the cold season (October to March) around Ulaanbaatar city (1991 to 2020).
Climate 11 00004 g005
Figure 6. Diurnal variations in average air temperature in winter and summer.
Climate 11 00004 g006
Figure 7. Diurnal variations in average wind speed in winter and summer.
Climate 11 00004 g007
Figure 8. Windrose diagrams at Ulaanbaatar city’s weather stations in the winter: (a) Ulaanbaatar station, (b) University station, and (c) Buyant-Ukhaa station.
Climate 11 00004 g008
Figure 9. Monthly air temperature patterns of the lower troposphere over Ulaanbaatar city (1991–2020).
Climate 11 00004 g009
Figure 10. Diurnal variations in the near-surface temperature inversion intensity for Buyant-Ukhaa and Ulaanbaatar weather stations in winter.
Climate 11 00004 g010
Figure 11. Monthly variations in boundary layer height (a), the mean wind speed within the boundary layer (b), and the ventilation coefficient (c). The colored pattern is air pollution potential categories: a shift from darker to lighter colors corresponds to a decrease in air pollution potential, indicating cleaner air.
Climate 11 00004 g011
Figure 12. Winter (a) and seasonal (b) variations in MLH and temperature inversion layer thickness according to morning radiosonde data.
Climate 11 00004 g012
Figure 13. Diurnal variations in air pollutants in the different land use areas of Ulaanbaatar city in the warm and cold seasons from 2019 to 2020. The blue and green lines correspond to the cold and warm seasons; the red line is the Mongolian AQS for pollutants.
Climate 11 00004 g013
Figure 14. Correlations between monthly average air pollutants and meteorological parameters (West crossroad station) at 00:00 (UTC+08). The black line is the regression line, while the blue lines are the 95% confidence band.
Climate 11 00004 g014
Figure 15. Dependence of monthly average mixing layer height (a,b,e,f) and ventilation coefficient (c,d,g,h) on PM10 and PM2.5 particles in the western part of the city center (West crossroad station) in the morning and evening from 2019 to 2020. The solid line is the regression line, while the dotted green lines are the 95% confidence band. The colored patterns in panels (c,d,g,h) are air pollution potential categories: a shift from darker to lighter colors corresponds to a decrease in air pollution potential, indicating cleaner air.
Climate 11 00004 g015
Table 1. Location of the weather stations in Ulaanbaatar city.
#Station NameLocation within the CityDistance from the City CenterUrban Pattern
(Impact)
Geographical FeatureNorth LatitudeEast LongitudeElevation
1.UniversityThe central station in the city center0 kmApartment area with high-rise buildings
(Windless)
In the river valley between high mountains on the south and north sides47°55′22″106°55′12″1302 m
2.UlaanbaatarWest side of the city 7 kmSlum/ger area district with low-rise small dwellings (Warmer)In the river valley and closed by low mountains from the north to the northwest sides47°55′07″106°50′53″1306 m
3.Buyant-UkhaaSouthwest suburb of the city 14 kmSuburb and open area with all the sides (Coldest)In the river valley and surrounded by high mountains from the southeast to the west sides47°50′33″106°46′01″1286 m
Table 2. Categories of air pollution potential.
#Ventilation Coefficient (m2s−1)Air Pollution Potential ZoneColor Band
1.0–2000Very high
2.2000–4000High
3.4000–6000Medium
4.6000–8000Below medium
5.8000–10,000Low
6.>10,000Very low
Remark: The colored pattern is air pollution potential categories: a shift from darker to lighter colors corresponds to a decrease in air pollution potential, indicating cleaner air.
Table 3. Recent changes in the number of days with a near-surface temperature inversion over Ulaanbaatar city.
TimePeriodJanFebMarAprMayJunJulAugSepOctNovDec
00:00 (UTC+08)1957–200427231910654612172125
Morning 2012–2020211812421125121218
12:00 (UTC+08)1957–200423168322127121723
Evening 2012–202013821000025815
Remark: The number of days with a temperature inversion is the total observed inversion cases per month. For each radiosonde flight time, the data in the first line correspond to the results of Sumiya [30], while the data in the second line are our estimates for comparison with those of previous studies.
Table 4. Recent changes in the average monthly intensity (°C) of the near-surface temperature inversion over Ulaanbaatar city.
TimePeriodJanFebMarAprMayJunJulAugSepOctNovDecAnn
00:00 (UTC+08)1957–20048.87.44.62.92.31.51.52.23.34.56.58.44.5
Morning 2012–20208.26.54.83.51.31.90.61.53.74.45.57.14.1
12:00 (UTC+08)1957–20046.44.32.41.62.41.71.31.82.12.64.36.63.1
Evening 2012–20205.13.44.02.200002.52.53.34.73.5
Remark: The temperature inversion intensity is the difference between temperatures at the bottom and top of the layer. For each radiosonde flight time, the data in the first line correspond to the results of Sumiya [30], while the data in the second line are our estimates for comparison with those of previous studies.
Table 5. Recent changes in the monthly average thickness (m) of the near-surface temperature inversion over Ulaanbaatar city.
TimePeriodJanFebMarAprMayJunJulAugSepOctNovDecAnn
00:00 (UTC+08)1957–2004796719615548535489488484558648737791617
Morning2012–2020549449427354295290353356403428459509427
12:00 (UTC+08)1957–2004705553314266273298286315294340556732411
Evening2012–20205184193953750000191202375493247
Remark: The temperature inversion thickness is the difference between the bottom and top levels of the layer. For each radiosonde flight time, the data in the first line correspond to the results of Sumiya [30], while the data in the second line are our estimates for comparison with those of previous studies.
Disclaimer/Publisher’s Note: The statements, opinions and data contained in all publications are solely those of the individual author(s) and contributor(s) and not of MDPI and/or the editor(s). MDPI and/or the editor(s) disclaim responsibility for any injury to people or property resulting from any ideas, methods, instructions or products referred to in the content.

