
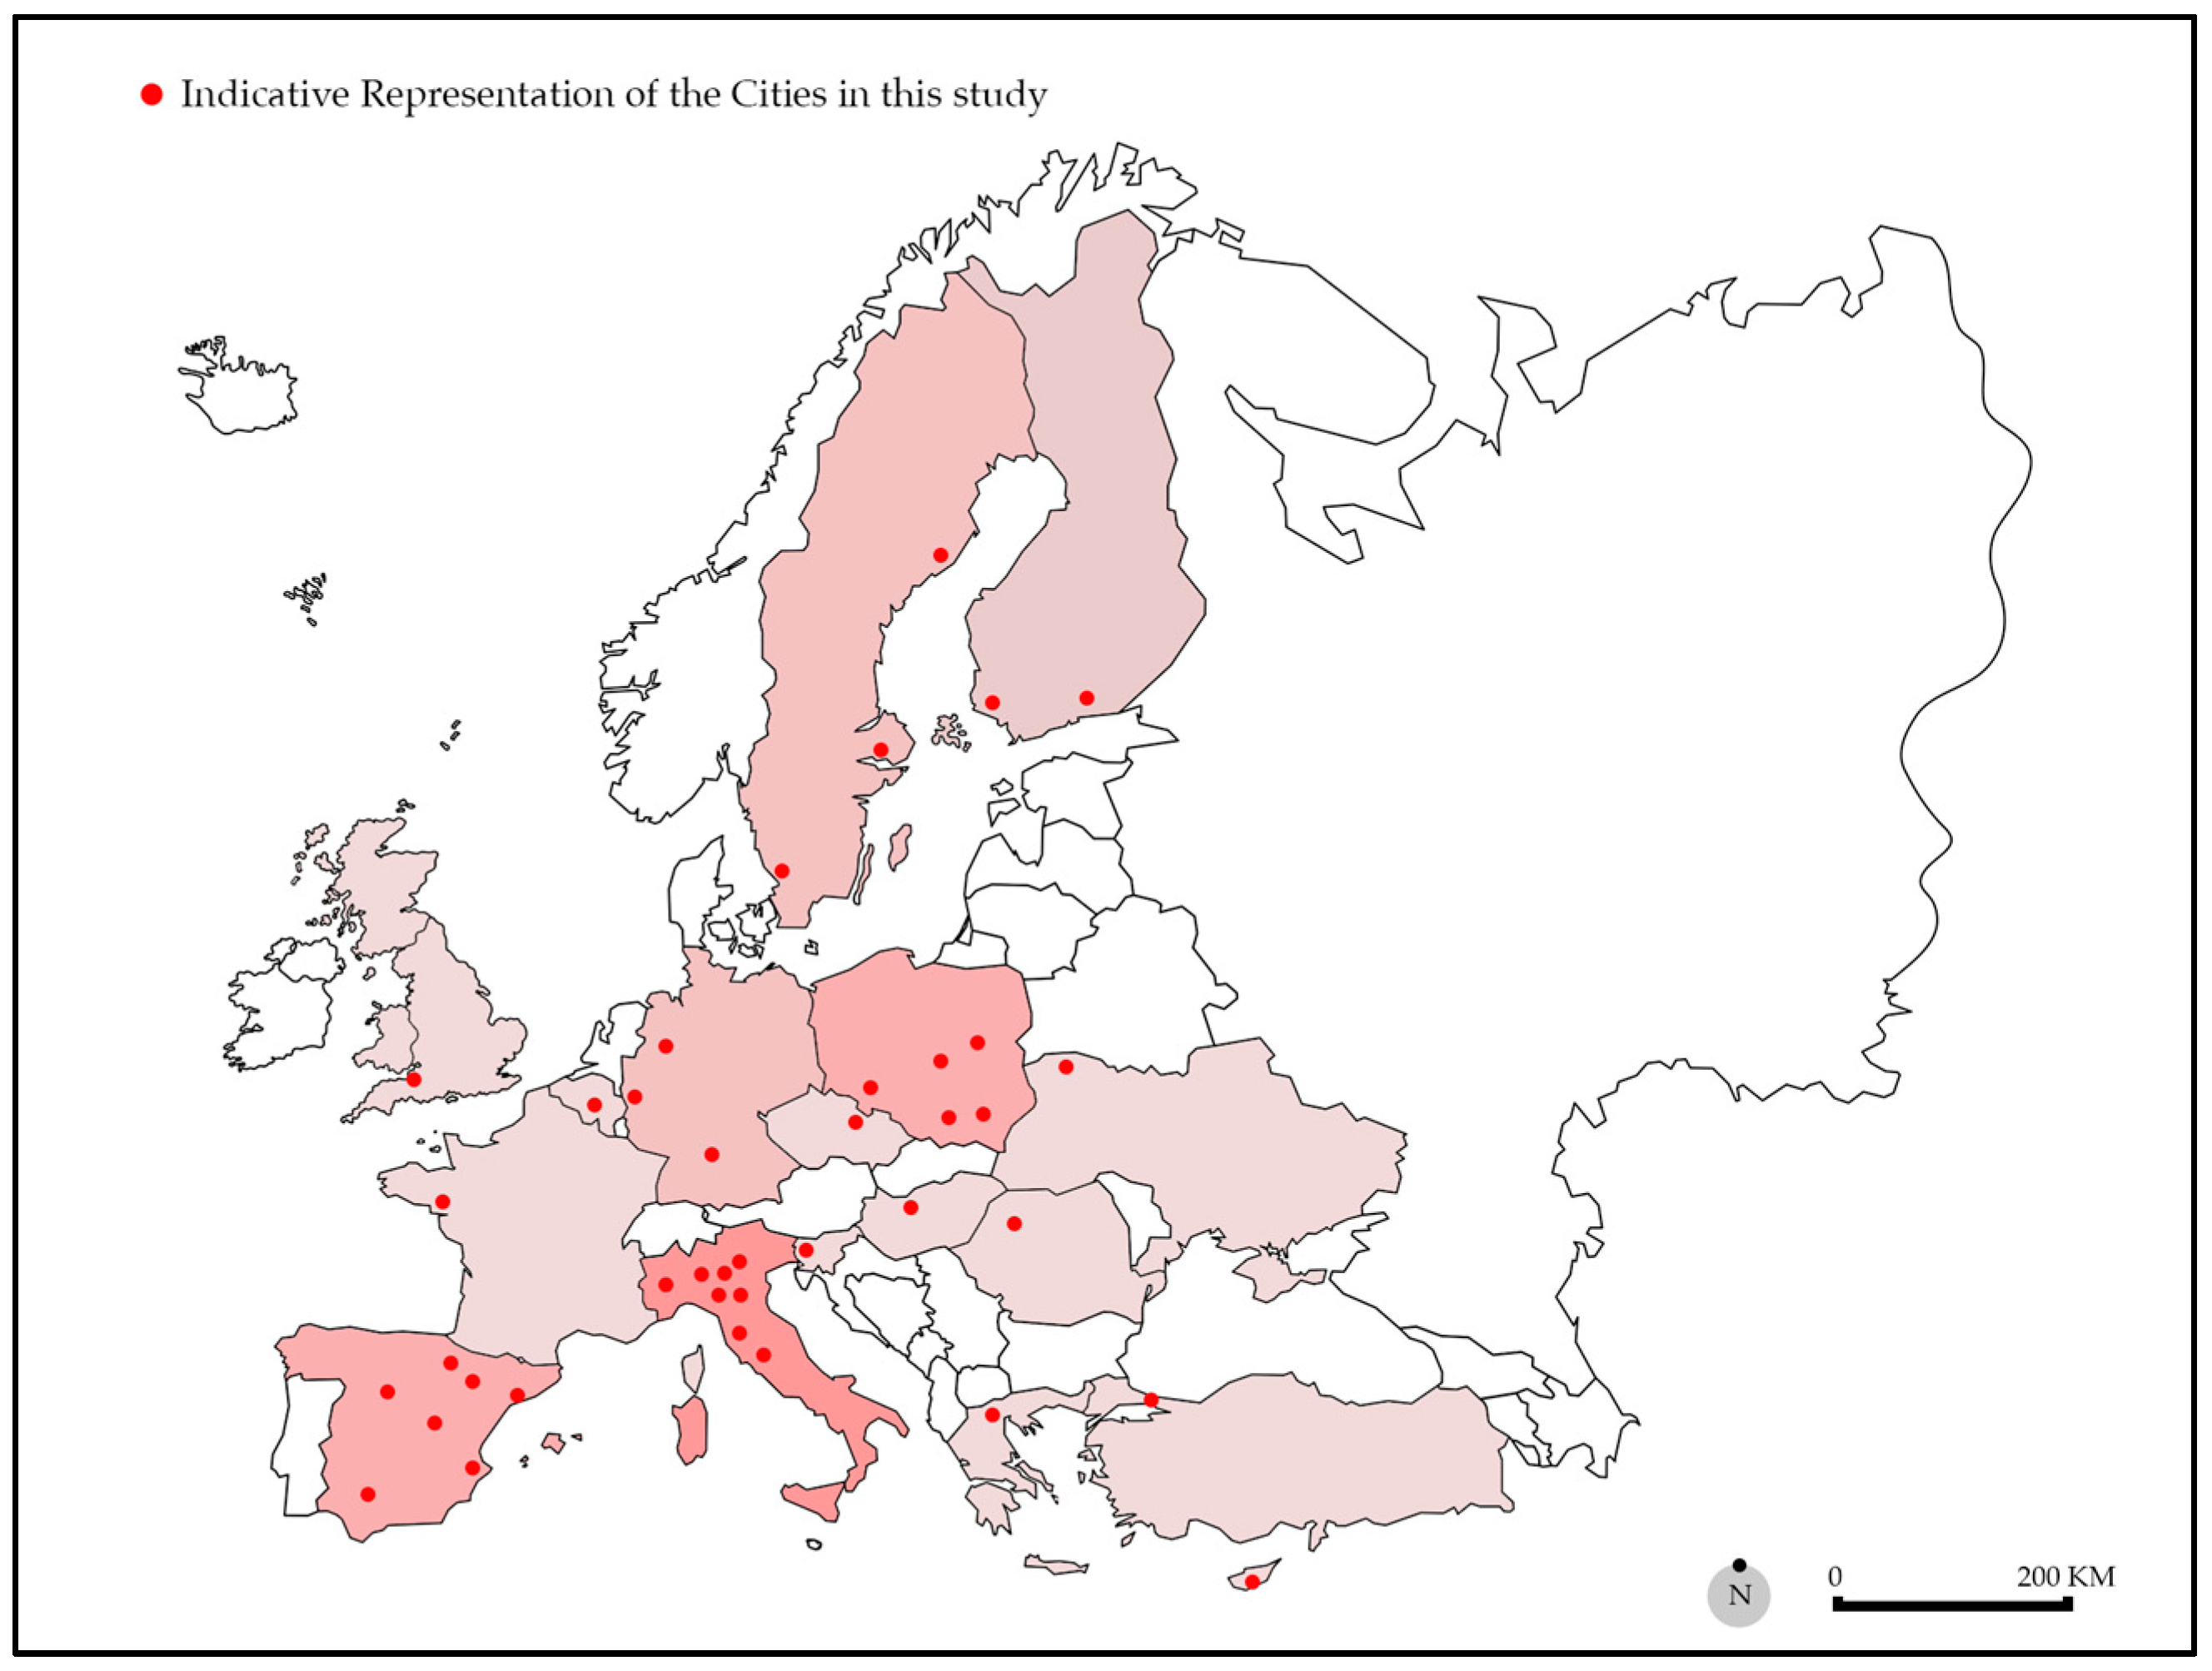
What Cities Want to Measure: Bottom-Up Selection of Indicators for Systemic Change toward Climate Neutrality Aligned with Sustainable Development Goals (SDGs) in 40 European Cities


Abstract
1. Introduction
2. Empirical Information Sources and Methods
2.1. Empirical Information Sources
2.2. Methods
2.2.1. Compilation of Indicators
2.2.2. Classification with SDGs
3. Results
3.1. Standardised Indicators and SDG Occurrence Frequency Rankings
3.2. Customised Indicators and SDG Occurrence Frequency Rankings
4. Discussion
5. Conclusions
Author Contributions
Funding
Data Availability Statement
Acknowledgments
Conflicts of Interest
Appendix A

| Emission/Impact Domain | Subdomain | Indicator | Suggested Unit of Measurement | Frequency of Occurrence * | |
|---|---|---|---|---|---|
| 1 | Greenhouse gas (GHG) emissions | Total GHG emissions | Total greenhouse gas emissions per year | t CO2 equivalents/year | 20 |
| 2 | Greenhouse gas (GHG) emissions | Stationary energy | GHG emissions per year from stationary energy per year | t CO2 equivalents/year | 4 |
| 3 | Greenhouse gas (GHG) emissions | Transport | GHG emissions from transport per year | t CO2 equivalents/year | 8 |
| 4 | Greenhouse gas (GHG) emissions | Waste | GHG emissions from waste per year | t CO2 equivalents/year | 7 |
| 5 | Greenhouse gas (GHG) emissions | Industrial processes and product use | GHG emissions from industrial processes and product use per year | t CO2 equivalents/year | 1 |
| 6 | Greenhouse gas (GHG) emissions | Agriculture, forestry, and land use (AFOLU) | GHG emissions from agriculture, forestry, and land use per year | t CO2 equivalents/year | 2 |
| 7 | Greenhouse gas (GHG) emissions | Grid-supplied energy | GHG emissions from grid-supplied energy per year | t CO2 equivalents/year | 3 |
| 8 | Greenhouse gas (GHG) emissions | Energy consumption | Change in the total energy consumption per year | kWh/year | 20 |
| 9 | Greenhouse gas (GHG) emissions | Energy efficiency | Change in energy efficiency over the lifetime of the project | % | 8 |
| 10 | Greenhouse gas (GHG) emissions | Share of renewable energies | Change in the energy mix over the lifetime of the project | % | 6 |
| 11 | Greenhouse gas (GHG) emissions | Carbon capture and residual emissions | Amount of permanent sequestration of GHG within city boundary | t CO2 equivalents/year | 2 |
| 12 | Greenhouse gas (GHG) emissions | GHG emissions | Change in the greenhouse gas emissions per sector during the lifetime of the project | t CO2 equivalents/year | 5 |
| 13 | Public health and environment | Air quality | Improved air quality | Highest annual mean of PM2.5 concentration recorded [µg PM2.5/m3] | 4 |
| 14 | Public health and environment | Noise | Reduction in noise pollution | % of population exposed to avg. LDEN > 55 dB (annual average) | 1 |
| 15 | Public health and environment | Health | Improved physical and mental well-being | Likert scale: 5 scales to be determined in local survey | 2 |
| 16 | Public health and environment | Quality of life | Perceived change in the quality of life | Likert scale: 5 scales to be determined in local survey | 6 |
| 17 | Social inclusion, innovation, democracy, and cultural impact | Citizen and community participation | Improved citizen participation | # of citizens engaged through the Pilot activities | 19 |
| 18 | Social Inclusion, Innovation, Democracy and Cultural Impact | Capacity of the public administration | Improvement in skills and awareness | # of public officers trained through the Pilot activities | 18 |
| 19 | Social Inclusion, Innovation, Democracy and Cultural Impact | Social cohesion | Affordability of housing and energy | % of disposable household income spent on housing and energy | 1 |
| 20 | Social Inclusion, Innovation, Democracy and Cultural Impact | Digitalisation | Improved acceptance of digital solutions | total # of users per digital solution | 10 |
| 21 | Social Inclusion, Innovation, Democracy and Cultural Impact | Social innovation | Number of participative activities implemented per stakeholder group | total # of counselled activities | 9 |
| 22 | Social Inclusion, Innovation, Democracy and Cultural Impact | Scientific or communication outreach of the project | Scientific publications, social campaigns, etc. | total # of scientific publications | 6 |
| 23 | Social Inclusion, Innovation, Democracy and Cultural Impact | Upscaling and replication | Number of follow-up projects or districts | total # of follow-up projects | 8 |
| 24 | Economy | Investment in R&I | Improved investments in climate change action | EUR invested over the lifetime of the pilot project | 8 |
| 25 | Economy | Skilled jobs and employment | Newly created sustainable jobs | total # of newly created jobs | 4 |
| 26 | Economy | Technological readiness | Number of solutions suggested for implementation in local strategies | total # of implemented solutions over the lifetime of the project | 6 |
| 27 | Economy | Local entrepreneurship and local businesses | Creation of start-ups, accelerators, or tech innovation | total # of start-ups created during the lifetime of the project | 1 |
| 28 | Economy | Increase in efficiency | Savings in working time achieved | Working hours/per year saved | 1 |
| 29 | Economy | Revenues generated | Revenues generated by the project | total EUR during the lifetime of the project excluding funding | 1 |
| 30 | Resource efficiency | Waste management and efficiency | Urban waste reduction; biowaste recovery | % of recycled domestic waste of the total domestic waste generation | 5 |
| 31 | Resource efficiency | Circular economy | Re-use of material during construction or renovation | % of recycled construction material of the total construction material used in the process | 3 |
| 32 | Resource efficiency | Water management | Improved water management | Household water consumption [l/capita/day] | 2 |
| 33 | Resource efficiency | Land use management | Improved land use management practices (e.g., urban greening) | m2 of public green space/inhabitant | 3 |
| 34 | Biodiversity | Urban forestry plantation and improved plant health | Percentage of tree canopy within the city | % of the municipal area | 1 |
| 35 | Biodiversity | Non-invasive species and pollinators | Change in the number of species of birds in built-up areas | % of change in species | 1 |
| 36 | Biodiversity | Ecological habitat connection | Structural connectivity of green spaces | Degree of physical (“structural”) connectivity between natural environments within a defined urban area. | 0 |
| Selection Criteria | Inclusion Criteria |
|---|---|
| Primary Criterion: General description of the SDG and keywords | The NZC indicator description contains similar thematic areas or impact domains, impact sub-domains, keywords, and/or levers of change. |
| Optional Criterion: SDG targets and indicators 1 | The NZC indicator description matches or is similar to one or more targets and indicators of the SDG in consideration. For example, SDG 13 contains target 13.2 (Integrate climate change measures into national policies, strategies, and planning) and a corresponding indicator 13.2.2 (Total greenhouse gas emissions per year). |
| # | NZC Indicator | Frequency of Occurrence | SDGs Coding | SDG Targets * | SDG Frequency of Occurrence | |||||||||||||||||||
|---|---|---|---|---|---|---|---|---|---|---|---|---|---|---|---|---|---|---|---|---|---|---|---|---|
 |  |  |  |  |  |  |  |  |  |  |  |  |  |  |  |  | ||||||||
| 1 | Total greenhouse gas emissions per year | 18 | | 13.2 | 0.098 | |||||||||||||||||||
| 2 | GHG emissions per year from stationary energy per year | 4 | | | 12.c, 13.2 | 0.01 | 0.01 | |||||||||||||||||
| 3 | GHG emissions from transport per year | 8 | | 13.2 | 0.039 | |||||||||||||||||||
| 4 | GHG emissions from waste per year | 7 | | | | 11.6, 12.4, 12.5, 13.2 | 0.012 | 0.012 | 0.012 | |||||||||||||||
| 5 | GHG emissions from industrial processes and product use per year | 1 | | | 9.4, 13.2 | 0.003 | 0.003 | |||||||||||||||||
| 6 | GHG emissions from agriculture, forestry, and land use per year | 2 | | | 13.2, 15.1 | 0.005 | 0.005 | |||||||||||||||||
| 7 | GHG emissions from grid-supplied energy per year | 3 | | 13.2 | 0.015 | |||||||||||||||||||
| 8 | Change in the total energy consumption per year | 20 | | | | | 7.3, 7.a, 9.4, 12.7, 12.c | 0.025 | 0.025 | 0.025 | 0.025 | |||||||||||||
| 9 | Change in energy efficiency over the lifetime of the project | 8 | | | | | 7.3, 7.a, 9.4, 12.7, 12.c | 0.01 | 0.01 | 0.01 | 0.01 | |||||||||||||
| 10 | Change in the energy mix over the lifetime of the project | 6 | | | | 7.1, 7.2, 7.3, 7.a, 7.b, 12.a, 13.2 | 0.01 | 0.01 | 0.01 | |||||||||||||||
| 11 | Amount of permanent sequestration of GHG within city boundary | 2 | | 13.2 | 0.01 | |||||||||||||||||||
| 12 | Change in the greenhouse gas emissions per sector during the lifetime of the project | 5 | | 13.2 | 0.025 | |||||||||||||||||||
| 13 | Improved air quality | 4 | | | 3.9, 11.6 | 0.01 | 0.01 | |||||||||||||||||
| 14 | Reduction in noise pollution | 1 | | - | 0.005 | |||||||||||||||||||
| 15 | Improved physical and mental well-being | 2 | | 9.1 | 0.01 | |||||||||||||||||||
| 16 | Perceived change in the quality of life | 5 | | | 3.8, 9.1, 16.6 | 0.015 | 0.015 | |||||||||||||||||
| 17 | Improved citizen participation | 18 | | | | 6.b, 11.3, 16.6, 16.7 | 0.031 | 0.031 | 0.031 | |||||||||||||||
| 18 | Improvement in skills and awareness | 17 | | | 12.8, 13.3 | 0.044 | 0.044 | |||||||||||||||||
| 19 | Affordability of housing and energy | 1 | | | 3.8, 7.1, 11.1 | 0.003 | 0.003 | |||||||||||||||||
| 20 | Improved acceptance of digital solutions | 7 | | 9.c, 17.8 | 0.049 | |||||||||||||||||||
| 21 | Number of participative activities implemented per stakeholder group | 7 | | | | 6.b, 11.3, 16.6, 16.7 | 0.015 | 0.015 | 0.015 | |||||||||||||||
| 22 | Scientific publications, social campaigns, etc. | 6 | | | 9.5, 14.a | 0.016 | 0.015 | |||||||||||||||||
| 23 | Number of follow-up projects or districts | 8 | | - | 0.039 | |||||||||||||||||||
| 24 | Improved investments in climate change action | 7 | | | | 7.a, 9.5, 9.b, 14.a | 0.013 | 0.013 | 0.013 | |||||||||||||||
| 25 | Newly created sustainable jobs | 3 | | | 8.2, 8.5, 8.6, 8.b, 9.2 | 0.01 | 0.01 | |||||||||||||||||
| 26 | Number of solutions suggested for implementation in local strategies | 5 | | 9.b | 0.03 | |||||||||||||||||||
| 27 | Creation of start-ups, accelerators, or tech innovation | 1 | | | 8.3, 9.3 | 0.003 | 0.003 | |||||||||||||||||
| 28 | Savings in working time achieved | 1 | | 8.2 | 0.005 | |||||||||||||||||||
| 29 | Revenues generated by the project | 1 | | 8.2 | 0.005 | |||||||||||||||||||
| 30 | Urban waste reduction; biowaste recovery | 4 | | | | 6.a, 6.3, 11.6, 12.3, 12.4, 12.5, 12.c | 0.009 | 0.009 | 0.009 | |||||||||||||||
| 31 | Re-use of material during construction or renovation | 2 | | | 11.c, 12.5 | 0.008 | 0.008 | |||||||||||||||||
| 32 | Improved water management | 1 | | 6.1, 6.4, 6.5, 6.a, 6.b | 0.01 | |||||||||||||||||||
| 33 | Improved land use management practices (e.g., urban greening) | 2 | | | 11.3,15.1, 15.3 | 0.008 | 0.008 | |||||||||||||||||
| 34 | Percentage of tree canopy within the city | 1 | | 15.1, 15.2, 15.3,15.4 | 0.005 | |||||||||||||||||||
| 35 | Change in the number of species of birds in built-up areas | 1 | | 15.5, 15.9, 15.a | 0.005 | |||||||||||||||||||
| 36 | Structural connectivity of green spaces | 0 | | 15.1, 15.2, 15.3, 15.4, 15.5 | 0 | |||||||||||||||||||
| Total | 0 | 0 | 0.04 | 0 | 0 | 0.01 | 0.061 | 0.023 | 0.159 | 0 | 0.096 | 0.128 | 0.428 | 0 | 0.023 | 0.061 | 0 | |||||||
| Rank | - | - | 7 | - | - | 10 | 5 | 9 | 2 | - | 4 | 3 | 1 | - | 8 | 6 | 9 | |||||||
Appendix B
| # | Themes | Customised Indicators | Thematic Frequencies | SDG Attribution | ||
|---|---|---|---|---|---|---|
| Primary | Secondary | Tertiary | ||||
| 1 | New ventures and Businesses | No. of projects. | 6 | SDG 9: Industry, Innovation, and Infrastructure | SDG 13: Climate Action | NA |
| 2 | Number of new business models, including tailored incentive mechanisms. | SDG 9: Industry, Innovation, and Infrastructure | SDG 13: Climate Action | NA | ||
| 3 | Number of exploitable results. | SDG 9: Industry, Innovation, and Infrastructure | SDG 13: Climate Action | NA | ||
| 4 | New businesses supported. | SDG 8: Decent Work and Economic Growth | SDG 13: Climate Action | NA | ||
| 5 | Development of production of locally grown food. | SDG 9: Industry, Innovation, and Infrastructure | SDG 13: Climate Action | NA | ||
| 6 | Products and services offered to facilitate and mainstream the adoption of a climate-friendly lifestyle. | SDG 9: Industry, Innovation, and Infrastructure | SDG 13: Climate Action | NA | ||
| 7 | Policy and Regulatory | Political agreement on a climate budget and climate investment plan. | 11 | SDG 13: Climate Action | SDG 17: Partnerships For the Goals | SDG 16: Peace, Justice, and Strong Institutions |
| 8 | Integration of the climate budget in the municipal system of governance. | SDG 13: Climate Action | SDG 16: Peace, Justice, and Strong Institutions | NA | ||
| 9 | Development of a reuse plan for construction materials. | SDG 12: Responsible Consumption and Production | SDG 13: Climate Action | SDG 11: Sustainable Cities and Communities | ||
| 10 | District- and city-level policies making use of survey results. | SDG 16: Peace, Justice, and Strong Institutions | SDG 13: Climate Action | SDG 16: Peace, Justice, and Strong Institutions | ||
| 11 | Number of climate contracts in each category. | SDG 13: Climate Action | SDG 16: Peace, Justice, and Strong Institutions | NA | ||
| 12 | New structure, detailed description, adoption, and realisation. | NA | SDG 13: Climate Action | NA | ||
| 13 | Concrete proposals for municipal regulatory reformation. | SDG 16: Peace, Justice, and Strong Institutions | SDG 13: Climate Action | NA | ||
| 14 | Concrete proposals for climate-resilient building codes. | SDG 13: Climate Action | SDG 11: Sustainable Cities and Communities | SDG 16: Peace, Justice, and Strong Institutions | ||
| 15 | Legal changes for municipal regulatory reformation. | SDG 16: Peace, Justice, and Strong Institutions | SDG 13: Climate Action | NA | ||
| 16 | Legal changes for climate-resilient building codes, new policies, innovative pilot projects containing innovation in emission domains of climate adaptation strategies. | SDG 16: Peace, Justice, and Strong Institutions | SDG 13: Climate Action | SDG 11: Sustainable Cities and Communities | ||
| 17 | Establishing CCC as an ongoing process. | SDG 17: Partnerships For the Goals | SDG 13: Climate Action | NA | ||
| 18 | Unique/City-Specific | Number of rehabilitations fostered by the project. | 18 | SDG 11: Sustainable Cities and Communities | SDG 16: Peace, Justice, and Strong Institutions | NA |
| 19 | Online platform visitors. | NA | NA | NA | ||
| 20 | Social spectrograph. | SDG 17: Partnerships For the Goals | NA | NA | ||
| 21 | Number of distinct solutions. | NA | NA | NA | ||
| 22 | Number of imitations. | NA | NA | NA | ||
| 23 | Accelerated change towards NZC. | SDG 13: Climate Action | NA | NA | ||
| 24 | Levelized cost of heat (LCOH) from full-scale GHM. | SDG 7: Affordable and Clean Energy | SDG 13: Climate Action | NA | ||
| 25 | Actual levelized cost of heat (LCOH) after implementation. | SDG 7: Affordable and Clean Energy | SDG 13: Climate Action | NA | ||
| 26 | Crime rate reduction. | SDG 16: Peace, Justice, and Strong Institutions | NA | NA | ||
| 27 | Finalised master plan. | NA | NA | NA | ||
| 28 | BASEMIS® evaluation in 2026 for air quality and studies on housing energy performance. | SDG 7: Affordable and Clean Energy | NA | NA | ||
| 29 | Vote on a metropolitan climate change adaptation plan and its implementation through sectoral actions (drought, heat, etc.). | NA | NA | NA | ||
| 30 | Risks and opportunities identified. | NA | NA | NA | ||
| 31 | TomTom Index. | SDG 13: Climate Action | SDG 11: Sustainable Cities and Communities | NA | ||
| 32 | Number of distinct solutions. | NA | NA | NA | ||
| 33 | Number of imitations. | NA | NA | NA | ||
| 34 | Number of interventions in case organisation during the project. | SDG 13: Climate Action | NA | NA | ||
| 35 | Increased visibility of local action; visibility of actions. | NA | NA | NA | ||
| 36 | Bottom-up Approaches, Participation, and Involvement (People, neighbourhoods, companies, and govt. channels) | Number of RECs (Renewable Energy Communities) triggered by the project. | 22 | NA | NA | NA |
| 37 | Number of community engagement activities. | SDG 16: Peace, Justice, and Strong Institutions | SDG 13: Climate Action | NA | ||
| 38 | Number of citizens participating in programme activities. | SDG 16: Peace, Justice, and Strong Institutions | SDG 13: Climate Action | NA | ||
| 39 | No. of participants. | SDG 16: Peace, Justice, and Strong Institutions | SDG 13: Climate Action | NA | ||
| 40 | % of all employees in each city administration partaking in educational events. | SDG 16: Peace, Justice, and Strong Institutions | SDG 13: Climate Action | NA | ||
| 41 | Participants in project activities. | SDG 16: Peace, Justice, and Strong Institutions | SDG 13: Climate Action | NA | ||
| 42 | Number of people reached by the project through communication actions. | SDG 16: Peace, Justice, and Strong Institutions | SDG 13: Climate Action | NA | ||
| 43 | Improved citizen participation per city/district (estimations). | SDG 16: Peace, Justice, and Strong Institutions | SDG 13: Climate Action | SDG 12: Responsible Consumption and Production | ||
| 44 | Number of neighbourhoods with partnerships. | SDG 16: Peace, Justice, and Strong Institutions | SDG 13: Climate Action | NA | ||
| 45 | Social spectrograph. | SDG 16: Peace, Justice, and Strong Institutions | SDG 13: Climate Action | NA | ||
| 46 | Increase in grassroots initiatives. | SDG 16: Peace, Justice, and Strong Institutions | SDG 13: Climate Action | SDG 16: Peace, Justice, and Strong Institutions | ||
| 47 | Share of employees in participating in interventions. | SDG 16: Peace, Justice, and Strong Institutions | SDG 13: Climate Action | NA | ||
| 48 | Participation percentage—No. of stakeholders. | SDG 16: Peace, Justice, and Strong Institutions | SDG 13: Climate Action | NA | ||
| 49 | Resident engagement in energy- and climate-conscious actions. | SDG 12: Responsible Consumption and Production | SDG 13: Climate Action | SDG 16: Peace, Justice, and Strong Institutions | ||
| 50 | Co-design events. | SDG 16: Peace, Justice, and Strong Institutions | SDG 13: Climate Action | NA | ||
| 51 | Radical collaboration. | SDG 16: Peace, Justice, and Strong Institutions | SDG 13: Climate Action | NA | ||
| 52 | Local Green Deals. | SDG 17: Partnerships For the Goals | SDG 13: Climate Action | NA | ||
| 53 | Citizens in campaigns. | SDG 16: Peace, Justice, and Strong Institutions | SDG 11: Sustainable Cities and Communities | SDG 13: Climate Action | ||
| 54 | New formats of collaboration and capacity building for action. | SDG 16: Peace, Justice, and Strong Institutions | SDG 13: Climate Action | NA | ||
| 55 | New forms of climate activities. | SDG 16: Peace, Justice, and Strong Institutions | SDG 13: Climate Action | NA | ||
| 56 | Amount of citizens getting interested and engaged in climate-friendly behaviour. | SDG 16: Peace, Justice, and Strong Institutions | SDG 11: Sustainable Cities and Communities | SDG 13: Climate Action | ||
| 57 | Citizen engagement in co-creation spaces. | SDG 16: Peace, Justice, and Strong Institutions | SDG 11: Sustainable Cities and Communities | SDG 13: Climate Action | ||
| 58 | Behavioural Indicators | Observable changes in the behaviour of citizens towards climate neutrality. | 11 | SDG 12: Responsible Consumption and Production | SDG 13: Climate Action | NA |
| 59 | Climate impact per capita of consumption. | SDG 12: Responsible Consumption and Production | SDG 13: Climate Action | NA | ||
| 60 | Accelerated, socially peaceful change towards NZC. | SDG 16: Peace, Justice, and Strong Institutions | SDG 12: Responsible Consumption and Production | SDG 13: Climate Action | ||
| 61 | Broader acceptance of solutions. | SDG 16: Peace, Justice, and Strong Institutions | NA | NA | ||
| 62 | Share of citizens with eco-friendly behaviours. | SDG 12: Responsible Consumption and Production | SDG 17: Partnerships For the Goals | SDG 13: Climate Action | ||
| 63 | Number of users of public transport system. | SDG 12: Responsible Consumption and Production | SDG 11: Sustainable Cities and Communities | SDG 13: Climate Action | ||
| 64 | Research team will collect data regarding behaviour change using both objective (e.g., electronic traffic counting) and subjective (e.g., survey questionnaires and interviews) measures. | SDG 16: Peace, Justice, and Strong Institutions | NA | NA | ||
| 65 | Reduced barriers for climate-friendly citizen actions. | SDG 16: Peace, Justice, and Strong Institutions | SDG 13: Climate Action | NA | ||
| 66 | Increased number of climate-friendly actions by citizens. | SDG 16: Peace, Justice, and Strong Institutions | SDG 13: Climate Action | NA | ||
| 67 | Improved monitoring of CO2 emissions of private consumption/individual behaviour. | SDG 12: Responsible Consumption and Production | SDG 13: Climate Action | NA | ||
| 68 | New behavioural standards. | SDG 12: Responsible Consumption and Production | SDG 13: Climate Action | NA | ||
| 69 | Satisfaction and Self-Efficacy | Level of confidence in initiating and leading climate action. | 7 | SDG 13: Climate Action | SDG 16: Peace, Justice, and Strong Institutions | NA |
| 70 | Citizen satisfaction. | SDG 16: Peace, Justice, and Strong Institutions | SDG 3: Good Health and Well-being | NA | ||
| 71 | Employee satisfaction. | SDG 16: Peace, Justice, and Strong Institutions | SDG 3: Good Health and Well-being | NA | ||
| 72 | Degree of satisfaction and acceptance of stakeholders and decision makers on the designed guidelines. | SDG 16: Peace, Justice, and Strong Institutions | SDG 3: Good Health and Well-being | SDG 13: Climate Action | ||
| 73 | Level of sense of agency among stakeholders and residents. | SDG 16: Peace, Justice, and Strong Institutions | SDG 13: Climate Action | SDG 16: Peace, Justice, and Strong Institutions | ||
| 74 | Level of mutual appreciation. | SDG 3: Good Health and Well-being | SDG 16: Peace, Justice, and Strong Institutions | SDG 12: Responsible Consumption and Production | ||
| 75 | Degree of satisfaction and acceptance of residents affected by the actions in the project. | SDG 3: Good Health and Well-being | SDG 16: Peace, Justice, and Strong Institutions | SDG 17: Partnerships For the Goals | ||
| 76 | Air Quality and CO2e reduction | Improved air quality/per city/district (estimations). | 2 | SDG 3: Good Health and Well-being | SDG 13: Climate Action | NA |
| 77 | Avoided/reduced tonnes of carbon dioxide equivalents (CO2e) per million (SEK) investments. | SDG 13: Climate Action | NA | NA | ||
| 78 | Economic, Financial Indicators | Volume of investments in low-carbon development. Number of projects associated with low-carbon development. | 7 | SDG 13: Climate Action | SDG 9: Industry, Innovation, and Infrastructure | NA |
| 79 | Estimations in applications for funding and investments. | NA | NA | NA | ||
| 80 | Types and amounts of new smart green financial instruments. | SDG 13: Climate Action | SDG 9: Industry, Innovation, and Infrastructure | NA | ||
| 81 | socio-economic and economic development co-benefits. | SDG 8: Decent Work and Economic Growth | SDG 16: Peace, Justice, and Strong Institutions | SDG 13: Climate Action | ||
| 82 | Types and amounts of new smart green financial instruments. | SDG 13: Climate Action | SDG 9: Industry, Innovation, and Infrastructure | NA | ||
| 83 | Incentives/work benefits offered by the employers (value/employee). | SDG 8: Decent Work and Economic Growth | SDG 16: Peace, Justice, and Strong Institutions | SDG 13: Climate Action | ||
| 84 | Additional income. | SDG 8: Decent Work and Economic Growth | SDG 13: Climate Action | NA | ||
| 85 | Publication | Number of articles and other publications produced thanks to the availability of the laboratory. | 3 | NA | SDG 13: Climate Action | NA |
| 86 | Publications about the building types. | SDG 11: Sustainable Cities and Communities | SDG 9: Industry, Innovation, and Infrastructure | SDG 13: Climate Action | ||
| 87 | Publications/articles about the survey results. | SDG 17: Partnerships For the Goals | SDG 13: Climate Action | NA | ||
| 88 | Technology-Based Solutions | New digital tools (e.g., apps) due to data openness and availability—spread to other cities. | 4 | SDG 9: Industry, Innovation, and Infrastructure | NA | NA |
| 89 | Number of digital tools for low-emission district design and applications. | SDG 9: Industry, Innovation, and Infrastructure | SDG 13: Climate Action | NA | ||
| 90 | List of technology packages/set of different solutions with financing options provided to the decision-maker. | SDG 9: Industry, Innovation, and Infrastructure | NA | NA | ||
| 91 | Set of prioritised solutions/most suitably integrated active and passive solutions with financing options. | SDG 9: Industry, Innovation, and Infrastructure | NA | NA | ||
| 92 | Operations, Decision Making, and Reporting Indicators | Awareness and ability to work across silos, formalised changes in policy, governance, organisational structure, budgets, etc. | 16 | SDG 17: Partnerships For the Goals | NA | NA |
| 93 | Number of updated data entries. The fact of the update. | SDG 13: Climate Action | NA | NA | ||
| 94 | Number of climate-related objectives in all city strategies. | SDG 13: Climate Action | NA | NA | ||
| 95 | Successful operational changes made. | NA | NA | NA | ||
| 96 | Number of public authorities using the platform at the national scale. | NA | NA | NA | ||
| 97 | Quality and frequency of interactions between departments. | SDG 17: Partnerships For the Goals | SDG 13: Climate Action | NA | ||
| 98 | A mechanism for adding new datasets in a general and efficient way. Data availability generates research and business outcomes and new ideas. | NA | NA | NA | ||
| 99 | Number of used innovations in the work of the city administration. | SDG 9: Industry, Innovation, and Infrastructure | SDG 13: Climate Action | NA | ||
| 100 | Establishment of a tool for the monitoring and reporting of GHG emissions. | SDG 13: Climate Action | NA | NA | ||
| 101 | Number of solutions suggested for implementation in local strategies. | SDG 13: Climate Action | NA | NA | ||
| 102 | No. of energy-poor households contacted by social workers through the agency. | SDG 10: Reduce Inequalities | SDG 7: Affordable and Clean Energy | NA | ||
| 103 | Operational associative structures. | NA | NA | NA | ||
| 104 | Tracking of contracts. | NA | NA | NA | ||
| 105 | Monitoring of operations. | NA | NA | NA | ||
| 106 | Sharing best practices about the platform with city networks nationally and internationally. | SDG 13: Climate Action | SDG 17: Partnerships For the Goals | NA | ||
| 107 | Formats of cross-departmental collaboration. | SDG 17: Partnerships For the Goals | SDG 13: Climate Action | NA | ||
| 108 | Awareness Building, Training, Knowledge Sharing, and Capacity Building | Feedback of the organized events, trainings, and webinars for the climate team. | 17 | SDG 13: Climate Action | SDG 16: Peace, Justice, and Strong Institutions | NA |
| 109 | Number of trained individuals beyond the pilot activity duration. | SDG 13: Climate Action | NA | NA | ||
| 110 | Number of the projects in buildings which energy managers were trained in. | SDG 13: Climate Action | NA | NA | ||
| 111 | Reduced energy consumption. | SDG 11: Sustainable Cities and Communities | NA | NA | ||
| 112 | Improvement in skills and awareness. | SDG 13: Climate Action | NA | NA | ||
| 113 | Change ambassadors. | SDG 13: Climate Action | NA | NA | ||
| 114 | Transfer events. | SDG 17: Partnerships For the Goals | SDG 13: Climate Action | NA | ||
| 115 | Improvement in skills and awareness per city. | SDG 13: Climate Action | NA | NA | ||
| 116 | Cities learning about deep renovation, energy retrofitting approaches, and the methodology used in the project. | SDG 13: Climate Action | NA | NA | ||
| 117 | Number of professionals trained. | SDG 13: Climate Action | NA | NA | ||
| 118 | Number of training hours. | SDG 13: Climate Action | NA | NA | ||
| 119 | Knowledge transfer activities. | SDG 17: Partnerships For the Goals | SDG 13: Climate Action | NA | ||
| 120 | Implementation reports. | SDG 13: Climate Action | NA | NA | ||
| 121 | Model transferability to other cities. | SDG 13: Climate Action | NA | NA | ||
| 122 | Learning materials. | SDG 13: Climate Action | SDG 4: Quality Education | NA | ||
| 123 | Number of experts participating in the discussions/assessment meetings/panels. | SDG 16: Peace, Justice, and Strong Institutions | NA | NA | ||
| 124 | Engagement of stakeholders and decision makers in guideline design processes. | SDG 16: Peace, Justice, and Strong Institutions | SDG 10: Reduce Inequalities | NA | ||
| 125 | Exchange between municipalities at regional and national level. | SDG 17: Partnerships For the Goals | NA | NA | ||
| 126 | Collective actions awareness events. | SDG 16: Peace, Justice, and Strong Institutions | NA | NA | ||
| 127 | Integration of learning methods in the format of meetings and exchanges. | SDG 4: Quality Education | SDG 17: Partnerships For the Goals | NA | ||
References
- Hulme, M. Abrupt climate change: Can society cope? Philos. Trans. R. Soc. London. Ser. A Math. Phys. Eng. Sci. 2003, 361, 2001–2021. [Google Scholar] [CrossRef]
- European Commission. European Missions—100 Climate-Neutral and Smart Cities by 2030. 2021. Available online: https://netzerocities.eu/ (accessed on 6 January 2024).
- Colona, F. Climate governance by numerical data: The kaleidoscopic political space of a decarbonization dashboard. Geoforum 2023, 144, 103801. [Google Scholar] [CrossRef]
- Mayer, A.L. Strengths and weaknesses of common sustainability indices for multidimensional systems. Environ. Int. 2008, 34, 277–291. [Google Scholar] [CrossRef] [PubMed]
- Diepenmaat, H.; Kemp, R.; Velter, M. Why Sustainable Development Requires Societal Innovation and Cannot Be Achieved without This. Sustainability 2020, 12, 1270. [Google Scholar] [CrossRef]
- Della Valle, N.; Ulpiani, G.; Vetters, N. Assessing climate justice awareness among climate neutral-to-be cities. Humanit. Soc. Sci. Commun. 2023, 10, 440. [Google Scholar] [CrossRef]
- Mfitumukiza, D.; Mwesigwa, G.Y.; Kayendeke, E.J.; Muwanika, V.B. Local Context Capacity Building Needs for Climate Change Adaptation among Smallholder Farmers in Uganda: Policy and Practice Implications. Climate 2024, 12, 10. [Google Scholar] [CrossRef]
- Gilman, S.E.; Urban, M.C.; Tewksbury, J.; Gilchrist, G.W.; Holt, R.D. A framework for community interactions under climate change. Trends Ecol. Evol. 2010, 25, 325–331. [Google Scholar] [CrossRef] [PubMed]
- Underdal, A. Complexity and challenges of long-term environmental governance. Glob. Environ. Change 2010, 20, 386–393. [Google Scholar] [CrossRef]
- Repo, P.; Matschoss, K. Social Innovation for Sustainability Challenges. Sustainability 2019, 12, 319. [Google Scholar] [CrossRef]
- Bresciani, S.; Rizzo, F.; Deserti, A. Toward a Comprehensive Framework of Social Innovation for Climate Neutrality: A Systematic Literature Review from Business/Production, Public Policy, Environmental Sciences, Energy, Sustainability and Related Fields. Sustainability 2022, 14, 13793. [Google Scholar] [CrossRef]
- Geels, F.W.; Sovacool, B.K.; Schwanen, T.; Sorrell, S. Sociotechnical transitions for deep decarbonization. Science 2017, 357, 1242–1244. [Google Scholar] [CrossRef]
- Mulder, K.F. Innovation for sustainable development: From environmental design to transition management. Sustain. Sci. 2007, 2, 253–263. [Google Scholar] [CrossRef]
- Jans, L. Changing environmental behaviour from the bottom up: The formation of pro-environmental social identities. J. Environ. Psychol. 2021, 73, 101531. [Google Scholar] [CrossRef]
- Nolan, J.M.; Schultz, P.W.; Cialdini, R.B.; Goldstein, N.J.; Griskevicius, V. Normative Social Influence is Underdetected. Pers. Soc. Psychol. Bull. 2008, 34, 913–923. [Google Scholar] [CrossRef]
- Ulpiani, G.; Vetters, N. On the risks associated with transitioning to climate neutrality in Europe: A city perspective. Renew. Sustain. Energy Rev. 2023, 183, 113448. [Google Scholar] [CrossRef]
- Hristova, S.; Dragićević Šešić, M.; Duxbury, N. (Eds.) Culture and Sustainability in European Cities. Imagining Europolis; Routledge: Abingdon-on-Thames, UK, 2015. [Google Scholar] [CrossRef]
- Sabel, C.F.; Victor, D.G. Governing global problems under uncertainty: Making bottom-up climate policy work. Clim. Change 2017, 144, 15–27. [Google Scholar] [CrossRef]
- Bernauer, T. Climate Change Politics. Annu. Rev. Polit. Sci. 2013, 16, 421–448. [Google Scholar] [CrossRef]
- Frantzeskaki, N. Seven lessons for planning nature-based solutions in cities. Environ. Sci. Policy 2019, 93, 101–111. [Google Scholar] [CrossRef]
- Palliwoda, J.; Banzhaf, E.; Priess, J.A. How do the green components of urban green infrastructure influence the use of ecosystem services? Examples from Leipzig, Germany. Landsc. Ecol. 2020, 35, 1127–1142. [Google Scholar] [CrossRef]
- Bresciani, S.; Rizzo, F.; Mureddu, F. Assessment Framework for People-Centred Solutions to Carbon Neutrality. A Comprehensive List of Case Studies and Social Innovation Indicators at Urban Level; Springer: Cham, Switzerland, 2024. [Google Scholar]
- Huttunen, S.; Ojanen, M.; Ott, A.; Saarikoski, H. What about citizens? A literature review of citizen engagement in sustainability transitions research. Energy Res. Soc. Sci. 2022, 91, 102714. [Google Scholar] [CrossRef]
- Moreno-Serna, J.; Purcell, W.M.; Sánchez-Chaparro, T.; Soberón, M.; Lumbreras, J.; Mataix, C. Catalyzing Transformational Partnerships for the SDGs: Effectiveness and Impact of the Multi-Stakeholder Initiative El día después. Sustainability 2020, 12, 7189. [Google Scholar] [CrossRef]
- Haase, D.; Kabisch, S.; Haase, A.; Andersson, E.; Banzhaf, E.; Barό, F.; Brenck, M.; Fischer, L.K.; Frantzeskaki, N.; Kabisch, N.; et al. Greening cities—To be socially inclusive? About the alleged paradox of society and ecology in cities. Habitat. Int. 2017, 64, 41–48. [Google Scholar] [CrossRef]
- United Nations. The Paris Agreement, United Nations Climate Change; United Nations. 2023. Available online: https://unfccc.int/process-and-meetings/the-paris-agreement (accessed on 14 January 2024).
- Creutzig, F.; Niamir, L.; Bai, X.; Callaghan, M.; Cullen, J.; Díaz-José, J.; Figueroa, M.; Grubler, A.; Lamb, W.F.; Leip, A.; et al. Demand-side solutions to climate change mitigation consistent with high levels of well-being. Nat. Clim. Chang. 2022, 12, 36–46. [Google Scholar] [CrossRef]
- La Rosa, D.; Spyra, M.; Inostroza, L. Indicators of Cultural Ecosystem Services for urban planning: A review. Ecol. Indic. 2016, 61, 74–89. [Google Scholar] [CrossRef]
- Sprain, L. Paradoxes of Public Participation in Climate Change Governance. Good Soc. 2016, 25, 62–80. [Google Scholar] [CrossRef]
- Perlaviciute, G.; Squintani, L. Public Participation in Climate Policy Making: Toward Reconciling Public Preferences and Legal Frameworks. One Earth 2020, 2, 341–348. [Google Scholar] [CrossRef]
- Wojewnik-Filipkowska, A.; Węgrzyn, J. Understanding of Public–Private Partnership Stakeholders as a Condition of Sustainable Development. Sustainability 2019, 11, 1194. [Google Scholar] [CrossRef]
- Wang, N.; Ma, M. Public–private partnership as a tool for sustainable development—What literatures say? Sustain. Dev. 2021, 29, 243–258. [Google Scholar] [CrossRef]
- United Nations. The 17 Goals|Sustainable Development. The United Nations: Department of Economic and Social Affairs Sustainable Development. Available online: https://sdgs.un.org/goals (accessed on 14 January 2024).
- Nerini, F.F.; Sovacool, B.; Hughes, N.; Cozzi, L.; Cosgrave, E.; Howells, M.; Tavoni, M.; Tomei, J.; Zerriffi, H.; Milligan, B. Connecting climate action with other Sustainable Development Goals. Nat. Sustain. 2019, 2, 674–680. [Google Scholar] [CrossRef]
- Sompolska-Rzechuła, A.; Kurdyś-Kujawska, A. Towards Understanding Interactions between Sustainable Development Goals: The Role of Climate-Well-Being Linkages. Experiences of EU Countries. Energies 2021, 14, 2025. [Google Scholar] [CrossRef]
- Stern, M.J. Social Science Theory for Environmental Sustainability; Oxford University Press: Oxford, UK, 2018; Volume 1. [Google Scholar] [CrossRef]
- Sachs, J.D.; Schmidt-Traub, G.; Mazzucato, M.; Messner, D.; Nakicenovic, N.; Rockström, J. Six Transformations to achieve the Sustainable Development Goals. Nat. Sustain. 2019, 2, 805–814. [Google Scholar] [CrossRef]
- Wuebben, D.; Romero-Luis, J.; Gertrudix, M. Citizen Science and Citizen Energy Communities: A Systematic Review and Potential Alliances for SDGs. Sustainability 2020, 12, 10096. [Google Scholar] [CrossRef]
- Kuhn, T.S. The Structure of Scientific Revolutions, 3rd ed.; University of Chicago Press: Chicago, IL, USA, 1996. [Google Scholar]
- Wolf, S.; Teitge, J.; Mielke, J.; Schütze, F.; Jaeger, C. The European Green Deal—More Than Climate Neutrality. Intereconomics 2021, 56, 99–107. [Google Scholar] [CrossRef] [PubMed]
- Chaudhary, N.; Hawkins, P.; Palavicino, C.A. NetZeroCities Theory of Change; Deliverable 2.14. NetZeroCities EU H2020 Grant Agreement n°101036519; European Union: Brussels, Belgium, 2022. [Google Scholar]
- Joanna K, A.; Wade, W. Open Call Process Guidebook, CKIC, D 4.1. June 2022. Available online: https://netzerocities.app/PilotGuideBook#7.1 (accessed on 18 November 2023).
- Neumann, H.M.; Etminan, G.; Traunmueller, M.; Haindlmaier, G.; Jakobi, N.; Chaudhary, N.; Jakobi, N.; Kantorovitch, J.; Huovila, A.; Singh, A.; et al. Comprehensive Indicator Framework. AIT, NetZeroCities Deliverable 2.4.1. November 2022. Available online: https://netzerocities.eu/results-publications/ (accessed on 14 January 2024).
- Carter, N.; Bryant-Lukosius, D.; DiCenso, A.; Blythe, J.; Neville, A.J. The Use of Triangulation in Qualitative Research. Oncol. Nurs. Forum 2014, 41, 545–547. [Google Scholar] [CrossRef] [PubMed]
- Gilmore, N.; Koskinen, I.; van Gennip, D.; Paget, G.; Burr, P.A.; Obbard, E.G.; Daiyan, R.; Sproul, A.; Kay, M.; Lennon, A.; et al. Clean energy futures: An Australian based foresight study. Energy 2022, 260, 125089. [Google Scholar] [CrossRef]
- Ciambra, A.; Stamos, I.; Siragusa, A. Localizing and Monitoring Climate Neutrality through the Sustainable Development Goals (SDGs) Framework: The Case of Madrid. Sustainability 2023, 15, 4819. [Google Scholar] [CrossRef]
- Imbesi, L. The Social Role of the Designer in the Knowledge Society. Des. Princ. Pract. Int. J. Annu. Rev. 2019, 13, 19–28. [Google Scholar] [CrossRef]


| Emission/Impact Domain | Subdomain | Indicator | Suggested Unit of Measurement | |
|---|---|---|---|---|
| 1 | Greenhouse gas (GHG) emissions | Total GHG emissions | Total greenhouse gas emissions per year | t CO2 equivalents/year |
| 2 | Greenhouse gas (GHG) emissions | Stationary energy | GHG emissions per year from stationary energy per year | t CO2 equivalents/year |
| 3 | Greenhouse gas (GHG) emissions | Transport | GHG emissions from transport per year | t CO2 equivalents/year |
| 4 | Greenhouse gas (GHG) emissions | Waste | GHG emissions from waste per year | t CO2 equivalents/year |
| 5 | Greenhouse gas (GHG) emissions | Industrial processes and product use | GHG emissions from industrial processes and product use per year | t CO2 equivalents/year |
| 6 | Greenhouse gas (GHG) emissions | Agriculture, forestry, and land use (AFOLU) | GHG emissions from agriculture, forestry, and land use per year | t CO2 equivalents/year |
| 7 | Greenhouse gas (GHG) emissions | Grid-supplied energy | GHG emissions from grid-supplied energy per year | t CO2 equivalents/year |
| 8 | Greenhouse gas (GHG) emissions | Energy consumption | Change in the total energy consumption per year | kWh/year |
| 9 | Greenhouse gas (GHG) emissions | Energy efficiency | Change in energy efficiency over the lifetime of the project | % |
| 10 | Greenhouse gas (GHG) emissions | Share of renewable energies | Change in the energy mix over the lifetime of the project | % |
| 11 | Greenhouse gas (GHG) emissions | Carbon capture and residual emissions | Amount of permanent sequestration of GHG within city boundary | t CO2 equivalents/year |
| 12 | Greenhouse gas (GHG) emissions | GHG emissions | Change in the greenhouse gas emissions per sector during the lifetime of the project | t CO2 equivalents/year |
| 13 | Public health and environment | Air quality | Improved air quality | Highest annual mean of PM2.5 concentration recorded [µg PM2.5/m3] |
| 14 | Public health and environment | Noise | Reduction in noise pollution | % of population exposed to avg. LDEN > 55dB (annual average) |
| 15 | Public health and environment | Health | Improved physical and mental well-being | Likert scale; 5 scales to be determined in local survey |
| 16 | Public health and environment | Quality of life | Perceived change in the quality of life | Likert scale; 5 scales to be determined in local survey |
| 17 | Social inclusion, innovation, democracy, and cultural impact | Citizen and Community Participation | Improved citizen participation | # of citizens engaged through the Pilot activities |
| 18 | Social inclusion, innovation, democracy, and cultural impact | Capacity of the public administration | Improvement in skills and awareness | # of public officers trained through the Pilot activities |
| 19 | Social inclusion, innovation, democracy, and cultural impact | Social cohesion | Affordability of housing and energy | % of disposable household income spent on housing and energy |
| 20 | Social inclusion, innovation, democracy, and cultural impact | Digitalisation | Improved acceptance of digital solutions | total # of users per digital solution |
| 21 | Social inclusion, innovation, democracy, and cultural impact | Social innovation | Number of participative activities implemented per stakeholder group | total # of counselled activities |
| 22 | Social inclusion, innovation, democracy, and cultural impact | Scientific or Communication Outreach of the project | Scientific publications, social campaigns, etc. | total # of scientific publications |
| 23 | Social inclusion, innovation, democracy, and cultural impact | Upscaling and replication | Number of follow-up projects or districts | total # of follow-up projects |
| 24 | Economy | Investment in R&I | Improved investments in climate change action | EUR invested over the lifetime of the pilot project |
| 25 | Economy | Skilled jobs and employment | Newly created sustainable jobs | total # of newly created jobs |
| 26 | Economy | Technological readiness | Number of solutions suggested for implementation in local strategies | total # of implemented solutions over the lifetime of the project |
| 27 | Economy | Local entrepreneurship and local businesses | Creation of start-ups, accelerators, or tech innovation | total # of start ups created during the lifetime of the project |
| 28 | Economy | Increase in efficiency | Savings in working time achieved | Working hours/per year saved |
| 29 | Economy | Revenues generated | Revenues generated by the project | total EUR during the lifetime of the project excluding funding |
| 30 | Resource efficiency | Waste management and efficiency | Urban waste reduction; biowaste recovery | % of recycled domestic waste of the total domestic waste generation |
| 31 | Resource efficiency | Circular economy | Re-use of material during construction or renovation | % of recycled construction material of the total construction material used in the process |
| 32 | Resource efficiency | Water management | Improved water management | Household water consumption [l/capita/day] |
| 33 | Resource efficiency | Land use management | Improved land use management practices (e.g., urban greening) | m2 of public green space/inhabitant |
| 34 | Biodiversity | Urban forestry plantation and improved plant health | Percentage of tree canopy within the city | % of the municipal area |
| 35 | Biodiversity | Non-invasive species and pollinators | Change in the number of species of birds in built-up areas | % of change in species |
| 36 | Biodiversity | Ecological habitat connection | Structural connectivity of green spaces | Degree of physical (“structural”) connectivity between natural environments within a defined urban area |
| S.No. | Thematic Groups of Customised Indicators | Corresponding Clusters of Standardised Indicators |
|---|---|---|
| 1 | Bottom-up approaches, participation, and involvement (people, neighbourhood, and company and government channels) | Number of participative activities implemented per stakeholder group; improved citizen participation |
| 2 | Awareness building, training, knowledge sharing, and capacity building | Improvement in skills and awareness |
| 3 | Satisfaction and self-efficacy | Improved physical and mental well-being |
| 4 | Unique/city-specific | - |
| 5 | Policy and regulatory indicators * | - |
| 6 | Economic and financial indicators | Improved investments in climate change action |
| 7 | Behavioural indicators * | - |
| 8 | New ventures and businesses | Number of follow-up projects of districts |
| 9 | Technology-based solutions | Number of solutions suggested for implementation in local strategies |
| 10 | Publication | Scientific publications, social campaigns, etc. |
| 11 | Operations, decision making, and reporting indicators * | - |
| 12 | Air quality and CO2e reduction | Improved air quality |
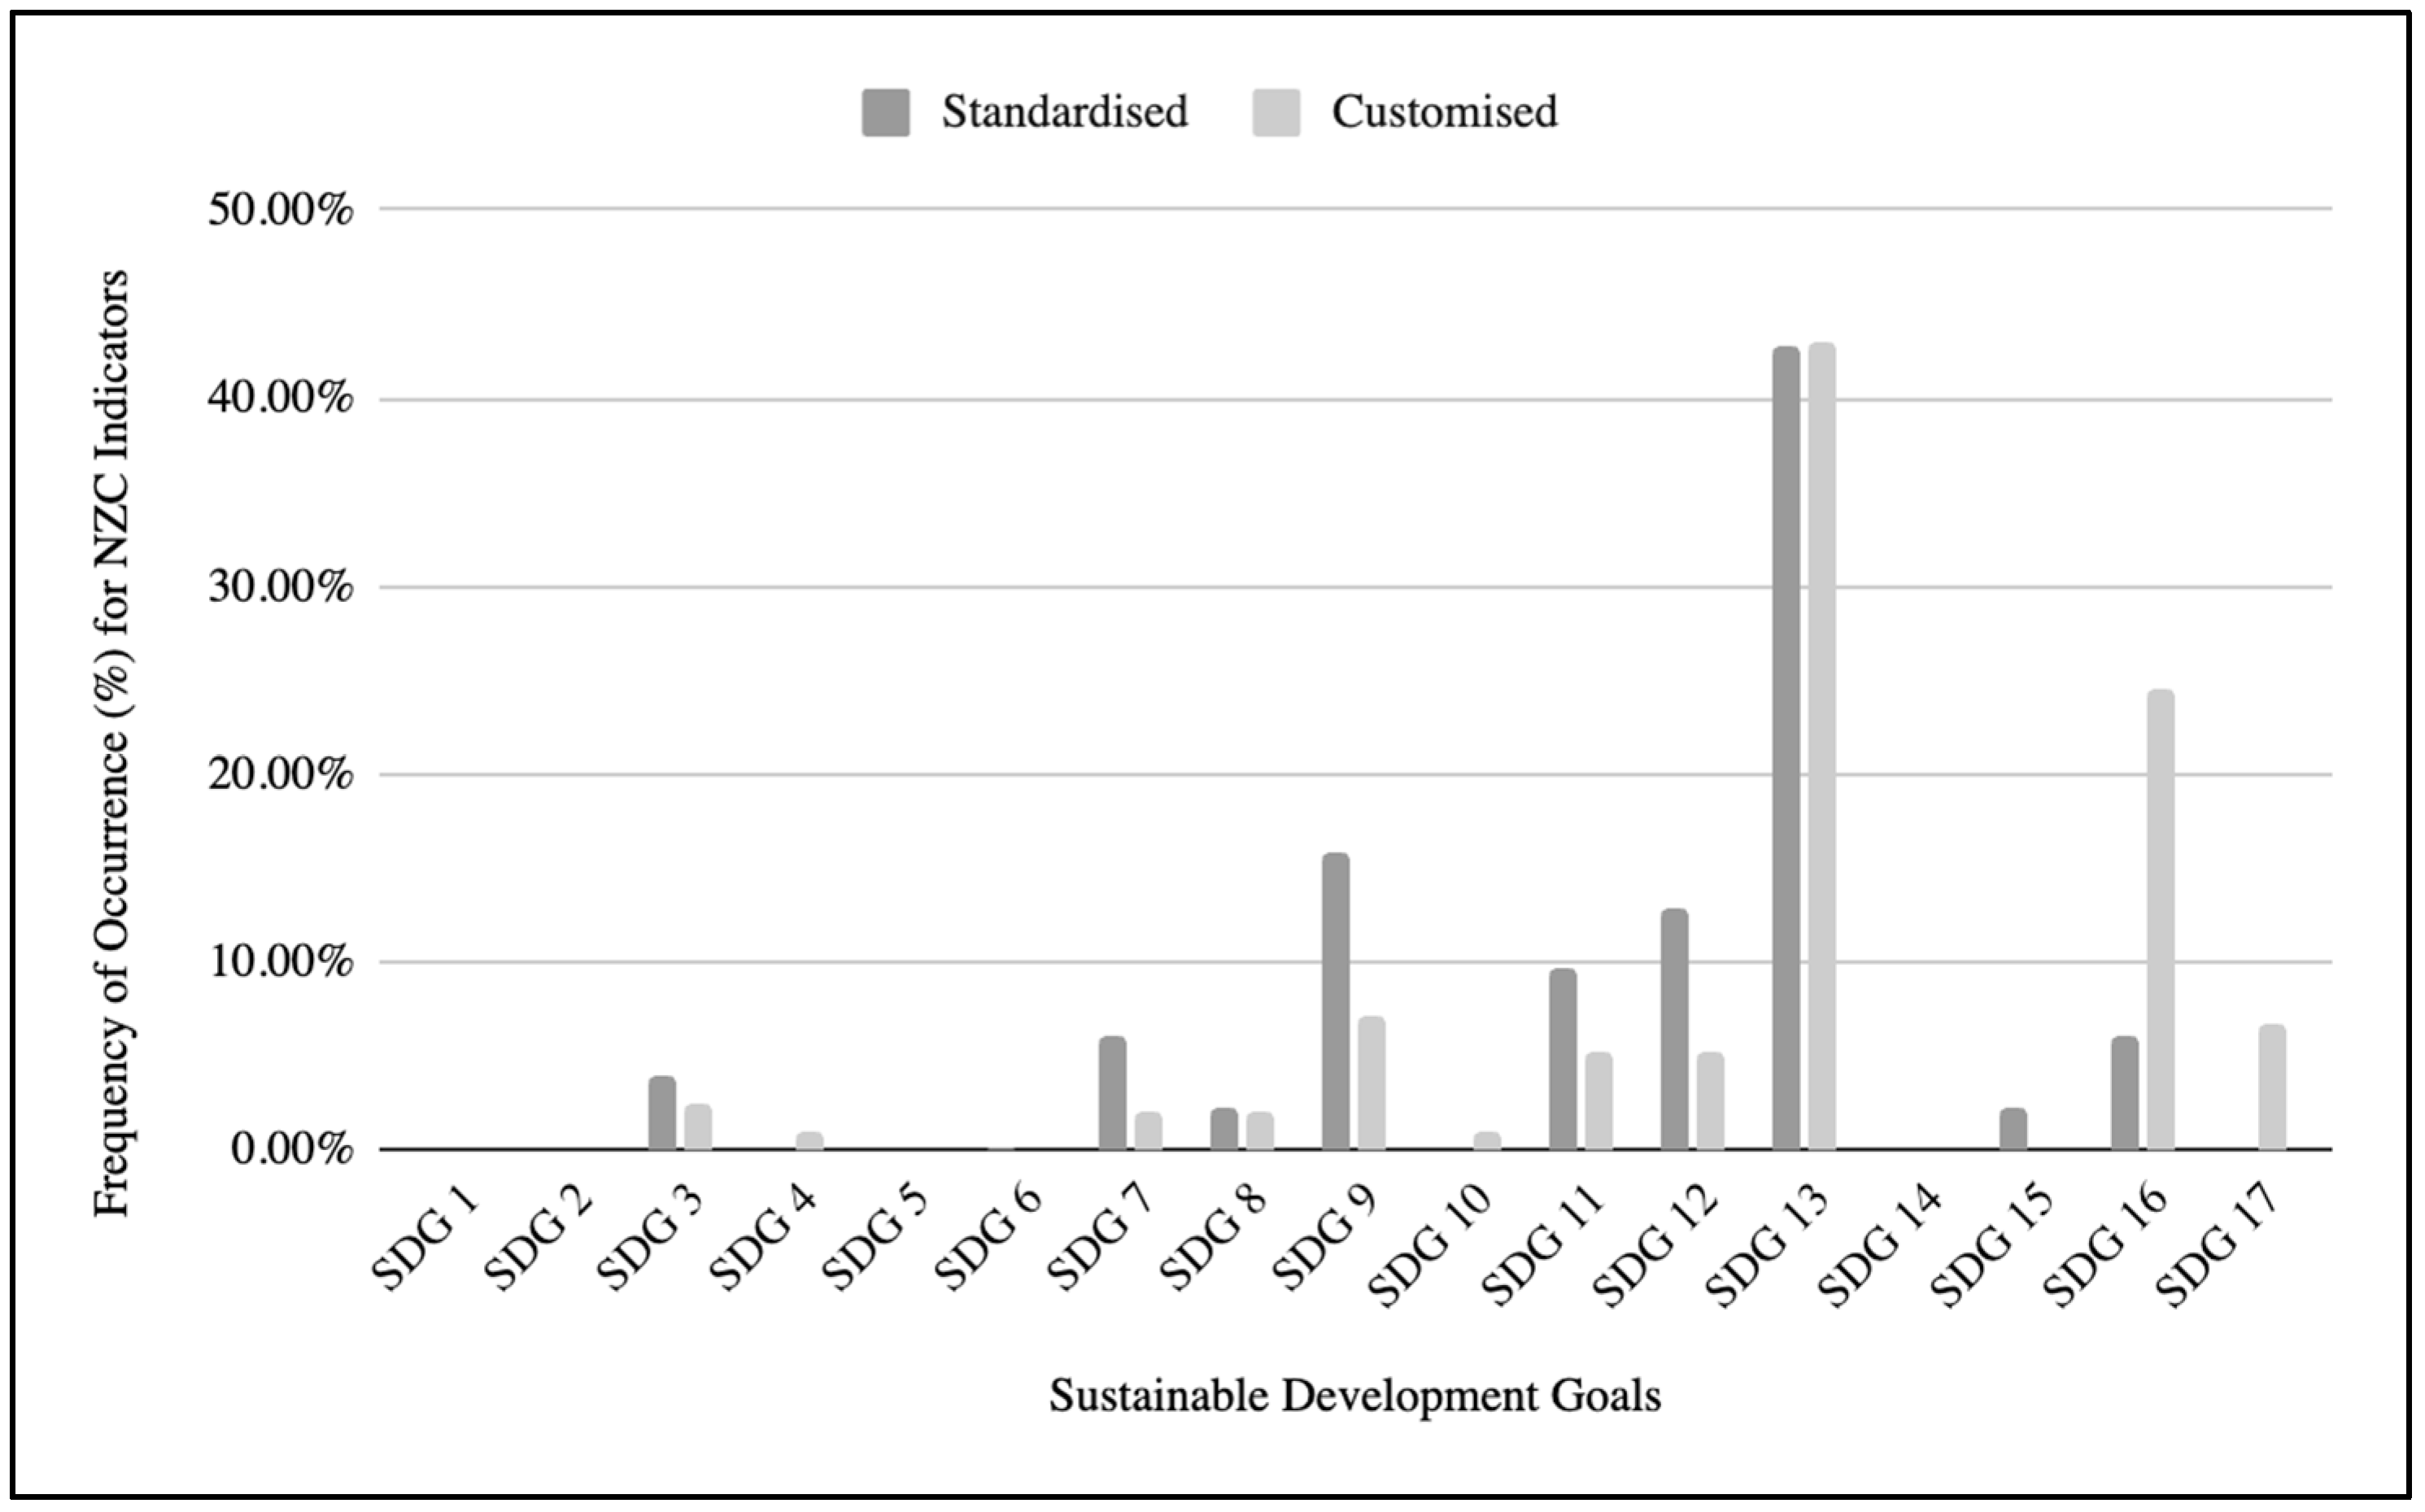
| Rank | SDG | Frequency of Occurrence, f (Expressed as a %) |
|---|---|---|
| 1 | SDG13—Climate Action | 42.80% |
| 2 | SDG9—Industry, Innovation, and Infrastructure | 15.90% |
| 3 | SDG12—Responsible Consumption and Production | 12.80% |
| 4 | SDG11—Sustainable Cities and Communities | 9.60% |
| 5 | SDG7—Affordable and Clean Energy | 6.10% |
| 6 | SDG16—Peace, Justice, and Strong Institutions | 6.10% |
| 7 | SDG3—Good Health and Well-being | 4.00% |
| 8 | SDG15—Life on Land | 2.30% |
| 9 | SDG8—Decent Work and Economic Growth | 2.30% |
| 10 | SDG6—Clean Water and Sanitation | 0.10% |
| Rank | SDG | Frequency of Occurrence (Expressed as a %) |
|---|---|---|
| 1 | SDG13—Climate Action | 43.10% |
| 2 | SDG16—Peace, Justice, and Strong Institutions | 24.50% |
| 3 | SDG9—Industry, Innovation, and Infrastructure | 7.20% |
| 4 | SDG17—Partnerships for the Goals | 6.70% |
| 5 | SDG12—Responsible Consumption and Production | 5.30% |
| 6 | SDG11—Sustainable Cities and Communities | 5.30% |
| 7 | SDG3—Good Health and Well-being | 2.40% |
| 8 | SDG7—Affordable and Clean Energy | 2.00% |
| 9 | SDG8—Decent Work and Economic Growth | 2.00% |
| 10 | SDG10—Reduce Inequalities | 1.00% |
| 11 | SDG4—Quality Education | 1.00% |
Disclaimer/Publisher’s Note: The statements, opinions and data contained in all publications are solely those of the individual author(s) and contributor(s) and not of MDPI and/or the editor(s). MDPI and/or the editor(s) disclaim responsibility for any injury to people or property resulting from any ideas, methods, instructions or products referred to in the content. |
© 2024 by the authors. Licensee MDPI, Basel, Switzerland. This article is an open access article distributed under the terms and conditions of the Creative Commons Attribution (CC BY) license (https://creativecommons.org/licenses/by/4.0/).
Share and Cite
Mondal, R.; Bresciani, S.; Rizzo, F. What Cities Want to Measure: Bottom-Up Selection of Indicators for Systemic Change toward Climate Neutrality Aligned with Sustainable Development Goals (SDGs) in 40 European Cities. Climate 2024, 12, 41. https://doi.org/10.3390/cli12030041
Mondal R, Bresciani S, Rizzo F. What Cities Want to Measure: Bottom-Up Selection of Indicators for Systemic Change toward Climate Neutrality Aligned with Sustainable Development Goals (SDGs) in 40 European Cities. Climate. 2024; 12(3):41. https://doi.org/10.3390/cli12030041
Chicago/Turabian StyleMondal, Rohit, Sabrina Bresciani, and Francesca Rizzo. 2024. "What Cities Want to Measure: Bottom-Up Selection of Indicators for Systemic Change toward Climate Neutrality Aligned with Sustainable Development Goals (SDGs) in 40 European Cities" Climate 12, no. 3: 41. https://doi.org/10.3390/cli12030041
APA StyleMondal, R., Bresciani, S., & Rizzo, F. (2024). What Cities Want to Measure: Bottom-Up Selection of Indicators for Systemic Change toward Climate Neutrality Aligned with Sustainable Development Goals (SDGs) in 40 European Cities. Climate, 12(3), 41. https://doi.org/10.3390/cli12030041