Communication

Jet Stream Changes over Southeast Australia during the Early Cool Season in Response to Accelerated Global Warming

School of Mathematical and Physical Sciences, University of Technology Sydney, 15 Broadway, Ultimo 2007, NSW, Australia
*
Author to whom correspondence should be addressed.
Climate 2022, 10(6), 84; https://doi.org/10.3390/cli10060084
Submission received: 20 April 2022 / Revised: 26 May 2022 / Accepted: 6 June 2022 / Published: 15 June 2022
(This article belongs to the Special Issue Recent Climate Change Impacts in Australia)

Abstract

:
In recent decades, southeast Australia has experienced both extreme drought and record-breaking rainfall, with devastating societal impacts. Variations in the Australian polar-front jet (PFJ) and the subtropical jet (STJ) determine, for example, the location and frequency of the cool season (April–September) weather systems influencing rainfall events and, consequently, water availability for the southern half of Australia. Changes in jet stream wind speeds also are important for aviation fuel and safety requirements. A split jet occurs when the single jet separates into the STJ and PFJ in the early cool season (April–May). This study focusses on split jet characteristics over Australian/New Zealand longitudes in recent decades. During the accelerated global warming from the mid-1990s, higher mean wind speeds were found in the PJF across the Australian region during June–September, compared to the STJ. In contrast, significant wind speed increases occur in the early cool season (April–May) at STJ latitudes, which straddle the East Coast of Australia and the adjacent Tasman Sea. These changes are linked to major changes in the mean atmospheric circulation, and they include relative vorticity and humidity, both being vital for the development of rain-bearing weather systems that affect the region.

1. Introduction

Globally, jet stream variations during accelerated global warming (GW) have had major impacts on weather extremes. It is well-known that the west-to-east jet streams located in the upper troposphere affect the development, tracks, and intensity of rain bearing systems [1]. In the Southern Hemisphere (SH), climate models consistently predict an almost year-round poleward shift in mid-latitude westerly winds as a consequence of global warming [2,3,4]. This poleward shift is most notable in the cool season, April–September (hereafter, Apr–Sep), when the westerly winds are at their most equatorward mean latitude. Within the westerly wind circulation, the subtropical jet (STJ) is a narrow band of strong wind with maximum speed at an average height of around 200 hPa in the upper troposphere. It is characterized by a large vertical and horizontal wind shift and one or more speed maxima, reaching values of 70–100 m s−1. It occurs at the latitudes of the descending branch of the Hadley Cell after warm, rising tropical air has gained westerly angular momentum as it cools and descends. Its mean location in the SH over Australia is at approximately 30° S. An important feature in the Australian region is that in Apr–Sep and annually, there are two jets in the mean flow, the STJ at 25–30° S and the Polar Front Jet (PFJ) at 40–50° S. Both are narrow bands of strong westerly winds in the troposphere characterized as a distinct split jet over the Australia/New Zealand region (e.g., [5,6,7,8,9,10,11,12,13]). Using 250 hPa as the average height of the two jets, the climatology of the split jet is shown using ERA5 data [14] from 1965–2020 (Figure 1a–d). The dominant split jet is present annually (Figure 1a) and for the cooler months from Apr–Sep. (Figure 1b,c). In the warmer months from October–March (Figure 1d) the split jet gradually becomes a single jet by November at approximately 45–50° S in the time-mean flow.
Recently, Zolotov et al. [15] applied a correlation analysis to the NCEP-NCAR reanalysis data [16] and found, for the period 1948–2013, a poleward shift of the latitudinal jet position and a decrease in the wind speed on the jet axis that are statistically significant indicators for the SH STJ variability. They noted that the variability of the latitudinal position is more expressed in summer, whereas the variability of wind speed is more prominent in winter. Furthermore, there can be a single, merged jet with large variation in latitude over eastern Australian/New Zealand longitudes [13]. The structure of the jet, split or merged, is important in determining the dynamics of cool season weather systems that affect southern Australia.
The tropospheric jet streams link the influence of the El-Nino Southern Oscillation (ENSO) to the middle and high latitudes. During an El Niño event, the warming of the tropical troposphere strengthens and contracts the Hadley Circulation. Consequently, the subtropical jet stream moves equatorward, and the displaced jet stream affects the central location of baroclinic eddies, which drives anomalous ascending motions in the mid-latitudes. The eddy forcing then induces anomalous adiabatic cooling in the mid-latitudes to displace the location of the polar jet stream, which is driven by the north–south thermal gradient and the resultant baroclinic eddy forcing [17,18].
Although some of these studies provide valuable insights into the structure and variability of the split jet in general, a more detailed statistical analysis of the split jet in the Australian region is required, owing to the possible impact of changes in the split jet characteristics. This emphasis on the warming that has occurred after the mid-1970s climate shift is due to increasing greenhouse gas concentrations in that period [19,20]. Furthermore, the acceleration in global warming from the 1990s [4,21] and in the associated global ocean heat content [22,23] has coincided with a dominant poleward contracted SH PFJ, accompanied by an anomalous increase in its wind speed and an anomalous decrease in the SH STJ wind speed [24,25,26,27,28,29,30,31].
The main aims of this study are to investigate changes in the climatological split jet over the Australian region and to indicate some important changes in meteorological variables associated with the split jet in response to accelerated global warming from the 1990s. For example, in much of southeast Australia where cool season precipitation dominates any dry season precipitation [32], a highly significant decrease in late Autumn (April–May) precipitation was previously found [33]. However, for the remainder of the cool season June–September (JJAS), there was no significant decrease. Also, April–May is the abrupt transition time from a single high latitude jet to the cool season split jet [13]. Therefore, the Apr–Sep jet stream data were split in order to compare the two groupings: April–May and June–September. We note that significantly higher mean wind speeds were found in the PJF across the Australian region during June–September, compared to the STJ. This affects aviation fuel consumption as well as route scheduling and passenger comfort and safety across southern Australian longitudes [34,35]. In contrast, significant wind speed increases occur in the early cool season (April–May) at STJ latitudes, which straddle the East Coast of Australia and the adjacent Tasman Sea. Consequently, in this study, we found that the known significant decrease in April–May precipitation over inland southeast Australia, from changes in location of East Coast Lows (ECLs) and cut-off lows in MAM over inland southeast Australia, is closely linked to observed major changes in the mean atmospheric circulation.

2. Methods

Within a comprehensive list of reanalysis datasets readily available, there is a good agreement between all reanalyses for the properties of the zonal means of the mid-tropospheric jets [36]. The reanalysis data chosen for this study is the ERA5-Interim archived dataset [14] covering the period 1979–2020, whereas the preliminary back extension dataset covering from 1965 is outlined in Bell et al. [37]. The dynamic atmospheric variables are represented by a spectral T255 horizontal resolution or 0.250 (~30 km) grid spacing on a reduced Gaussian grid. The vertical resolution consists of 60 model layers with the top of the atmosphere located at 0.1 hPa. To represent the zonal wind covering the Australian region, the gridded u-component at 250 hPa is used spanning latitudes 15–70° S and longitudes 90–180° E. The 250 hPa level was chosen as a mean level to cover the 200 hPa mean level of the STJ, and the lower mean level of 250 to 300 hPa of the polar front jet at mid-latitudes.
Additionally, relative vorticity, relative humidity, and vector wind data at 500 hPa were obtained from ERA5 to analyze changes associated with the 250 hPa zonal wind. According to [12], there is an abrupt (2–3 week) transition during April–May from a singular mid-latitude jet south of the Australian continent in the warm season. Therefore, in this study, the April–September wind data were split in order to compare the two monthly groupings of April–May and JJAS, such that the time series differences with significance contour intervals were displayed in four panels: annual, late autumn (April–May), the four remaining cool season months (JJAS), and the warm season (October–March).
To perform statistical significance testing on the data, the grouping of two periods 1965–1992 and 1993–2020 was used for the zonal wind speed at 250 hPa, in addition to both relative vorticity and relative humidity at 500 hPa, as well as wind vector anomalies at 500 hPa. There were two SST warming events in the 20th century–namely 1925–1926 and 1987–1988 [38]–but our choice of periods was influenced by the fact that GW accelerated from the early to mid-1990s [4,21], in addition to an increase in ocean heat content [22,23]. Change point analysis of the data is not applicable here because the acceleration in GW occurred over several years in the early to mid-1990s. If years other than 1992 had instead been chosen to demarcate the two periods, the findings would have remained almost unchanged. Two-sided permutation testing was applied to test for statistical significance of these trends. A significance level of α < 0.1 was considered to represent a statistically significant result, and α < 0.05 implies a highly significant result.

3. Results

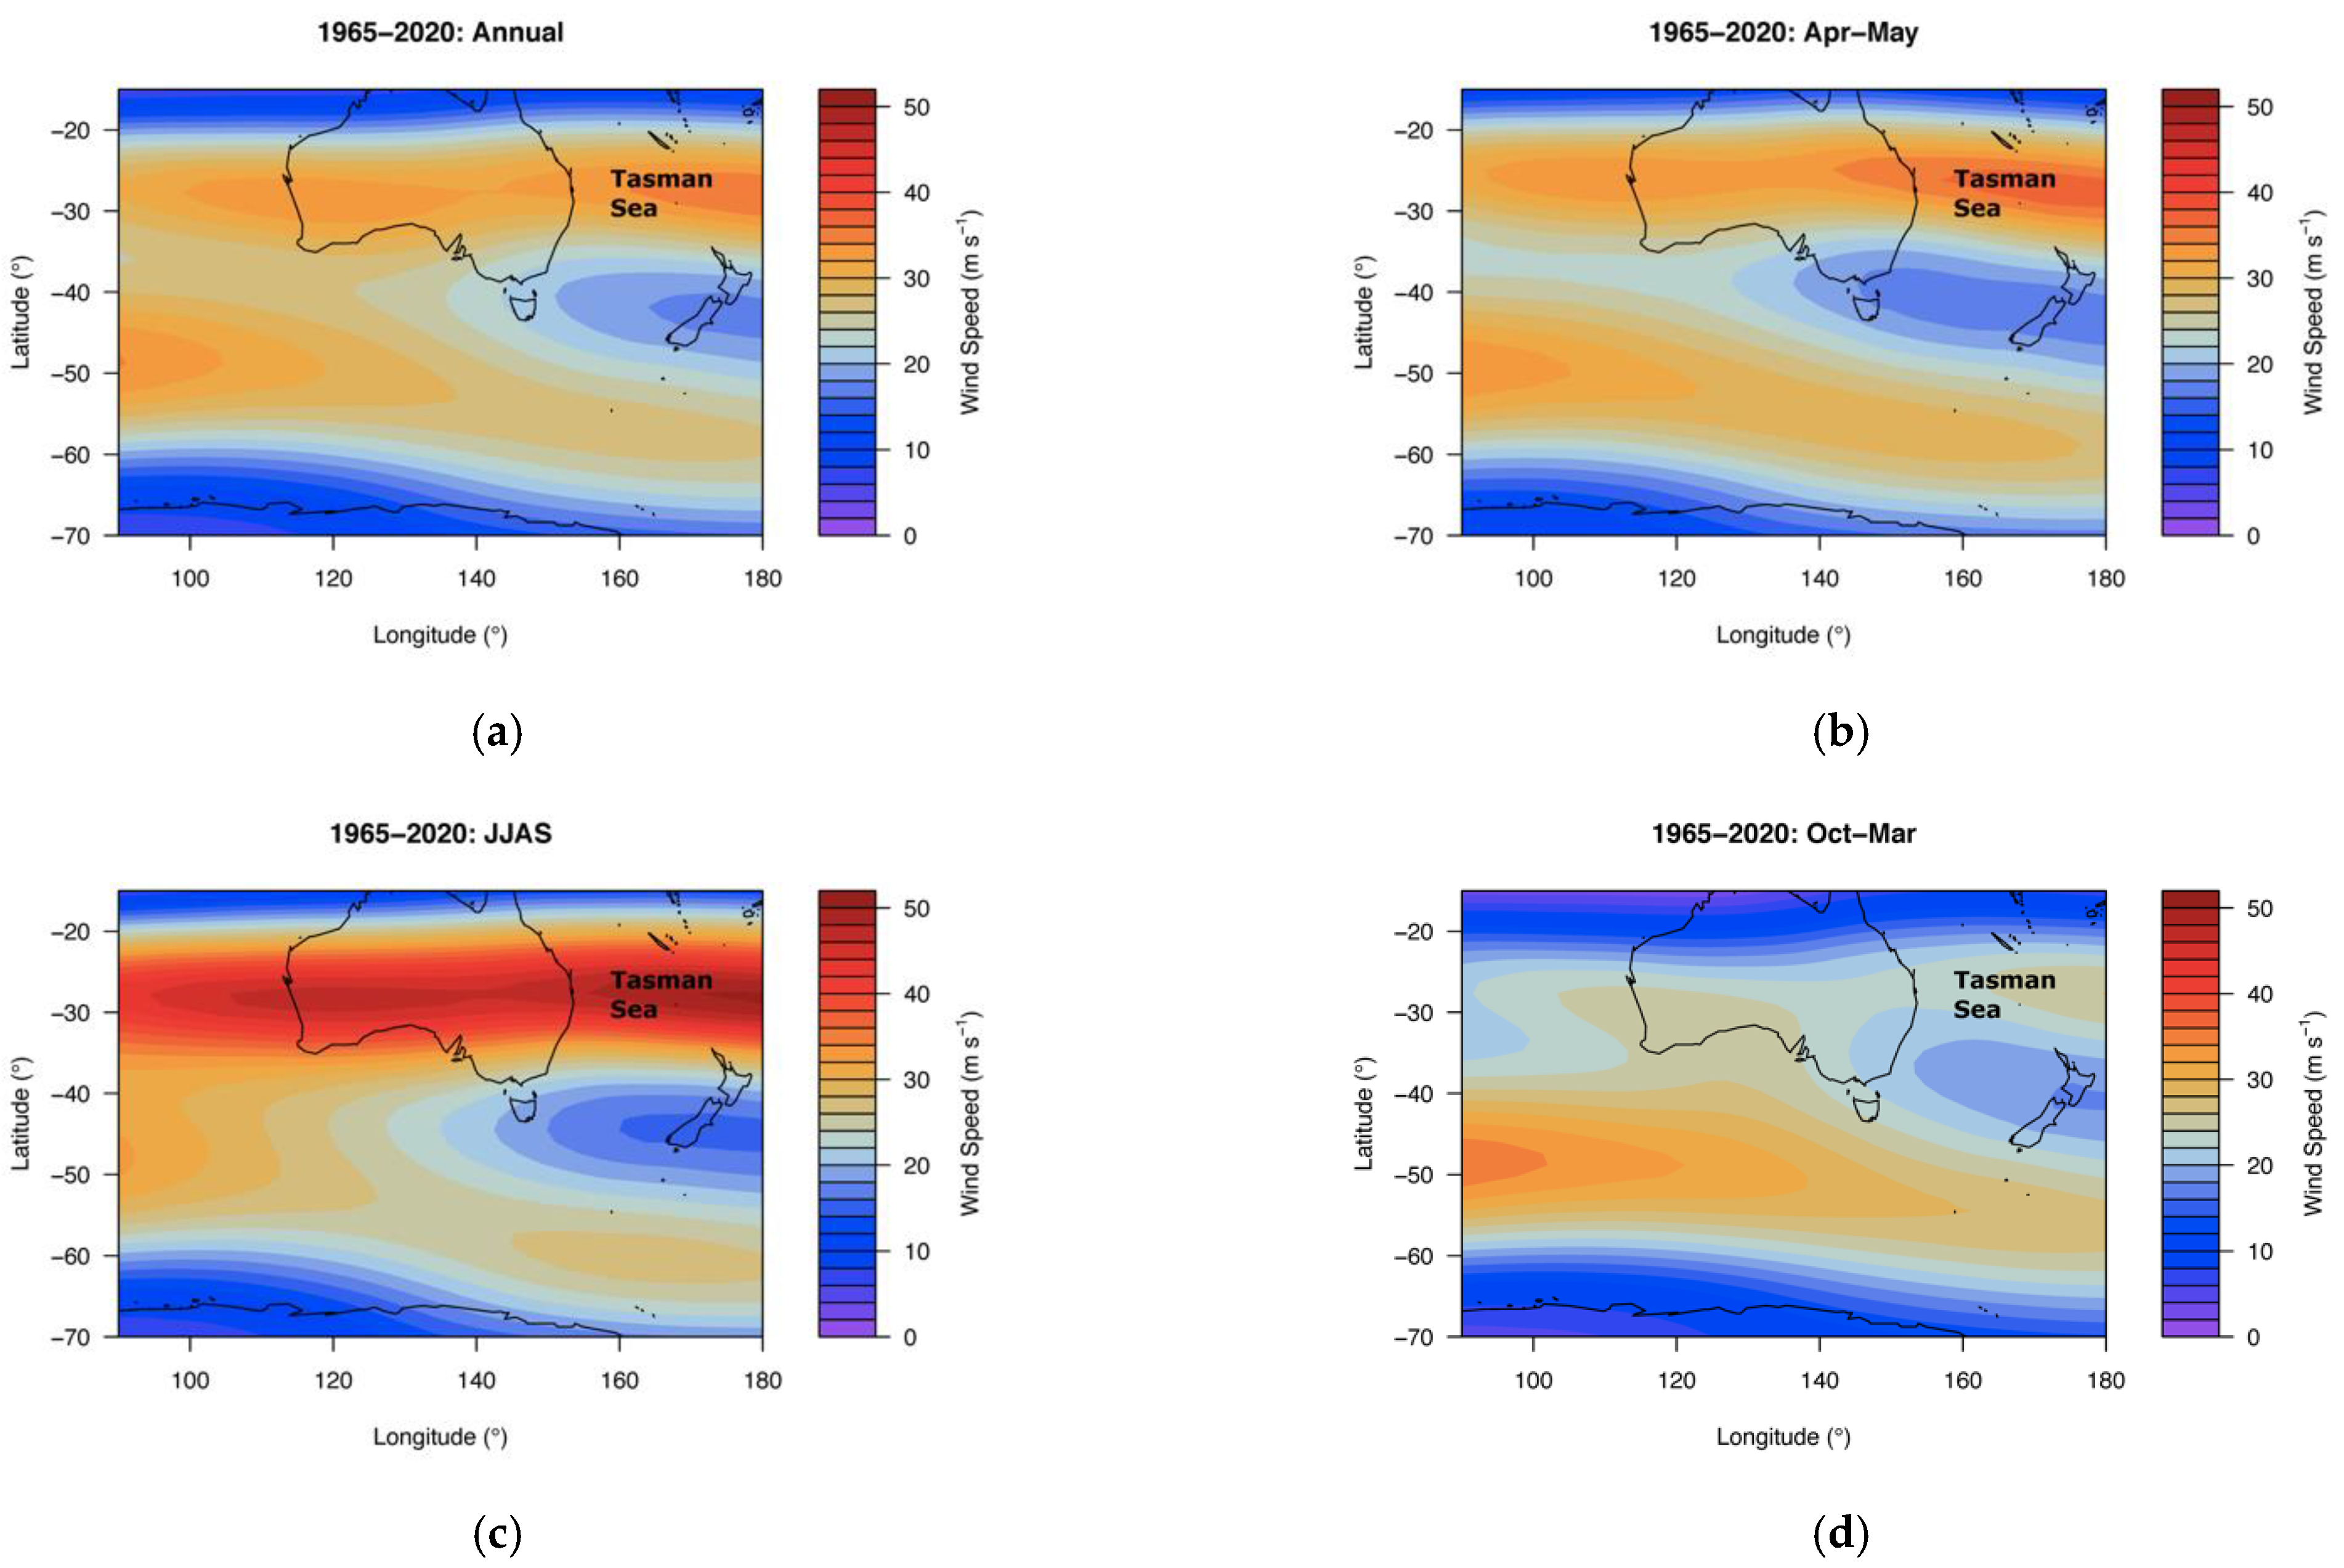
3.1. Jet Stream Changes April–September

If the STJ structure has moved poleward, fewer cold frontal weather systems are expected to influence southern Australia in the cool season, as observations confirm [21]. In addition, marine low-pressure systems, also referred to as East Coast Lows (ECLs) (e.g., [39,40,41]), that develop adjacent to the Australian East Coast, are dependent on jet stream structure. Therefore, possible changes in mean speed or location of the two branches of the jet over eastern Australia have important implications for the location of low-pressure system development [42]. Rain-producing cut-off low-pressure systems, which form in the cool season over southeast Australia [43,44], are mostly driven by baroclinic processes [45]. They are linked to high pressure blocking [46] in association with the split-level flow [13,44]. About half the reduction in cool season rainfall since 1990 over inland southeast Australia is due to the reduction in frequency of cut-off systems, and, by association, a reduction in the frequency of blocking in the Tasman Sea/New Zealand region [47].
In the Australia-New Zealand region of the SH, the Apr–Sep. cool season is the main period to examine for possible jet stream changes, because there is an apparent interplay between the STJ and PFJ branches compared to the single jet at other SH longitudes. It was found that when the southern annular mode (SAM) [48,49] is in a negative phase, the SH mid-latitude polar jet stream wind speed anomalies are weaker and the STJ wind speed becomes anomalously strong [42]. In contrast, in the positive SAM phase, the STJ wind speed anomalies weaken, and the zonal mid-latitude westerly winds contract poleward together with a more pronounced PFJ, which is defined by an increase in mid-latitude zonal wind speed anomalies. They concluded that without any shift in latitude of either jet, there is a dipole that oscillates between polar jet and subtropical jet, which shifts the storm track and associated baroclinic processes (processes favoring low-pressure development) latitudinally. From the 1990s, corresponding to the acceleration of GW in both the atmosphere [4,21] and ocean heat content [22,23], we found significant differences firstly in the location of the April-May jet stream wind speed maxima. This is shown as a significant weakening in the STJ wind speed maximum over Western Australian longitudes at latitudes 20–25° S, whereas an area of significant increase is evident over the eastern Australian coast at latitudes 25–30° S, which extends eastward to the adjacent Tasman Sea (Figure 2a). In addition, a significant increase is shown in the wind speed of the PJF branch of the split jet (Figure 2a). Second, JJAS differences indicate significant polar jet increases in wind speed maxima between latitudes 40–50° S in addition to significant decreases extending across subtropical latitudes of the Australian East Coast (Figure 2b). In particular, the significant decreases in Figure 2b also occur across the subtropical latitudes of the Australian continent implying that in JJAS, when the split jet is dominant, the PFJ has become stronger relative to the STJ. For the warm season October–March, there are significant wind speed increases between 50–60° S (Figure 2c), which represents the climatological single jet that gradually becomes dominant by November [11].
Relative vorticity in the mid-troposphere is an indication of preferred areas of surface low-pressure development and hence precipitation [50]. Entrance and exit areas of jet streams where the wind speeds up and slows down, respectively, lead to areas of upper-level divergence and convergence, and hence to increases and decreases of relative vorticity in the mid-troposphere. This affects where low-pressure and high-pressure systems develop near the surface and, consequently, the formation and tracks of rain-bearing -systems [50]. To illustrate how the development areas of these rain-producing low-pressure systems have changed in the same period, relative vorticity changes at 500 hPa are shown in Figure 3. In April–May, relative vorticity has increased significantly south of Western Australia (WA) while over Tasman Sea longitudes at 30–35° S relative vorticity has also increased significantly (Figure 3a). For JJAS there is a significant decrease in relative vorticity impinging on southwest WA from the adjacent Indian Ocean centred along 30° S implying a reduction in favourable area of low-pressure development. Similarly, at eastern Australian/Tasman Sea longitudes there is a significant decrease in relative vorticity centred between 30–35° S in JJAS (Figure 3b). Importantly, in the longitudes between 140° E and 180° E, relative vorticity associated with the polar branch of the split jet has shifted approximately 5° poleward as shown by the significant decrease at 55° S and significant increase at 60° S (Figure 3b).
When the SAM is positive, it was found that from 1979–2005, the PFJ is clearly separated from the STJ, and the PFJ extends across the South Pacific [42]. When the SAM is negative, the PFJ moves north, blending into the STJ. However, they noted, as [51] also pointed out, that at ~150° E, there remains a local wind speed maximum, thereby indicating that the SAM appears inactive at these longitudes. Furthermore, no recent coherence was found by [52] between southeast Australian autumn rainfall and the SAM. Consequently, the implication is that the changes in baroclinicity (preferred areas of low-pressure development) mentioned above in relation to the split jet, are consistent with GW features that climate models have consistently shown for many years, that there is poleward contraction of the zonal westerlies and the subtropical dry zone [2,3,4].

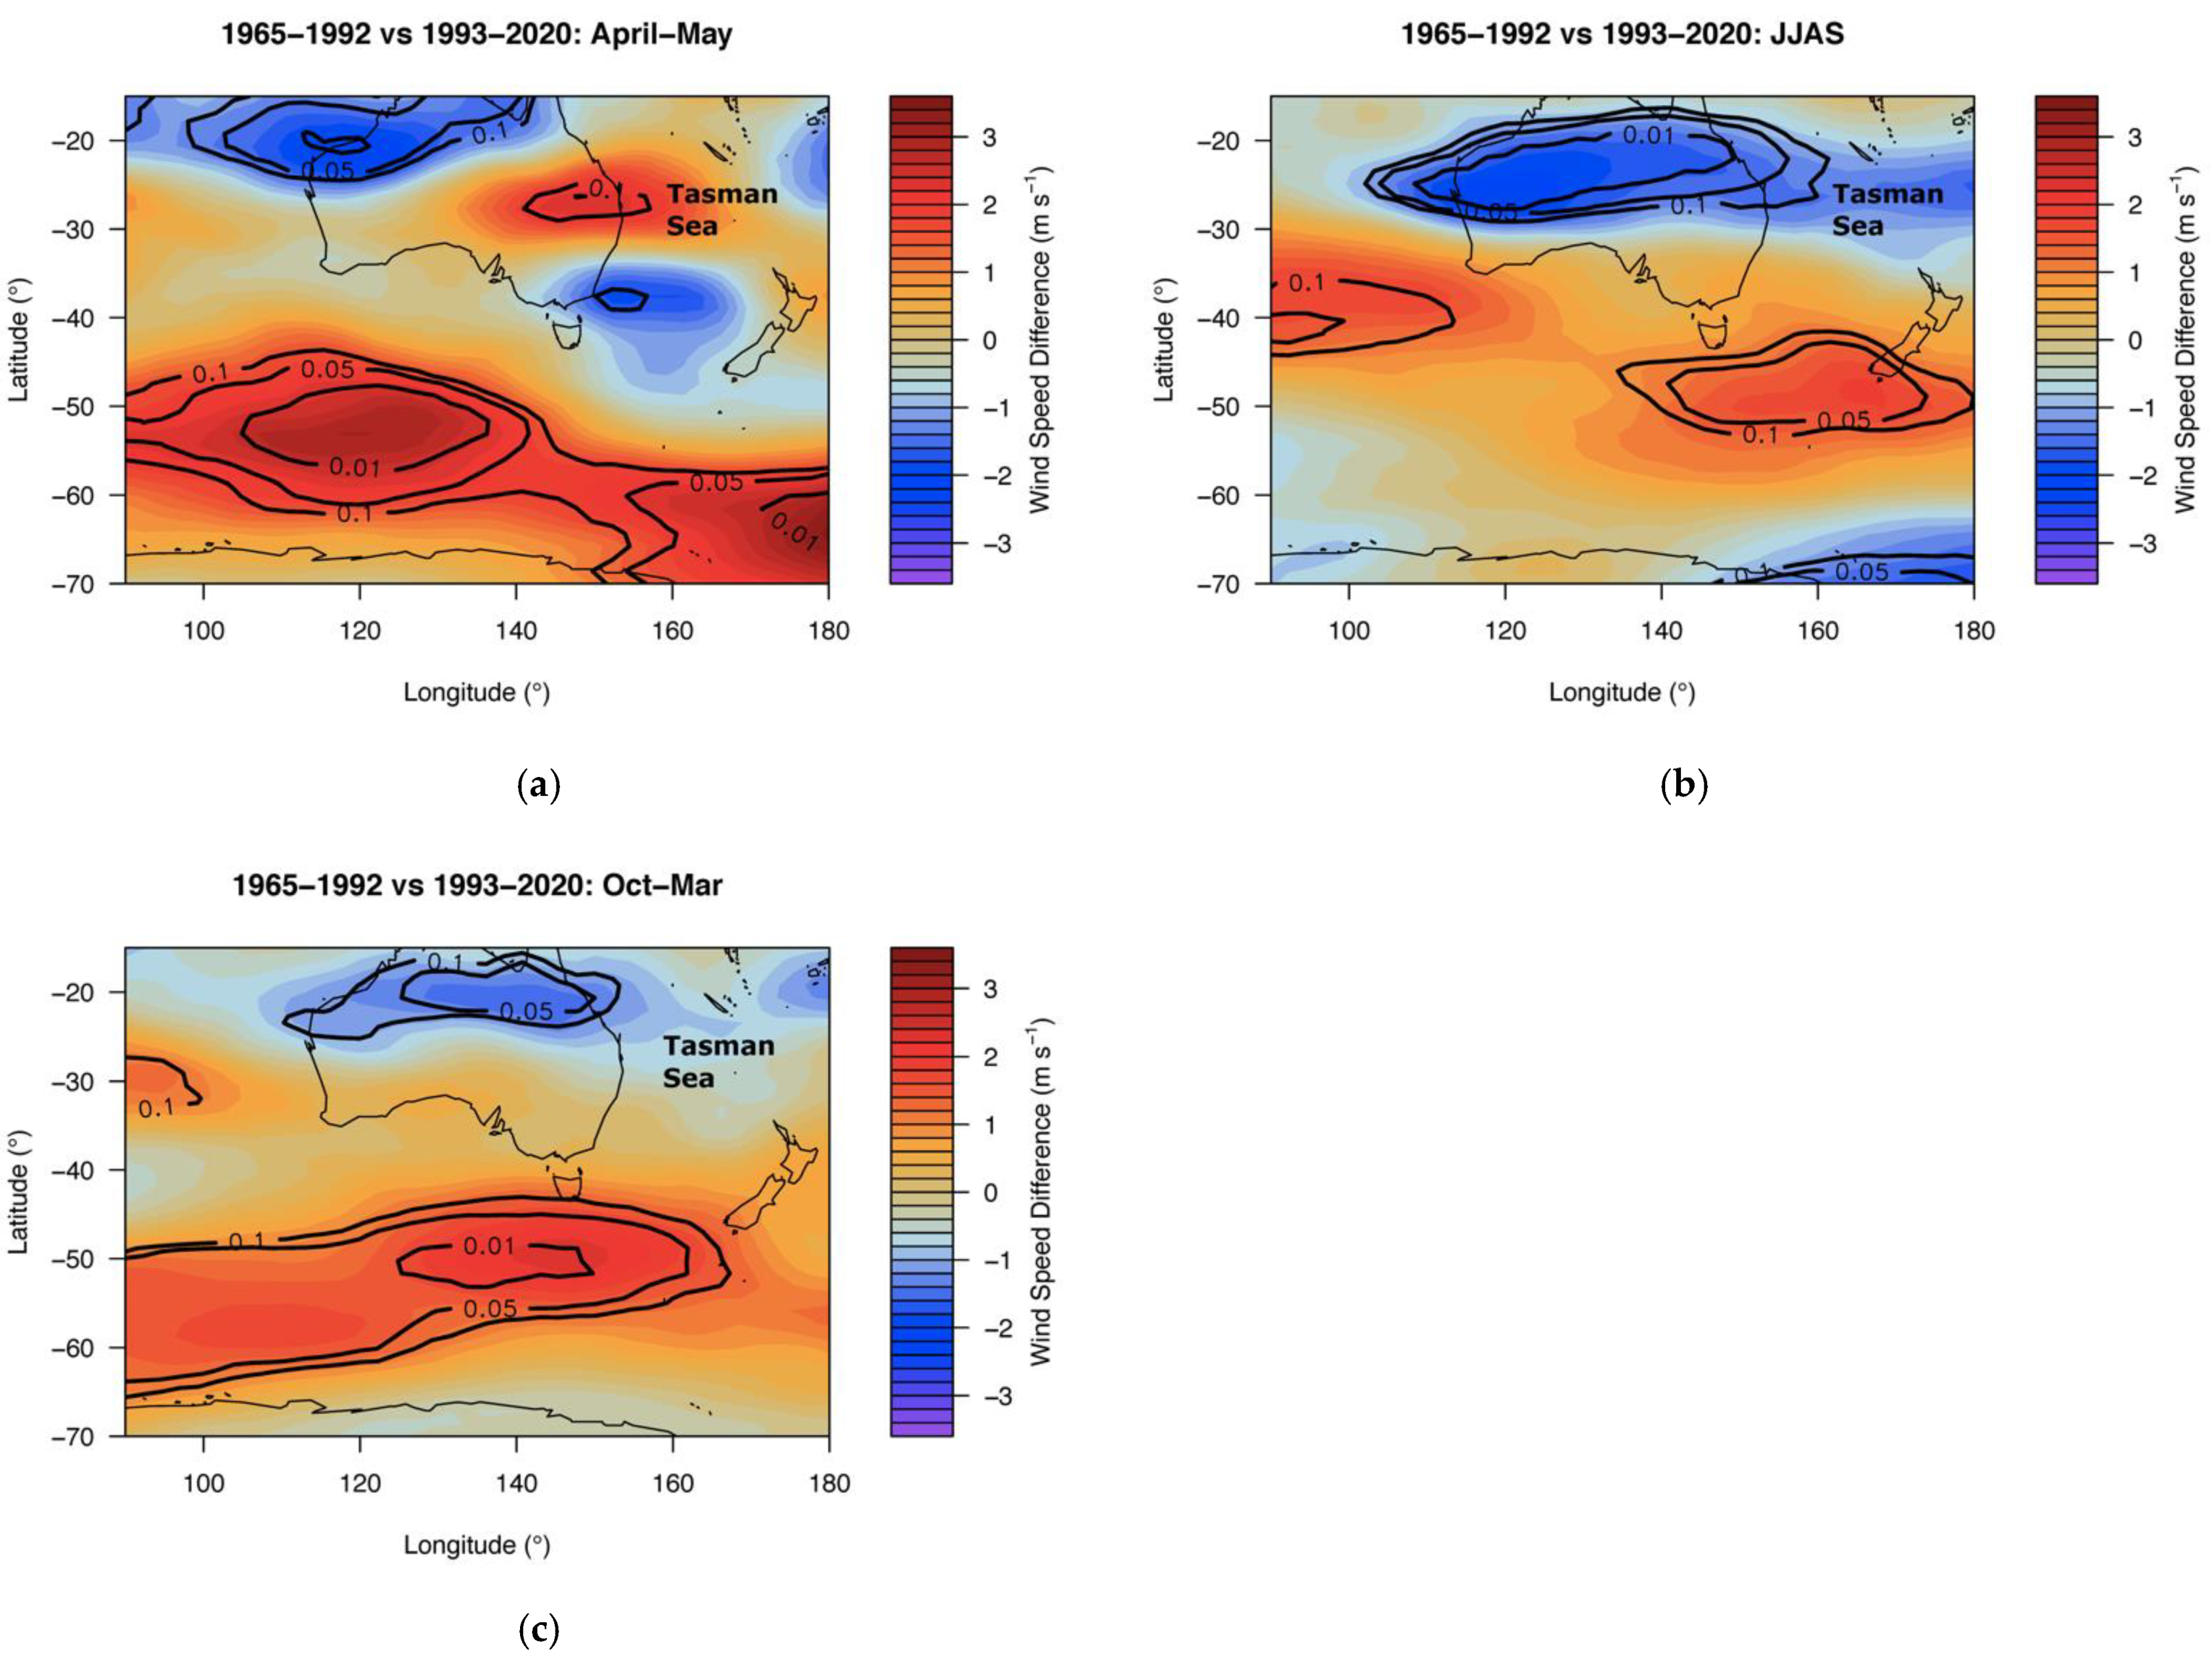
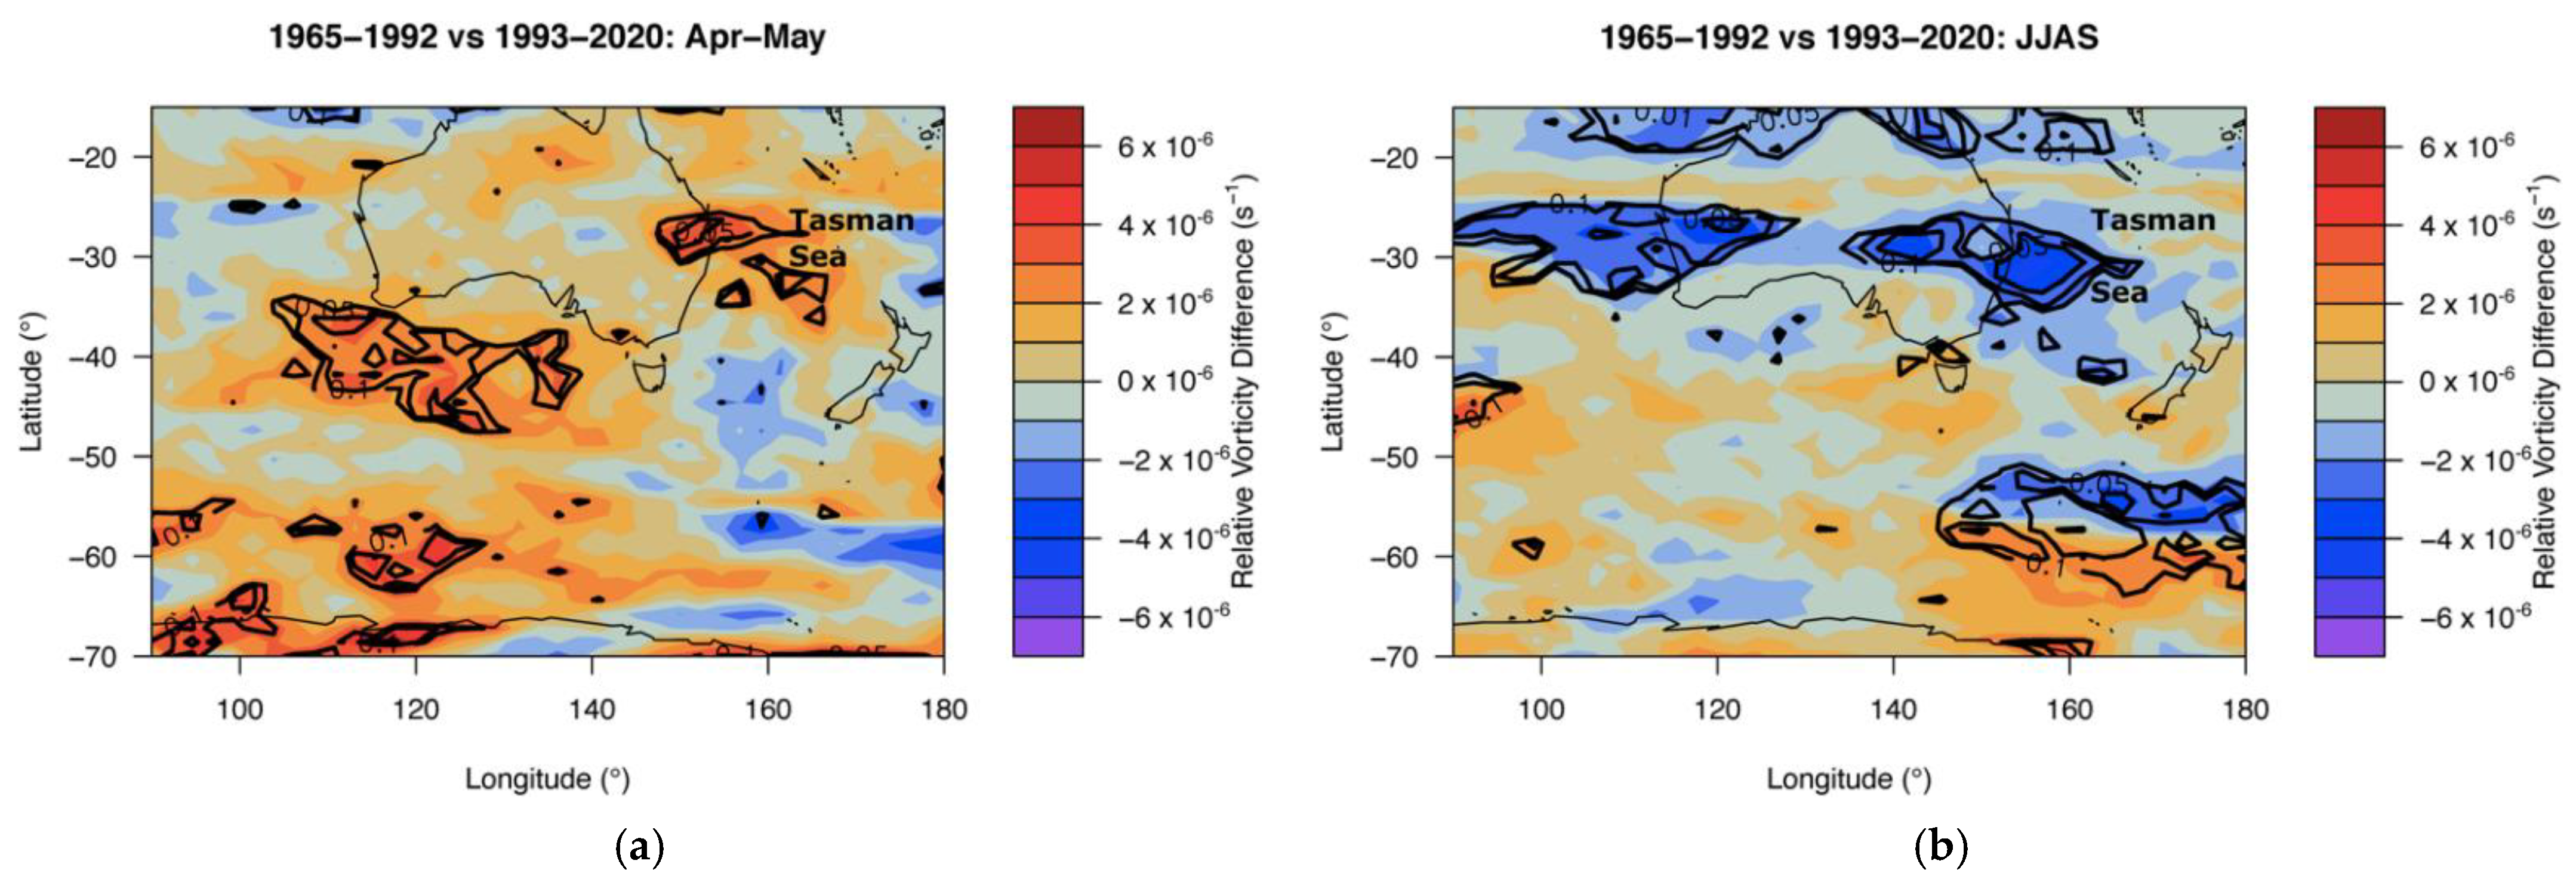
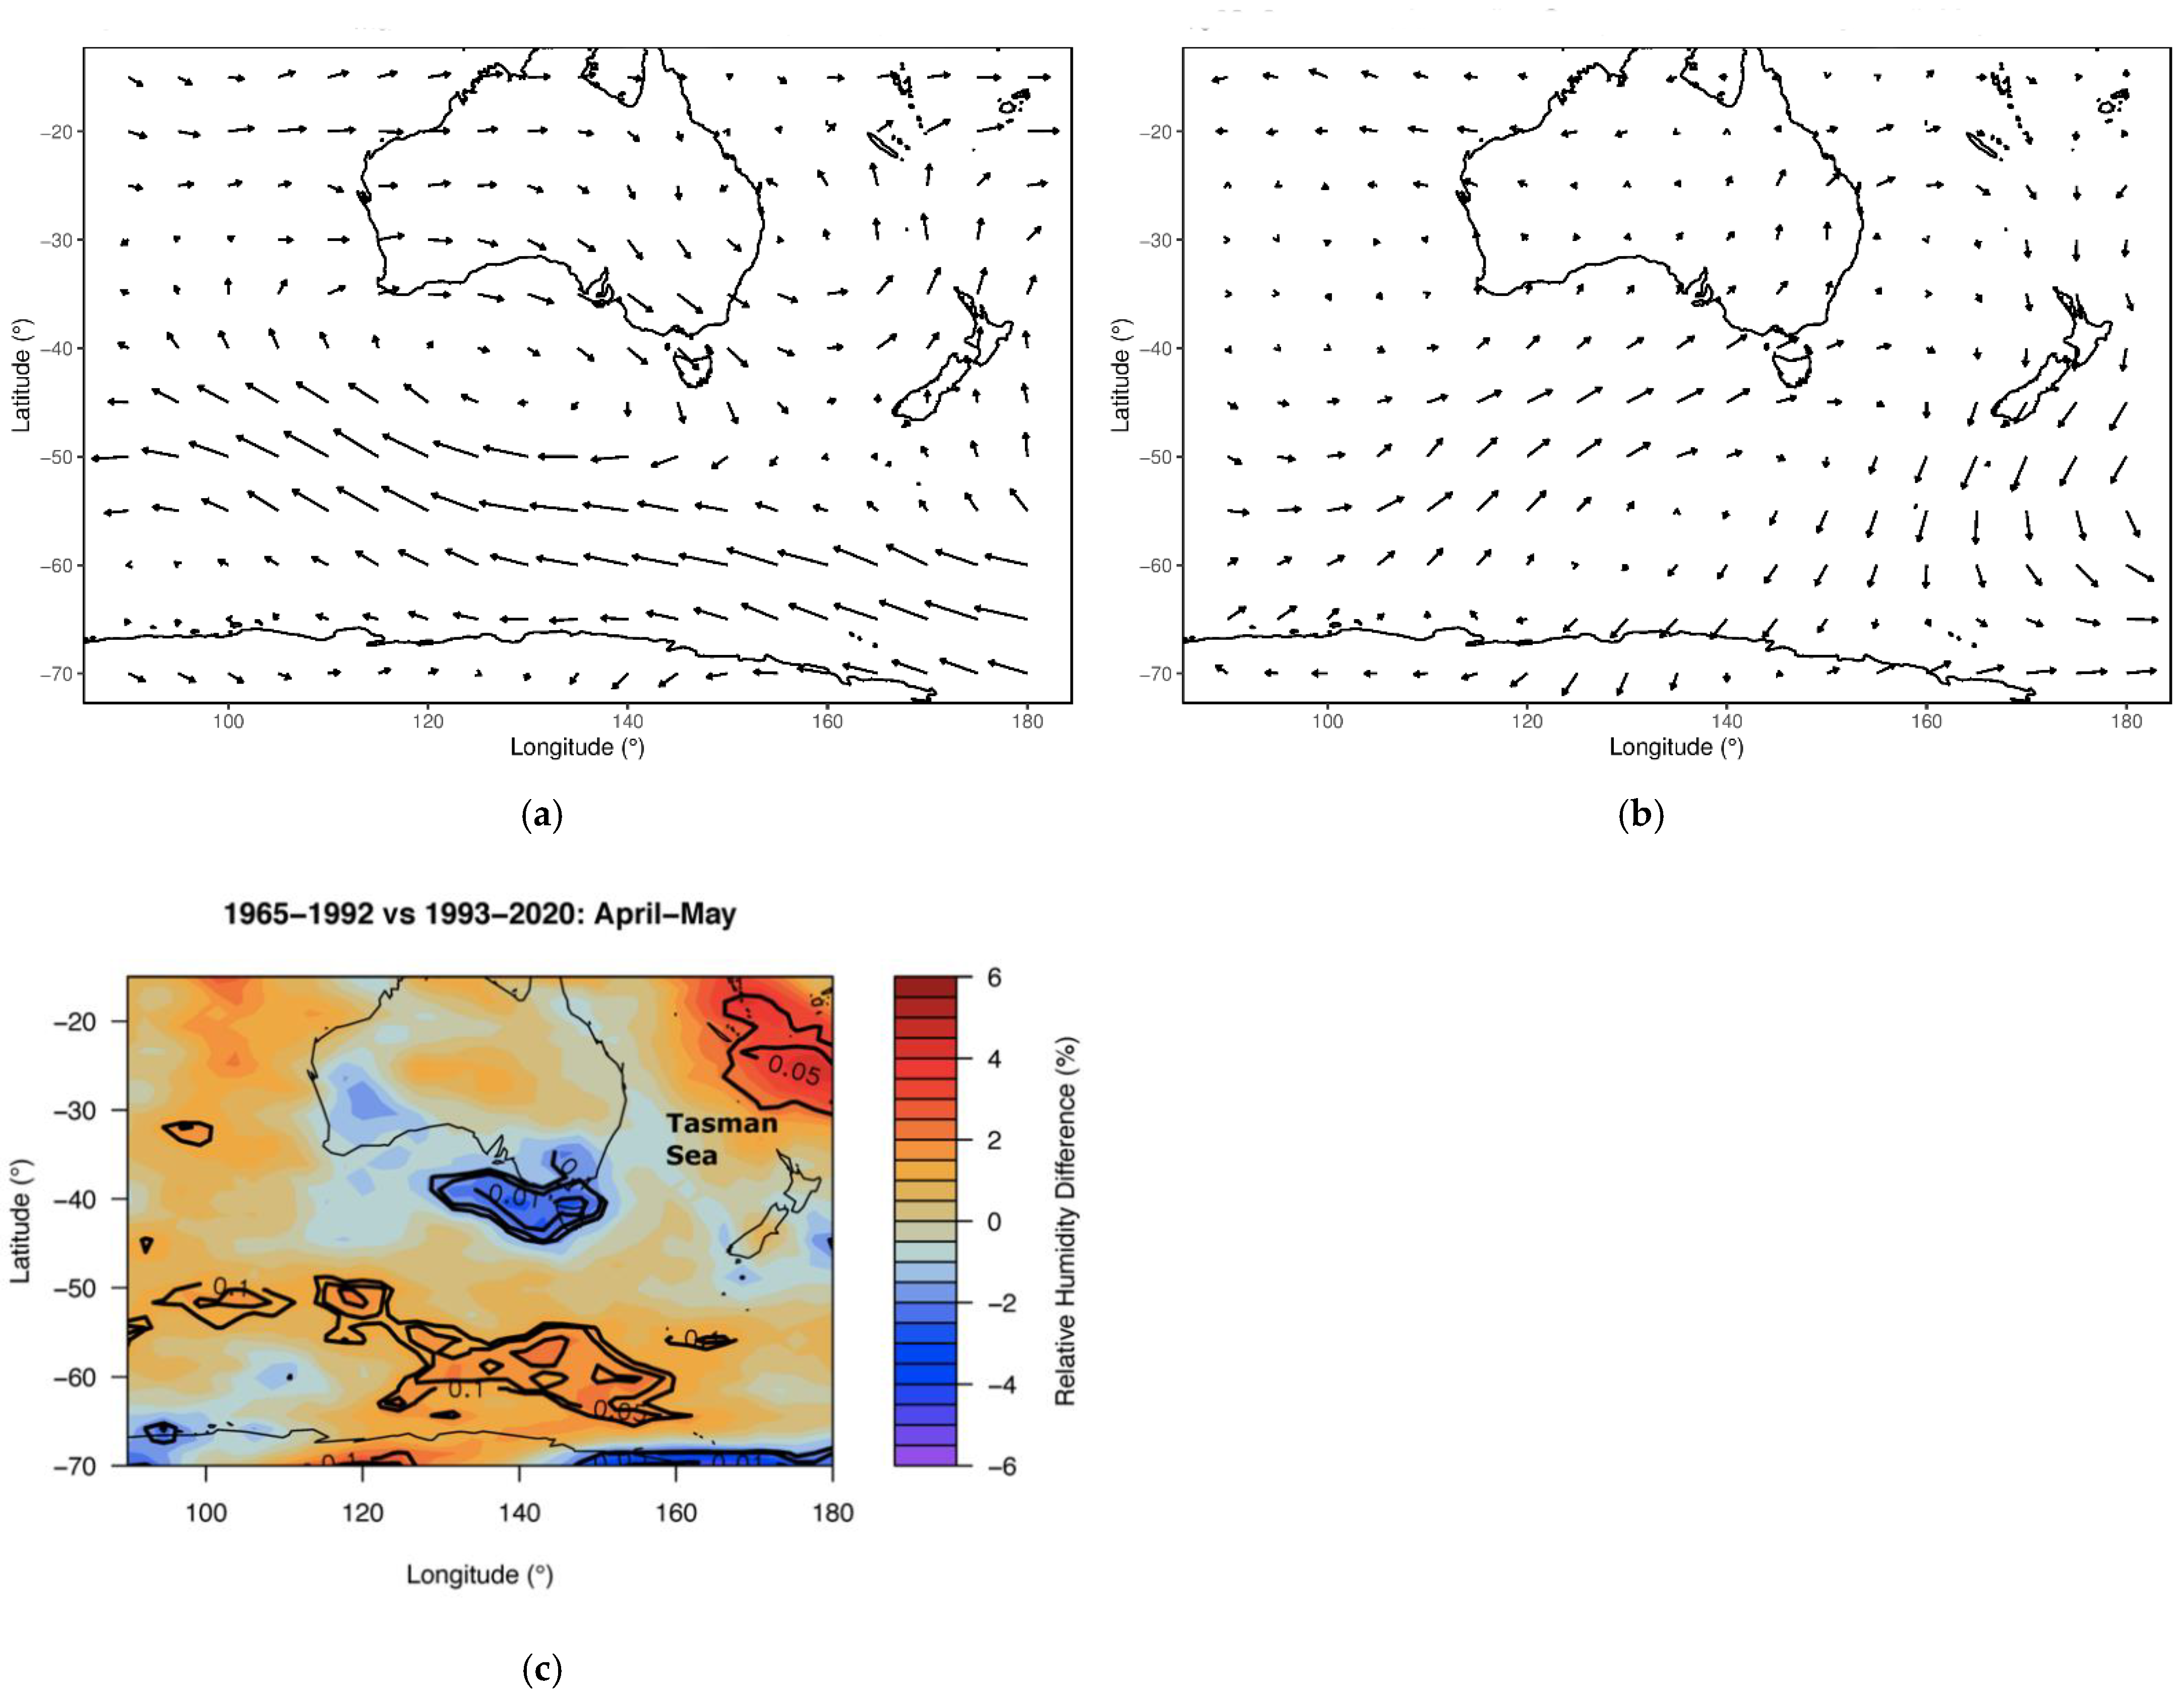
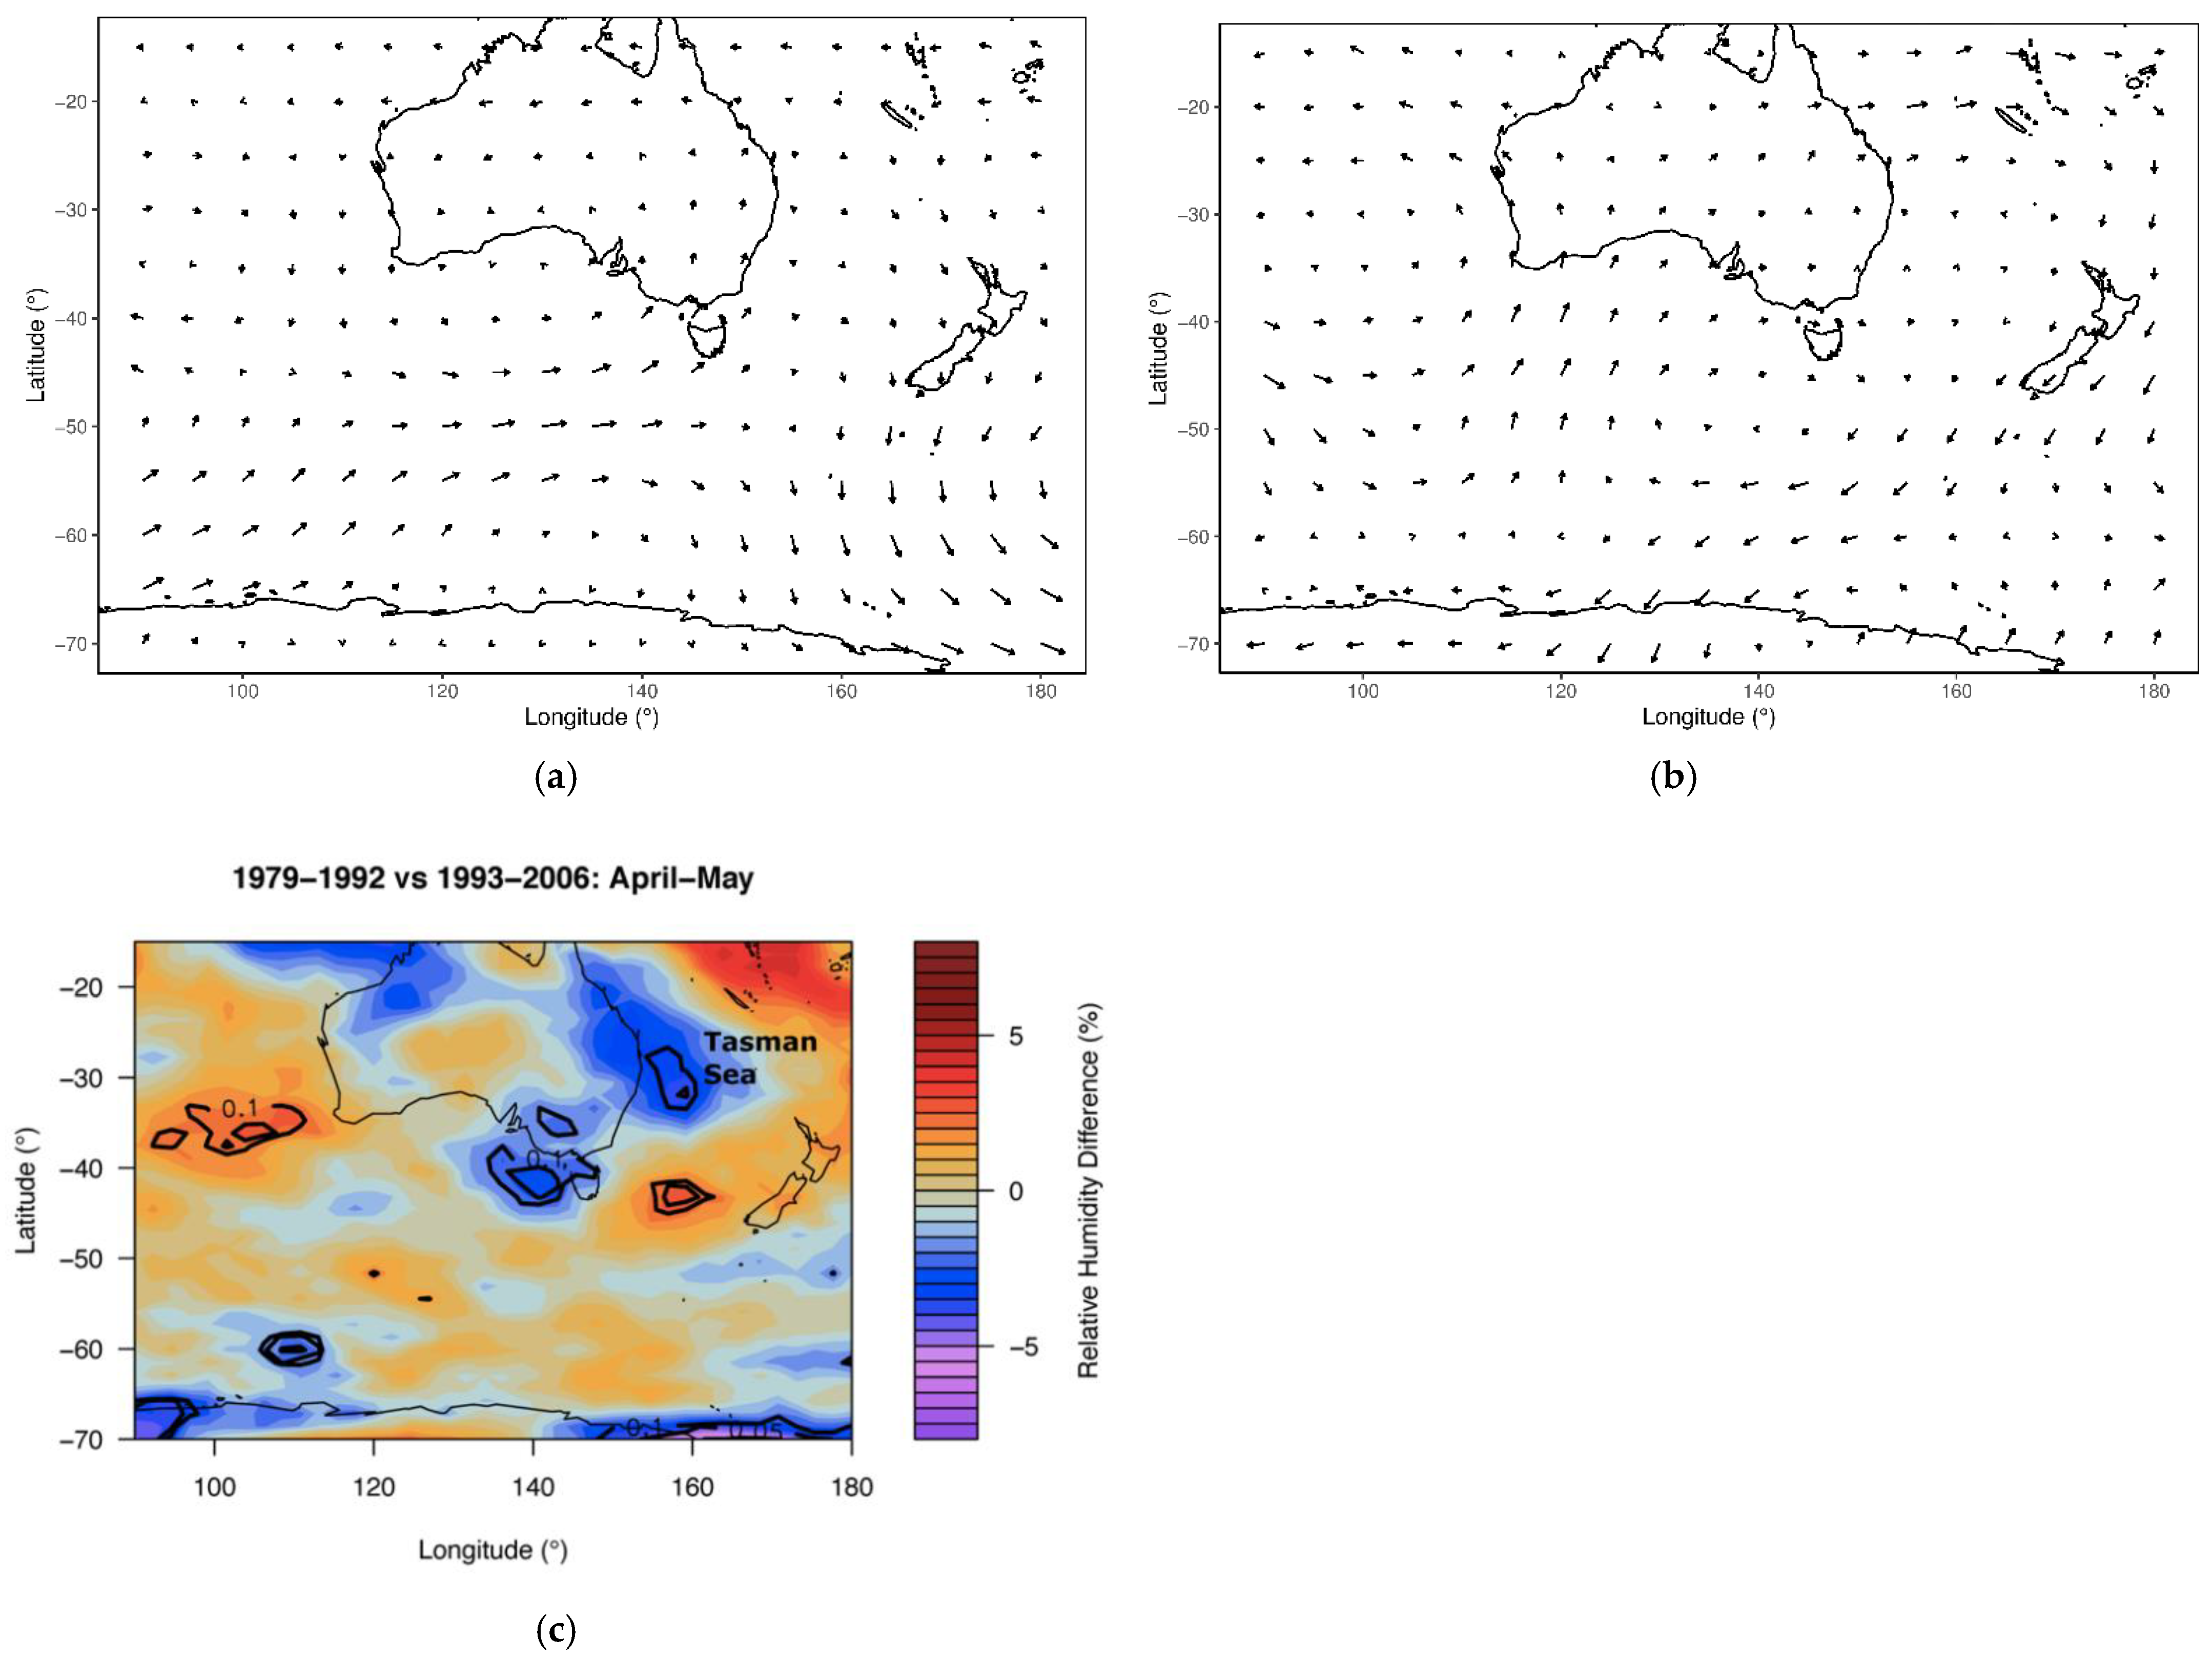
3.2. Implications of Jet Stream Changes April–May

A significant increase in wind speed at the jet stream level south of Western Australia (WA) and associated relative vorticity implies that low-pressure development, and hence rain-producing systems, in the zonal westerlies are concentrated south of WA land areas. However, in southeast Australia near 150° E the significant increase in mean wind speed and relative vorticity over the ocean and adjacent land is counterfactual to the significant decrease in April–May rainfall found in southeast Australia [33], and also confirms a disassociation with the SAM at longitude 150° E, as noted by [42,51]. An investigation of the atmospheric circulation changes for April–May between 1965–1992 and 1993–2020 reveals an anomalous mid-latitude trough extending equatorward at longitudes 150–160° E to an apex between 25–35° S (Figure 4a,b), which explains the significant increase in relative vorticity there (Figure 3a). Importantly, there are significant decreases in relative humidity from 1965–1992 to 1993–2020 over southeast Australia (Figure 4c), due to the anomalous, drier south to southwest winds inland. The significant increase in relative humidity shown in Figure 4c at subtropical latitudes is well east of the Australian continent. In eastern Australia, the circulation changes are consistent with an eastward and southward shift in East Coast Lows (ECLs) from the mid-1990s that affect Australia’s subtropical East Coast [53]. ECLs are weather systems [41] that can cause flooding rain, destructive winds to coastal infrastructure, and soil erosion from storm surges between the latitudes of 25–40° S. Their development is linked to the jet stream changes described earlier [1]. Although the polar branch of the split jet has contracted poleward approximately 5° from the 1990s (Figure 3b; longitudes 140–180° E), it is the mean atmospheric circulation, relative vorticity, and humidity changes that have led to a significant decrease in April–May rainfall over southeast Australia.

3.3. Why Do April–May Relative Humidity Decreases Extend to 25° S in Southwest Australia but to 35° S in Southeast Australia?

Although a significant decrease in April–May precipitation has occurred over inland southeast Australia–south of latitude 25° S, from the mid-1990s between the 28-year periods of 1968–1992 and 1993–2020 [33]–there is an inconsistent increase (although statistically non-significant) in the relative humidity north of 35° S (Figure 4c). Looking at shorter 14-year periods, the likely explanation is that the vector wind anomalies indicate a reversal in direction from a lack of moisture source with the anomalous south to southwest airflow in the period 1993–2006 (Figure 5a) to an anomalous, moister, southeast airflow, resulting in positive relative humidity differences (non-significant) shown in the apex of the anomalous Tasman Sea low-pressure trough in the period 2007–2020 (Figure 5b). Accelerated global warming from the mid-1990s corresponds to the negative relative humidity differences from 1979–1992 to 1993–2006 for most of southeast Australia (Figure 5c).

3.4. Implications of JJAS Jet Stream Changes

At jet stream level, the JJAS wind speed between Australia and New Zealand has increased the PFJ branch significantly along ~ 50° S and significantly decreased the STJ branch over Australia at ~25° S (Figure 2b) in line with GW. This suggests that the PFJ has become more dominant in JJAS relative to the STJ. If the trend continues along with the poleward contraction of the associated band of relative vorticity, then JJAS mid-latitude frontal systems also will continue to contract further poleward in addition to a continued reduction in April-September rainfall over southeast Australia.

3.5. Implications of Jet Stream Changes October–March

In the warmer months, October–March, there is only one climatological jet that is positioned south of the Australian continent [13]. Our results indicate that in the most recent two to three decades, the strength of the warm season PFJ south of Australia has increased significantly, while speeds at 250 hPa have decreased significantly at tropical latitudes (Figure 3c). Rainfall across tropical northern Australia during its wet season (October–March) has increased since the 1970s, with a greater proportion of high intensity short duration rainfall events [21]. Over the subtropical latitudes of eastern Australia, trends in rainfall amount still need to be investigated.

4. Discussion and Conclusions

In this study, it is shown that changes in meteorological components of the SH circulation in the Australian region are related to the locations of STJ and PFJ wind speed maxima before and after the accelerated GW period in the 1990s. Consequently, an important climate change impact is that accelerated GW is contributing to significantly decreased April–May rainfall in southeast Australia. While the remaining cool season (JJAS) rainfall in southeast Australia has not decreased significantly in recent decades [33], a decreasing trend has occurred in JJA rainfall [32]. In the cool season, more subtropical low-pressure systems (or ECLs) affect eastern Australia if the STJ over Australia dominates the PFJ. A strong STJ compared to the PFJ allows more ECLs to form at subtropical eastern Australian latitudes. When the PFJ is stronger than the STJ, which has been the case anomalously since the mid-1970s at Tasman Sea/east Australian longitudes, then cold fronts and associated baroclinicity, for example in the form of ECLs, occur at the more southern latitudes associated with the PFJ [53] and there are fewer cut-off lows over inland southeast Australia [47]. In the transition months of April–May from a single jet to a split jet, the anomalous mid-latitude low-pressure trough since the early 1990s between longitudes 150–160° E, together with the accompanying significant decrease in relative humidity, has been responsible for the significant decrease in April–May rainfall in southeast Australia. A factor in the reduction in MAM rainfall in southeast Australia suggested by [54] has been a poleward shift in the MAM subtropical dry zone. In addition, the role of SST warming in the subtropical South Pacific has been shown to produce subsidence over eastern Australia since the early 1990s [54]. However, our results indicate that changes in jet stream maximum speed and maximum relative vorticity positions since the 1990s have shifted to more eastward and southward locations off the Australian East Coast. This has resulted in ECLs forming further east and south [53], with fewer cut-off low-pressure systems developing over inland southeast Australia [47]. Future research is necessary to investigate the possibility–with continued GW–that the decreased April–May subtropical wind speeds and relative vorticity for April–May at the split jet longitudes of 150°–160° E (which occurred in JJAS) might change the atmospheric circulation by broadening the Hadley circulation. Such broadening might lead to further changes in split jet characteristics or delay the transition to a split jet in April–May until later in the cool season.
Adverse impacts on ecosystem sustainability, agricultural viability, and human liveability will continue as GW continues over inland southeast and southwest Australia in the cool season. Increases in warm season rainfall expanding poleward into subtropical Australia, as noted by [21], are dependent on long-term trends in short duration, heavy rainfall events, which are, by definition, isolated in space and time. This trend merits further investigation because the impacts can be catastrophic due to the associated flooding and coastal erosion [41,53,55]. The main impact on warm season subtropical latitude rainfall in southeast Australia thus far is consistent with the expansion of the Hadley cell and therefore of the subtropical dry zone [56,57].

Author Contributions

M.S.S. conceived the study with assistance from L.M.L.; M.S.S. wrote the first draft; J.H. performed the analysis, produced the figures, and reviewed a draft version of the manuscript; M.S.S. and L.M.L. produced the final manuscript after reviews by all authors. All authors have read and agreed to the published version of the manuscript.

Funding

This study was supported by the School of Mathematical and Physical Sciences, University of Technology Sydney, which provided requisite access to computer facilities and office space. J.H. received support from the Australian Government Research Training Program Scholarship. No additional external funding was provided for this research.

Institutional Review Board Statement

Not applicable.

Informed Consent Statement

Not applicable.

Data Availability Statement

All ERA5 data used in the study are available online at: https://cds.climate.copernicus.eu/#!/home (accessed on 10 September 2021).

Acknowledgments

The authors acknowledge the University of Technology Sydney for supporting this research. J.H. acknowledges support from the Australian Government Research Training Program Scholarship.

Conflicts of Interest

The authors declare no competing interests.

Code Availability

The code to produce the ERA5 climatologies and permutation testing for statistical significance was performed in MATLAB and R by J.H. Additional code to group months was written and is available from J.H.

References

  1. Holton, J.R. An Introduction to Dynamic Meteorology, 4th ed.; Elsevier Science & Technology: London, UK, 2004. [Google Scholar]
  2. Yin, J.H.A. Consistent poleward shift of the storm tracks in simulations of 21st century climate. Geophys. Res. Lett. 2005, 32, L18701. [Google Scholar] [CrossRef] [Green Version]
  3. Lorenz, D.J.; DeWeaver, E.T. Tropopause height and zonal wind response to global warming in the IPCC scenario integrations. J. Geophys. Res. 2007, 112, D10119. [Google Scholar] [CrossRef] [Green Version]
  4. IPCC. Climate Change 2021: The Physical Science Basis. Contribution of Working Group I to the Sixth Assessment Report of the Intergovernmental Panel on Climate Change; Masson-Delmotte, V., Zhai, P., Pirani, A., Connors, S.L., Péan, C., Berger, S., Caud, N., Chen, Y., Goldfarb, L., Gomis, M.I., et al., Eds.; Cambridge University Press: Cambridge, UK, 2021. [Google Scholar]
  5. Taljaard, J.J. Synoptic meteorology of the Southern Hemisphere. Meteorology of the Southern Hemisphere. Meteorol. Monogr. 1972, 35, 139–211. [Google Scholar]
  6. van Loon, H. Temperature in the Southern Hemisphere. Meteorology of the Southern Hemisphere. Meteorol. Monogr. 1972, 35, 9–22. [Google Scholar]
  7. van Loon, H. Pressure in the Southern Hemisphere. Meteorology of the Southern Hemisphere. Meteorol. Monogr. 1972, 35, 59–86. [Google Scholar]
  8. van Loon, H. Wind in the Southern Hemisphere. Meteorology of the Southern Hemisphere. Meteorol. Monogr. 1972, 35, 87–99. [Google Scholar]
  9. Hurrell, J.W.; van Loon, H.; Shea, D.J. The mean state of the troposphere. Meteorology of the Southern Hemisphere. Meteorol. Monogr. 1998, 49, 1–410. [Google Scholar] [CrossRef]
  10. van Heerden, J.; Taljaard, J.J. Africa and surrounding waters. Meteorology of the Southern Hemisphere. Meteorol. Monogr. 1998, 49, 141–174. [Google Scholar]
  11. Vincent, D.G.; Silva Dias, P.L. Pacific Ocean. Meteorology of the Southern Hemisphere. Meteorol. Monogr. 1998, 49, 101–117. [Google Scholar]
  12. Bals-Elsholz, T.; Atallah, E.H.; Bosart, L.F.; Wasula, T.A.; Cempa, M.J.; Lupo, A.R. The wintertime Southern Hemisphere split jet: Structure, variability, and evolution. Int. J. Climatol. 2001, 14, 4191–4215. [Google Scholar] [CrossRef] [Green Version]
  13. Gallego, D.; Ribera, P.; Garcia-Herrera, R.; Hernandez, E.; Gimeno, L. A new look for the Southern Hemisphere jet stream. Clim. Dyn. 2005, 24, 607–621. [Google Scholar] [CrossRef]
  14. Dee, D.P.; Uppala, S.M.; Simmons, A.J.; Berrisford, P.; Poli, P.; Kobayashi, S.; Andrae, U.; Balmaseda, M.A.; Balsamo, G.; Bauer, P.; et al. The ERA-Interim reanalysis: Configuration and performance of the data assimilation system. Q. J. R. Met. Soc. 2011, 137, 553–597. [Google Scholar] [CrossRef]
  15. Zolotov, S.Y.; Ippolitov, I.I.; Loginov, S.V.; Kharyutkina, E.V. Variability of the Southern Hemisphere Subtropical Jet Stream in the Second Half of the 20th Century and Early 21st Century. Izvestiya. Atmos. Ocean. Phys. 2018, 54, 430–438. [Google Scholar] [CrossRef]
  16. Kalnay, E.; Kanamitsu, M.; Kistler, R.; Collins, W.; Deaven, D.; Gandin, L.; Iredell, M.; Saha, S.; White, G.; Woollen, J.; et al. The NCEP/NCAR 40-year reanalysis project. Bull. Am. Meteor. Soc. 1996, 77, 437–471. [Google Scholar] [CrossRef] [Green Version]
  17. Lu, J.; Chen, G.; Frierson, D.M.W. Response of the zonal mean atmospheric circulation to El Niño versus global warming. J. Clim. 2008, 21, 5835–5851. [Google Scholar] [CrossRef] [Green Version]
  18. Varotsos, C.A. The global signature of the ENSO and SST-like fields. Theor. Appl. Climatol. 2013, 113, 197–204. [Google Scholar] [CrossRef]
  19. Morice, C.P.; Kennedy, J.J.; Rayner, N.A.; Jones, P.D. Quantifying uncertainties in global and regional temperature change using an ensemble of observational estimates: The HadCRUT4 dataset. J. Geophys. Res. 2012, 17, D0801. [Google Scholar] [CrossRef]
  20. NOAA. National Centers for Environmental Information, State of the Climate: Global Climate Report for 2019. Published online January 2020. Available online: https://www.ncdc.noaa.gov/sotc/global/201913/supplemental/page-3 (accessed on 12 October 2021).
  21. Australian Bureau of Meteorology and CSIRO. State of the Climate 2020. 2020. Available online: https://bom.gov.au/state-of-the-climate/ (accessed on 6 January 2022).
  22. Bagnell, A.; DeVries, T. 20th century cooling of the deep ocean contributed to delayed acceleration of Earth’s energy imbalance. Nat. Commun. 2021, 12, 4604. [Google Scholar] [CrossRef]
  23. Campos, E.J.D.; van Caspel, M.C.; Zenk, W.; Morozov, E.G.; Frey, D.I.; Piola, A.R.; Meinen, C.S.; Sato, O.T.; Perez, R.C.; Dong, S. Warming trend in Antarctic Bottom Water in the Vema Channel in the South Atlantic. Geophys. Res. Lett. 2021, 48, e2021GL094709. [Google Scholar] [CrossRef]
  24. Barnes, E.A.; Barnes, N.W.; Polvani, L.M. Delayed Southern Hemisphere climate change induced by stratospheric ozone recovery, as projected by the CMIP5 models. J. Clim. 2014, 27, 852–867. [Google Scholar] [CrossRef] [Green Version]
  25. Gerber, E.P.; Son, S.-W. Quantifying the Summertime Response of the Austral Jet Stream and Hadley Cell to Stratospheric Ozone and Greenhouse Gases. J. Clim. 2014, 27, 5538–5559. [Google Scholar] [CrossRef]
  26. Gillett, N.P.; Thompson, D.W.J. Simulation of recent Southern Hemisphere climate change. Science 2003, 302, 273–275. [Google Scholar] [CrossRef] [PubMed] [Green Version]
  27. Arblaster, J.M.; Meehl, G.A. Contributions of external forcings to southern annular mode trends. J. Clim. 2006, 19, 2896–2905. [Google Scholar] [CrossRef]
  28. Perlwitz, J.; Pawson, S.; Fogt, R.L.; Nielsen, J.E.; Neff, W.D. The impact of stratospheric ozone hole recovery on Antarctic climate. Geophys. Res. Lett. 2008, 35, L08714. [Google Scholar] [CrossRef] [Green Version]
  29. Polvani, L.M.; Waugh, D.W.; Correa, G.J.P.; Son, S.-W. Stratospheric ozone depletion: The main driver of twentieth-century atmospheric circulation changes in the Southern Hemisphere. J. Clim. 2011, 24, 795–812. [Google Scholar] [CrossRef]
  30. McLandress, C.; Shepherd, T.G.; Scinocca, J.F.; Plummer, D.A.; Sigmond, M.; Jonsson, A.I.; Reader, M.C. Separating the dynamical effects of climate change and ozone depletion. Part II: Southern Hemisphere troposphere. J. Clim. 2011, 24, 1850–1868. [Google Scholar] [CrossRef] [Green Version]
  31. Butler, A.H.; Thompson, D.W.J.; Heikes, R. The steadystate atmospheric circulation response to climate change–like thermal forcings in a simple general circulation model. J. Clim. 2010, 23, 3474–3496. [Google Scholar] [CrossRef]
  32. Murphy, B.F.; Timbal, B. A review of recent climate variability and climate change in southeastern Australia. Int. J. Climatol. 2008, 28, 859–879. [Google Scholar] [CrossRef]
  33. Speer, M.S.; Hartigan, J.; Leslie, L.M.; MacNamara, S. From the 1990s climate change has decreased cool season catchment precipitation reducing river heights in Australia’s southern Murray-Darling Basin. Sci. Rep. 2021, 11, 16136. [Google Scholar] [CrossRef]
  34. Ren, D.; Dickinson, R.E.; Fu, R.; Bornman, J.F.; Guo, W.; Song, Y.; Leslie, L.M. The impacts of climate warming on maximum aviation payloads. Clim. Dyn. 2019, 52, 1711–1721. [Google Scholar] [CrossRef] [Green Version]
  35. Ren, D.; Leslie, L.M. Impacts of climate warming on aviation fuel consumption. J. Appl. Meteorol. Clim. 2019, 58, 1593–1602. [Google Scholar] [CrossRef]
  36. Rikus, L. A simple climatology of westerly jet streams in global reanalysis datasets part 1: Mid-latitude upper tropospheric jets. Clim. Dyn. 2015, 50, 2285–2310. [Google Scholar] [CrossRef]
  37. Bell, B.; Hersbach, H.; Simmons, A.; Berrisford, P.; Dahlgren, P.; Horányi, A.; Muñoz-Sabater, J.; Nicolas, J.; Radu, R.; Schepers, D.; et al. The ERA5 global reanalysis: Preliminary extension to 1950. Q. J. R. Met. Soc. 2021, 147, 4186–4227. [Google Scholar] [CrossRef]
  38. Varotsos, C.A.; Franzke, C.L.E.; Efstathiou, M.N.; Degermendzhi, A.G. Evidence for two abrupt warming events of SST in the last century. Theor. Appl. Climatol. 2014, 116, 51–60. [Google Scholar] [CrossRef] [Green Version]
  39. Holland, G.J.; Lynch, A.H.; Leslie, L.M. Australian east-coast cyclones. Part I: Synoptic overview and case study. Mon. Wea. Rev. 1987, 115, 3024–3036. [Google Scholar] [CrossRef] [Green Version]
  40. Speer, M.S.; Wiles, P.; Pepler, A. Low pressure systems off the New South Wales coast and associated hazardous weather: Establishment of a database. Aust. Meteor. Ocean. J. 2009, 58, 29–39. [Google Scholar] [CrossRef]
  41. Dowdy, A.J.; Pepler, A.; Di Luca, A.; Cavicchia, L.; Mills, G.; Evans, J.P.; Louis, S.; McInnes, K.L.; Walsh, K. Review of Australian east coast low pressure systems and associated extremes. Clim. Dyn. 2019, 53, 4887–4910. [Google Scholar] [CrossRef]
  42. Kidston, J.; Renwick, J.A.; McGregor, J. Hemispheric-Scale Seasonality of the Southern Annular Mode and Impacts on the Climate of New Zealand. J. Clim. 2009, 22, 4759–4770. [Google Scholar] [CrossRef] [Green Version]
  43. Pook, M.; McIntosh, P.; Meyers, G. The synoptic decomposition of cool-season rainfall in the southeastern Australian cropping region. J. Appl. Meteorol. Climatol. 2006, 45, 1156–1170. [Google Scholar] [CrossRef]
  44. Risbey, J.; Pook, M.; McIntosh, P.; Wheeler, M.; Hendon, H. On the remote drivers of rainfall variability in Australia. Mon. Weather Rev. 2009, 137, 3233–3253. [Google Scholar] [CrossRef]
  45. Pinheiro, H.R.; Hodges, K.I.; Gan, M.A.; Ferreira, S.H.S.; Andrade, K.M. Contributions of downstream baroclinic development to strong Southern Hemisphere cut-off lows. Q. J. R. Met. Soc. 2021, 148, 214–232. [Google Scholar] [CrossRef]
  46. Pook, M.; Gibson, T. Atmospheric blocking and storm tracks during SOP-1 of the FROST project. Aust. Met. Mag. 1999, 48, 51–60. [Google Scholar]
  47. Risbey, J.S.; McIntosh, P.C.; Pook, M.J. Synoptic components of rainfall variability and trends in southeast Australia. Int. J. Climatol. 2013, 33, 2459–2472. [Google Scholar] [CrossRef]
  48. Rogers, J.C.; van Loon, H. Spatial variability of sea level pressure and 500 mb height anomalies over the Southern Hemisphere. Mon. Weather Rev. 1982, 110, 1375–1392. [Google Scholar] [CrossRef] [Green Version]
  49. Thompson, D.W.J.; Wallace, J.M. Annular modes in the extratropical circulation. Part I: Month-to-month variability. J. Clim. 2000, 13, 1000–1016. [Google Scholar] [CrossRef]
  50. Carlson, T.N. Mid-Latitude Weather Systems; HarperCollins Academic: London, UK, 1991; ISBN 0 04 551115 2. [Google Scholar]
  51. Codron, F. Relations between Annular Modes and the Mean State: Southern Hemisphere Winter. J. Atmos. Sci. 2007, 64, 328–3339. [Google Scholar] [CrossRef]
  52. Cai, W.; Cowan, T. Southeast Australia Autumn Rainfall Reduction: A Climate-Change-Induced Poleward Shift of Ocean–Atmosphere Circulation. J. Clim. 2013, 26, 189–205. [Google Scholar] [CrossRef]
  53. Speer, M.; Leslie, L.; Hartigan, J.; MacNamara, S. Changes in Frequency and Location of East Coast Low Pressure Systems Affecting Southeast Australia. Climate 2021, 9, 44. [Google Scholar] [CrossRef]
  54. Lin, Z.; Li, Y.; Liu, Y.; Hu, A. The Decadal Reduction of Southeastern Australian Autumn Rainfall since the early 1990s: A Response to Sea Surface Temperature Warming in the Subtropical South Pacific. J. Clim. 2020, 33, 2249–2261. [Google Scholar] [CrossRef]
  55. McInnes, K.L.; Walsh, K.J.E.; Hubbert, G.D.; Beer, T. Impacts of sea-level rise and storm surges on a coastal community. Nat. Hazards 2003, 30, 187–207. [Google Scholar] [CrossRef]
  56. Cai, W.; Cowan, T.; Thatcher, M. Rainfall reductions over Southern Hemisphere semi-arid regions: The role of subtropical dry zone expansion. Sci. Rep. 2012, 2, 702. [Google Scholar] [CrossRef] [PubMed] [Green Version]
  57. Post, D.A.; Timbal, B.; Chiew, F.H.S.; Hendon, H.H.; Nguyen, H.; Moran, R. Decrease in southeastern Australian water availability linked to ongoing Hadley cell expansion. Earth’s Future 2014, 2, 231–238. [Google Scholar] [CrossRef]
Figure 1. ERA5 zonal wind (u) speed climatologies 1965–2020 at 250 hPa in the Australian region. (a) Annual, (b) April–May, (c) JJAS, and (d) October–March. Note the dominant split jet annually in (a,b) in April–May, and (c) in June–September.
Climate 10 00084 g001
Figure 2. Significant u-component wind speed differences representing jet stream level. Significant u-component wind speed differences between the period 1965–1992 and 1993–2020 at 250 hPa representing jet stream level for, (a) April-May, (b) JJAS, (c) October-March. Note the significant increase centred at ~25–30° S, 150° E representing the approximate STJ latitude in April–May (a) in contrast to decreases in the same area for JJAS (b). Also note the significant increases at latitudes representing the PFJ in all three monthly groupings throughout the year. Black lines show contours of statistical significance for α = 0.1, 0.05 and 0.01.
Climate 10 00084 g002
Figure 3. Relative vorticity changes Australian region in recent decades. Relative vorticity changes at 500 hPa between the periods 1965–1992 and 1993–2020 from ERA5 re-analysis data for, (a)April–May, (b) JJAS. Positive areas (orange) indicate increased relative vorticity and negative areas (blue) indicate decreased relative vorticity. Black lines show contours of statistical significance for α = 0.1, 0.05 and 0.01. Note the significant increases (orange) south of WA and between 25–35° S over eastern Australia/Tasman Sea longitudes for April–May and decreases for JJAS between 25–35° S and at 55° S.
Climate 10 00084 g003
Figure 4. ERA5 vector wind anomalies and relative humidity changes. April–May vector wind anomalies (m s−1) at 500 hPa (relative to the 1980–2010 climatology) for the period (a) 1965–1992, (b) 1993–2020, and (c) April–May relative humidity changes (%) between 1965–1992 and 1993–2020. Note the change at longitudes 140–160° E, 25–30° S in (a) from anticyclonic anomalies to cyclonic anomalies in (b), and significant decrease in relative humidity over southeast Australia in (c), where black lines show contours of statistical significance for α = 0.1, 0.05 and 0.01.
Climate 10 00084 g004
Figure 5. ERA5 vector wind anomalies and relative humidity changes (14-year intervals). April–May vector wind anomalies (m s−1) at 500 hPa (relative to the 1980–2010 climatology) for the period (a) 1979–1992, (b) 1993–2006, and (c) April–May relative humidity changes (%) between 1979–1992 and 1993–2006. Note the change at longitudes 150–160° E, 25–30° S in (a) from south to southwest vector wind anomalies to southeast anomalies near the apex of the low-pressure trough in (b), and significant decrease in relative humidity over southeast Australia in (c), where black lines show contours of statistical significance for α = 0.1, 0.05 and 0.01.
Climate 10 00084 g005
Publisher’s Note: MDPI stays neutral with regard to jurisdictional claims in published maps and institutional affiliations.

