Figure 1.
System architecture of the proposed mental health disorder model. The processes involved include EEG data collection, data cleaning and preprocessing, data splitting, model building, model evaluation, and model prediction interpretability.
Figure 1.
System architecture of the proposed mental health disorder model. The processes involved include EEG data collection, data cleaning and preprocessing, data splitting, model building, model evaluation, and model prediction interpretability.
Figure 2.
Heatmap of IQ and education visualization to check for missing values. This visualization shows that there are missing values. The blue vertical lines indicate the presence of missing data. The dark color represents the concentration of the missing data in specific columns.
Figure 2.
Heatmap of IQ and education visualization to check for missing values. This visualization shows that there are missing values. The blue vertical lines indicate the presence of missing data. The dark color represents the concentration of the missing data in specific columns.
Figure 3.
Heatmap of IQ and education after applying the kNN imputation method. This visualization demonstrates the effectiveness of the kNN imputation method in handling missing data, as indicated by the consistent and uniform values across the matrix.
Figure 3.
Heatmap of IQ and education after applying the kNN imputation method. This visualization demonstrates the effectiveness of the kNN imputation method in handling missing data, as indicated by the consistent and uniform values across the matrix.
Figure 4.
Distribution of (a) main and (b) specific disorder counts after applying the SMOTE technique to address class imbalance. The visualization shows that the SMOTE technique effectively balances the counts across different disorder categories, ensuring a more uniform representation.
Figure 4.
Distribution of (a) main and (b) specific disorder counts after applying the SMOTE technique to address class imbalance. The visualization shows that the SMOTE technique effectively balances the counts across different disorder categories, ensuring a more uniform representation.
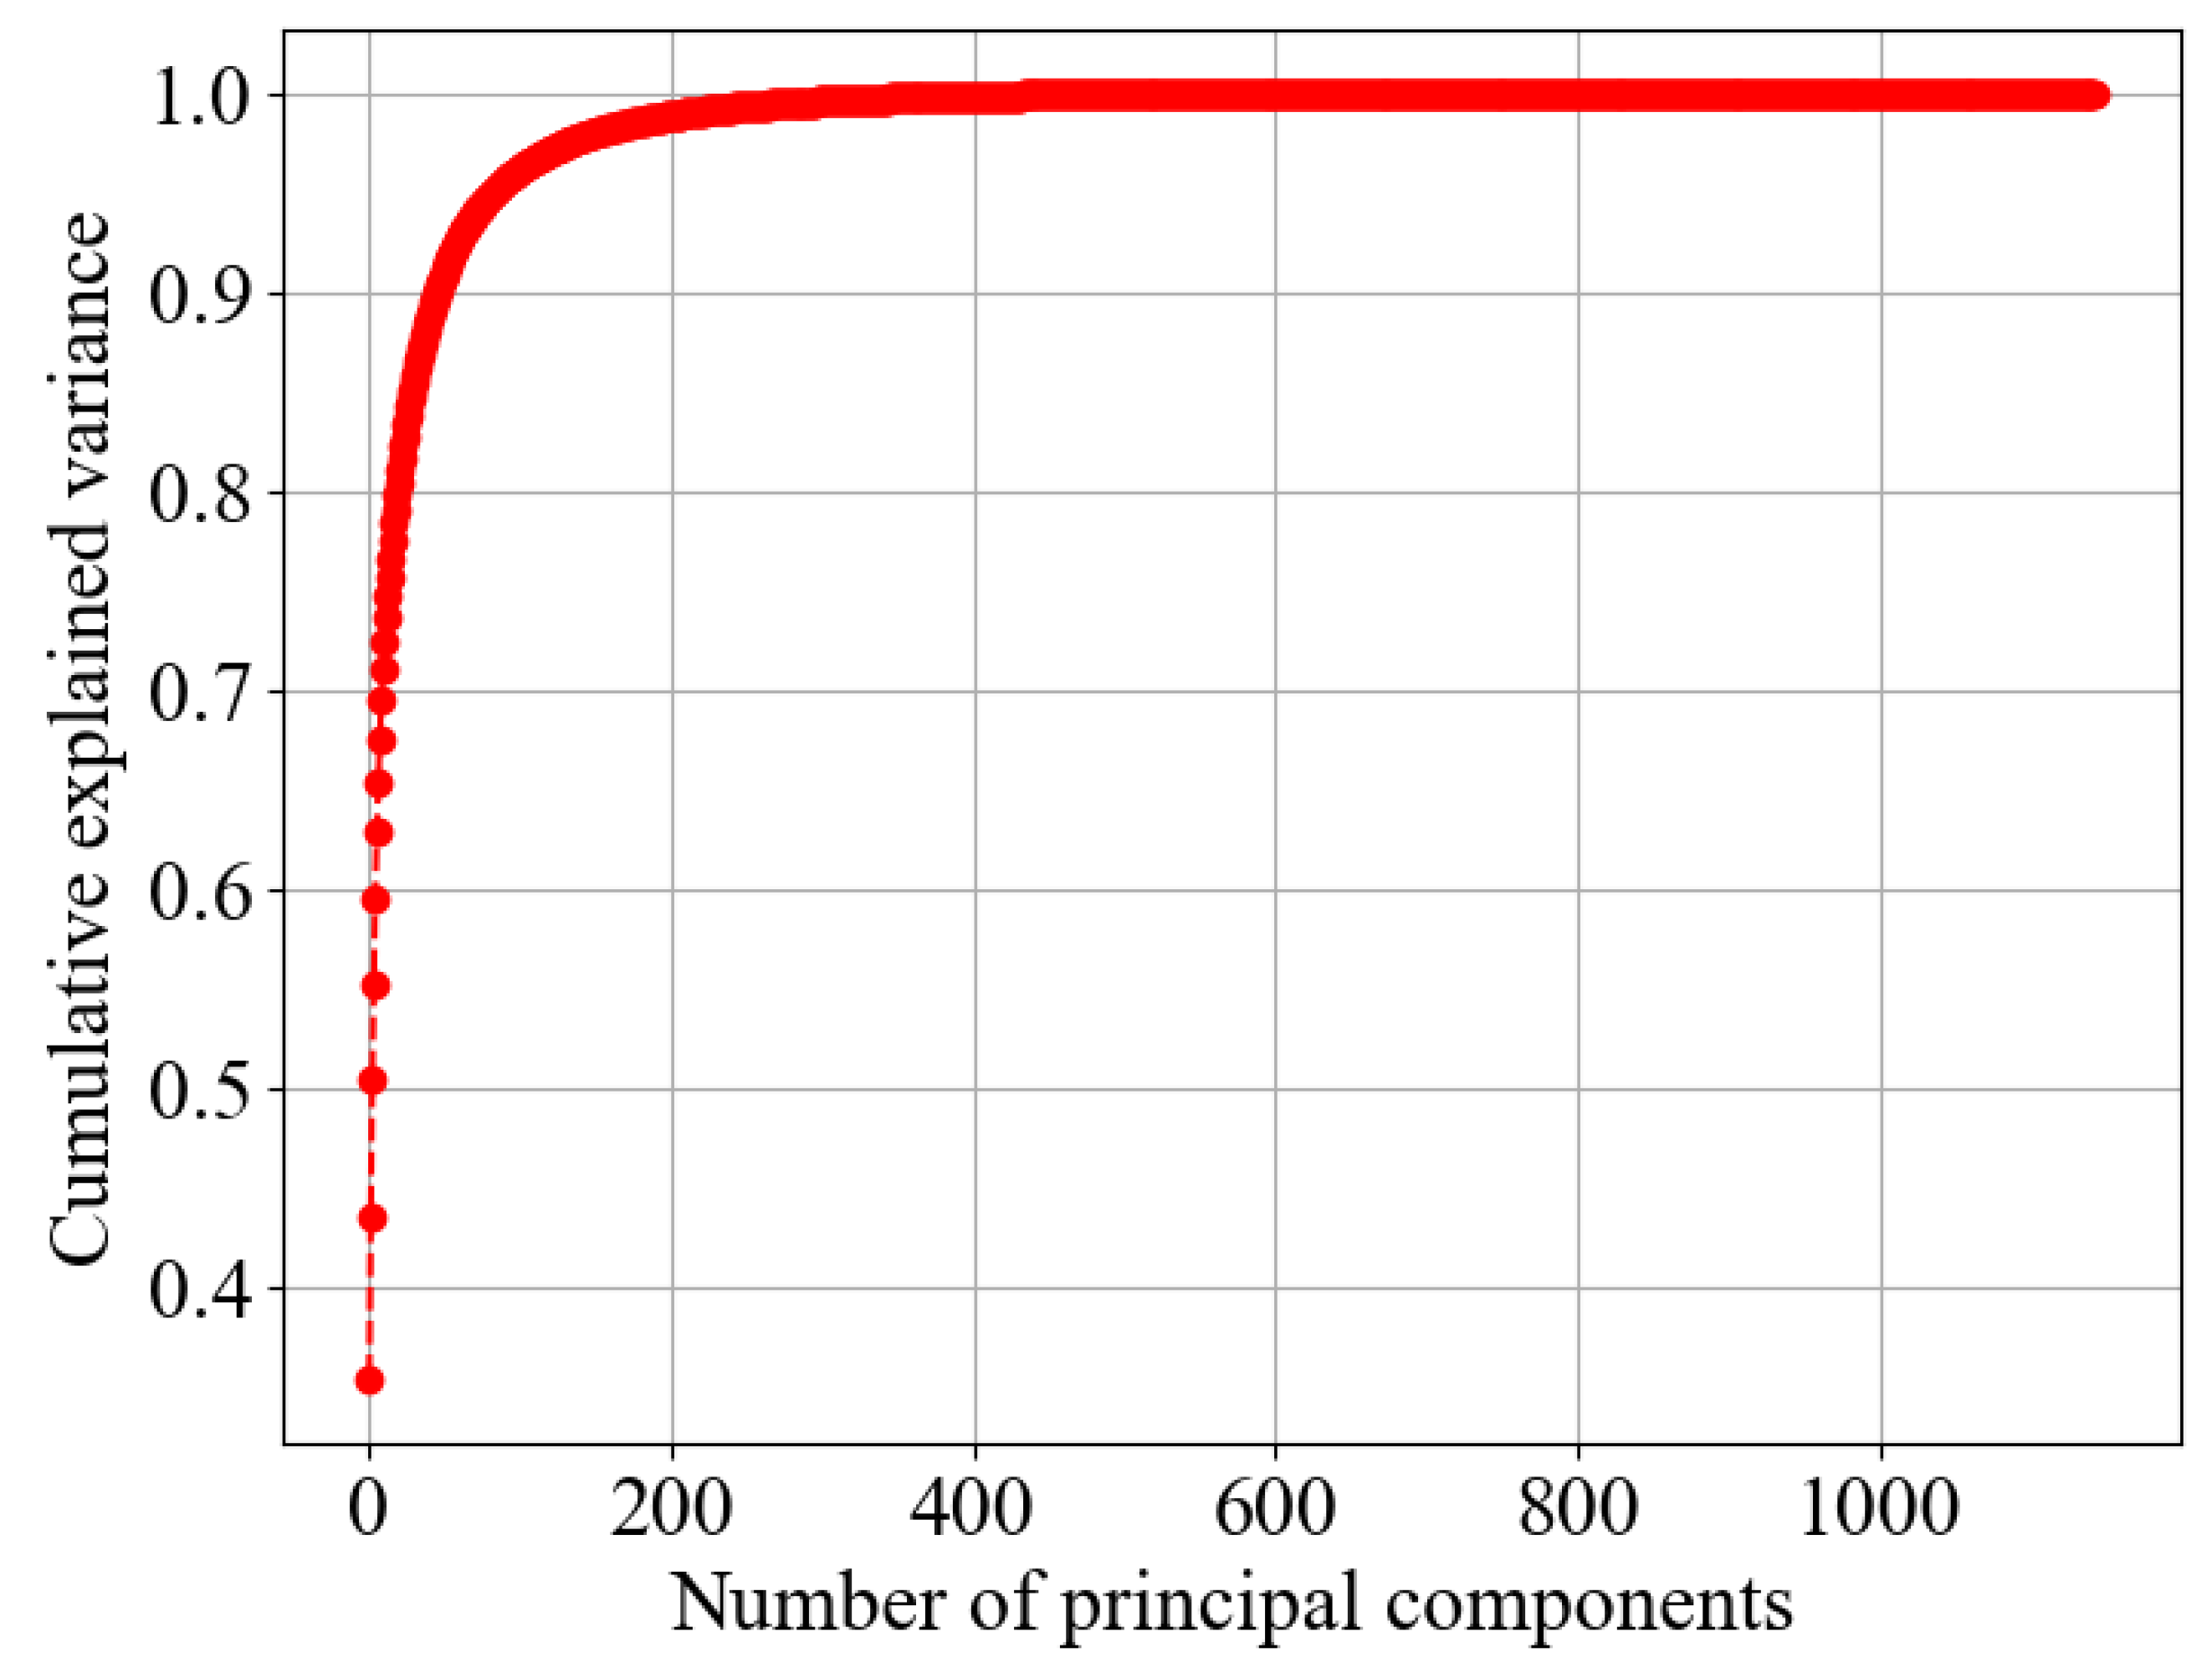
Figure 5.
The x-axis represents the number of principal components, while the y-axis represents the cumulative explained variance, which shows the proportion of the dataset’s total variance captured by the principal components. A higher cumulative explained variance means that the principal components effectively summarize the original data.
Figure 6.
Architecture of the proposed CNN–BiLSTM model. The input data have a shape of (None, 202, 1). The model utilizes a 1D convolutional layer with 32 filters and a kernel size of 3, followed by max pooling, which downsamples the output to (None, 66, 32). The BiLSTM layer with 32 units in each direction processes the pooled features, outputting a shape of (None, 66, 64). This is then flattened to (None, 4224) and passed through a dense layer with L2 regularization (rate 0.001), a batch normalization layer, another dense layer, and a dropout layer (rate 0.2). The final prediction layer outputs probabilities for the six main disorder classes (shape: None, 6).
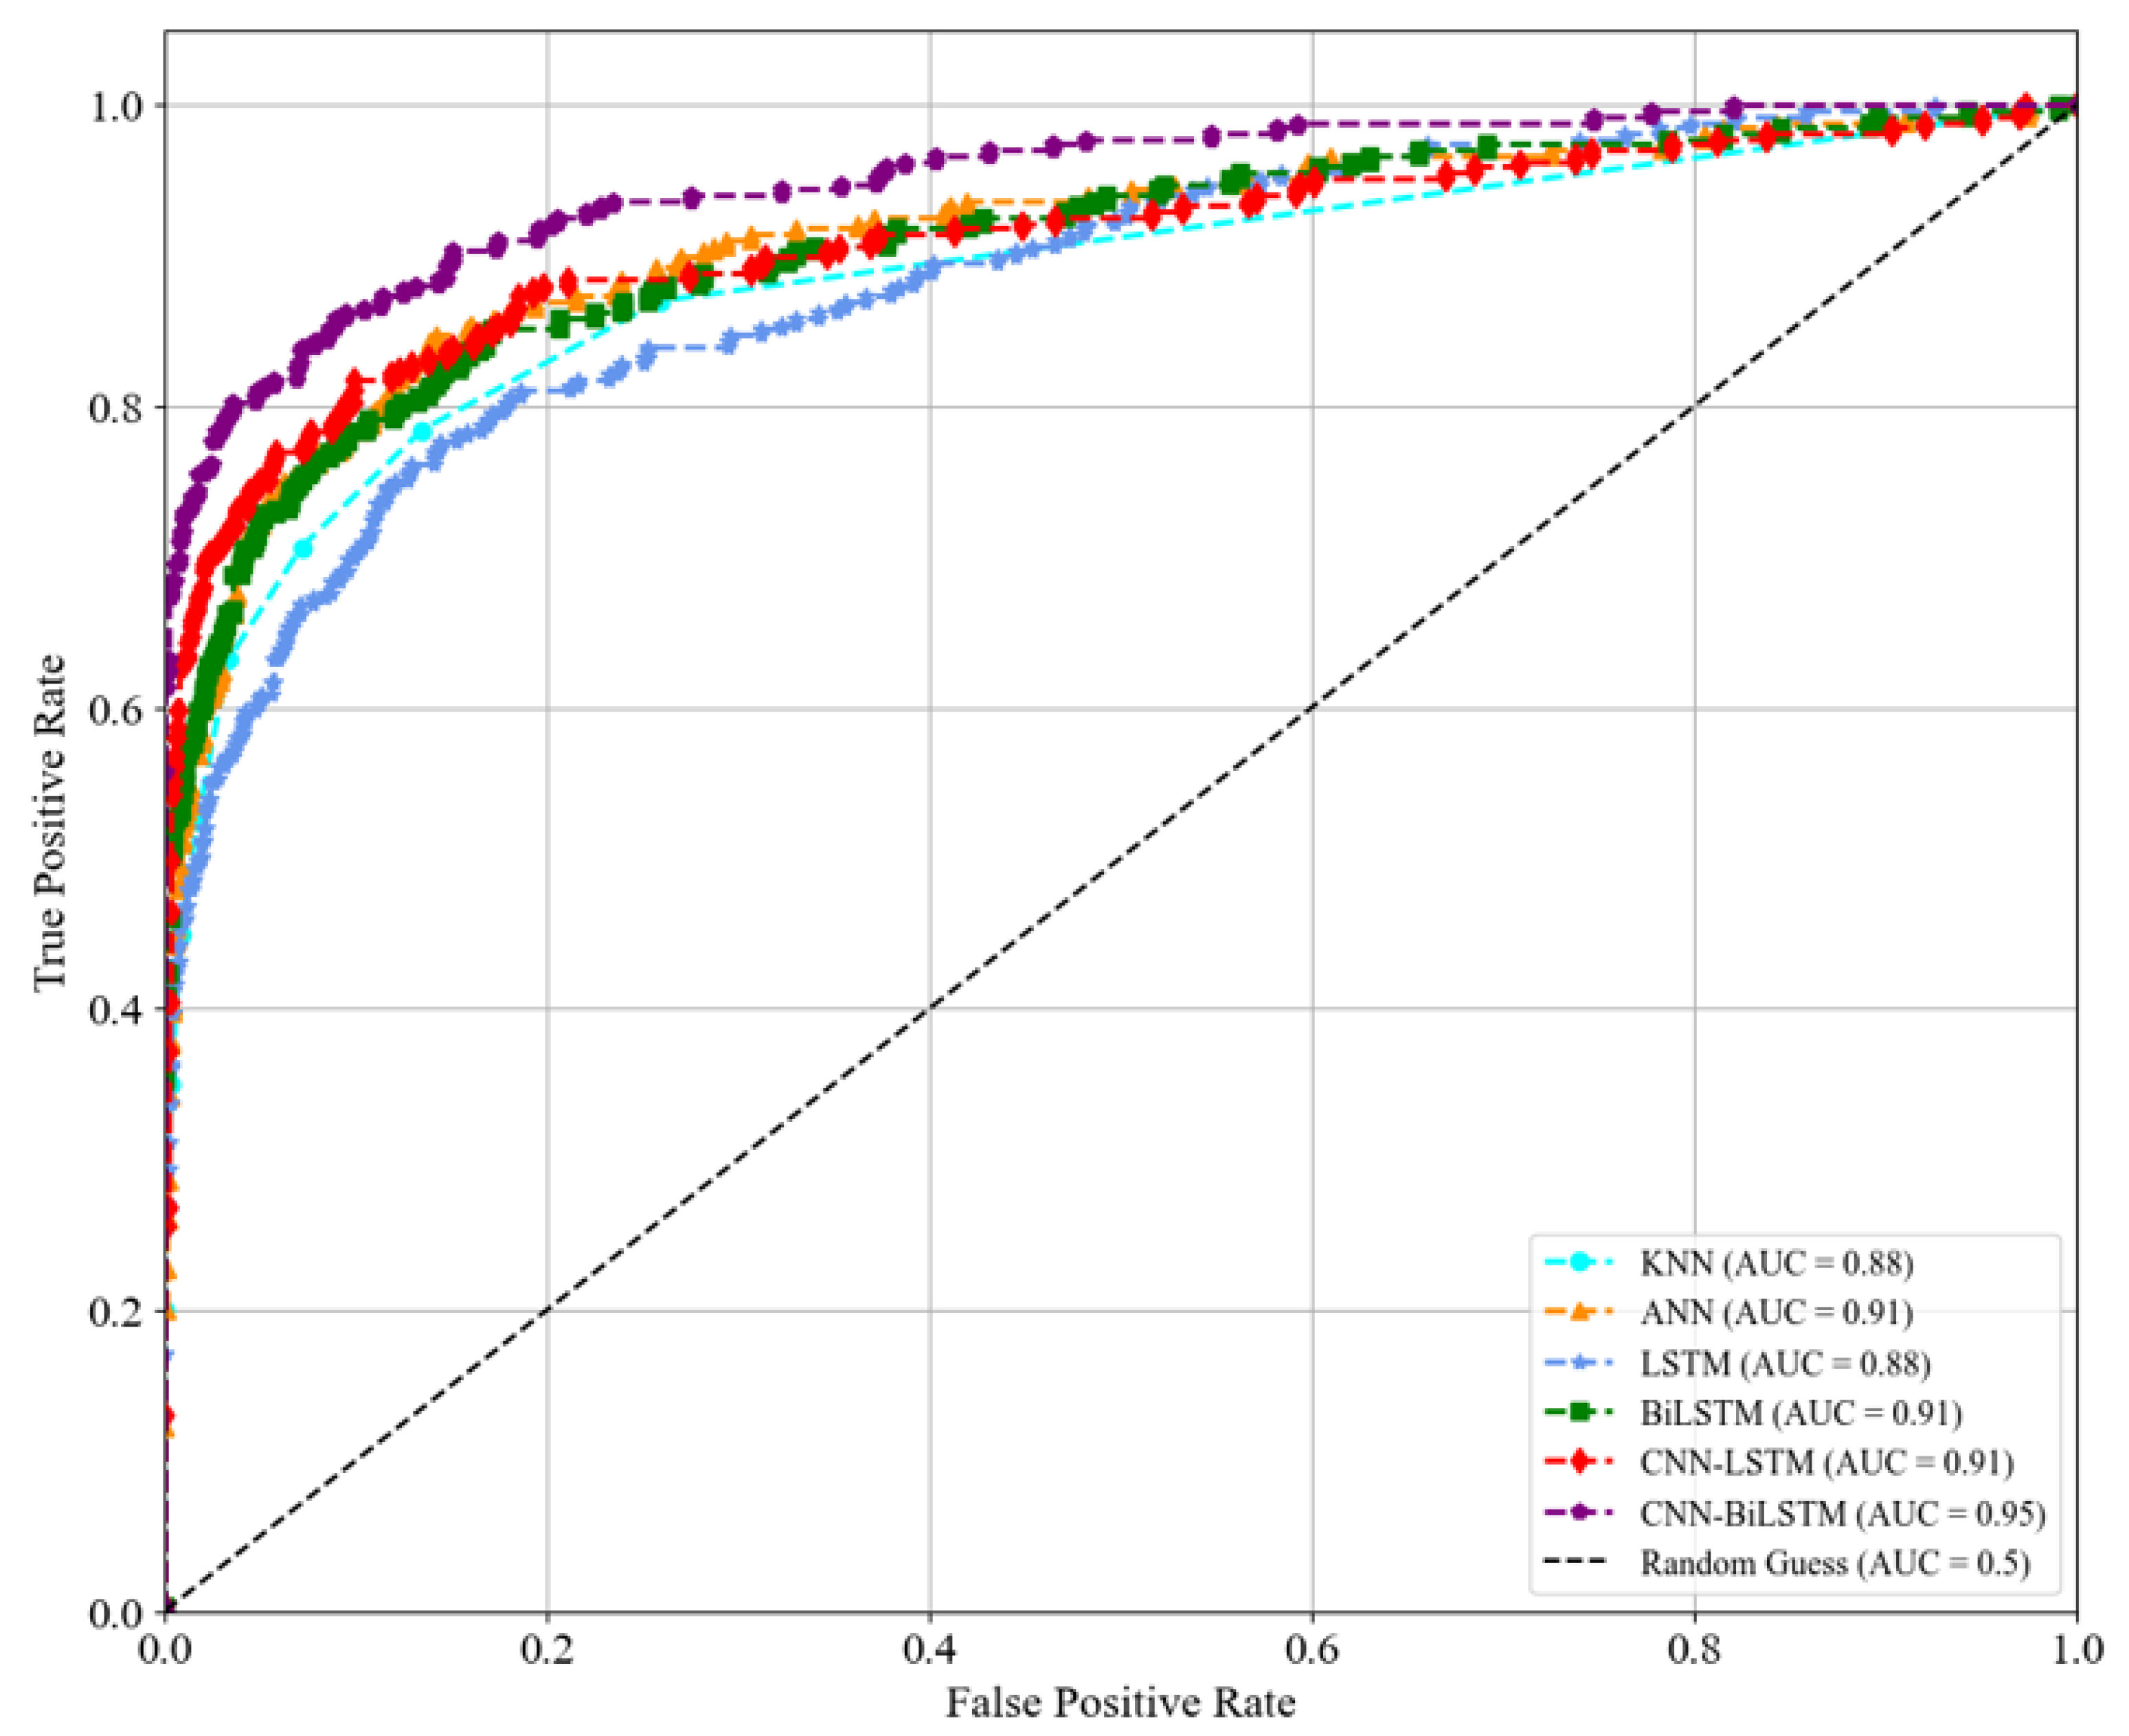
Figure 7.
Evaluating the performance of the baseline methods—kNN, ANN, LSTM, BiLSTM, and CNN–LSTM—against the proposed CNN–BiLSTM method in classifying the main mental disorders. The high ROC curve of the CNN–BiLSTM method indicates its superior performance, making it a more effective approach for classifying disorders than the other methods evaluated.
Figure 8.
Performance evaluation of specific disorder classification using the baseline methods: kNN, ANN, LSTM, BiLSTM, CNN–LSTM, and CNN–BiLSTM. The higher ROC curve of CNN–BiLSTM indicates its superior performance.
Figure 8.
Performance evaluation of specific disorder classification using the baseline methods: kNN, ANN, LSTM, BiLSTM, CNN–LSTM, and CNN–BiLSTM. The higher ROC curve of CNN–BiLSTM indicates its superior performance.
Figure 9.
The decision-making process of the proposed model for predicting addictive disorders. The model estimated a probability of 89% for addictive disorders, with lower probabilities for other disorders. For example, trauma- and stress-related disorders, schizophrenia, and mood disorders had probabilities of 0.03%, 0.03%, and 0.02%, respectively.
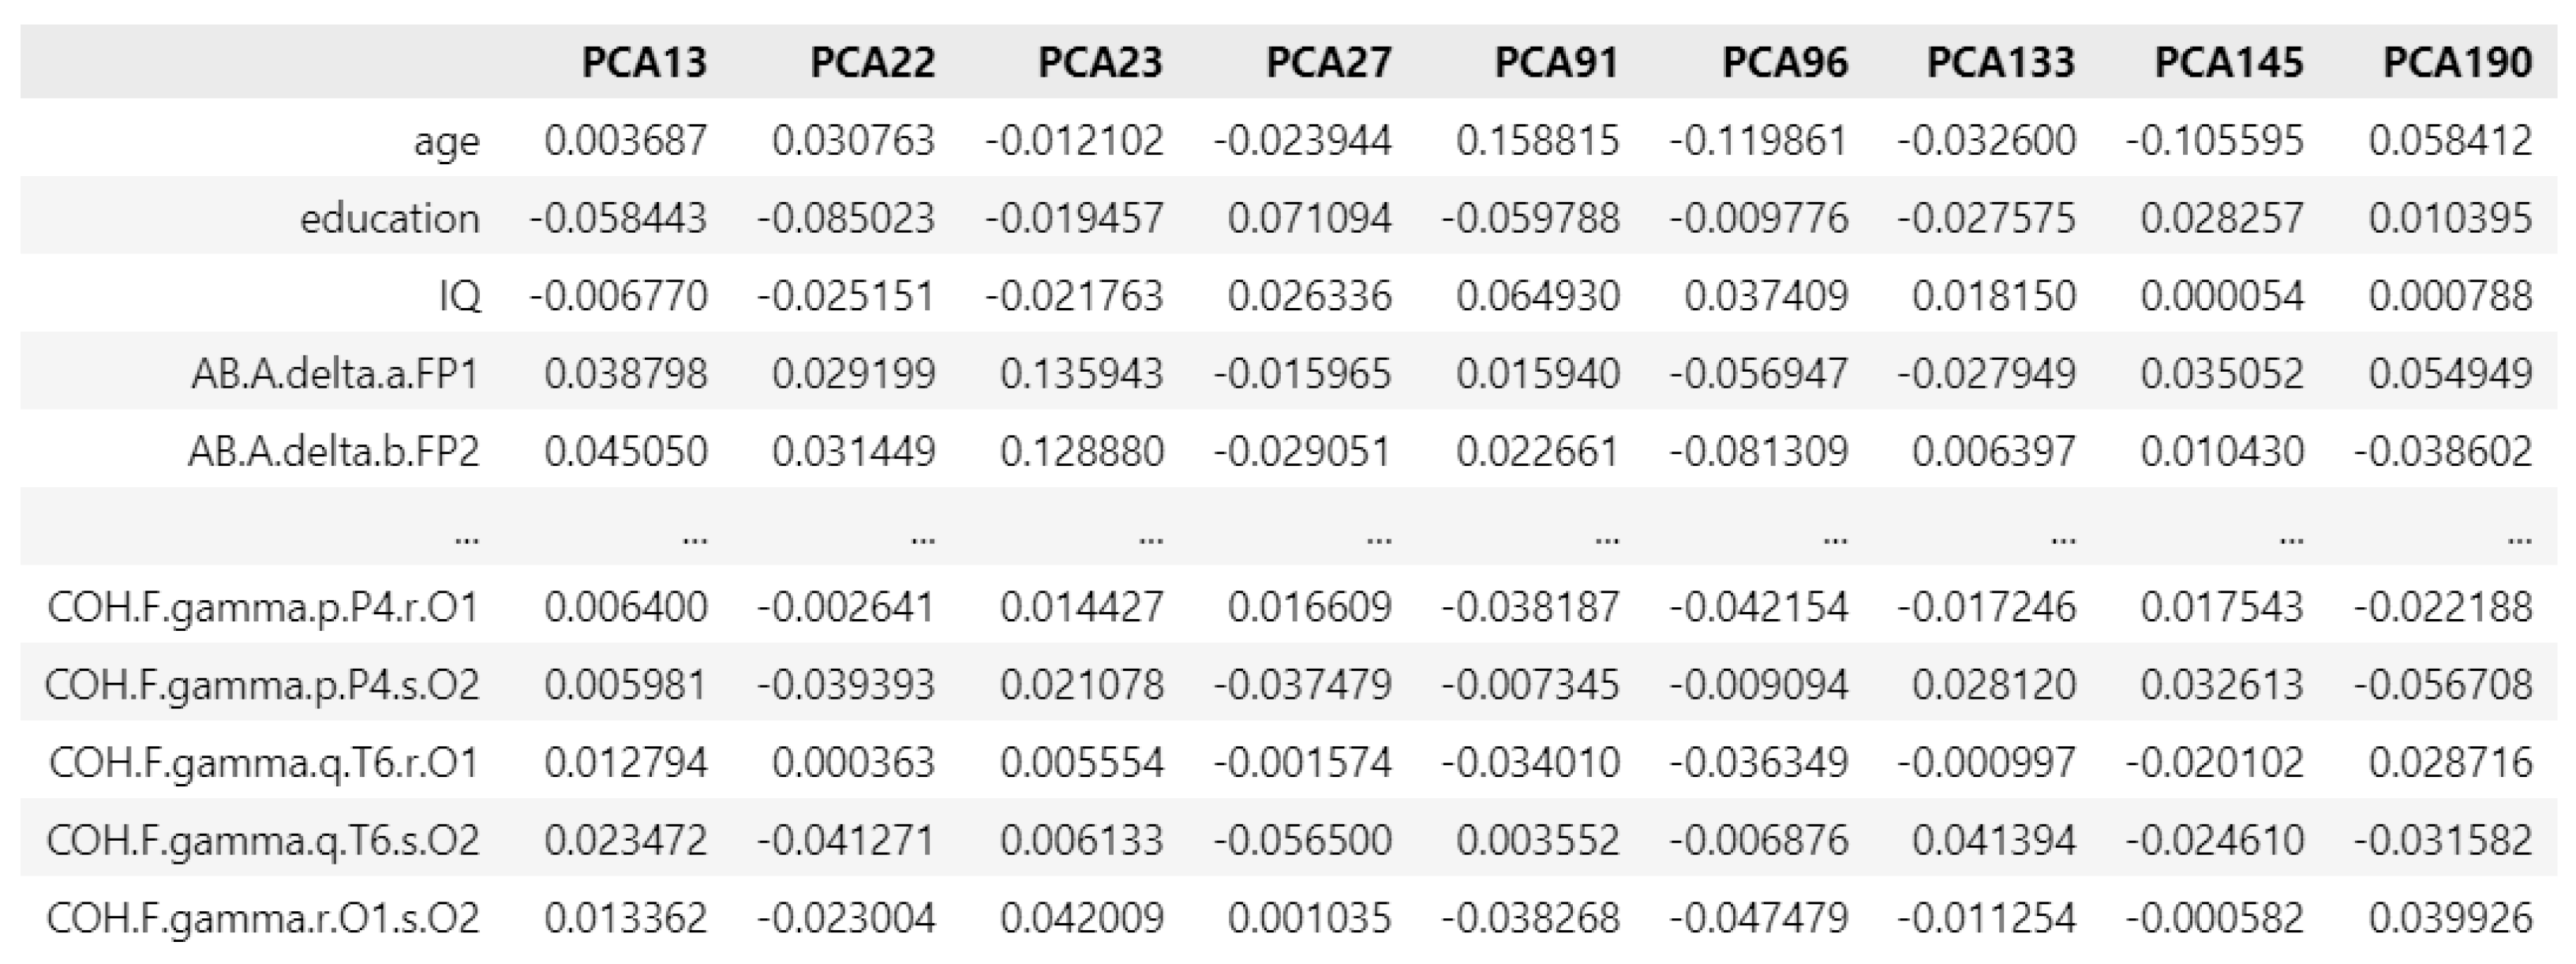
Figure 10.
PCA loading matrix for addictive disorders.
Figure 10.
PCA loading matrix for addictive disorders.
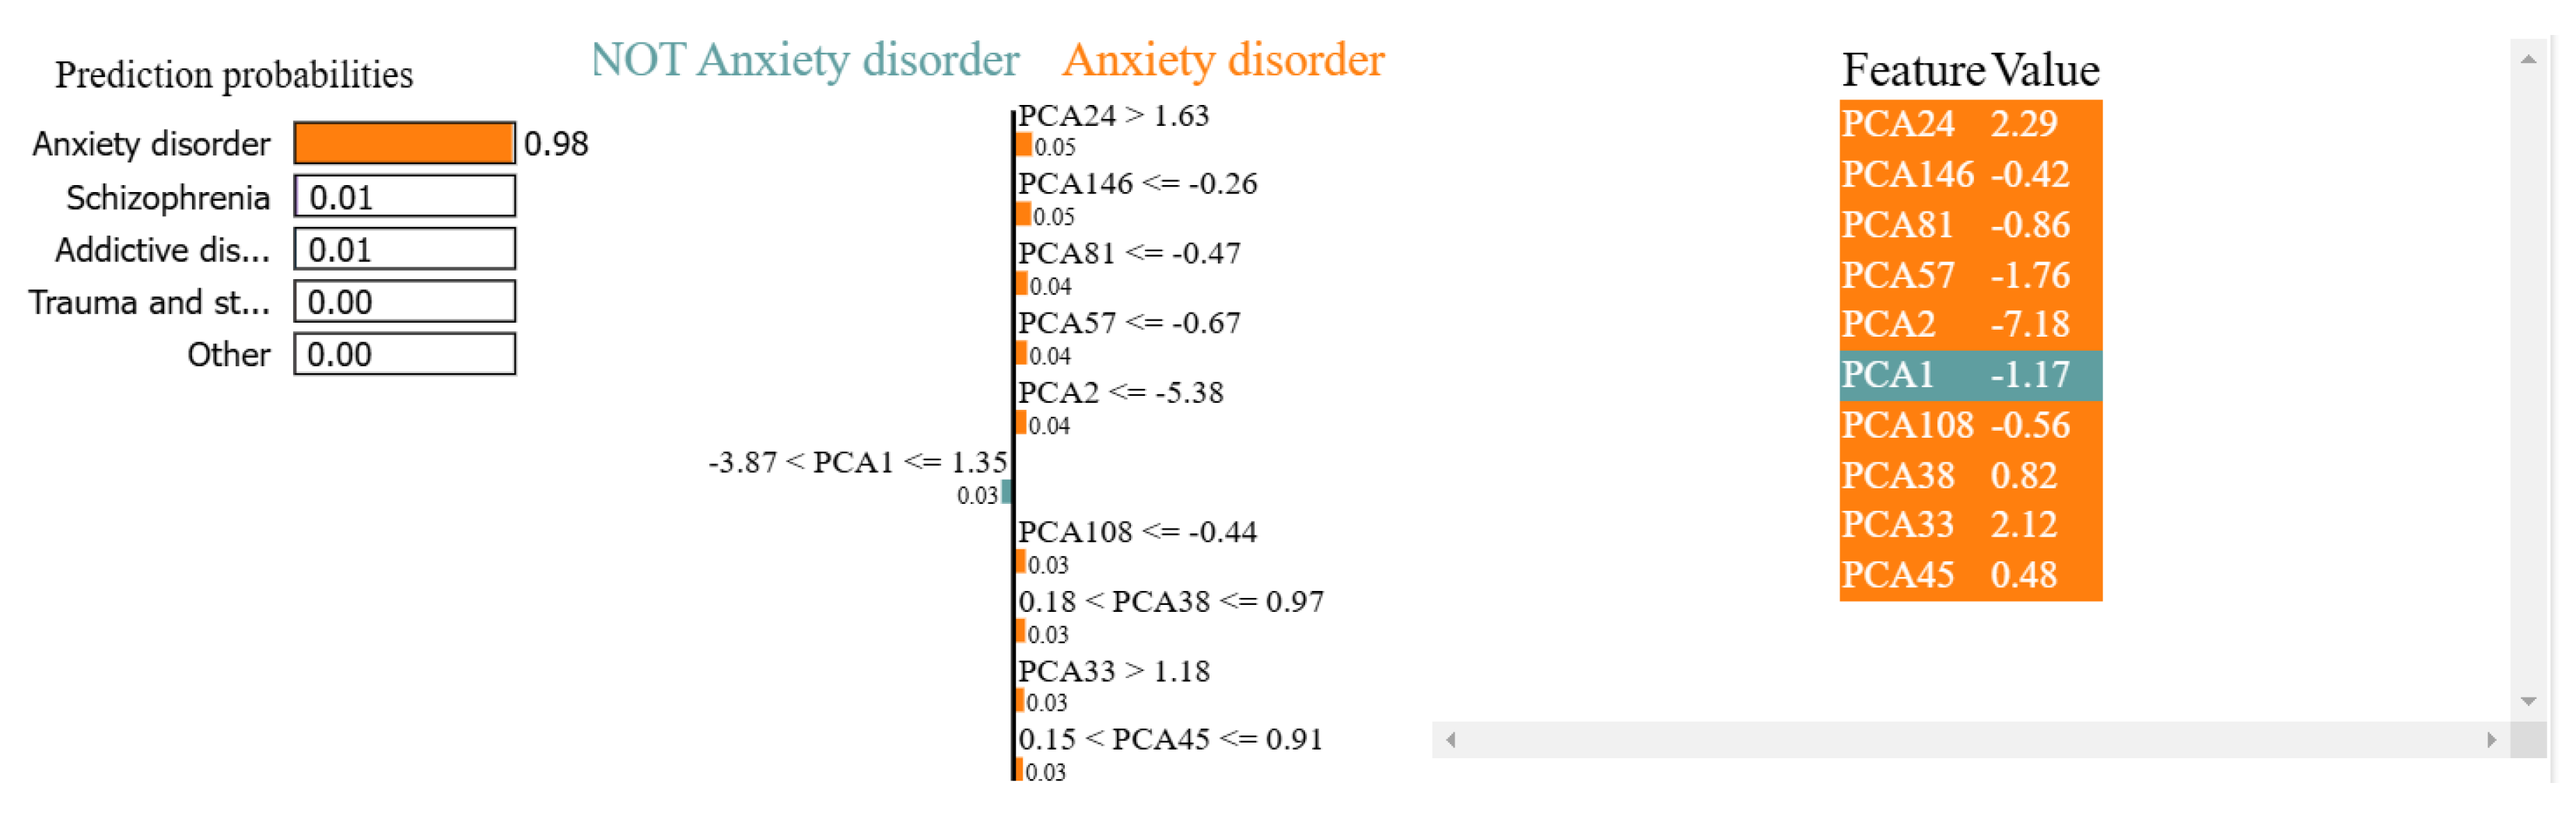
Figure 11.
The decision-making process of the proposed model, achieving a probability of 98% in predicting anxiety disorders compared to the low probabilities of related disorders, including 0.01% for schizophrenia, 0.01% for addictive disorders, and 0.00% for trauma- and stress-related disorders.
Figure 11.
The decision-making process of the proposed model, achieving a probability of 98% in predicting anxiety disorders compared to the low probabilities of related disorders, including 0.01% for schizophrenia, 0.01% for addictive disorders, and 0.00% for trauma- and stress-related disorders.
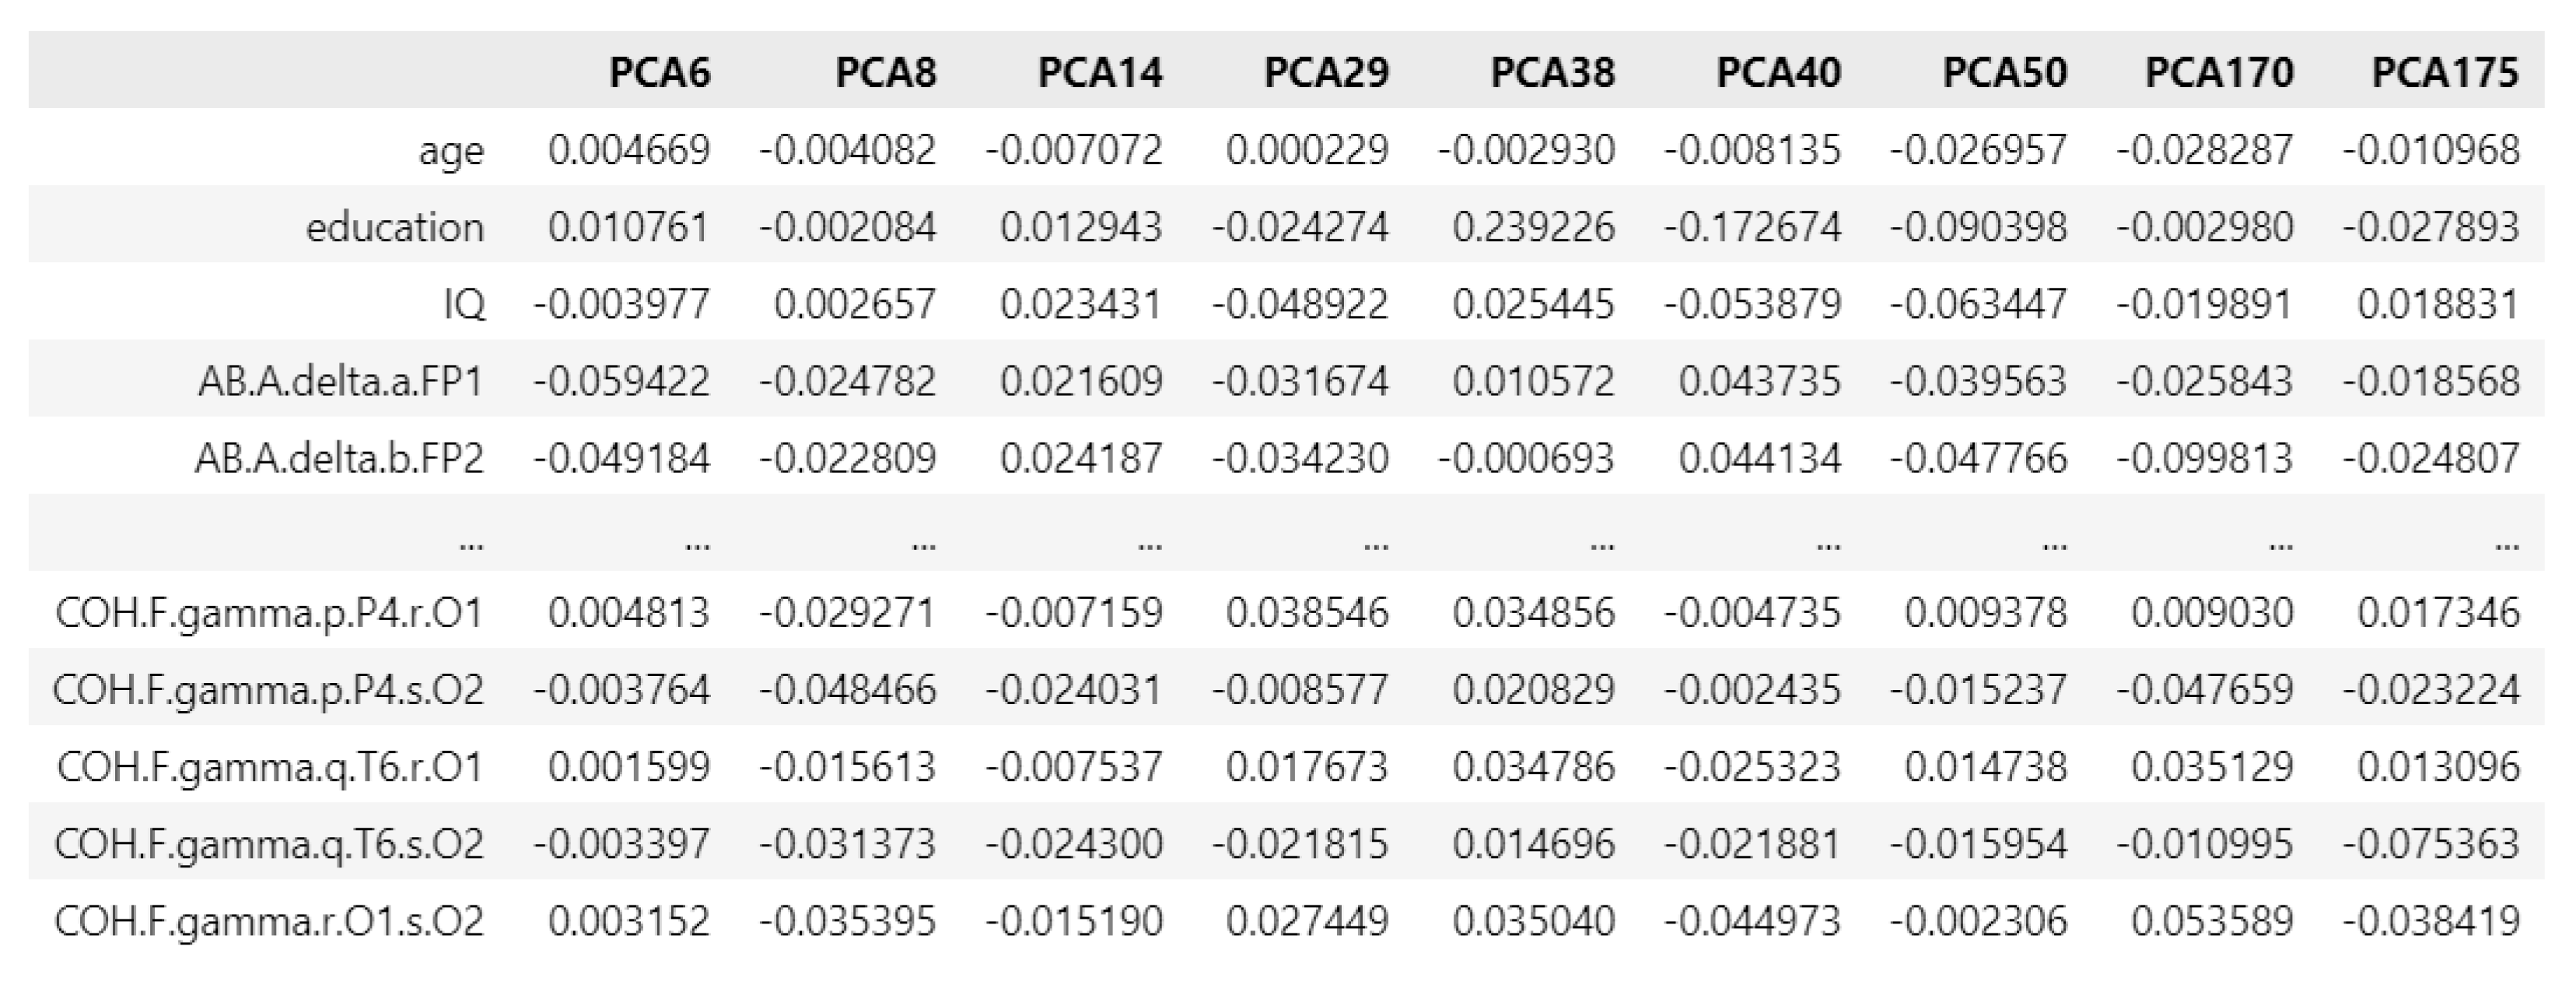
Figure 12.
PCA loading matrix for anxiety disorders.
Figure 12.
PCA loading matrix for anxiety disorders.
Figure 13.
The decision-making process of the proposed model in predicting obsessive disorders, with a probability of 98%, alongside lower probabilities of 0.01% for trauma- and stress-related disorders, 0.01% for schizophrenia, and 0.00% for anxiety disorders.
Figure 13.
The decision-making process of the proposed model in predicting obsessive disorders, with a probability of 98%, alongside lower probabilities of 0.01% for trauma- and stress-related disorders, 0.01% for schizophrenia, and 0.00% for anxiety disorders.
Figure 14.
PCA loading matrix for obsessive disorders.
Figure 14.
PCA loading matrix for obsessive disorders.
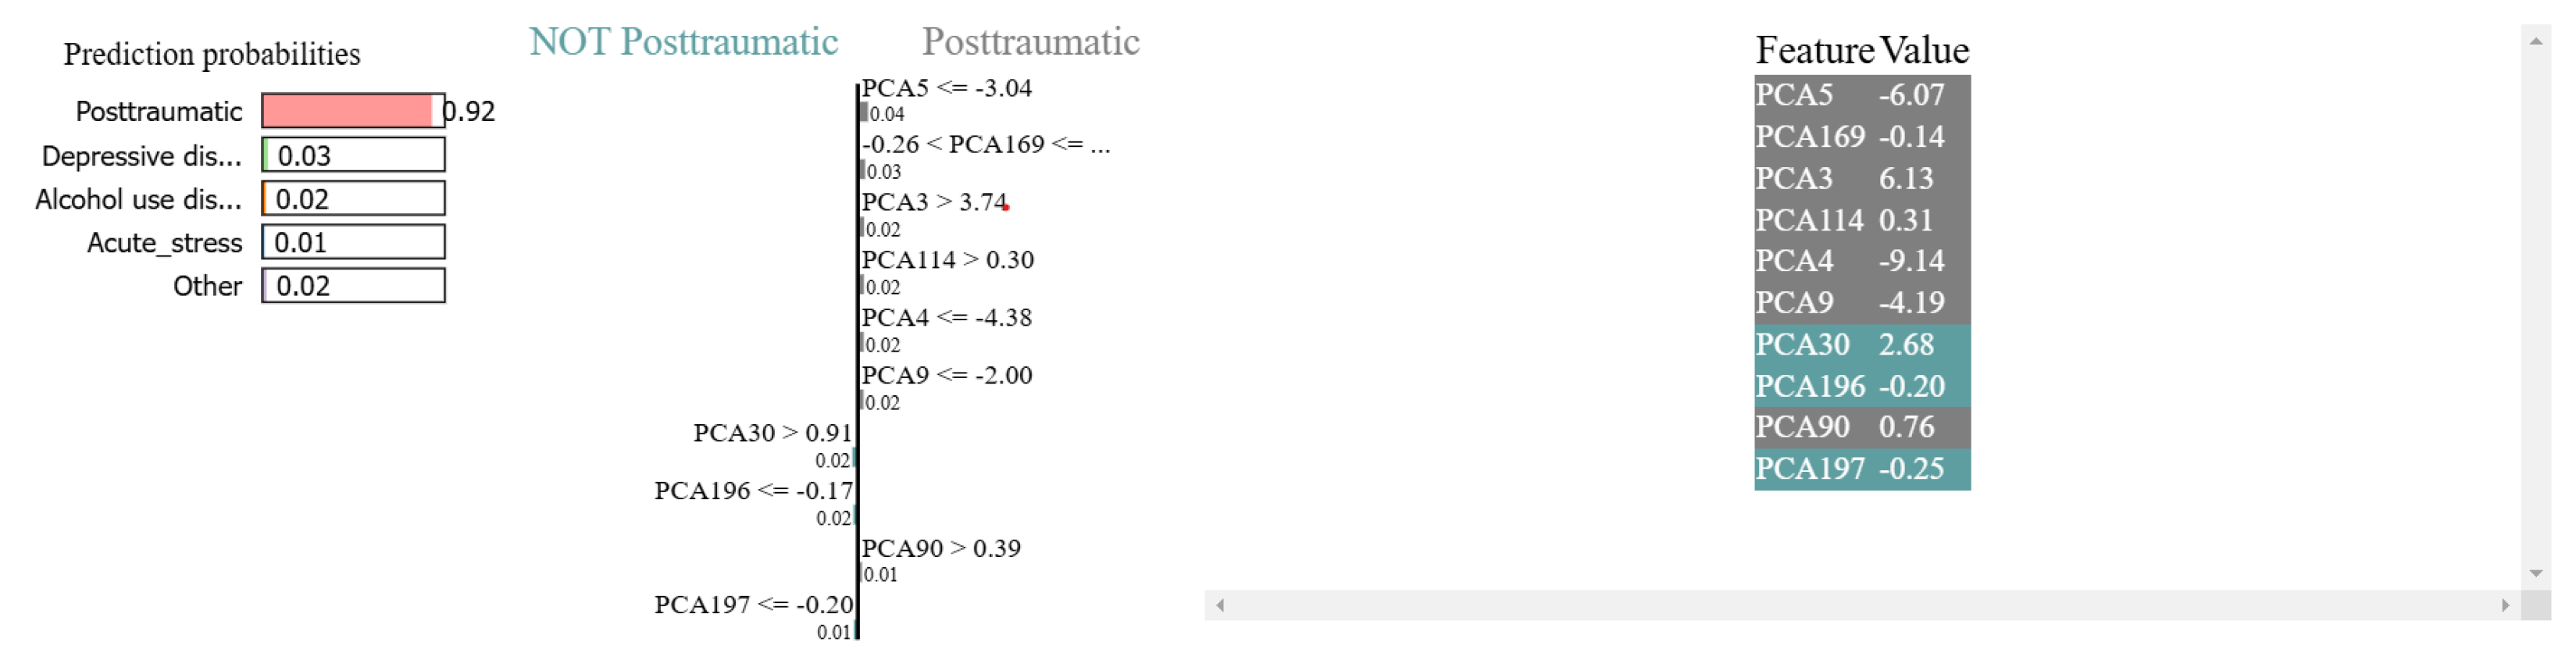
Figure 15.
The proposed model’s decision-making process in predicting acute stress disorder, with a prediction probability of 91%, compared to lower probabilities of 4% for social anxiety, 2% for bipolar disorder, and 1% for post-traumatic stress disorder.
Figure 15.
The proposed model’s decision-making process in predicting acute stress disorder, with a prediction probability of 91%, compared to lower probabilities of 4% for social anxiety, 2% for bipolar disorder, and 1% for post-traumatic stress disorder.
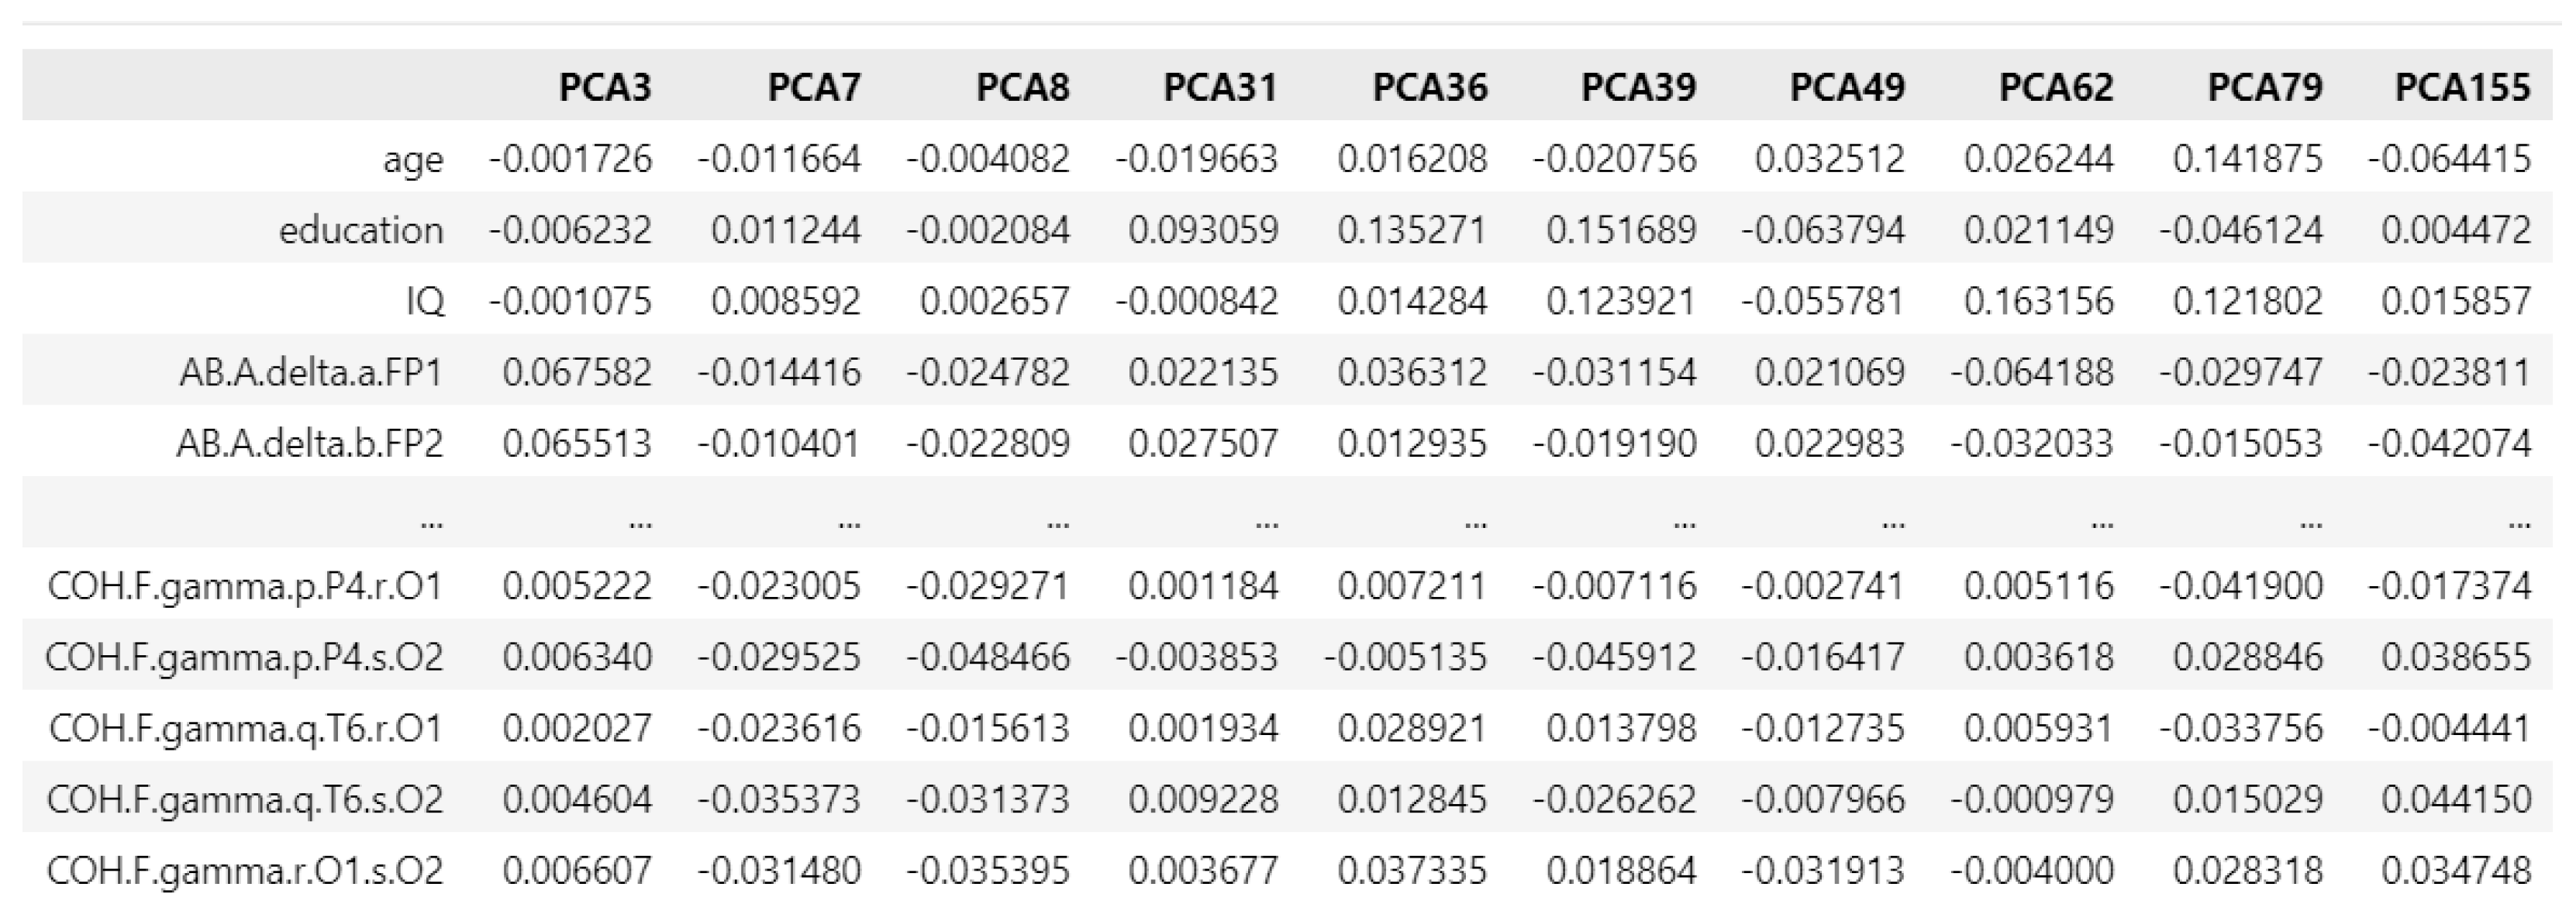
Figure 16.
PCA loading matrix for obsessive disorders.
Figure 16.
PCA loading matrix for obsessive disorders.
Figure 17.
The decision-making process of the proposed model in predicting acute stress disorder, with a probability of 91%, and the probabilities for related disorders, including 3% for depressive disorder, 1% for alcohol use disorder, and 1% for acute stress disorder.
Figure 17.
The decision-making process of the proposed model in predicting acute stress disorder, with a probability of 91%, and the probabilities for related disorders, including 3% for depressive disorder, 1% for alcohol use disorder, and 1% for acute stress disorder.
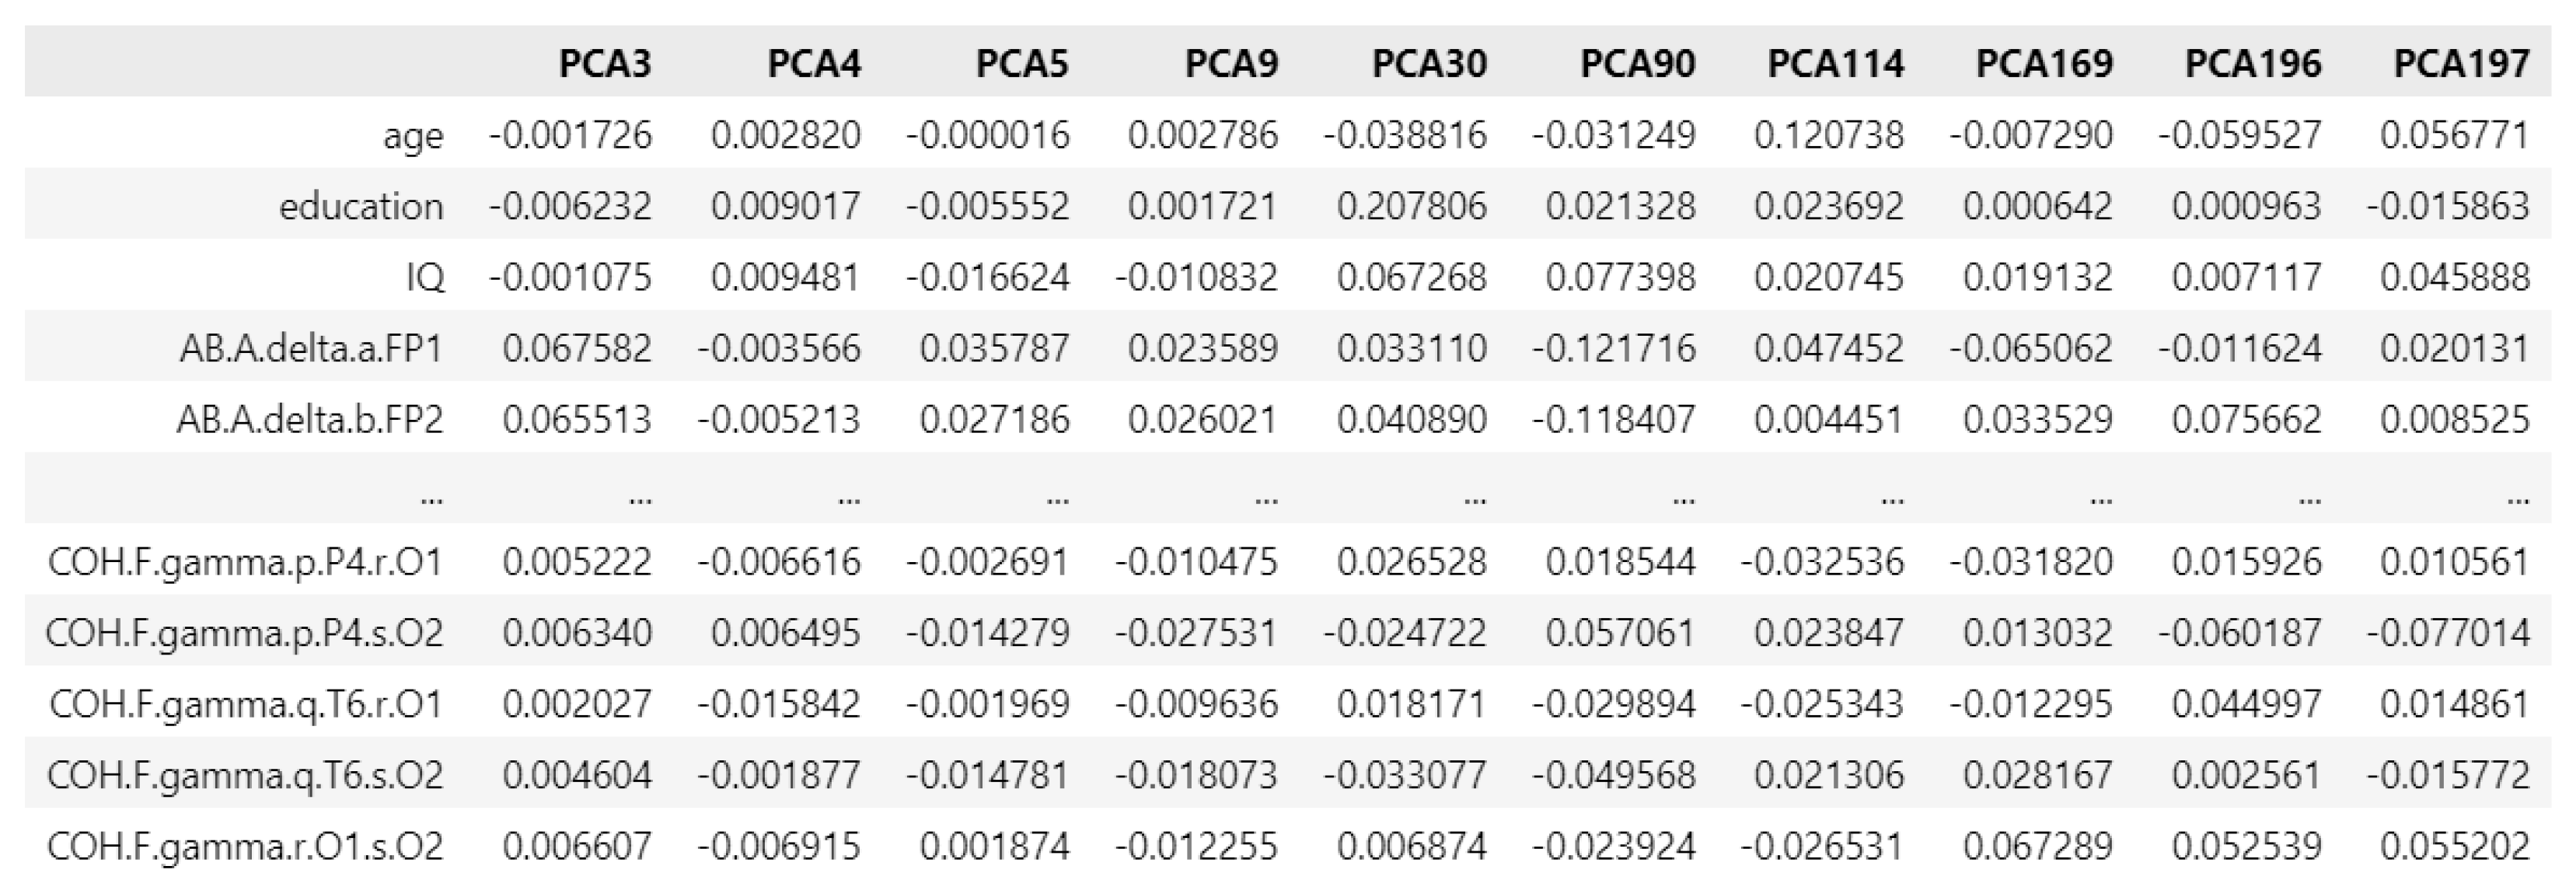
Figure 18.
PCA loading matrix for obsessive disorders.
Figure 18.
PCA loading matrix for obsessive disorders.
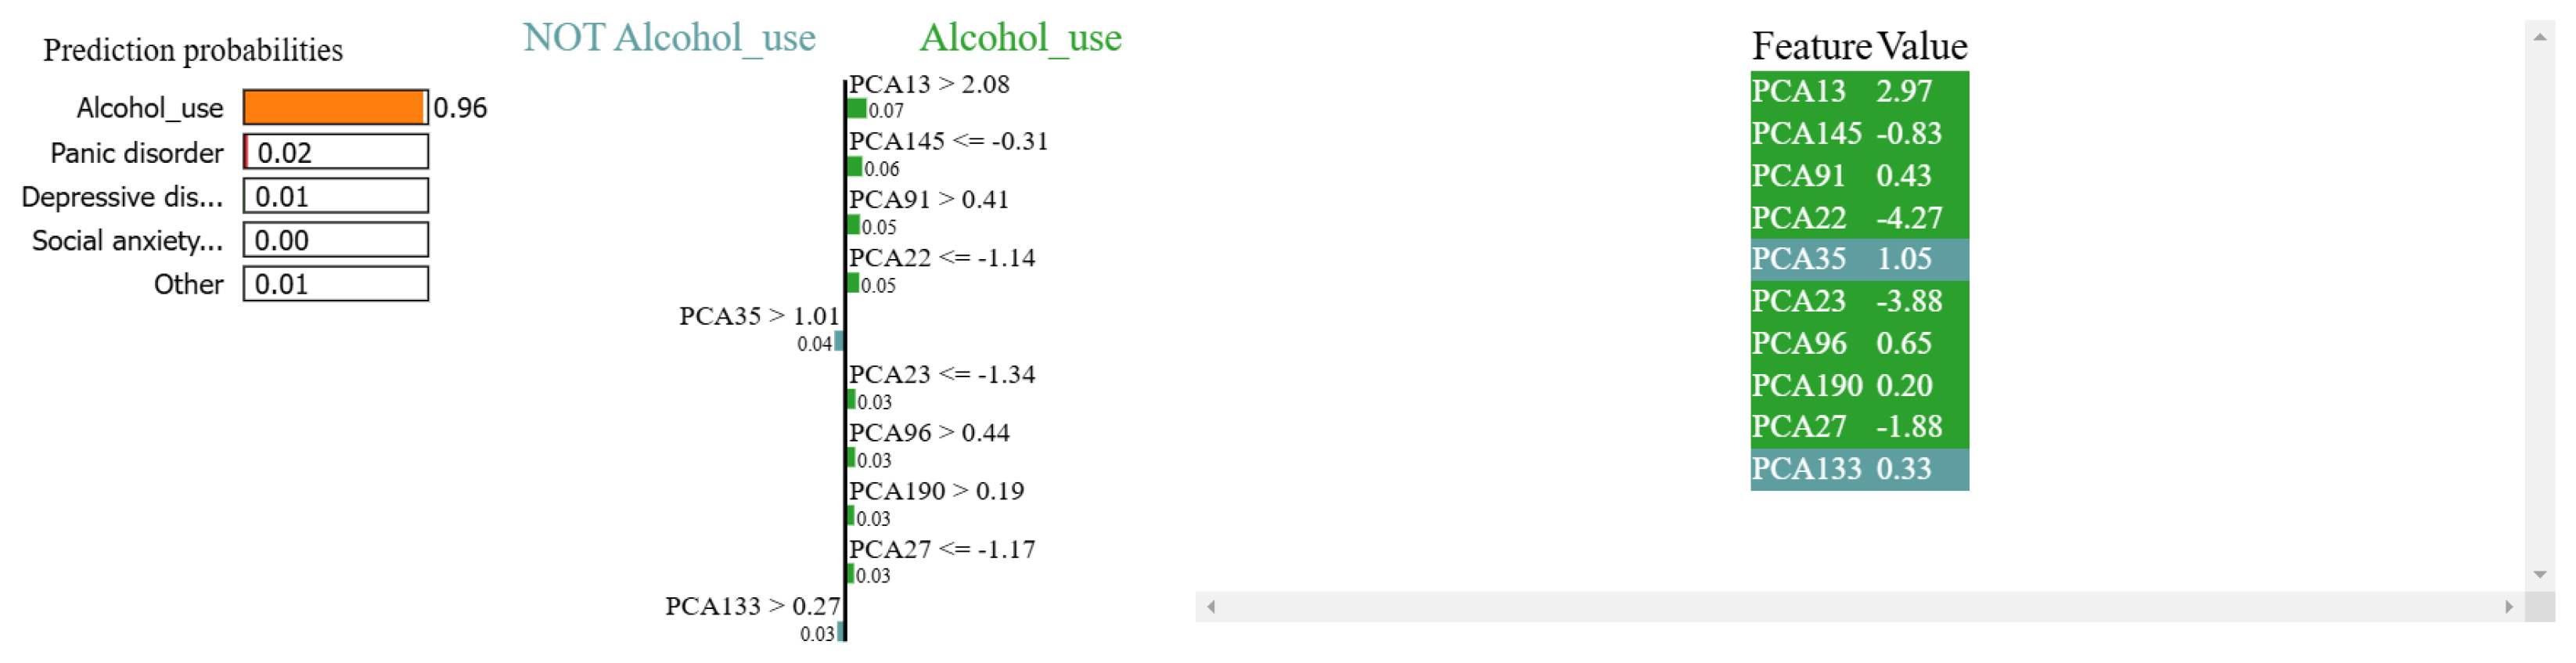
Figure 19.
The decision-making process of the proposed model in predicting alcohol use disorder, with a probability of 98%, and the probabilities for related disorders, including 2% for panic disorder, 1% for depressive disorder, and 1% for social anxiety disorder.
Figure 19.
The decision-making process of the proposed model in predicting alcohol use disorder, with a probability of 98%, and the probabilities for related disorders, including 2% for panic disorder, 1% for depressive disorder, and 1% for social anxiety disorder.
Figure 20.
PCA loading matrix for obsessive disorders.
Figure 20.
PCA loading matrix for obsessive disorders.
Table 1.
Demographic descriptive statistics of the main disorders.
Table 1.
Demographic descriptive statistics of the main disorders.
| Main Disorders | Sex (Count) | Age | IQ | Education |
|---|
| Male | Female | Mean | SD | Mean | SD | Mean | SD |
|---|
| Healthy controls (n = 95) | 60 | 35 | 25.72 | 4.55 | 116.24 | 10.94 | 14.91 | 2.06 |
| Mood disorders (n = 266) | 151 | 115 | 30.87 | 12.70 | 101.58 | 15.70 | 13.31 | 2.48 |
| Schizophrenia (n = 117) | 65 | 52 | 31.73 | 12.10 | 89.62 | 17.51 | 12.84 | 2.95 |
| Anxiety disorders (n = 107) | 79 | 28 | 29.01 | 10.56 | 98.31 | 16.31 | 13.14 | 2.42 |
| Addictive disorders (n = 186) | 164 | 22 | 29.63 | 10.89 | 103.88 | 16.19 | 13.23 | 2.53 |
| Obsessive–compulsive disorders (n = 46) | 38 | 8 | 28.48 | 9.83 | 107.80 | 15.24 | 13.93 | 2.33 |
| Trauma and stress-related disorders (n = 128) | 44 | 84 | 36.09 | 13.82 | 98.89 | 15.86 | 13.57 | 2.45 |
Table 2.
Demographic descriptive statistics of the specific disorders.
Table 2.
Demographic descriptive statistics of the specific disorders.
| Specific Disorders | Sex (Count) | Age | IQ | Education |
|---|
| Male | Female | Mean | SD | Mean | SD | Mean | SD |
|---|
| Panic disorder (n = 59) | 38 | 21 | 31.05 | 11.30 | 100.31 | 14.77 | 13.45 | 2.91 |
| Bipolar disorder (n = 67) | 42 | 25 | 29.71 | 11.01 | 100.81 | 16.98 | 14.11 | 2.21 |
| Adjustment disorder (n = 38) | 27 | 11 | 34.19 | 14.90 | 94.24 | 15.41 | 13.26 | 2.41 |
| Depressive disorder (n = 199) | 109 | 90 | 31.26 | 13.23 | 101.85 | 15.28 | 13.06 | 2.51 |
| Alcohol use disorder (n = 93) | 75 | 18 | 34.16 | 11.88 | 103.38 | 13.61 | 13.29 | 3.07 |
| Acute stress disorder (n = 38) | 3 | 35 | 28.90 | 9.05 | 104.06 | 15.43 | 14.26 | 2.27 |
| Social anxiety disorder (n = 48) | 41 | 7 | 26.51 | 9.09 | 95.85 | 17.89 | 12.78 | 1.60 |
| Behavioral addiction disorder (n = 93) | 89 | 4 | 25.09 | 7.48 | 104.38 | 18.49 | 13.16 | 1.89 |
| Post-traumatic stress disorder (n = 52) | 14 | 38 | 42.74 | 13.0 | 98.90 | 15.69 | 13.37 | 2.54 |
Table 3.
Evaluation metrics employed in this study to assess the performance of our proposed CNN–BiLSTM model and the baseline methods on the mental disorder classification task. Each metric is defined along with its corresponding mathematical formulation.
Table 3.
Evaluation metrics employed in this study to assess the performance of our proposed CNN–BiLSTM model and the baseline methods on the mental disorder classification task. Each metric is defined along with its corresponding mathematical formulation.
| Metric | Description | Equation |
|---|
| Accuracy | Assesses the effectiveness of the models | |
| Sensitivity | Determines the true positive cases | |
| Specificity | Measures the proportion of true negatives | |
| F1-score | Computes the harmonic mean of sensitivity and specificity | |
| Measures the proportion of actual positive cases | |
Table 4.
Performance comparison between the proposed method and the baseline methods.
Table 4.
Performance comparison between the proposed method and the baseline methods.
| Model | Accuracy (%) | Sensitivity (%) | Specificity (%) | F1-Score (%) |
|---|
| kNN | 52 | 44 | 52 | 46 |
| ANN | 71 | 71 | 71 | 70 |
| LSTM | 73 | 71 | 73 | 71 |
| BiLSTM | 71 | 71 | 71 | 68 |
| CNN–LSTM | 74 | 72 | 73 | 73 |
| CNN–BiLSTM | 76 | 74 | 76 | 75 |
Table 5.
False negative rates () of the proposed and baseline methods in classifying the main disorders.
Table 5.
False negative rates () of the proposed and baseline methods in classifying the main disorders.
| Disorder | kNN | ANN | LSTM | BiLSTM | CNN–LSTM | CNN–BiLSTM |
|---|
| Addictive disorders | 44 | 32 | 29 | 27 | 25 | 25 |
| Anxiety disorders | 41 | 13 | 22 | 17 | 15 | 17 |
| Mood disorders | 25 | 38 | 22 | 23 | 22 | 19 |
| Obsessive–compulsive disorders | 38 | 7 | 13 | 7 | 10 | 10 |
| Schizophrenia | 48 | 38 | 35 | 37 | 14 | 7 |
| Trauma- and stress-related disorders | 31 | 29 | 20 | 20 | 25 | 15 |
Table 6.
Performance comparison of the proposed method and baseline methods.
Table 6.
Performance comparison of the proposed method and baseline methods.
| Model | Accuracy (%) | Sensitivity (%) | Specificity (%) | F1-Score (%) |
|---|
| kNN | 65 | 61 | 65 | 61 |
| ANN | 72 | 71 | 72 | 71 |
| LSTM | 78 | 77 | 78 | 77 |
| BiLSTM | 69 | 68 | 69 | 67 |
| CNN–LSTM | 74 | 73 | 74 | 73 |
| CNN–BiLSTM | 80 | 77 | 80 | 78 |
Table 7.
False negative rates () of the proposed and baseline methods in classifying specific disorders.
Table 7.
False negative rates () of the proposed and baseline methods in classifying specific disorders.
| Disorder | kNN | ANN | LSTM | BiLSTM | CNN–LSTM | CNN–BiLSTM |
|---|
| Acute stress disorder | 20 | 6 | 12 | 3 | 9 | 3 |
| Adjustment disorder | 35 | 21 | 15 | 19 | 12 | 8 |
| Alcohol use disorder | 29 | 39 | 35 | 29 | 25 | 12 |
| Behavioral addiction disorder | 12 | 17 | 19 | 13 | 17 | 16 |
| Bipolar disorder | 27 | 28 | 40 | 18 | 17 | 10 |
| Depressive disorder | 59 | 50 | 51 | 54 | 30 | 40 |
| Panic disorder | 24 | 29 | 23 | 23 | 22 | 7 |
| Post-traumatic stress disorder | 19 | 19 | 17 | 12 | 18 | 9 |
| Social anxiety disorder | 23 | 23 | 32 | 32 | 26 | 25 |
Table 8.
Impact of kNN data imputation on the performance of the proposed model in classifying the main disorders.
Table 8.
Impact of kNN data imputation on the performance of the proposed model in classifying the main disorders.
| Model | Accuracy (%) | Sensitivity (%) | Specificity (%) | F1-Score (%) |
|---|
| CNN–BiLSTM with no kNN imputation | 70 | 68 | 70 | 67 |
| CNN–BiLSTM with kNN imputation | 76 | 74 | 76 | 75 |
Table 9.
Impact of kNN data imputation on the performance of the proposed model in classifying specific disorders.
Table 9.
Impact of kNN data imputation on the performance of the proposed model in classifying specific disorders.
| Model | Accuracy (%) | Sensitivity (%) | Specificity (%) | F1-Score (%) |
|---|
| CNN–BiLSTM with no kNN imputation | 78 | 77 | 78 | 74 |
| CNN–BiLSTM with kNN imputation | 80 | 77 | 80 | 78 |
Table 10.
Impact of PCA on the performance of the proposed model in classifying the main disorders.
Table 10.
Impact of PCA on the performance of the proposed model in classifying the main disorders.
| Model | Accuracy (%) | Sensitivity (%) | Specificity (%) | F1-Score (%) |
|---|
| CNN–BiLSTM with no PCA | 68 | 76 | 68 | 62 |
| CNN–BiLSTM with PCA | 76 | 74 | 76 | 75 |
Table 11.
Impact of PCA on the performance of the proposed model in classifying specific disorders.
Table 11.
Impact of PCA on the performance of the proposed model in classifying specific disorders.
| Model | Accuracy (%) | Sensitivity (%) | Specificity (%) | F1-Score (%) |
|---|
| CNN–BiLSTM with no PCA | 78 | 78 | 78 | 77 |
| CNN–BiLSTM with PCA | 80 | 77 | 80 | 78 |
Table 12.
Impact of different loss functions on the (%) of the proposed model for specific disorders.
Table 12.
Impact of different loss functions on the (%) of the proposed model for specific disorders.
| Disorder | Categorical Cross-Entropy | Weighted Categorical Cross-Entropy | Focal Loss |
|---|
| Acute stress disorder | 3 | 6 | 9 |
| Adjustment disorder | 8 | 4 | 4 |
| Alcohol use disorder | 12 | 22 | 19 |
| Behavioral addiction disorder | 16 | 24 | 24 |
| Bipolar disorder | 10 | 4 | 4 |
| Depressive disorder | 40 | 58 | 55 |
| Panic disorder | 7 | 15 | 15 |
| Post-traumatic stress disorder | 9 | 6 | 9 |
| Social anxiety disorder | 25 | 11 | 7 |


