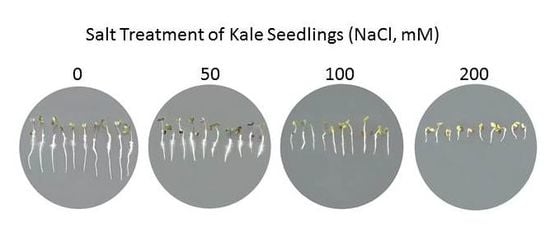
Involvement of Phenolic Acids in Short-Term Adaptation to Salinity Stress is Species-Specific among Brassicaceae
Abstract
1. Introduction
2. Results
2.1. Physiological and Biochemical Response of Brassicas to Salinity Stress
2.2. Pigment Changes in Brassica Seedlings under Salinity Stress
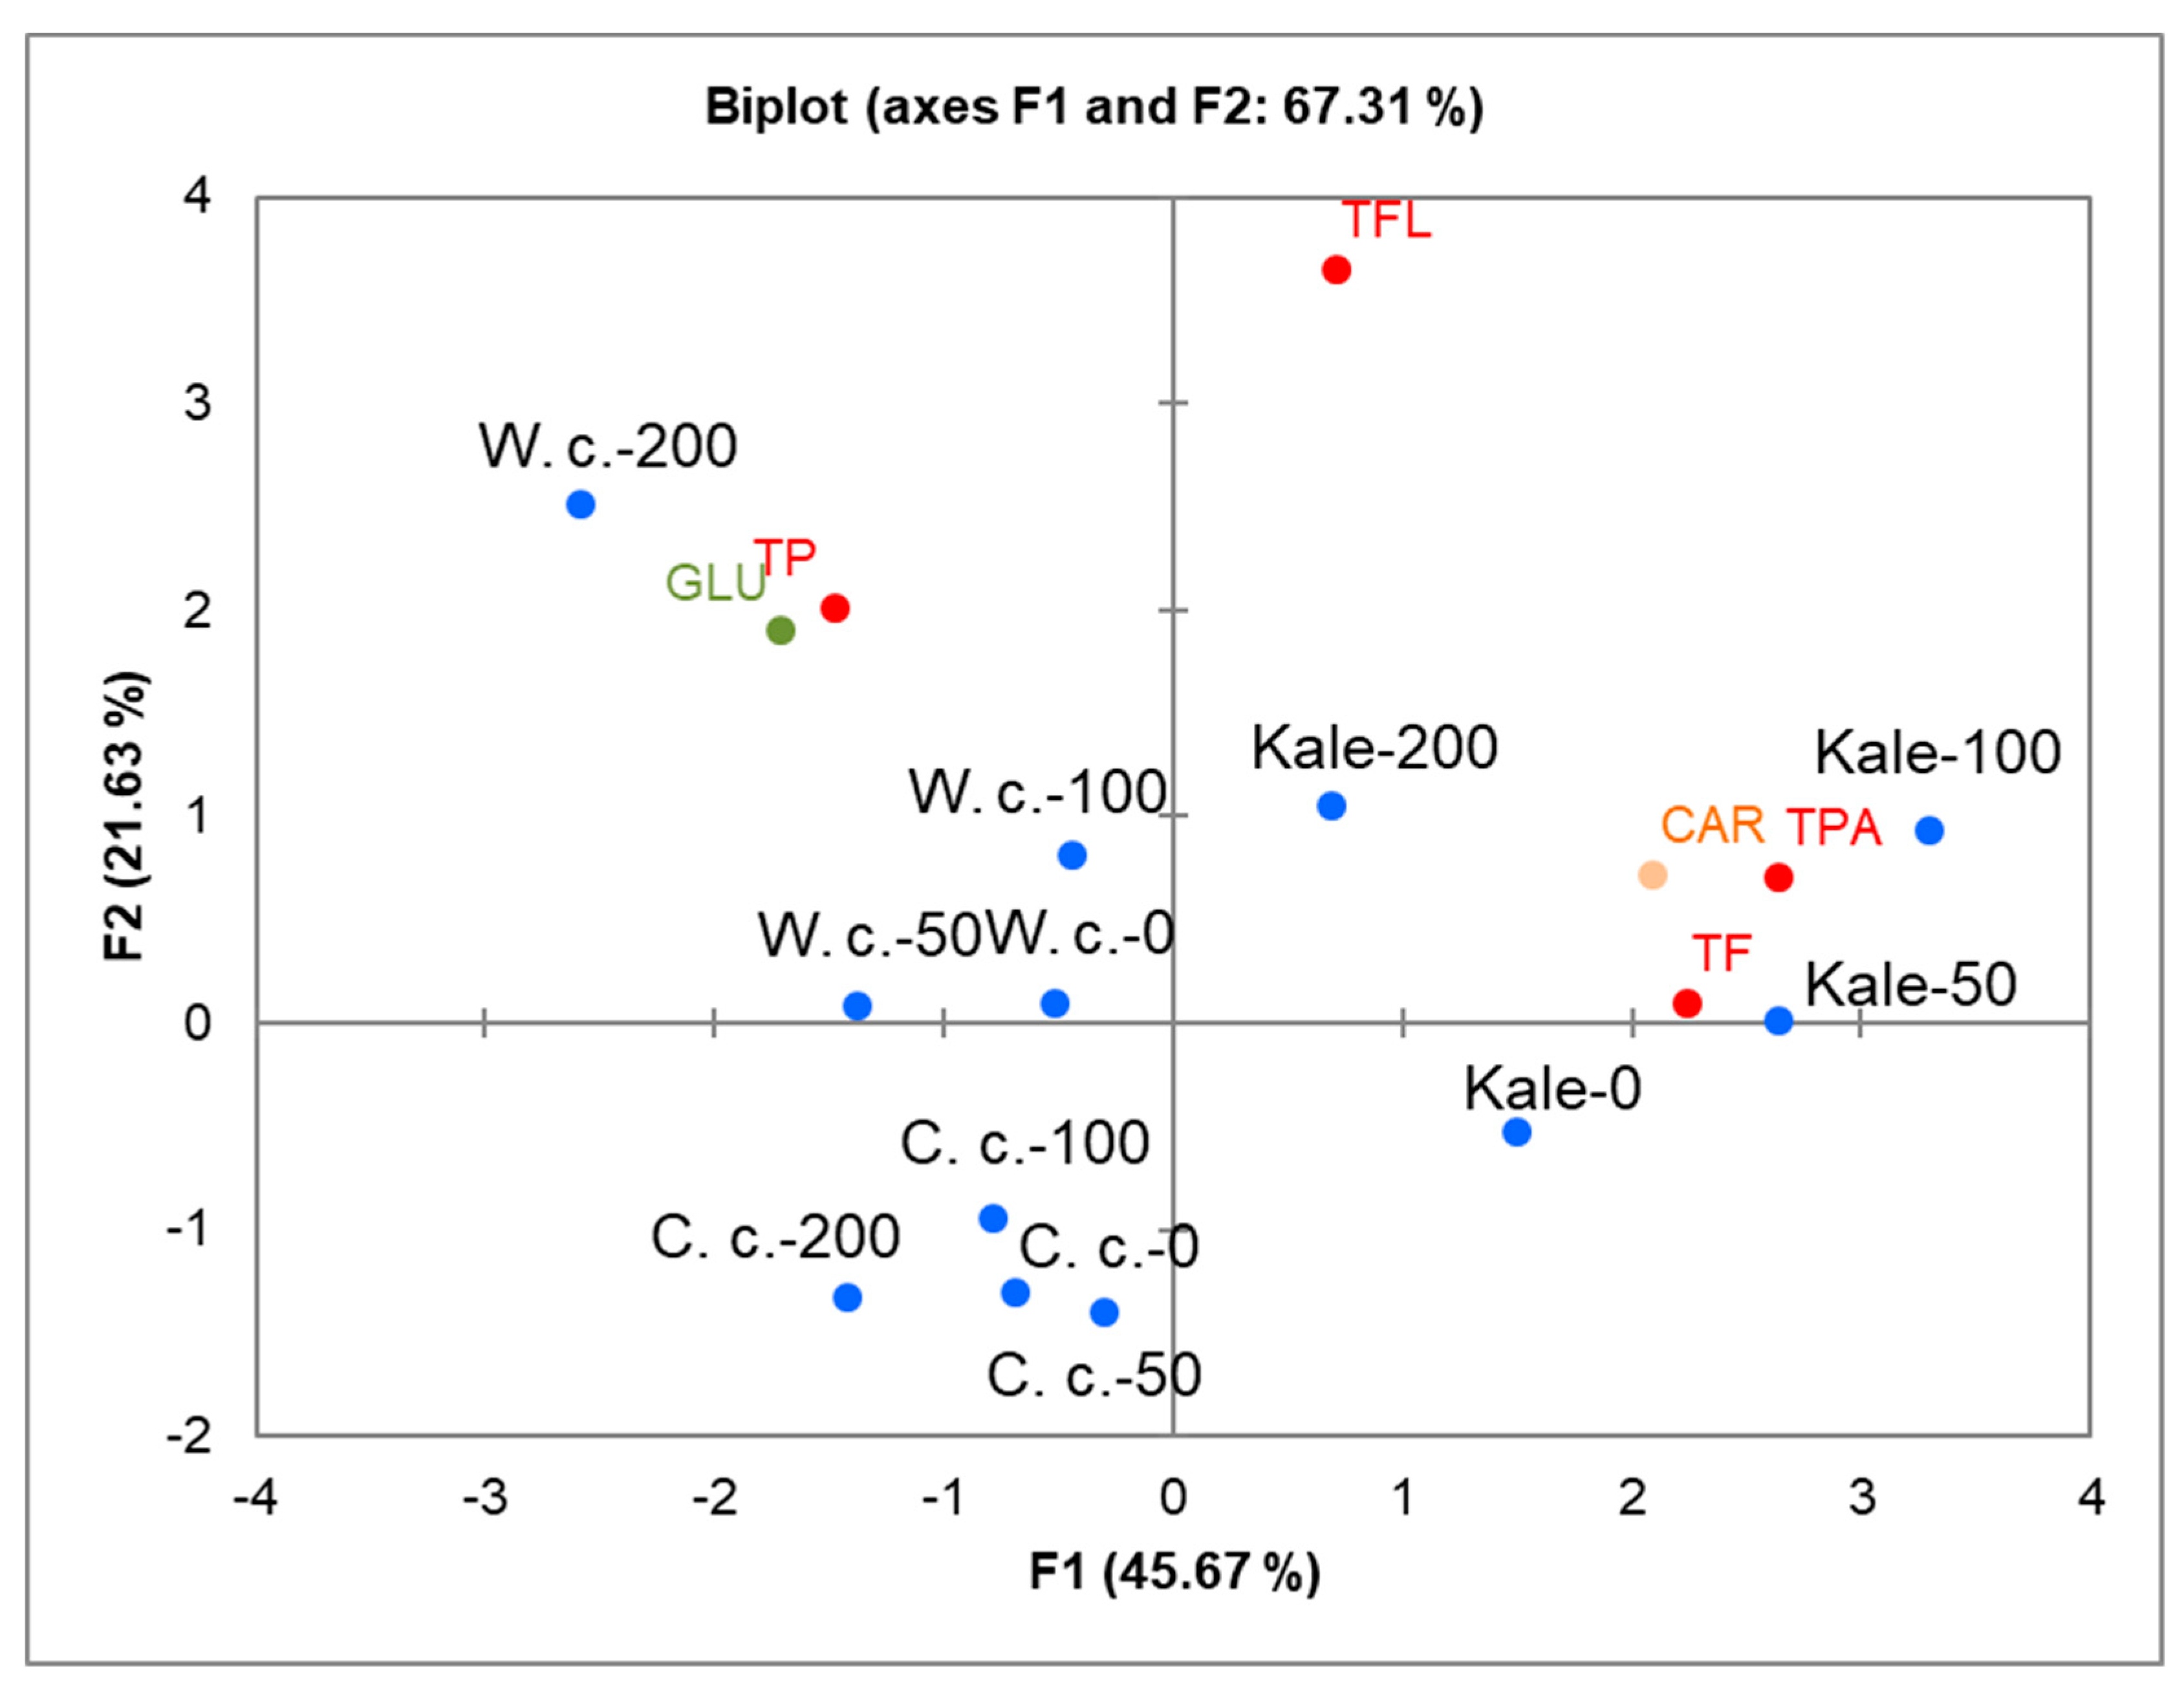
2.3. Correlations between Specific Metabolites and Brassica Species under Salinity Stress
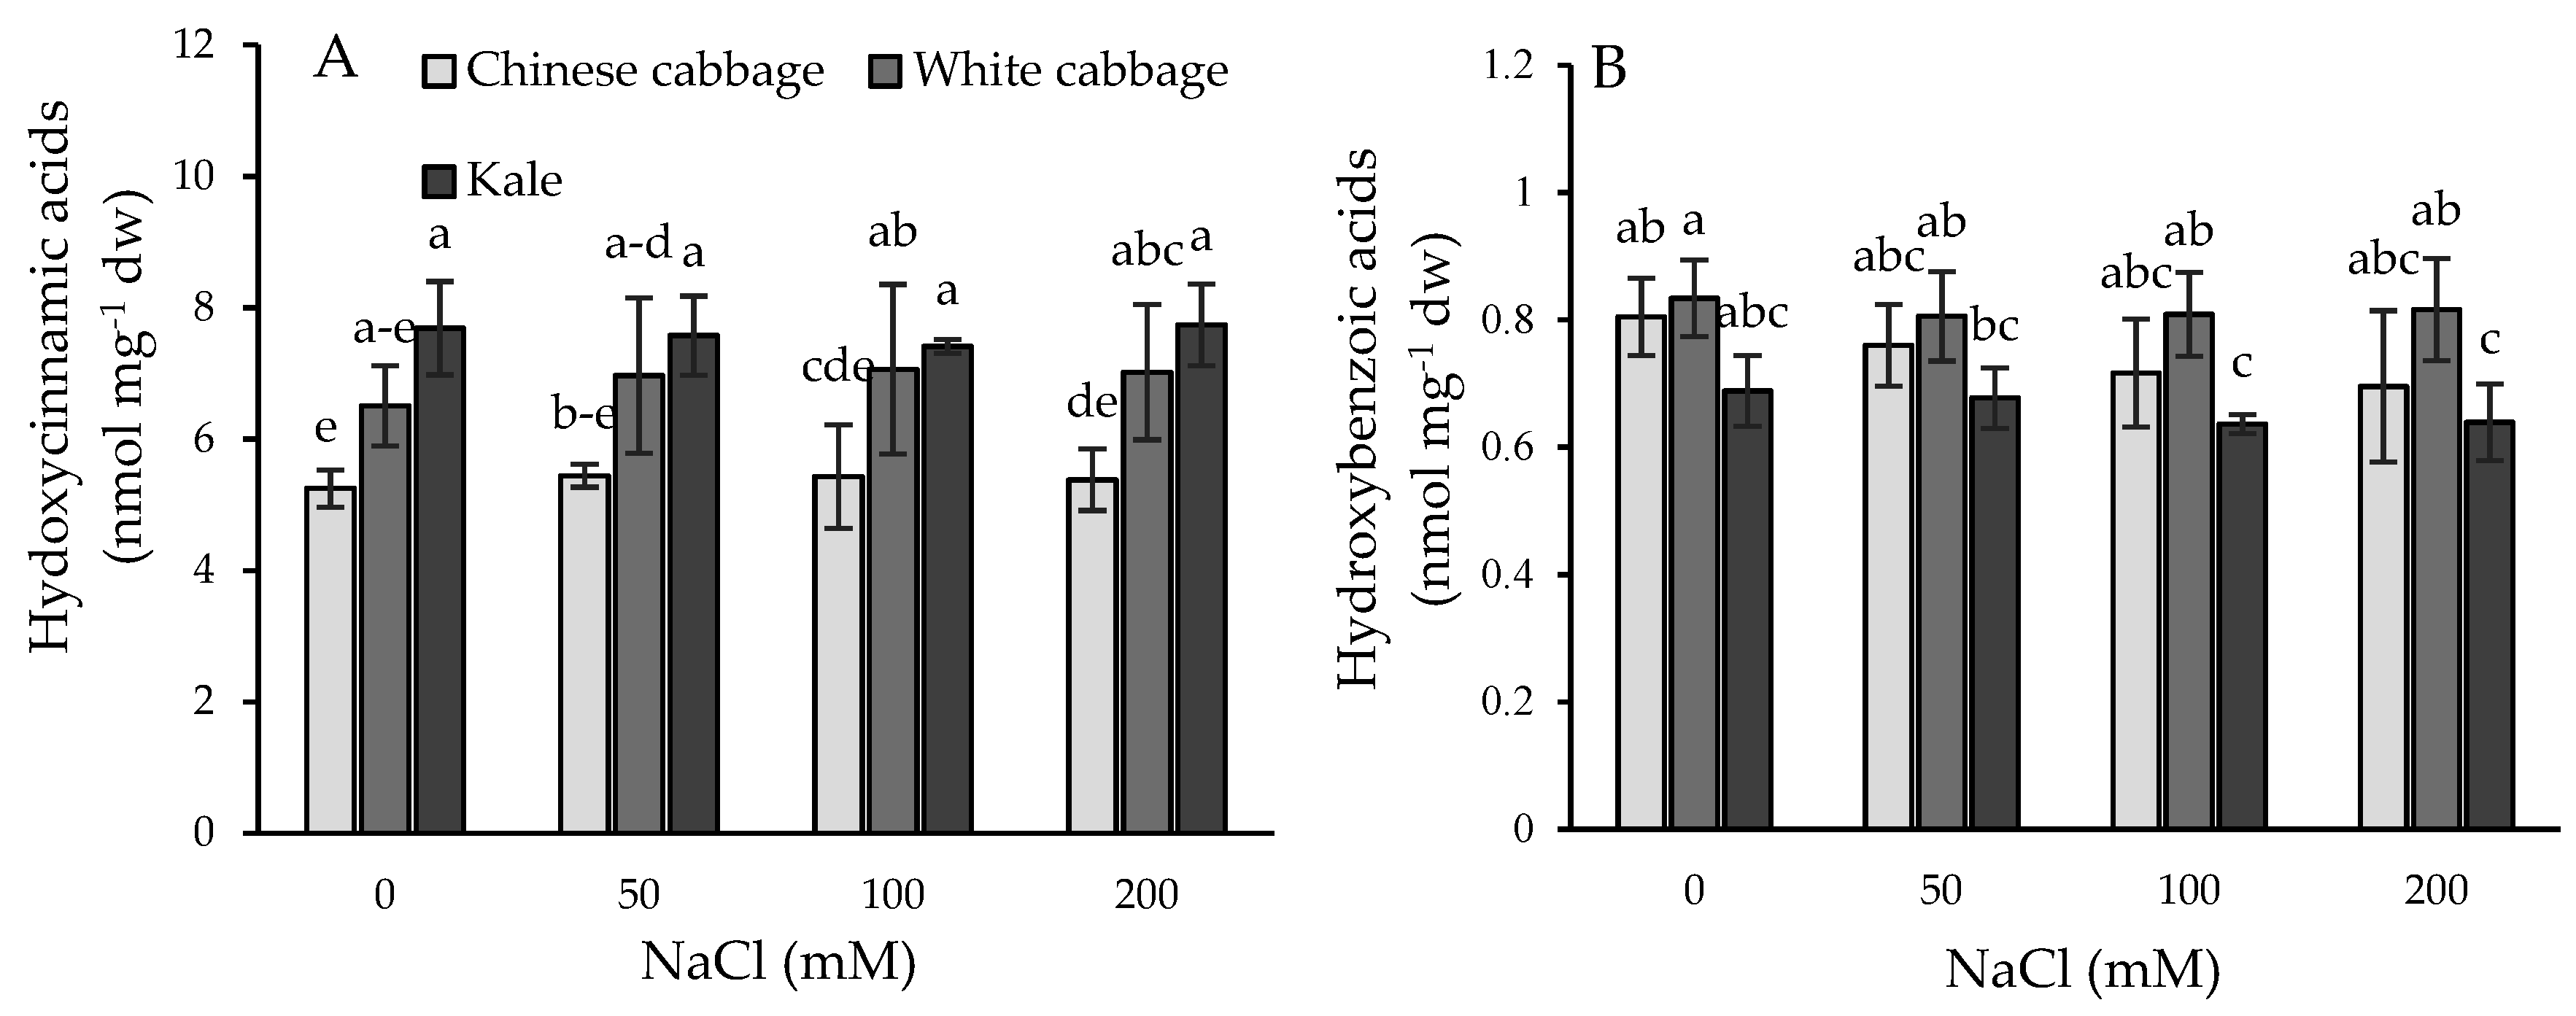
2.4. Phenolic Acid Profiles and Their Dynamic under Salinity Stress Conditions
3. Discussion
3.1. Stress Status of Seedlings: Physiological and Biochemical Parameters
3.2. Selected Metabolites Responsive to Salinity Stress
3.3. Phenolic Acids in Plant Stress Responses
4. Materials and Methods
4.1. Plant Material and Experimental Conditions
4.2. Determination of Sodium and Potassium Content
4.3. Proline Quantification
4.4. ROS and GSH Fluorescent Measurements
4.5. Pigment Content Determination
4.6. Glucosinolate Measurements
4.7. Determination of Polyphenolic Compounds
4.8. Principle Component Analysis (PCA)
4.9. Phenolic Acid Analyses
4.10. Statistical Analysis
5. Conclusions
Supplementary Materials
Author Contributions
Funding
Acknowledgments
Conflicts of Interest
References
- Zhang, X.; Lu, G.; Long, W.; Zou, Y.; Li, F.; Nishio, T. Recent progress in drought and salt tolerance studies in Brassica crops. Breed. Sci. 2014, 64, 60–73. [Google Scholar] [CrossRef] [PubMed]
- Munns, R.; Gilliham, M. Salinity tolerance of crops—What is the cost? New Phytol. 2015, 208, 668–673. [Google Scholar] [CrossRef] [PubMed]
- Daliakopoulos, I.N.; Panagea, I.S.; Tsanis, I.K.; Grillakis, M.G.; Koutroulis, A.G.; Hessel, R.; Mayor, A.G.; Ritsema, C.J. Yield response of Mediteranean rangelands under a changing climate. Land Degrad. Dev. 2017, 28, 1962–1972. [Google Scholar] [CrossRef]
- Iqbal, N.; Umar, S.; Khan, N.A. Nitrogen availability regulates proline and ethylene production and alleviates salinity stress in mustard (Brassica juncea). J. Plant Physiol. 2015, 178, 84–91. [Google Scholar] [CrossRef] [PubMed]
- Velasco, P.; Francisco, M.; Moreno, D.A.; Ferreres, F.; García-Viguera, C.; Cartea, M.E. Phytochemical fingerprinting of vegetable Brassica oleracea and Brassica napus by simultaneous identification of glucosinolates and phenolics. Phytochem. Anal. 2011, 22, 144–152. [Google Scholar] [CrossRef] [PubMed]
- Šamec, D.; Pavlović, I.; Salopek-Sondi, B. White cabbage (Brassica oleracea var. capitata f. alba): Botanical, phytochemical and pharmacologicall overwiev. Phytochem. Rev. 2017, 16, 117–135. [Google Scholar]
- Šamec, D.; Pavlović, I.; Radojčić Redovniković, I.; Salopek-Sondi, B. Comparative analysis of phytochemicals and activity of endogenous enzymes associated with their stability, bioavailability and food quality in five Brassicaceae sprouts. Food Chem. 2018, 269, 96–102. [Google Scholar] [CrossRef] [PubMed]
- Šamec, D.; Urlić, B.; Salopek-Sondi, B. Kale (Brassica oleracea var. acephala) as a superfood: Review of the scientific evidence behind the statement. Crit. Rev. Food Sci. Nutr. 2018, in press. [Google Scholar]
- Xiao, Z.; Rausch, S.; Luo, Y.; Sun, J.; Yu, L.; Wang, Q.; Chen, P.; Yu, L.; Stommel, J.R. Microgreens of Brassicaceae: Genetic diversity of phytochemical concentrations and antioxidant capacity. LWT Food Sci. Technol. 2019, 101, 731–737. [Google Scholar] [CrossRef]
- Cartea, M.E.; Velasco, P. Glucosinolates in Brassica foods: Bioavailability in food and significance for human health. Phytochem. Rev. 2008, 7, 213–229. [Google Scholar] [CrossRef]
- Cartea, M.E.; Francisco, M.; Soengas, P.; Velasco, P. Phenolic compounds in Brassica vegetables. Molecules 2011, 16, 251–280. [Google Scholar] [CrossRef]
- Raiola, A.; Errico, A.; Petruk, G.; Monti, D.M.; Barone, A.; Rigano, M.M. Bioactive compounds in Brassicaceae vegetables with a role in the prevention of chronic diseases. Molecules 2018, 23, 15. [Google Scholar] [CrossRef] [PubMed]
- Del Carmen Martínez-Ballesta, M.; Moreno, D.M.; Carvajal, M. The physiological importance of glucosinolates on plant response to abiotic stress in Brassica. Int. J. Mol. Sci. 2013, 14, 11607–11625. [Google Scholar] [CrossRef] [PubMed]
- Bose, J.; Rodrigo-Moreno, A.; Shabala, S. ROS homeostasis in halophytes in the context of salinity stress tolerance. J. Exp. Bot. 2014, 65, 1241–1257. [Google Scholar] [CrossRef] [PubMed]
- Ksouri, R.; Megdiche, W.; Debez, A.; Falleh, H.; Grignon, C.; Abdelly, C. Salinity effects on polyphenol content and antioxidant activities in leaves of the halophyte Cakile maritima. Plant Physiol. Biochem. 2007, 45, 244–249. [Google Scholar] [CrossRef]
- Goleniowski, M.; Bonfill, M.; Cusido, R.; Palazón, J. Phenolic acids. In Natural Products; Ramawat, K.G., Mérillon, J.M., Eds.; Springer: Berlin, Germany, 2013. [Google Scholar]
- Miura, K.; Tada, Y. Regulation of water, salinity, and cold stress responses by salicylic acid. Front. Plant Sci. 2014, 5, 4. [Google Scholar] [CrossRef]
- Kaur, H.; Bhardwaj, R.D.; Grewal, S.K. Mitigation of salinity-induced oxidative damage in wheat (Triticum aestivum L.) seedlings by exogenous application of phenolic acids. Acta Physiol. Plant. 2017, 39, 221–236. [Google Scholar] [CrossRef]
- Minh, L.T.; Khang, D.T.; Ha, P.T.T.; Tuyen, P.T.; Minh, T.N.; Quan, N.V.; Xuan, T.D. Effects of salinity stress on growth and phenolics of rice (Oryza sativa L.). Int. Lett. Nat. Sci. 2016, 57, 1–10. [Google Scholar] [CrossRef]
- Yan, K.; Zhao, S.; Bian, L.; Chen, X. Saline stress enhanced accumulation of leaf phenolics in honeysuckle (Lonicera japonica Thunb.) without induction of oxidative stress. Plant Physiol. Biochem. 2017, 112, 326–334. [Google Scholar] [CrossRef]
- Martinez, V.; Mestre, T.C.; Rubio, F.; Girones-Vilaplana, A.; Moreno, D.A.; Mittler, R.; Rivero, R.M. Accumulation of flavonols over hydroxycinnamic acids favors oxidative damage protection under abiotic stress. Front. Plant Sci. 2016, 7, 838. [Google Scholar] [CrossRef]
- Pavlović, I.; Mlinarić, S.; Tarkowská, D.; Oklestkova, J.; Novák, O.; Lepeduš, H.; Vujčić Bok, V.; Radić Brkanac, S.; Strnad, M.; Salopek-Sondi, B. Early Brassica crops responses to salinity stress: A comparative analysis between Chinese cabbage, white cabbage and kale. Front. Plant Sci. 2019, 10, 450. [Google Scholar] [CrossRef] [PubMed]
- Pavlović, I.; Pěnčík, A.; Novák, O.; Vujčić, V.; Radić Brkanac, S.; Lepeduš, H.; Strnad, M.; Salopek-Sondi, B. Short-term salt stress in Brassica rapa seedlings causes alterations in auxin metabolism. Plant Physiol. Biochem. 2018, 125, 74–84. [Google Scholar] [CrossRef] [PubMed]
- Liang, W.; Ma, X.; Wan, P.; Liu, L. Plant salt-tolerance mechanism: A review. Biochem. Biophys. Res. Commun. 2018, 495, 286–291. [Google Scholar] [CrossRef] [PubMed]
- Ashraf, M.; McNeilly, T. Salinity tolerance in Brassica oilseeds. Crit. Rev. Plant. Sci. 2004, 23, 157–174. [Google Scholar] [CrossRef]
- Munns, R.; James, R.A.; Gilliham, M.; Flowers, T.J.; Colmer, T.D. Tissue tolerance: An essential but elusive trait for salt-tolerant crops. Funct. Plant Biol. 2016, 43, 1103–1113. [Google Scholar] [CrossRef]
- Kishor, P.B.K.; Sreenivasulu, N. Is proline accumulation per se correlated with stress tolerance or is proline homeostasis a more critical issue? Plant Cell Environ. 2014, 37, 300–311. [Google Scholar] [CrossRef]
- Zaghdoud, C.; Carvajal, M.; Moreno, D.A.; Ferchichia, A.; Martínez-Ballesta, M.; Del, C. Health-promoting compounds of broccoli (Brassica oleracea L. var Italica) plants as affected by nitrogen fertilisation in projected future climatic change environments. J. Sci. Food Agric. 2016, 96, 392–403. [Google Scholar] [CrossRef]
- Yang, C.-W.; Zhang, M.-L.; Liu, J.; Shi, D.-C.; Wang, D.-L. Effects of buffer capacity on growth, photosynthesis, and solute accumulation of a glycophyte (wheat) and a halophyte (Chloris virgata). Photosynthetica 2009, 47, 55–60. [Google Scholar] [CrossRef]
- López-Berenguer, C.; Martínez-Ballesta, M.C.; García-Viguera, C.; Carvajal, M. Leaf water balance mediated by aquaporins under salt stress and associated glucosinolate synthesis in broccoli. Plant Sci. 2008, 174, 321–328. [Google Scholar] [CrossRef]
- Yuan, G.; Wang, X.; Guo, R.; Wang, Q. Effect of salt stress on phenolic compounds, glucosinolates, myrosinase and antioxidant activity in radish sprouts. Food Chem. 2010, 121, 1014–1019. [Google Scholar] [CrossRef]
- Aghajanzadeh, T.A.; Reich, M.; Kopriva, S.; De Kok, L.J. Impact of chloride (NaCl, KCl) and sulphate (Na2SO4, K2SO4) salinity on glucosinolate metabolism in Brassica rapa. J. Agro. Crop Sci. 2017, 204, 137–146. [Google Scholar] [CrossRef]
- Ksouri, R.; Ksouri, W.M.; Jallali, I.; Debez, A.; Magné, C.; Hiroko, I.; Abdelly, C. Medicinal halophytes: Potent source of health promoting biomolecules with medical, nutraceutical and food applications. Crit. Rev. Biotechnol. 2012, 32, 289–326. [Google Scholar] [CrossRef] [PubMed]
- Ksouri, R.; Smaoui, A.; Isoda, H.; Abdelly, C. Utilization of halophyte species as new sources of bioactive substances. J. Arid Land Stud. 2012, 22, 41–44. [Google Scholar]
- Cirillo, G.; Parisi, O.I.; Restuccia, D.; Puoci, F.; Picci, N. Antioxidant activity of phenolic acids: Correlation with chemical structure and in vitro assays for their analytical determination. In Phenolic Acids: Composition, Applications and Health Benefits; Munné-Bosch, S., Ed.; Nova Science Publishers Inc.: New York, NY, USA, 2012; pp. 1–33. [Google Scholar]
- Michalak, A. Phenolic compounds and their antioxidant activity in plants growing under heavy metal stress. Polish J. Environ. Stud. 2006, 15, 523–530. [Google Scholar]
- Cvetković, B.R.; Pezo, L.L.; Mišan, A.; Mastilović, J.; Kevrešan, Ž.; Ilić, N.; Filipčev, B. The effects of osmotic dehydration of white cabbage on polyphenols and mineral content. LWT 2019, in press. [Google Scholar] [CrossRef]
- Nouraei, S.; Rahimmalek, M.; Saeidi, G. Variation in polyphenolic composition, antioxidants and physiological characteristics of globe artichoke (Cynara cardunculus var. scolymus Hayek L.) as affected by drought stress. Sci. Hort. 2018, 233, 378–385. [Google Scholar] [CrossRef]
- Ayaz, F.A.; Hayırlıoglu-Ayaz, S.; Alpay-Karaoglu, S.; Grúz, J.; Valentová, K.; Ulrichová, J.; Strnad, M. Phenolic acid contents of kale (Brassica oleraceae L. var. acephala DC.) extracts and their antioxidant and antibacterial activities. Food Chem. 2008, 107, 19–25. [Google Scholar] [CrossRef]
- Bhinu, V.-S.; Ulrike, A.; Schäfer, U.A.; Li, R.; Huang, J.; Hannoufa, A. Targeted modulation of sinapine biosynthesis pathway for seed quality improvement in Brassica napus. Transgenic Res. 2009, 18, 31–44. [Google Scholar] [CrossRef]
- Oszmiański, J.; Kolniak-Ostek, J.; Wojdyło, A. Application of ultra performance liquid chromatography photodiode detector-quadrupole/time of flight-mass spectrometry (UPLC-PDA-Q/TOF-MS) method for the characterization of phenolic compounds of Lepidium sativum L. sprouts. Eur. Food Res. Technol. 2013, 236, 699–706. [Google Scholar]
- Gupta, P.; De, B. Differential responses of cell wall bound phenolic compounds in sensitive and tolerant varieties of rice in response to salinity. Plant Signal. Behav. 2017, 10, e1379643. [Google Scholar] [CrossRef]
- Sabra, A.; Adam, L.; Daayf, F.; Renault, S. Salinity-induced changes in caffeic acid derivatives, alkamides and ketones in three Echinacea species. Environ. Exp. Bot. 2012, 77, 234–241. [Google Scholar] [CrossRef]
- Piazzon, A.; Vrhovsek, U.; Masuero, D.; Mattivi, F.; Mandoj, F.; Nardini, M. Antioxidant activity of phenolic acids and their metabolites: synthesis and antioxidant properties of the sulfate derivatives of ferulic and caffeic acids and of the acyl glucuronide of ferulic acid. J. Agric. Food Chem. 2012, 60, 12312–12323. [Google Scholar] [CrossRef]
- Razzaghi-As, N.; Garrido, J.; Khazraei, H.; Borges, F.; Firuzi, O. Antioxidant properties of hydroxycinnamic acids: A review of structure-activity relationships. Curr. Med. Chem. 2013, 20, 4436–4450. [Google Scholar] [CrossRef]
- Nićiforović, N.; Abramovič, H. Sinapic acid and its derivatives: Natural sources and bioactivity. Compr. Rev. Food Sci. Food Saf. 2014, 13, 34–51. [Google Scholar] [CrossRef]
- Hasanuzzaman, M.; Nahar, K.; Bhuiyan, T.F.; Anee, T.I.; Inafuku, M.; Oku, H.; Fujita, M. Salicylic acid: An all-rounder in regulating abiotic stress responses in plants. In Phytohormones—Signaling Mechanisms and Crosstalk in Plant Development and Stress Responses; El-Esawi, M., Ed.; IntechOpen: London, UK, 2017; pp. 31–75. [Google Scholar]
- Jayakannan, M.; Bose, J.; Babourina, O.; Rengel, Z.; Shabala, S. Salicylic acid in plant salinity stress signalling and tolerance. Plant Growth Regul. 2015, 76, 25–40. [Google Scholar] [CrossRef]
- Fiket, Ž.; Mikac, N.; Kniewald, G. Mass fractions of forty-six major and trace elements, including rare earth elements, in sediment and soil reference materials used in environmental studies. Geostand. Geoanal. Res. 2016, 41, 123–135. [Google Scholar] [CrossRef]
- Carillo, P.; Gibon, Z.; PrometheusWiki Contributors. Extraction and Determination of Proline. Available online: http://tiki-pagehistory.php?page=Extraction and determination of proline&preview=14. (accessed on 31 May 2011).
- Radić Brkanac, S.; Gerić, M.; Gajski, G.; Vujčić, V.; Garaj-Vrhovac, V.; Kremer, D.; Domijan, A.-M. Toxicity and antioxidant capacity of Frangula alnus Mill. Bark and its active component emodin. Regul. Toxicol. Pharmacol. 2015, 73, 923–929. [Google Scholar] [CrossRef] [PubMed]
- Lichtenthaler, H.K.; Buschmann, C. Chlorophylls and carotenoids: measurement and characterization by UV–VIS spectroscopy. In Current Protocols in Food Analytical Chemistry; John Wiley & Sons Inc.: Hoboken, NJ, USA, 2001. [Google Scholar]
- Aghajanzadeh, T.A.; Hawkesford, M.J.; De Kok, L.J. The significance of glucosinolates for sulfur storage in Brassicaceae seedlings. Front. Plant Sci. 2014, 5, 704. [Google Scholar] [CrossRef]
- Singleton, V.L.; Rossi, J.A. Colorimetry of total phenolics witphosphomolybdic–phosphotungstic acid reagents. Am. J. Enol. Vitic. 1965, 16, 144–158. [Google Scholar]
- European Pharmacopoeia, 4th ed.; Council of Europe: Strasbourg, France, 2004; pp. 2377–2378.
- Zhishen, J.; Mengcheng, T.; Jianming, W. The determination of flavonoid contents in mulberry and their scavenging effects on superoxide radicals. Food Chem. 1999, 64, 555–559. [Google Scholar] [CrossRef]
- Šamec, D.; Bogović, M.; Vincek, D.; Martinčić, J.; Salopek-Sondi, B. Assessing the authenticity of the white cabbage (Brassica oleracea var. capitata f. alba) cv. ‘Varaždinski’ by molecular and phytochemical markers. Food Res. Int. 2014, 60, 266–272. [Google Scholar]
- Gruz, J.; Ayaz, F.A.; Torun, H.; Strnad, M. Phenolic acid content and radical scavenging activity of extracts from medlar (Mespilus germanica L.) fruit at different stages of ripening. Food Chem. 2011, 124, 271–277. [Google Scholar] [CrossRef]
- Gruz, J.; Novák, O.; Strnad, M. Rapid analysis of phenolic acids in beverages by UPLC–MS/MS. Food Chem. 2008, 111, 789–794. [Google Scholar] [CrossRef]
| Brassica crop | NaCl (mM) | Chl a | Chl b | Total chl | Chl a/Chl b |
|---|---|---|---|---|---|
| Chinese cabbage | 0 | 0.42 ± 0.04 d | 0.17 ± 0.03 c | 0.59 ± 0.07 c | 2.48 ± 0.24 a |
| 50 | 0.49 ± 0.03 bcd | 0.19 ± 0.01 bc | 0.68 ± 0.04 de | 2.54 ± 0.09 a | |
| 100 | 0.64 ± 0.09 ab | 0.25 ± 0.04 abc | 0.89 ± 0.14 abcd | 2.60 ± 0.03 a | |
| 200 | 0.45 ± 0.07 cd | 0.22 ± 0.03 bc | 0.67 ± 0.06 de | 2.07 ± 0.52 ab | |
| White cabbage | 0 | 0.49 ± 0.02 bcd | 0.25 ± 0.05 abc | 0.74 ± 0.07 bcde | 2.00 ± 0.35 ab |
| 50 | 0.53 ± 0.06 abcd | 0.24 ± 0.04 abc | 0.78 ± 0.09 abcde | 2.20 ± 0.21 ab | |
| 100 | 0.68 ± 0.08 a | 0.33 ± 0.05 a | 1.00 ± 0.12 a | 2.09 ± 0.28 ab | |
| 200 | 0.49 ± 0.09 bcd | 0.20 ± 0.04 bc | 0.69 ± 0.14 cde | 2.48 ± 0.06 a | |
| Kale | 0 | 0.62 ± 0.08 abc | 0.27 ± 0.03 ab | 0.89 ± 0.11 abcd | 2.33 ± 0.27 ab |
| 50 | 0.69 ± 0.05 a | 0.27 ± 0.01 ab | 0.95 ± 0.03 ab | 2.57 ± 0.32 a | |
| 100 | 0.62 ± 0.03 abc | 0.24 ± 0.02 abc | 0.86 ± 0.05 abcd | 2.56 ± 0.18 a | |
| 200 | 0.59 ± 0.05 abcd | 0.34 ± 0.02 a | 0.92 ± 0.07 abc | 1.76 ± 0.07 b |
| Compound (Abbreviation) | RT | MRM | Chinese Cabbage | White Cabbage | Kale |
|---|---|---|---|---|---|
| min | m/z | pmol mg−1 dw | |||
| protocatechuic acid (PA) | 3.84 | 153 > 109 | 79.13 ± 4.17b | 173.79 ± 39.78a | 136.92 ± 15.84a |
| galic acid (GaA) | 2.64 | 153 > 109 | 65.49 ± 9.26b | 124.03 ± 11.81a | 118.66 ± 6.65a |
| 4-hydroxybenzoic acid (pHBA) | 4.84 | 137 > 93 | 120.03 ± 29.46b | 174.89 ± 16.07a | 147.07 ± 8.58ab |
| vanillic acid (VA) | 5.44 | 167 > 152 | 291.96 ± 37.29a | 142.38 ± 26.87b | 153.14 ± 14.22b |
| caffeic acid (CaA) | 5.37 | 179 > 135 | 34.19 ± 5.23c | 51.30 ± 2.35b | 149.61 ± 9.53a |
| syringic acid (SyA) | 5.64 | 197 > 182 | 72.60 ± 10.41b | 98.61 ± 11.01a | 51.13 ± 4.86c |
| 4-coumaric acid (pCoA) | 6.55 | 163 > 119 | 127.83 ± 34.47a | 178.18 ± 47.41a | 189.08 ± 23.25a |
| sinapic acid (SiA) | 7.05 | 223 > 208 | 4834.88 ± 290.75c | 5807.30 ± 677.05b | 7073.88 ± 669.84a |
| ferulic acid (FA) | 7.14 | 193 > 178 | 253.02 ± 14.59b | 469.18 ± 95.30a | 275.67 ± 29.17b |
| salicylic acid (SA) | 8.25 | 137 > 93 | 175.62 ± 46.53a | 120.49 ± 24.20b | 81.78 ± 4.17b |
| Total | 6054.78 ± 249.04c | 7340.17 ± 621.87b | 8376.94 ± 707.89a | ||
| Chinese Cabbage | White Cabbage | Kale | |||||||||||
|---|---|---|---|---|---|---|---|---|---|---|---|---|---|
| Treatments (NaCl mM) | |||||||||||||
| 0 | 50 | 100 | 200 | 0 | 50 | 100 | 200 | 0 | 50 | 100 | 200 | ||
| PA | SF | 9.45 ± 3.01a | 9.97 ± 0.66a | 10.02 ± 1.16a | 5.35 ± 1.85b | 18.33 ± 6.15a | 11.78 ± 4.96a | 11.46 ± 4.21a | 11.70 ± 4.14a | 2.61 ± 0.48a | 2.08 ± 0.63a | 2.47 ± 1.18a | 2.58 ± 1.60a |
| SC | 69.68 ± 1.49ab | 72.37 ± 7.17ab | 74.61 ± 5.77a | 63.20 ± 5.50b | 155.46 ± 31.01a | 149.93 ± 3.26a | 148.82 ± 34.63a | 143.58 ± 36.55a | 134.31 ± 14.26a | 129.72 ± 11.93a | 128.16 ± 4.81a | 125.49 ± 12.57a | |
| CWB | ND | ND | ND | ND | ND | ND | ND | ND | ND | ND | ND | ND | |
| Total | 79.13 ± 4.17ab | 82.34 ± 8.03a | 84.6 3± 7.15a | 68.55 ± 7.45b | 173.79 ± 9.78a | 161.71 ± 44.67a | 160.28 ± 42.55a | 155.28 ± 42.82a | 136.92 ± 15.84a | 131.81 ± 13.81a | 130.63 ± 5.99a | 128.07 ± 12.73a | |
| GaA | SF | ND | ND | ND | ND | ND | ND | ND | ND | ND | ND | ND | ND |
| SC | 65.49 ± 9.26a | 65.00 ± 10.34a | 64.13 ± 11.11a | 57.62 ± 9.65a | 124.03 ± 11.81a | 118.62 ± 9.89a | 124.81 ± 9.28a | 126.85 ± 15.24a | 118.66 ± 6.65a | 111.73 ± 19.38a | 107.32 ± 7.30a | 104.56 ± 13.73a | |
| CWB | ND | ND | ND | ND | ND | ND | ND | ND | ND | ND | ND | ND | |
| Total | 65.49 ± 9.26a | 65.00 ± 10.34a | 64.13 ± 11.11a | 57.62 ± 9.65a | 124.03 ± 11.81 a | 118.62 ± 9.89a | 124.81 ± 9.28a | 126.85 ± 15.24a | 118.66 ± 6.65a | 111.73 ± 19.38a | 107.32 ± 7.30a | 104.56 ± 13.73a | |
| pHBA | SF | 7.24 ± 3.31a | 12.22 ± 3.29a | 6.77 ± 1.42a | 10.11 ± 4.35a | 10.91 ± 2.98a | 8.96 ± 2.11a | 10.06 ± 0.95a | 13.08 ± 5.76a | 6.18 ± 1.67a | 5.96 ± 0.34a | 7.92 ± 3.53a | 8.24 ± 3.17a |
| SC | 112.80 ± 23.13a | 120.58 ± 6.49a | 109.28 ± 7.96a | 119.38 ± 11.29a | 163.99 ± 11.73a | 170.94 ± 14.42a | 178.47 ± 15.51a | 182.81 ± 16.37a | 140.89 ± 6.28a | 134.89 ± 3.32a | 127.84 ± 5.79a | 139.51 ± 11.58a | |
| CWB | ND | ND | ND | ND | ND | ND | ND | ND | ND | ND | ND | ND | |
| Total | 120.03 ± 29.46a | 132.80 ± 9.19a | 116.05 ± 9.52a | 129.50 ± 15.73a | 174.89 ± 16.07a | 179.90 ± 16.64a | 188.54 ± 17.71a | 195.89 ± 17.97a | 147.07 ± 8.58a | 140.85 ± 3.92a | 135.76 ± 9.82a | 147.75 ± 12.42a | |
| VA | SF | ND | ND | ND | ND | ND | ND | ND | ND | ND | ND | ND | ND |
| SC | 291.96 ± 37.30a | 263.46 ± 25.38a | 248.10 ± 33.25a | 305.44 ± 69.14a | 142.38 ± 26.87a | 126.06 ± 20.67a | 135.85 ± 13.34a | 149.09 ± 24.58a | 153.14 ± 14.22a | 155.80 ± 15.55a | 141.84 ± 5.46a | 146.49 ± 15.73a | |
| CWB | ND | ND | ND | ND | ND | ND | ND | ND | ND | ND | ND | ND | |
| Total | 291.96 ± 37.30a | 263.46 ± 25.38a | 248.10 ± 33.25a | 305.44 ± 69.14a | 142.38 ± 26.87a | 126.06 ± 20.67a | 135.85 ± 13.34a | 149.09 ± 24.58a | 153.14 ± 14.22a | 155.80 ± 15.55a | 141.84 ± 5.46a | 146.49 ± 15.73a | |
| CaA | SF | ND | ND | ND | ND | ND | ND | ND | ND | ND | ND | ND | ND |
| SC | 34.19 ± 5.23a | 26.98 ± 1.93b | 25.76 ± 3.29b | 21.62 ± 1.79b | 51.30 ± 2.35a | 47.37 ± 7.79a | 47.55 ± 3.39a | 47.34 ± 3.84a | 149.61 ± 9.53a | 141.03 ± 10.98ab | 124.15 ± 10.93bc | 114.07 ± 14.78c | |
| CWB | ND | ND | ND | ND | ND | ND | ND | ND | ND | ND | ND | ND | |
| Total | 34.19 ± 5.23a | 26.98 ± 1.93b | 25.76 ± 3.29b | 21.62 ± 1.79b | 51.30 ± 2.35a | 47.37 ± 7.79a | 47.55 ± 3.39a | 47.34 ± 3.84a | 149.61 ± 9.53a | 141.03 ± 10.98ab | 124.15 ± 10.93bc | 114.07 ± 14.78c | |
| SyA | SF | ND | ND | ND | ND | ND | ND | ND | ND | ND | ND | ND | ND |
| SC | 72.60 ± 10.41a | 68.48 ± 5.34a | 69.23 ± 8.66a | 72.08 ± 13.58a | 98.61 ± 11.01a | 98.98 ± 20.96a | 97.46 ± 13.57a | 97.63 ± 14.20a | 51.13 ± 4.86a | 51.13 ± 4.41a | 51.18 ± 3.73a | 53.28 ± 6.51a | |
| CWB | ND | ND | ND | ND | ND | ND | ND | ND | ND | ND | ND | ND | |
| Total | 72.60 ± 10.41a | 68.48 ± 5.34a | 69.23 ± 8.66a | 72.08 ± 13.58a | 98.61 ± 11.01a | 98.98 ± 20.96a | 97.46 ± 13.57a | 97.63 ± 14.20a | 51.13 ± 4.86a | 51.13 ± 4.41a | 51.18 ± 3.73a | 53.28 ± 6.51a | |
| pCoA | SF | 4.90 ± 2.92ab | 6.20 ± 1.19a | 2.46 ± 0.70b | 3.12 ± 0.95ab | 8.59 ± 3.24a | 5.43 ± 1.37a | 6.09 ± 1.63a | 5.30 ± 2.27a | 5.68 ± 2.41a | 3.11 ± 0.82a | 2.94 ± 1.48a | 3.23 ± 2.15a |
| SC | 116.74 ± 30.51a | 86.67 ± 15.09ab | 86.17 ± 20.10ab | 73.20 ± 10.40b | 147.45 ± 32.86a | 161.25 ± 17.85a | 163.84 ± 22.88a | 173.81 ± 38.67a | 177.90 ± 20.78a | 119.80 ± 19.58b | 110.65 ± 12.85bc | 81.52 ± 8.01c | |
| CWB | 6.20 ± 3.11a | 4.85 ± 1.70a | 3.23 ± 0.64a | 3.47 ± 0.74a | 22.14 ± 8.95a | 23.03 ± 7.08a | 23.33 ± 6.42a | 26.46 ± 11.17a | 6.64 ± 2.35a | 4.82 ± 0.89a | 5.14 ± 1.39a | 6.10 ± 1.38a | |
| Total | 127.84 ± 34.47a | 97.72 ± 15.96ab | 91.86 ± 23.06ab | 79.79 ± 11.04b | 178.18 ± 47.41a | 189.70 ± 22.79a | 193.26 ± 28.73a | 205.57 ± 45.73a | 189.08 ± 23.25a | 127.73 ± 23.28b | 118.15 ± 14.22bc | 90.85 ± 8.97c | |
| SiA | SF | 180.29 ± 42.77ab | 302.02 ± 100.08a | 153.78 ± 36.94b | 261.04 ± 101.60ab | 162.06 ± 59.92a | 102.26 ± 36.36a | 147.12 ± 44.28a | 111.45 ± 28.05a | 115.01 ± 93.67a | 81.62 ± 14.93a | 178.18 ± 236.05a | 335.75 ± 221.43a |
| SC | 4348.0 ± 334.00a | 4468.30 ± 112.11a | 4655.07 ± 674.13a | 4524.51 ± 522.53a | 5008.74 ± 613.86a | 5504.28 ± 1058.00a | 5562.21 ± 1278.82a | 5578.33 ± 1004.63a | 6475.78 ± 575.80a | 6511.83 ± 485.33a | 6289.38 ± 260.04a | 6492.59 ± 681.11a | |
| CWB | 306.55 ± 78.89a | 295.63 ± 107.36a | 257.14 ± 54.39a | 263.01 ± 84.34a | 636.51 ± 90.56a | 678.64 ± 119.39a | 666.02 ± 119.67a | 613.25 ± 128.86a | 483.09 ± 72.58a | 449.33 ± 77.03a | 427.39 ± 57.79a | 402.40 ± 91.84a | |
| Total | 4834.8 ± 290.75a | 5065.95 ± 163.74a | 5065.99 ± 728.55a | 5048.56 ± 468.03a | 5807.30 ± 677.05a | 6285.18 ± 1136.82a | 6375.35 ± 1373.16a | 6303.03 ± 1123.34a | 7073.88 ± 669.84a | 7042.78 ± 588.29a | 6894.94 ± 117.30a | 7230.73 ± 620.73a | |
| FA | SF | 20.15 ± 5.92a | 18.12 ± 1.96a | 15.99 ± 4.05a | 18.33 ± 3.53a | 7.12 ± 4.00a | 4.54 ± 1.41a | 5.82 ± 1.32a | 4.47 ± 2.32a | 1.46 ± 1.07b | 1.32 ± 0.71b | 1.47 ± 0.75b | 6.41 ± 3.38a |
| SC | 204.62 ± 10.90a | 211.87 ± 5.40a | 205.38 ± 29.09a | 187.82 ± 18.77a | 365.77 ± 58.68a | 368.83 ± 77.60a | 368.94 ± 63.52a | 378.25 ± 84.14a | 253.05 ± 22.47a | 237.43 ± 20.28a | 240.84 ± 15.96a | 261.17 ± 11.06a | |
| CWB | 28.25 ± 4.52a | 29.48 ± 8.75a | 23.96 ± 3.36a | 24.19 ± 3.25a | 99.14 ± 34.37a | 79.05 ± 27.59a | 77.82 ± 25.64a | 89.62 ± 27.38a | 30.04 ± 8.20a | 26.04 ± 3.46a | 31.34 ± 5.69a | 34.94 ± 8.60a | |
| Total | 253.02 ± 14.59a | 259.47 ± 9.93a | 245.33 ± 35.83a | 230.34 ± 21.64a | 469.18 ± 95.30a | 451.51 ± 108.24a | 451.42 ± 93.64a | 471.44 ± 118.46a | 284.55 ± 31.80a | 264.80 ± 24.00a | 273.66 ± 22.65a | 302.53 ± 17.81a | |
| SA | SF | 80.23 ± 21.57a | 70.81 ± 21.17a | 62.43 ± 13.86a | 25.97 ± 2.08b | 47.00 ± 11.33 a | 40.48 ± 4.90a | 36.59 ± 10.05a | 32.22 ± 9.40a | 27.08 ± 3.36a | 25.83 ± 6.41ab | 20.02 ± 0.73bc | 15.73 ± 2.01c |
| SC | 95.39 ± 25.08a | 77.29 ± 22.68a | 71.87 ± 9.72a | 36.48 ± 3.47b | 82.89 ± 14.84a | 79.94 ± 16.82a | 65.14 ± 8.00a | 58.75 ± 11.27a | 54.71 ± 3.44a | 50.22 ± 6.18a | 49.57 ± 6.17a | 43.47 ± 7.21a | |
| CWB | ND | ND | ND | ND | ND | ND | ND | ND | ND | ND | ND | ND | |
| Total | 175.62 ± 46.53a | 148.10 ± 42.60a | 134.30 ± 20.91a | 62.45 ± 4.49b | 120.49 ± 24.20a | 120.42 ± 24.12a | 101.73 ± 18.12a | 90.97 ± 22.07a | 81.78 ± 4.17a | 76.05 ± 10.45a | 69.58 ± 6.77ab | 59.21 ± 8.69b | |
© 2019 by the authors. Licensee MDPI, Basel, Switzerland. This article is an open access article distributed under the terms and conditions of the Creative Commons Attribution (CC BY) license (http://creativecommons.org/licenses/by/4.0/).
Share and Cite
Linić, I.; Šamec, D.; Grúz, J.; Vujčić Bok, V.; Strnad, M.; Salopek-Sondi, B. Involvement of Phenolic Acids in Short-Term Adaptation to Salinity Stress is Species-Specific among Brassicaceae. Plants 2019, 8, 155. https://doi.org/10.3390/plants8060155
Linić I, Šamec D, Grúz J, Vujčić Bok V, Strnad M, Salopek-Sondi B. Involvement of Phenolic Acids in Short-Term Adaptation to Salinity Stress is Species-Specific among Brassicaceae. Plants. 2019; 8(6):155. https://doi.org/10.3390/plants8060155
Chicago/Turabian StyleLinić, Ida, Dunja Šamec, Jiří Grúz, Valerija Vujčić Bok, Miroslav Strnad, and Branka Salopek-Sondi. 2019. "Involvement of Phenolic Acids in Short-Term Adaptation to Salinity Stress is Species-Specific among Brassicaceae" Plants 8, no. 6: 155. https://doi.org/10.3390/plants8060155
APA StyleLinić, I., Šamec, D., Grúz, J., Vujčić Bok, V., Strnad, M., & Salopek-Sondi, B. (2019). Involvement of Phenolic Acids in Short-Term Adaptation to Salinity Stress is Species-Specific among Brassicaceae. Plants, 8(6), 155. https://doi.org/10.3390/plants8060155


