Article

Involvement of Phenolic Acids in Short-Term Adaptation to Salinity Stress is Species-Specific among Brassicaceae

1
Department of Molecular Biology, Ruđer Bošković Institute, Bijenička c. 54, 10000 Zagreb, Croatia
2
Laboratory of Growth Regulators, Institute of Experimental Botany AS CR & Faculty of Science of the Palacký University, Šlechtitelů 27, CZ-78371 Olomouc, Czech Republic
3
Department of Botany, Faculty of Science, Rooseveltov trg 6, 10000 Zagreb, Croatia
*
Author to whom correspondence should be addressed.
Plants 2019, 8(6), 155; https://doi.org/10.3390/plants8060155
Submission received: 8 May 2019 / Revised: 24 May 2019 / Accepted: 4 June 2019 / Published: 6 June 2019

Abstract

:
Salinity is a major abiotic stress negatively affecting plant growth and consequently crop production. The effects of short-term salt stress were evaluated on seedlings of three globally important Brassica crops—Chinese cabbage (Brassica rapa ssp. pekinensis), white cabbage (Brassica oleracea var. capitata), and kale (Brassica oleracea var. acephala)—with particular focus on phenolic acids. The physiological and biochemical stress parameters in the seedlings and the levels of three main groups of metabolites (total glucosinolates, carotenoids, and phenolics) and individual phenolic acids were determined. The salt treatments caused a dose-dependent reduction in root growth and biomass and an increase in stress parameters (Na+/K+ ratio, reactive oxygen species (ROS) and glutathione (GSH)) in all seedlings but most prominently in Chinese cabbage. Based on PCA, specific metabolites grouped close to the more tolerant species, white cabbage and kale. The highest levels of phenolic acids, particularly hydroxycinnamic acids, were determined in the more tolerant kale and white cabbage. A reduction in caffeic, salicylic, and 4-coumaric acid was found in Chinese cabbage and kale, and an increase in ferulic acid levels was found in kale upon salinity treatments. Phenolic acids are species-specific among Brassicaceae, and some may participate in stress tolerance. Salt-tolerant varieties have higher levels of some phenolic acids and suffer less from metabolic stress disorders under salinity stress.

Graphical Abstract

1. Introduction

Soil salinity is an increasing problem in many areas worldwide, particularly in the semi-arid and arid Mediterranean [1,2]. Over 7% of the world’s total land and approximately 20% of irrigated land is affected by high salinity. As the extent of global soil salinization and drought events are expected to increase as a result of the global climate change [3], systematic research on salinity and drought stress tolerance mechanisms in plants and breeding tolerant crops is paramount for future food security. Salinity induces alterations in the growth and development of plants due to its cumulative effect on several physiological as well as biochemical processes such as water balance, mineral ion homeostasis, osmolyte accumulation, antioxidant metabolism, photosynthetic capacity of plants, etc. [4]. All these changes ultimately lead to huge economic losses in crop production.
Brassica vegetables (Brassicaceae) include many economically important species grown worldwide. These vegetables have received public and scientific attention for their health potential due to their wealth of “healthy phytochemicals” (carotenoids, phenolics, glucosinolates) [5,6,7,8,9]. They are recognized as a functional food since different epidemiological and meta-analyses have shown that metabolites found in Brassicas have anti-inflammatory, anti-oxidant, anti-mutagenic, and anti-carcinogenic activities [10,11,12].
As Brassica crops are commonly grown in the Mediterranean area, their production is greatly affected by unfavorable environmental conditions (abiotic stresses including increased salinity). Therefore, current pressing questions are, for example, how increased salinity affects the growth of commercially important Brassica crops and which of the metabolites in their tissues correlate with the tolerance to salinity of these species. These natural substances are the products of plant interaction with the environment, have limited occurrence, and some are reported to mediate abiotic stress tolerance. Their role is usually associated with protection against oxidative damage induced by abiotic stresses. However, their ecological value in plant adaption to the environment has been relatively poorly investigated. Glucosinolates, a class of specialized metabolites, almost exclusively found in Brassicaceae, have been shown to increase in plants when salinity is higher than the tolerance levels, while their production is inhibited under severe stress conditions that depend on plant species/variety [13]. Carotenoids and polyphenolic compounds are widely abundant in many plant species including Brassicaceae. Bose et al. summarized the current knowledge of the role of carotenoids and polyphenolic compounds in salinity tolerance using halophytes, a salinity-tolerant species, as a plant model for understanding complex salinity tolerance mechanisms [14]. The authors reported that halophytes have a higher concentration of carotenoids than glycophytes (a salinity-sensitive species) under control conditions and showed a much lower reduction in carotenoid concentration after salt treatment. In addition, halophytes, such as Cakile maritima, (Brassicaceae) accumulate polyphenolic compounds that participate in salinity tolerance due to reactive oxygen species (ROS) scavenging ability [15].
A group of phenolic compounds that may participate in abiotic stress responses are phenolic acids. Phenolic acids, including hydroxybenzoic and hydroxycinnamic acids, and their derivatives may be present in soluble forms in which they are conjugated with sugars or organic acids, as well as bound to more complex structures such as hydrolysable tannins or lignins [16]. There are reports of beneficial effects of the exogenous application of some phenolic acids to salinity-stressed plants. Miura and Tada reported that salicylic acid (SA) has great agronomic potential to improve the stress tolerance of various agriculturally important crops [17]. However, the applicability of SA is dependent on the concentration used, the mode of application, the plant species, and stage of growth. SA is a phenolic acid that acts as a stress hormone, mediating plant responses to biotic and abiotic stresses. In addition to SA, increased salinity tolerance of wheat seedlings was also obtained after treatment with sinapic, caffeic, ferulic, and p-coumaric acids [18]. Further, endogenous ferulic and p-coumaric acid are purported to be involved in the tolerant mechanism against salinity stress in rice [19]. Soil salinity also increased the concentrations of leaf phenolics, including chlorogenic acid, in honeysuckle as a mechanism for acclimation to saline stress [20]. Martinez et al. reported that cinnamic and p-coumaric acid and p-coumaryl-CoA, in addition to flavonols, were several times higher in tomato due to salinity, heat, and combined stress (heat + salinity) compared to control plants [21]. The role of phenolic acids in salinity tolerance is therefore still unclear, especially in Brassica crops, and needs further investigation.
Our recent paper, based on the comparative analysis of three Brassica crops with global economic importance, i.e., Chinese cabbage (Brassica rapa ssp. pekinensis), white cabbage (Brassica oleracea var. capitata), and kale (Brassica oleracea var. acephala) in relation to sensitivity/tolerance to salinity, identified Chinese cabbage as sensitive, white cabbage as mildly tolerant, and kale as the most tolerant species [22]. We have also shown that plant hormones play an important role in mediating salinity tolerance in the above Brassica crops [22,23]. In this article, we have extended our research and evaluated the effect of salinity on the levels of specialized metabolites in the same Brassica species (B. rapa spp. pekinensis, B. oleracea var. capitata, and B. oleracea var. acephala). We analyzed three groups of metabolites (carotenoids, glucosinolates, and phenolics) in three Brassica seedlings at increased salt concentrations (0–200 mM NaCl). More detailed analysis of phenolic acids was then carried out by UPLC–MS/MS. Our hypothesis was that differently tolerant Brassica species would respond diversely to salinity stress in terms of profile and phenolic acid levels. Correlation studies between Brassica crops with different tolerance to salinity stress and levels of specialized metabolites are also discussed, with a particular focus on phenolic acids.

2. Results

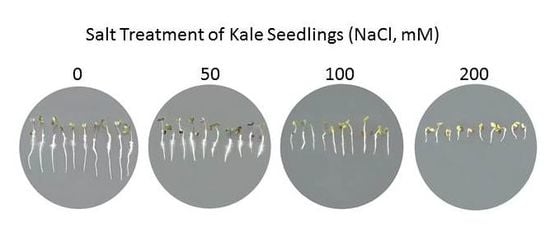
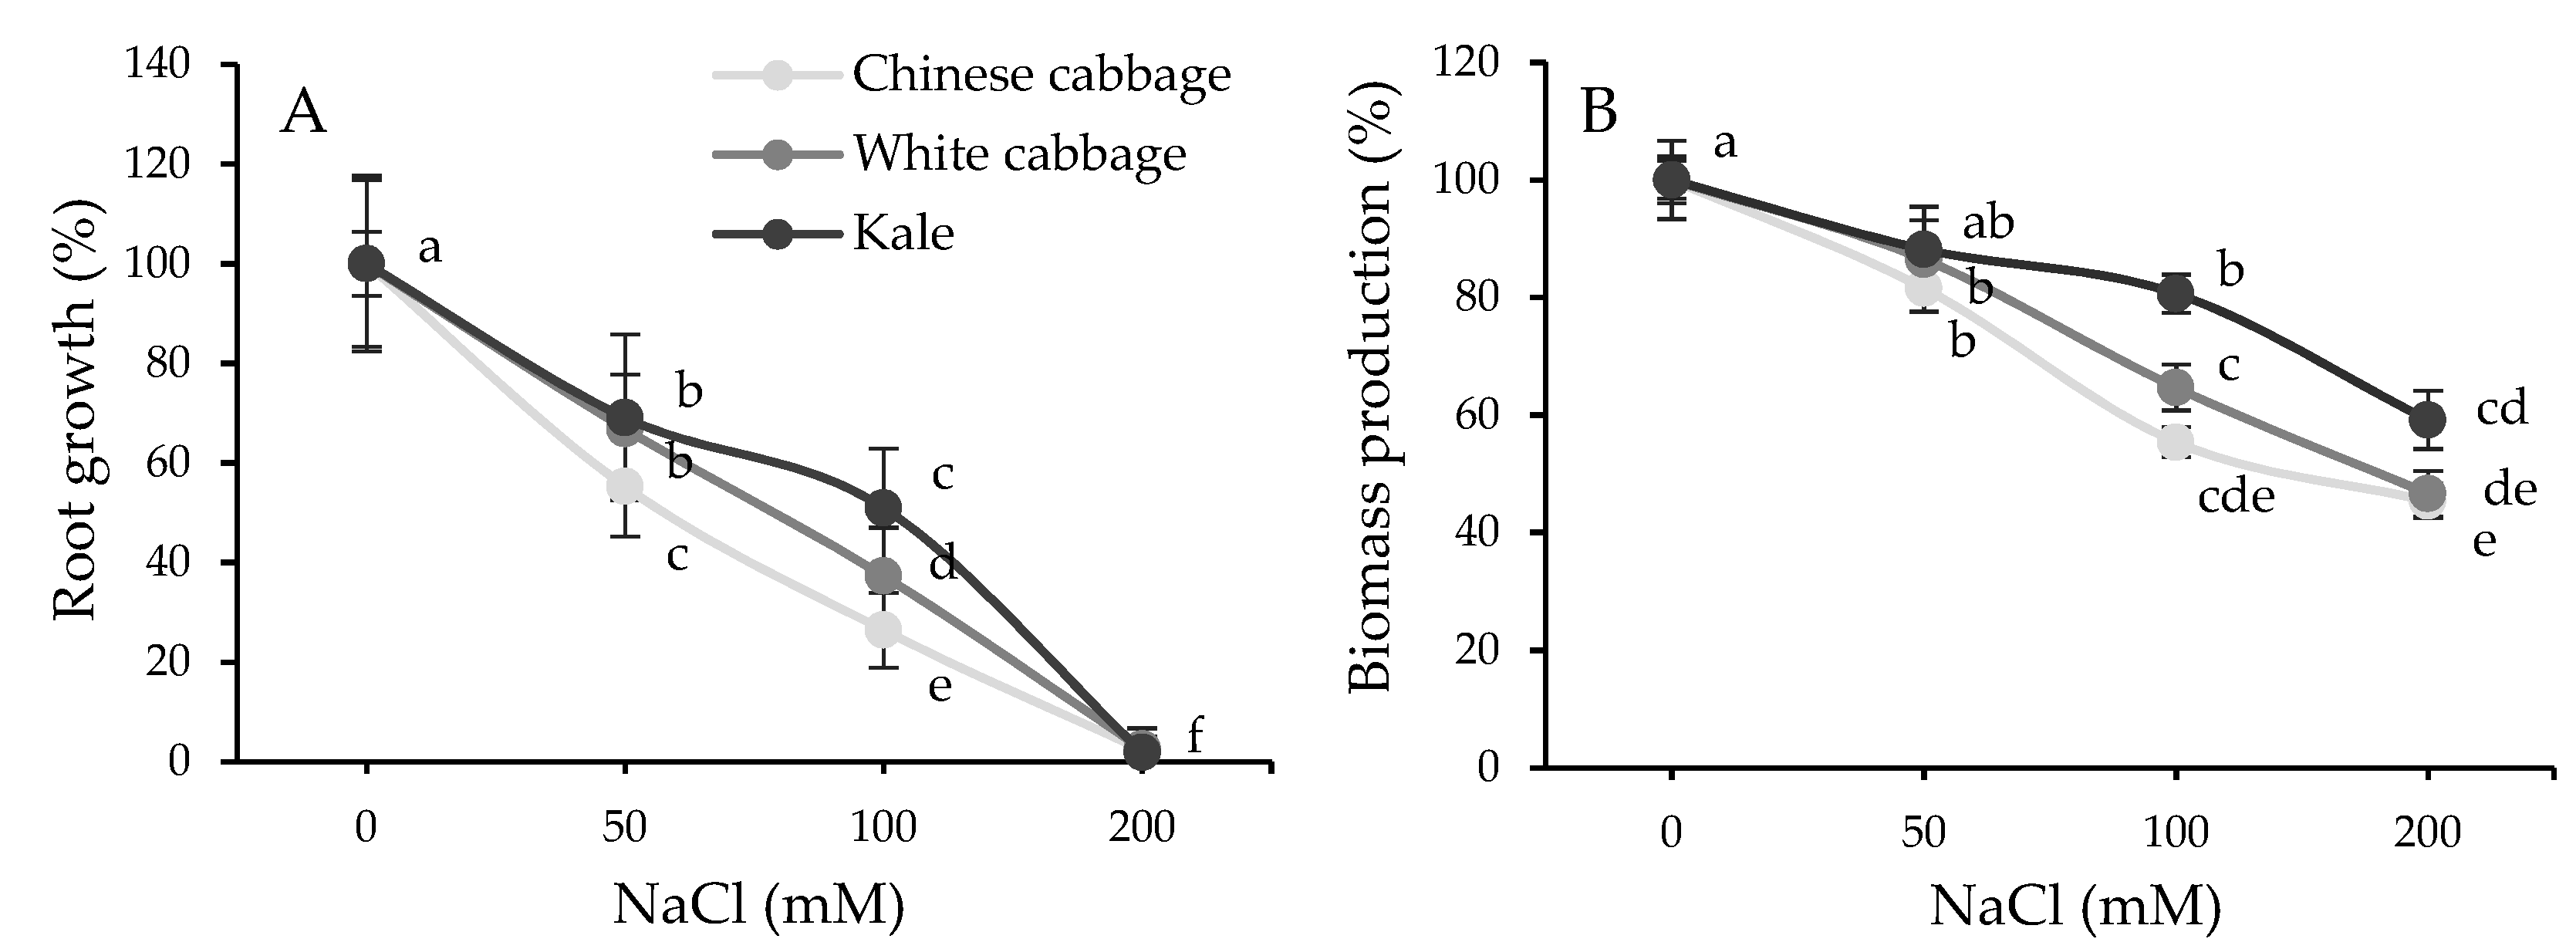
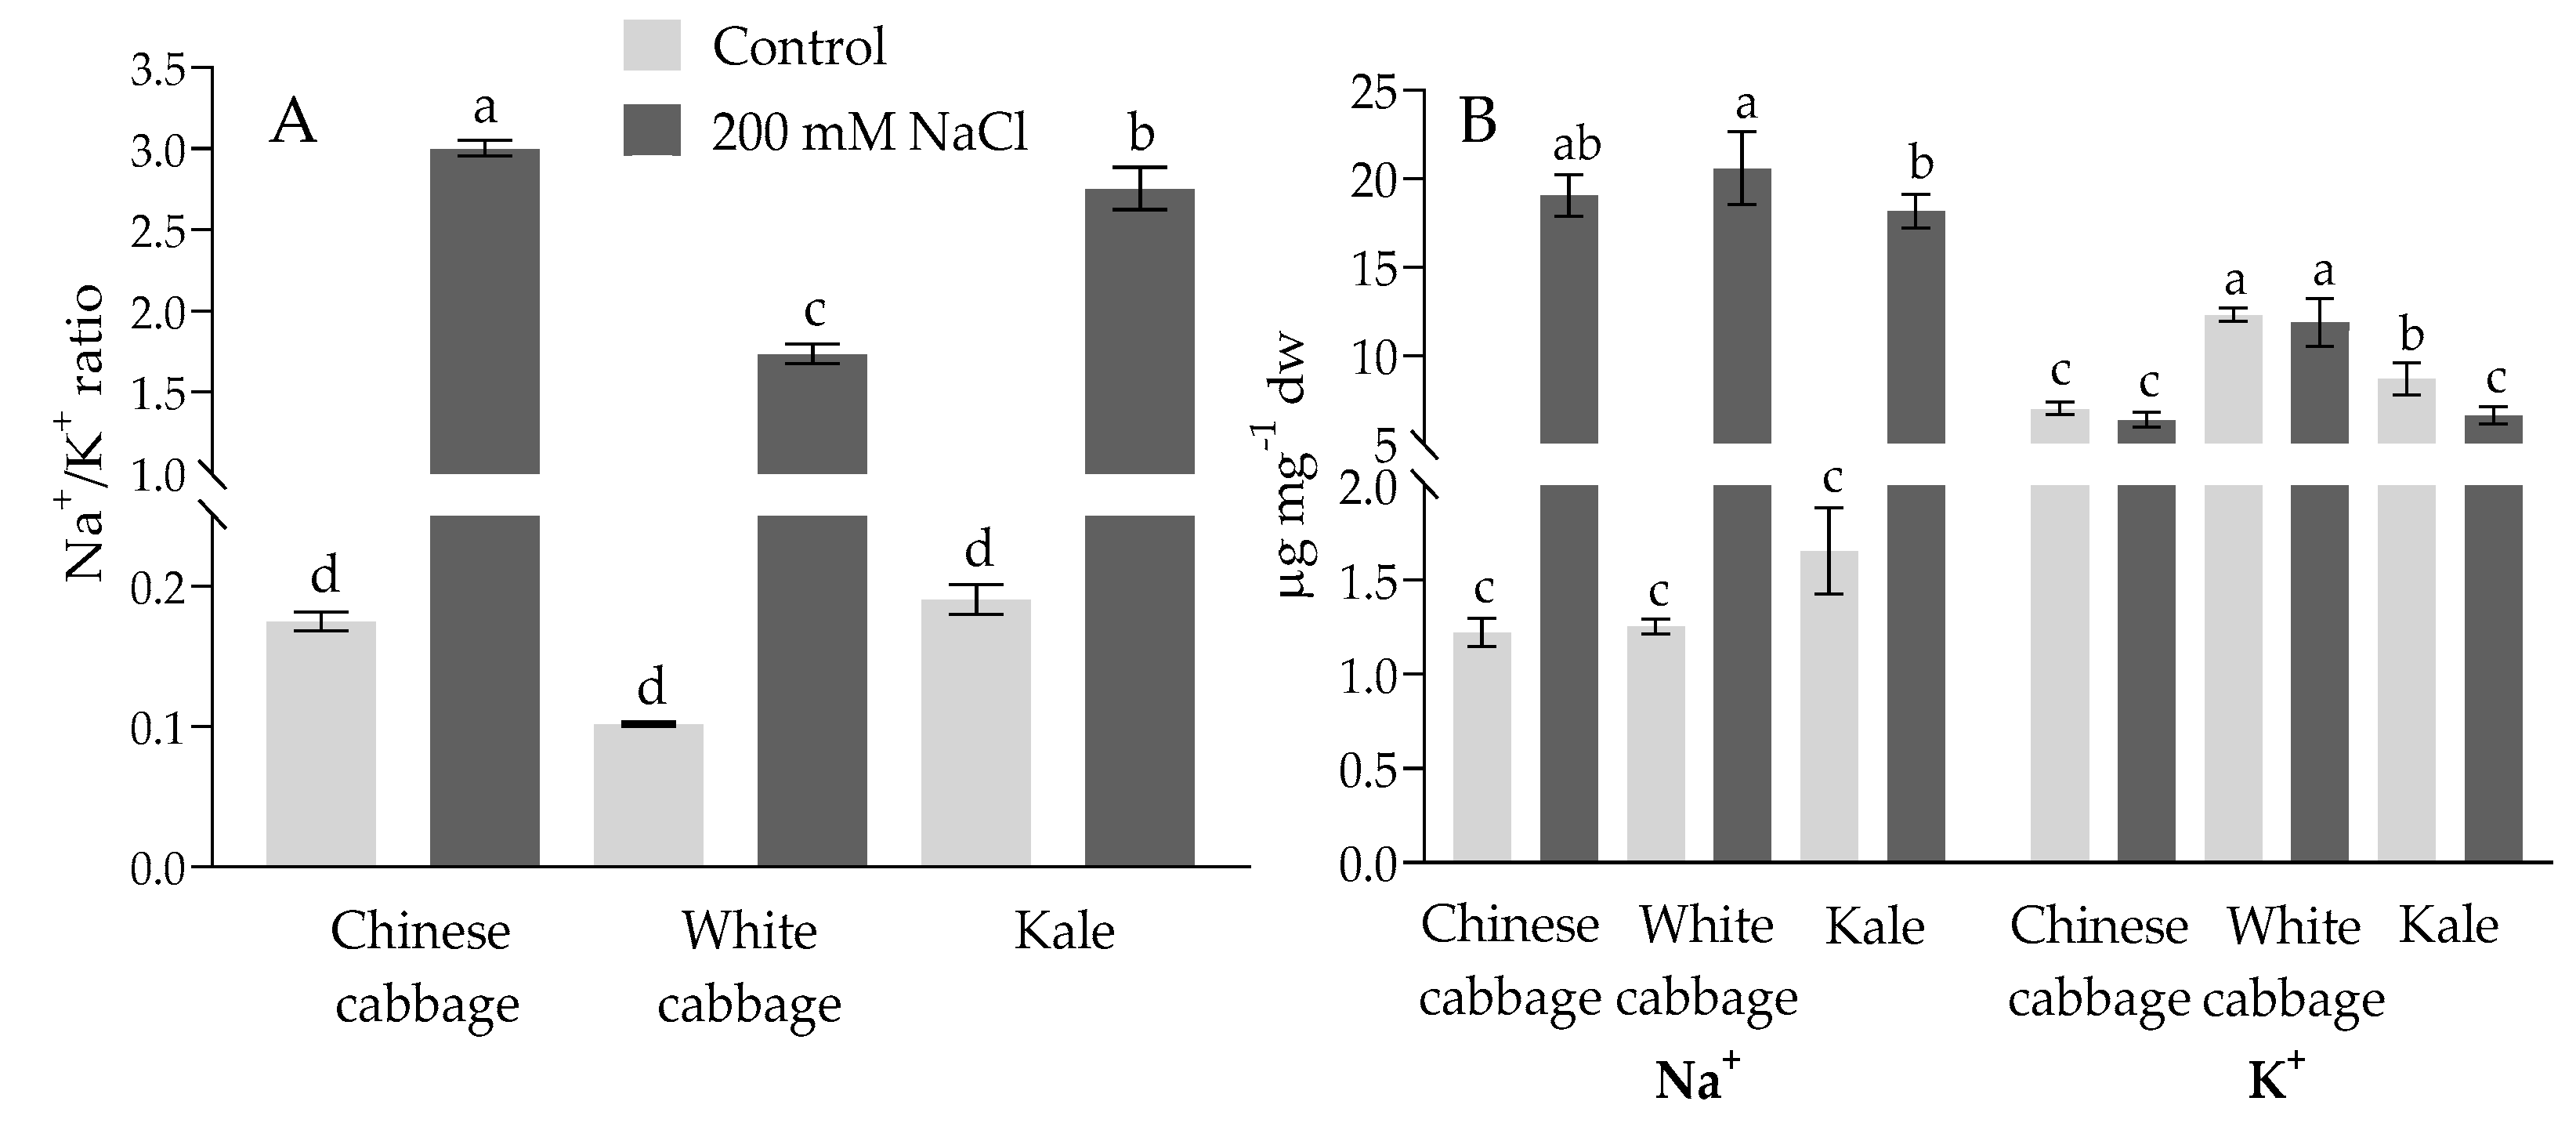
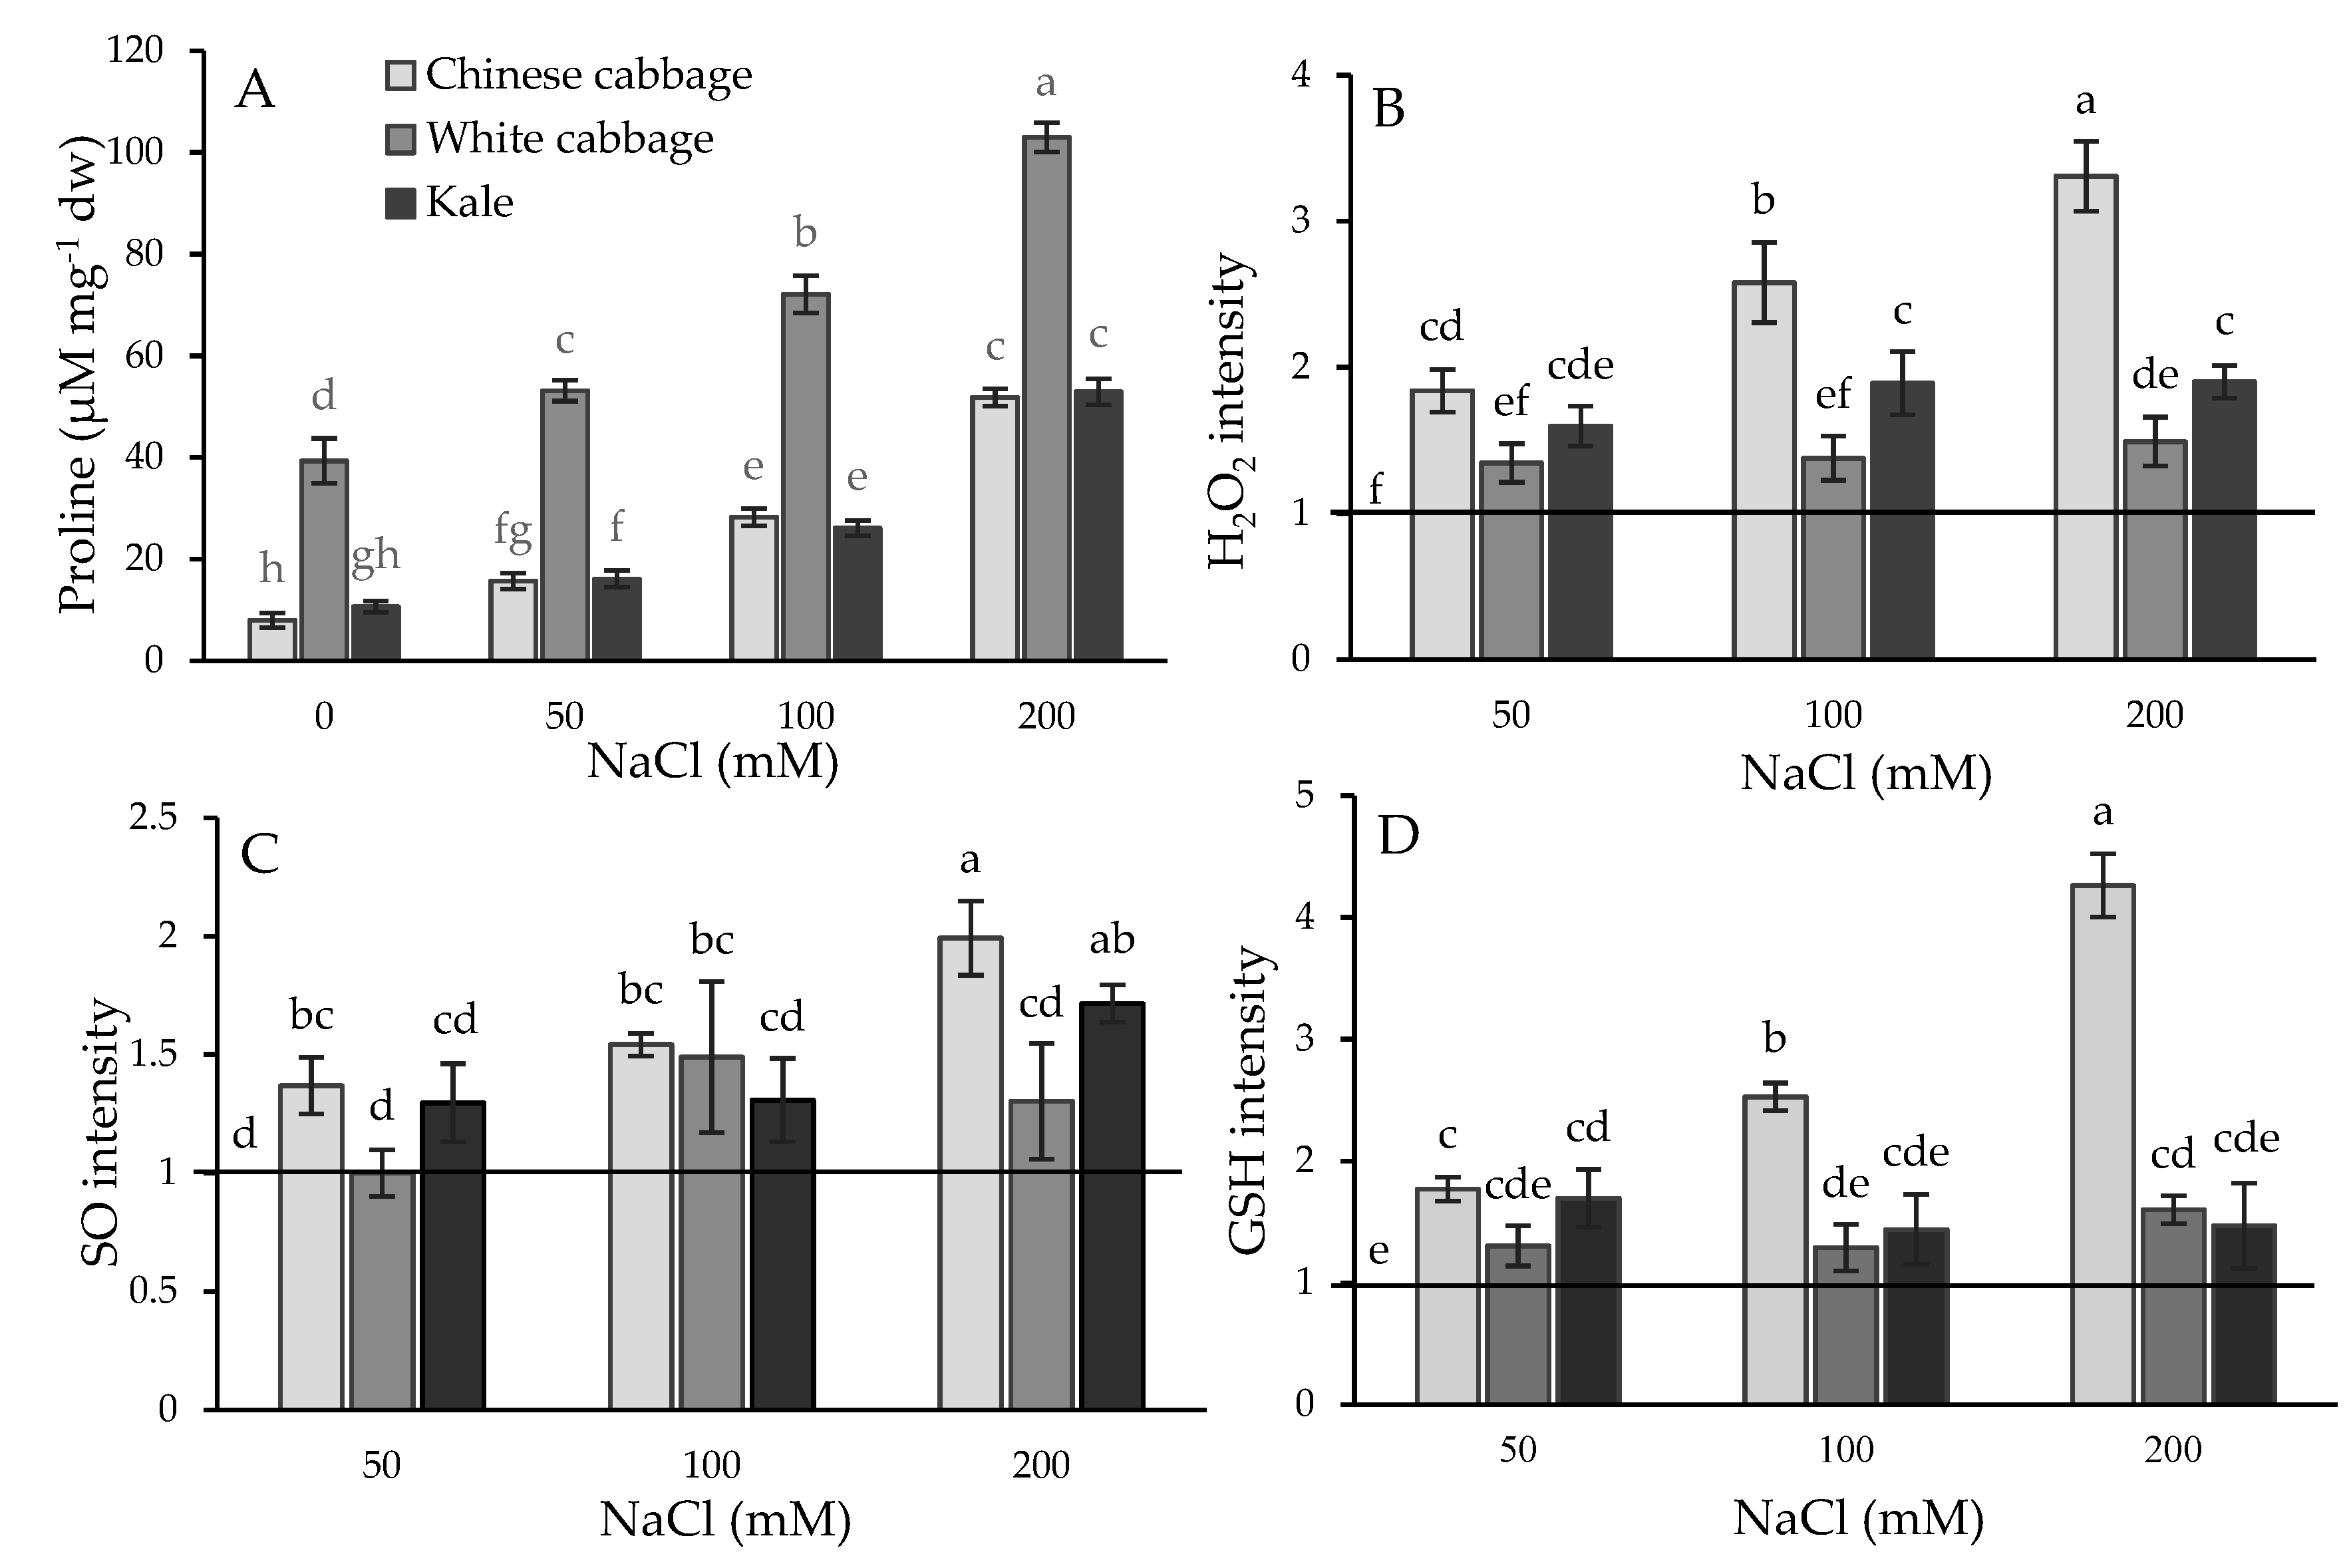
2.1. Physiological and Biochemical Response of Brassicas to Salinity Stress

The physiological effect of salt treatments was determined in planta by the root growth assay and biomass production measurements. As can be seen in Figure 1, seedling treatments with increasing NaCl concentrations caused a gradual inhibition of root growth (Figure 1A) as well as biomass production (Figure 1B) in all three Brassicas in a dose-dependent manner. The most significant reduction in biomass and root growth inhibition was observed in Chinese cabbage (B. rapa), then in white cabbage (B. oleracea var. capitata), and finally in kale (B. oleracea var. acephala). Thus, Chinese cabbage proved to be the most sensitive species, whereas kale was the most tolerant under our experimental conditions.
Na+ and K+ ion levels in Brassica seedlings are presented in Figure 2. As shown, white cabbage had the highest basal level of potassium (12.31 µg mg−1 dry weight (dw)), followed by kale (8.67 µg mg−1 dw) and Chinese cabbage (6.98 µg mg−1 dw), while sodium concentrations were similar in all three types of seedlings (between 1.2 and 1.6 µg mg−1 dw). Salt treatment (200 mM NaCl) did not significantly change the K+ level in white cabbage, though there was a drop in Chinese cabbage and kale in comparison to the control (Figure 2B). The Na+/K+ ratio increased in all three varieties on salinity, mainly due to increased Na+ concentration in seedlings (Figure 2A). The most marked increase in the Na+/K+ ratio was in Chinese and white cabbage (17.2- and 17.1-fold) and then kale (14.5-fold) compared to the controls.
In order to check the stress status of the treated seedlings, we measured the proline content and the ROS and glutathione (GSH) levels as biochemical stress markers (Figure 3). Interestingly, white cabbage had a significantly higher basic proline level (in control samples), 5- and 3.6-fold higher than Chinese cabbage and kale, respectively. In salt treatments, the proline levels increased significantly in all three Brassica seedlings in a dose-dependent manner. The most pronounced increase was in white cabbage (6.65-fold) at 200 mM NaCl compared to the control.
ROS levels (superoxide and H2O2) were also elevated in all Brassica seedlings (Figure 3). Following salt treatment, the most prominent increase in SO and H2O2, was obtained in Chinese cabbage in a dose-dependent manner (reaching 2-fold and 3.3-fold at 200 mM NaCl, respectively, compared to the control), although this trend was not noticed in white cabbage and kale. SO was higher, about 1.5 and 1.7-fold, while H2O2 was increased 1.5 and 1.9-fold in white cabbage and kale at higher salt concentrations compared to the corresponding controls.
GSH levels were also elevated under salt stress conditions, most notably in Chinese cabbage in a dose-dependent manner, up to 4.3-fold at 200 mM NaCl compared to the control. Its level in kale was significantly increased up to 1.7-fold (at 50 mM NaCl) and did not show a tendency to further increase at higher salt concentrations, while in white cabbage it was significantly increased in severe salt conditions (200 mM NaCl), up to 1.6-times compared to the controls.

2.2. Pigment Changes in Brassica Seedlings under Salinity Stress

Control kale and white cabbage had higher chlorophyll (Chl) content than Chinese cabbage (0.89 mg g−1 fresh weight (fw) in kale, 0.74 mg g−1 fw in white cabbage, and 0.59 mg g−1 fw in Chinese cabbage) (Table 1). The Chl a changed at 100 mM NaCl in Chinese and white cabbage. There was no change in kale in the salt conditions. The Chl a/Chl b ratio remained unchanged following exposure of the Brassicas to salinity (Table 1).

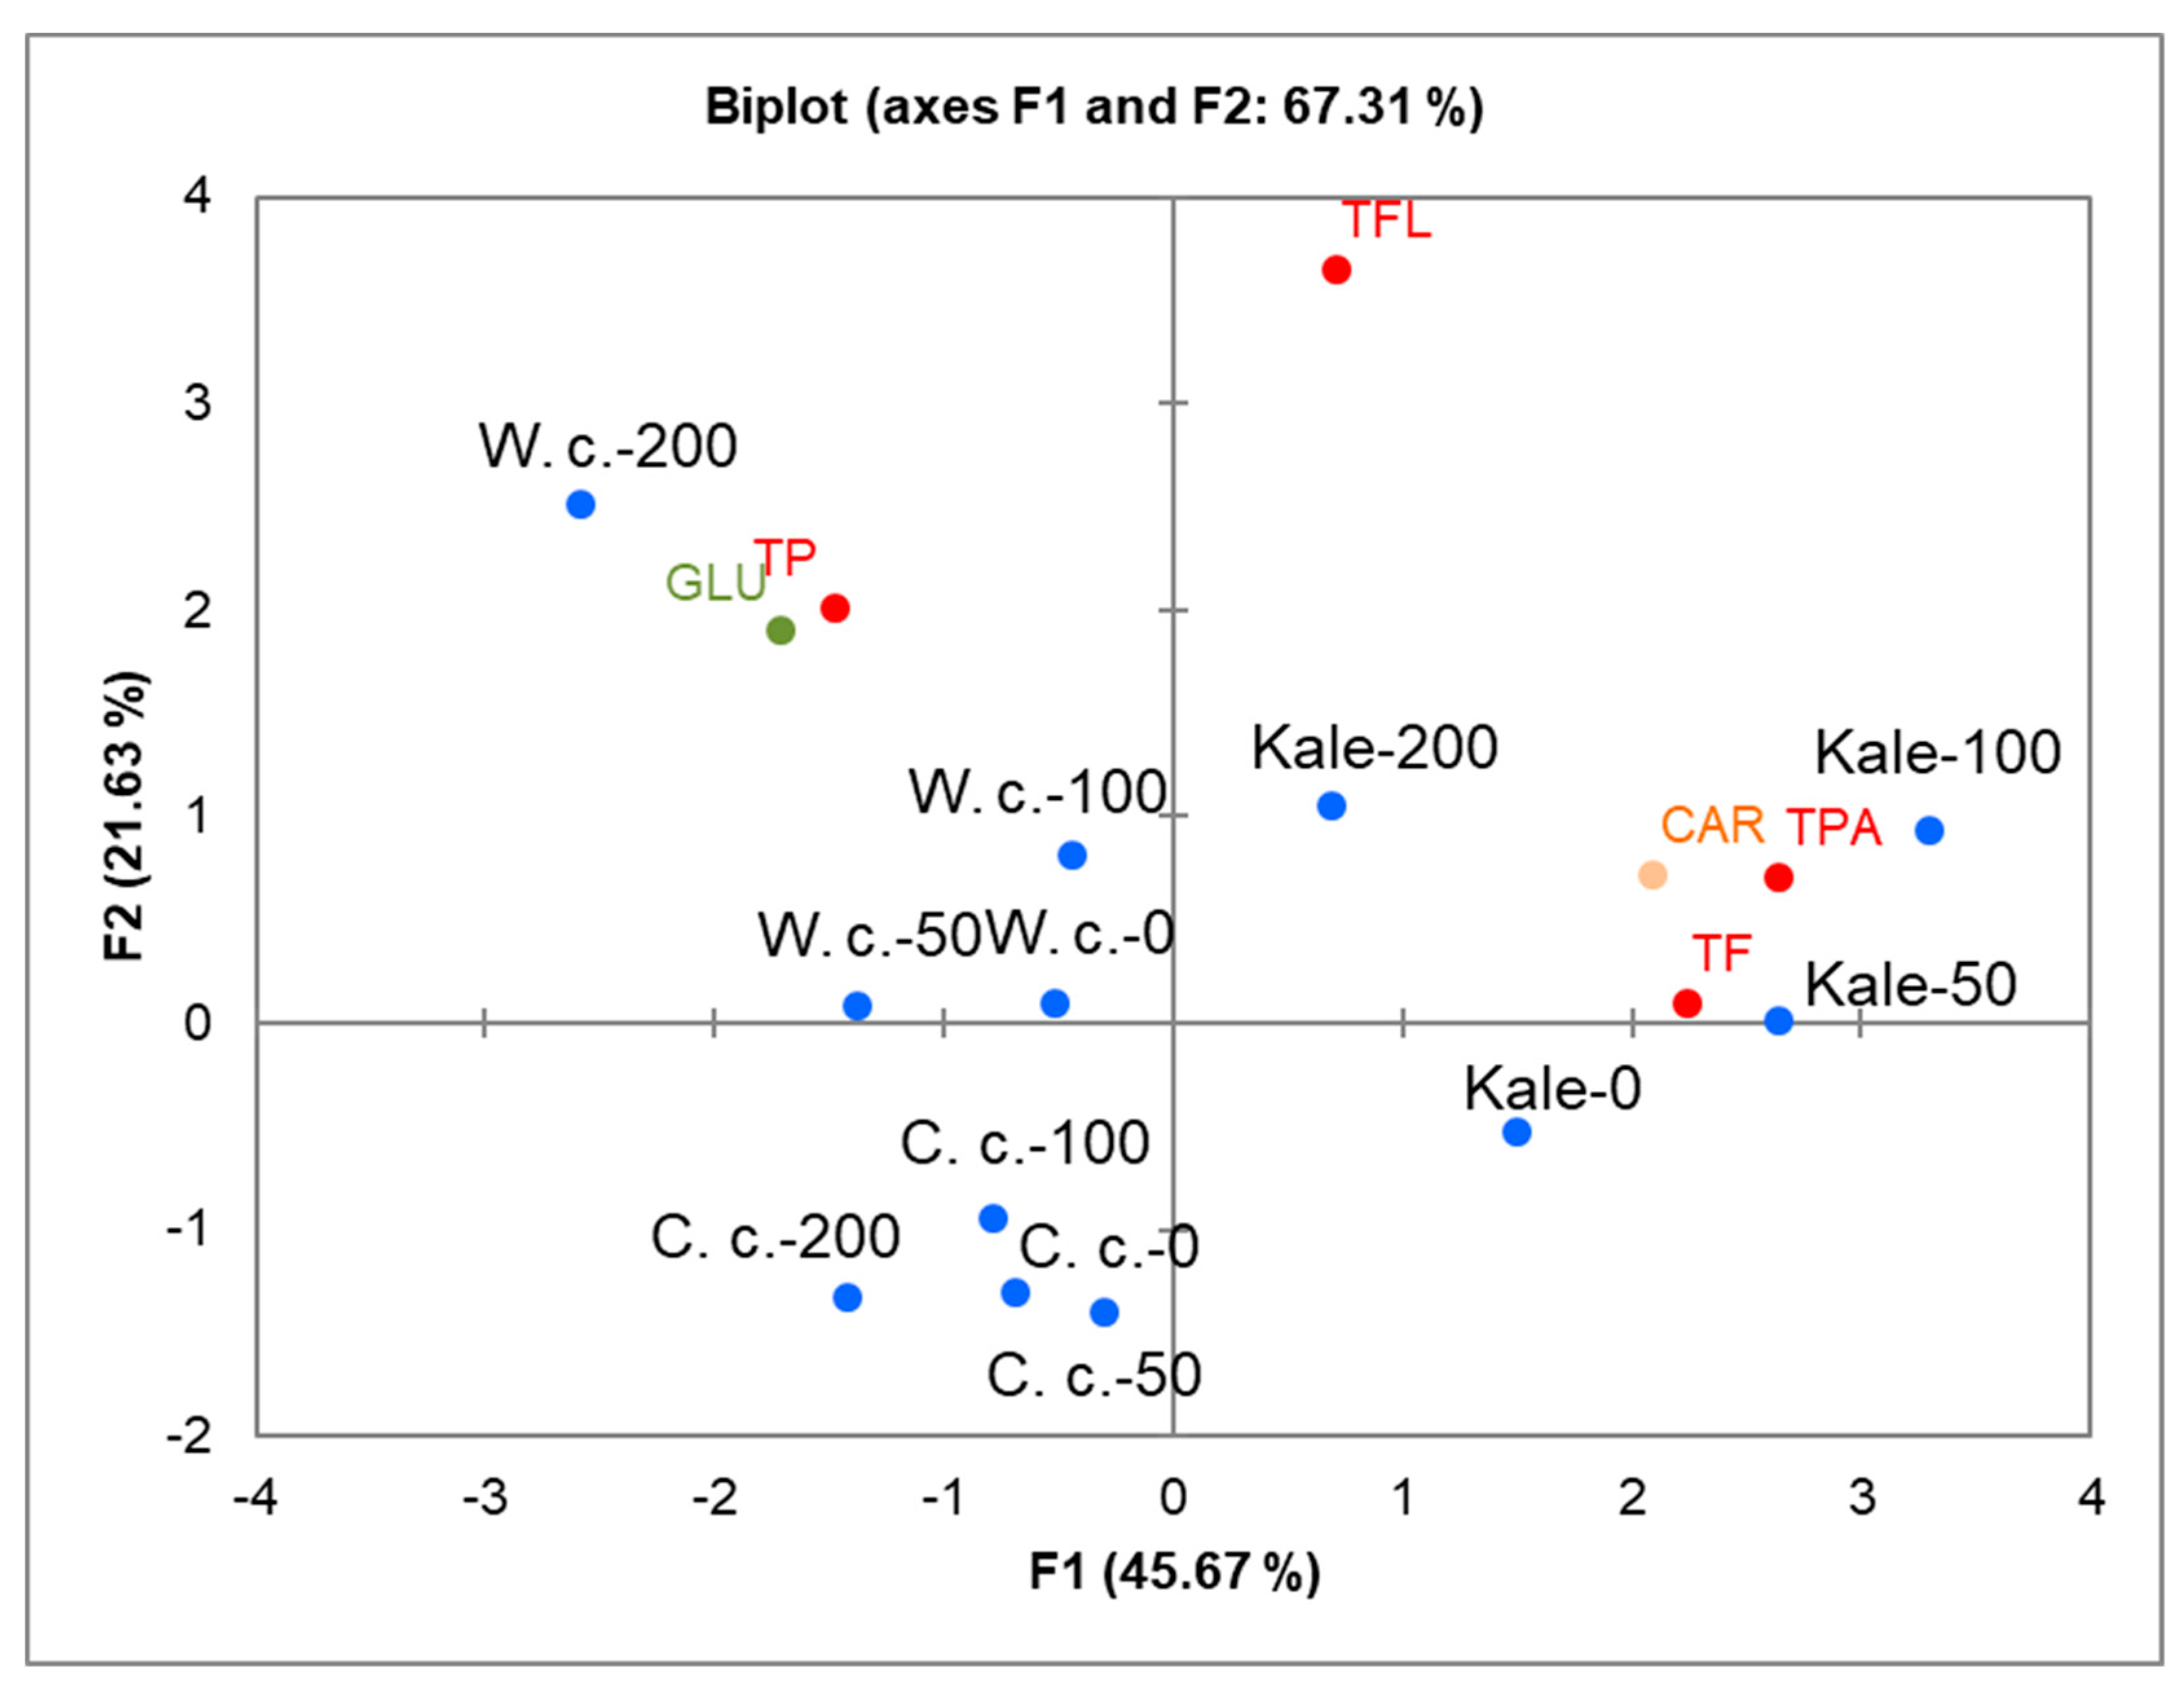
2.3. Correlations between Specific Metabolites and Brassica Species under Salinity Stress

Groups of selected metabolites, including total carotenoids (CAR), total glucosinolates (GLU), and total phenolic compounds (total polyphenols, TP, total phenolic acids, TPA, total flavonoids, TF, and total flavanols, TFL), were measured spectrometrically in control and treated seedlings (Supplementary Table S1). To investigate correlations among the Brassicas in terms of the measured specialized metabolites, the data were subjected to Principle Component Analysis (PCA) based on a matrix of Pearson correlation coefficients (p < 0.05). The positions of the Brassicas and the relations among the measured parameters under the salinity treatments are shown as PCA biplots in Figure 4. The resulting correlation matrix, eigenvalues, factor loadings, and factor scores are presented in Supplementary Tables S2–S6. The first two Principal Components, F1 and F2, explained 67.31% of the cumulative variability of the measured traits (see also Table S3). The separation of cultivars clearly showed that their response to salinity apropos specific metabolites varied considerably. Chinese cabbage appeared positioned in the lower left quadrant, white cabbage in the upper left quadrant, and kale in the upper right quadrant. The PCA plot also shows the relationships of the parameters in Brassicas salinity responses. The metabolites analyzed under stress conditions are grouped mainly near white cabbage and kale. GLU and TP are grouped near white cabbage treated with a strong salt concentration (200 mM NaCl), while CAR, TPA, and TF are placed near kale treated with mild to high salinity (50–100 mM NaCl). Pearson linear coefficients (Table S2) showed positive correlations among the parameters grouped closely; TPA positively correlated with TF (0.724) and CAR (0.652).

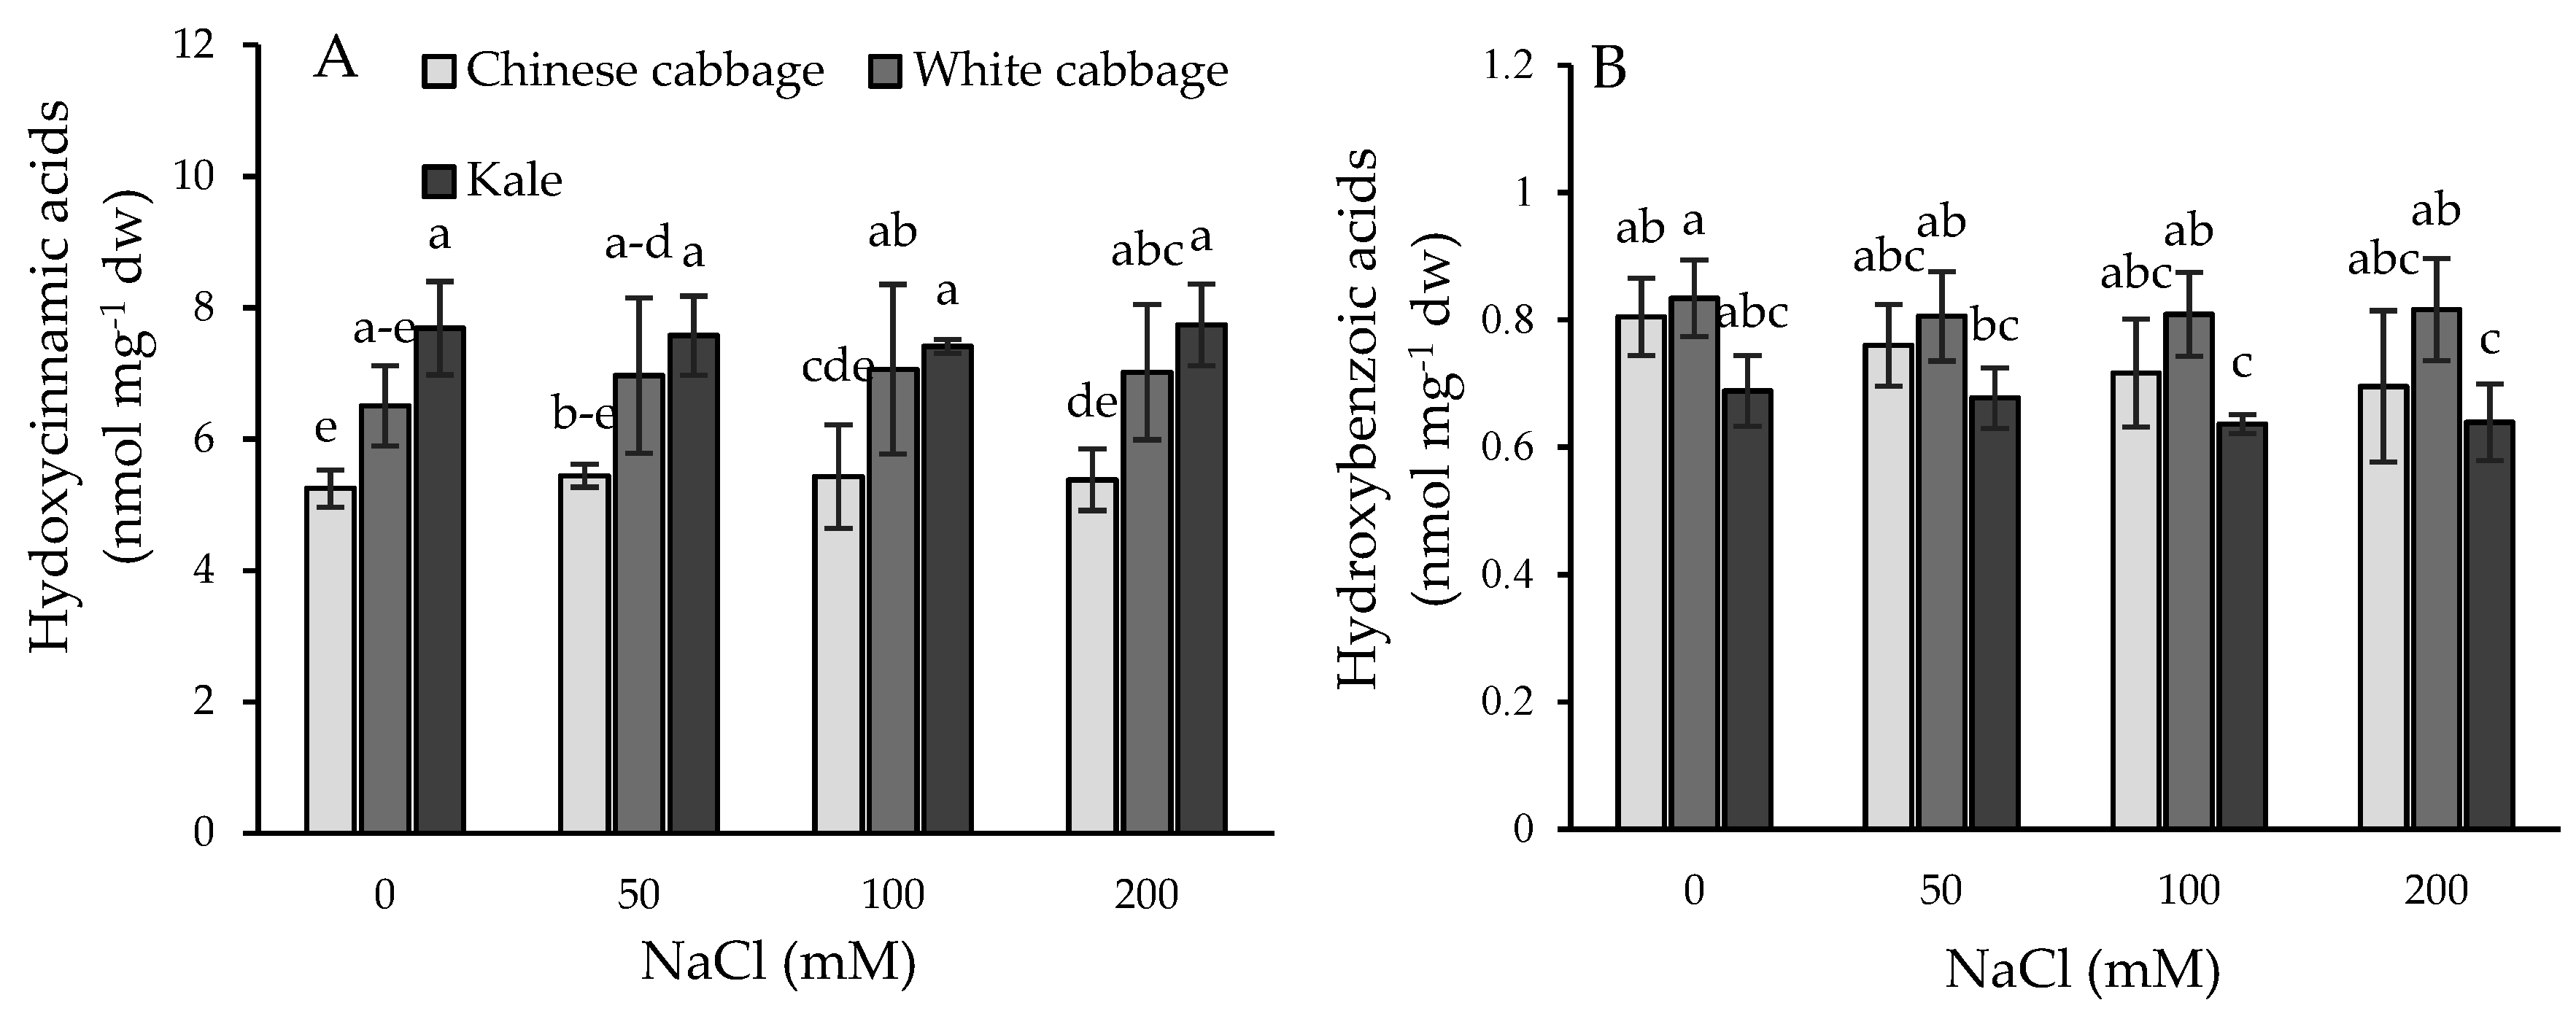
2.4. Phenolic Acid Profiles and Their Dynamic under Salinity Stress Conditions

In this case, we carried out a more detailed profiling of phenolic acids using the UPLC–MS/MS method in control and salt-treated Brassica seedlings. In total, 10 phenolic acids were identified on the basis of retention time (RT) and multiple reaction monitoring transition (MRM) (Table 2): caffeic acid (CaA), ferulic acid (FA), gallic acid (GaA), 4-hydroxybenzoic acid (pHBA), protocatechuic acid (PA), 4-coumaric acid (pCoA), SA, sinapic acid (SiA), syringic acid (SyA), and vanillic acid (VA). Representative chromatograms of the identified phenolic acids in kale seedlings are shown in Supplemental Figure S1.
We measured soluble (free and ester-bound phenolic acids) and insoluble cell wall-bound phenolic acids. Total phenolic acids are the result of the sum of free phenolic acids and the acids determined after hydrolysis in soluble and insoluble fractions. By comparing the controls (untreated seedlings of the three species), we found the highest level of total phenolic acids under these experimental conditions in kale (8.4 nmol mg−1 dw), then in white cabbage (7.3 nmol mg−1 dw), and finally in Chinese cabbage (6.0 nmol mg−1 dw).
The most abundant phenolic acid in all three Brassicas was SiA (79–84% of total phenolic acid content) (Table 2). Other phenolic acids were less abundant (in the range 0.6–6.4% of total phenolic acid content). The selected Brassica species differed significantly in the level of individual phenolic acids. Chinese cabbage had higher amounts of VA and SA compared to the other species, while white cabbage had the highest levels of FA and SyA, and kale was very rich in CaA and SiA. White cabbage and kale also had a significantly higher level of PA, GaA, CaA, and SiA compared to Chinese cabbage (Table 2).
The profile of phenolic acids, including free, ester-bound, and cell-wall bound phenolic acids in the salt-treated seedlings and corresponding controls is shown in Table 3. The general observation is that the levels of the free forms of phenolic acids were low in overall phenolic acid content, suggesting that phenolic acids are abundantly conjugated as glycosides and bound on the cell wall in Brassicas. Indeed, some phenolic acids (GaA, VA, CaA, and SyA) were not identified in free form at all. Only three phenolic acids, pCoA, SiA, and FA, were detected as cell wall-bound. White cabbage contained the highest level of cell wall-bound phenolic acids compared to kale and Chinese cabbage.
The most pronounced saline-based phenolic acid deficiency was observed in Chinese cabbage compared to the corresponding control. Thus, the levels of free PA, pCoA, and SA were significantly reduced in the most severe stress conditions (200 mM NaCl), while CaA was decreased in all salinity treatments compared to the control. The metabolism of phenolic acids did not change markedly under salinity in white cabbage. In kale, we observed a significant decrease in CaA (total) and SA (free form) at 100 and 200 mM NaCl, a decrease of pCoA at all salt concentration, and a significant increase in free FA level at the strongest salt concentration.
Total hydroxycinnamic acids (including pCoA, CaA, FA, and SiA) versus total hydroxybenzoic acids (including PA, GaA, VA, pHBA, SyA, and SA) in the treated Brassica seedlings are shown in Figure 5. Kale had the highest level of total hydroxycinnamic acids, followed by white and then Chinese cabbage. In contrast, Chinese and white cabbage had a higher level of total hydroxybenzoic acid than kale. There was a trend of a mild but not statistically significant increase in total hydroxycinnamic acids and a mild decrease in total hydroxybenzoic acids in all three species. In the group of hydoxybenzoic acids, a significant decrease was found for SA in Chinese cabbage and kale upon salinity treatment.

3. Discussion

3.1. Stress Status of Seedlings: Physiological and Biochemical Parameters

Salinity is a complex abiotic stress generating three unfavorable conditions for plant growth and development: ionic stress caused by toxic concentrations of ions (mainly Na+), osmotic stress due to associated reduction in water uptake, and oxidative stress mainly driven by increased levels of ROS [24]. The results presented here showed the negative effects of short-term salinity stress on biomass production and root growth of seedling of three Brassica species (Chinese cabbage, white cabbage, and kale). The most pronounced inhibition of root growth and biomass production was observed in Chinese cabbage. This is in line with our recent data from four-week-old Brassica plants exposed to salinity, which showed that kale is the most tolerant of the three species, while Chinese cabbage is the most sensitive to salt stress [22]. In parallel, the Na+/K+ ratio, a salinity stress marker, increased significantly under salinity stress in all three species, but a greater increase was observed in Chinese and white cabbage compared to kale. Maintaining a low tissue Na+/K+ ratio has been suggested as an important selection criterion for salt tolerance in Brassicas [25,26].
As mentioned, increased ROS production in plants is usually associated with stress conditions. Here, we showed that salinity stress increases ROS production (SO and H2O2) in seedling roots in a dose-dependent manner in all three Brassica seedlings studied but especially in Chinese cabbage. ROS are formed in all aerobic organisms due to multistage oxygen reduction. The first step in oxygen reduction is the formation of superoxide (O2) which is rapidly converted to hydrogen peroxide (H2O2) by superoxide dismutases. H2O2 is the most stable of the ROS.
In addition, the osmoprotective proline was increased in a dose-dependent manner in all varieties. Proline is recognized as a multi-functional molecule that accumulates in response to various abiotic stresses. It acts as an osmoprotectant and as a redox-buffering agent that has antioxidant properties under stress conditions [27]. Note that white cabbage contained a significantly higher basic proline level (control seedlings) than other varieties and reached the highest proline level after salinity treatments. Ashraf and McNeilly [25] reported that salt-tolerant Brassica cultivars accumulate significantly higher levels of proline in the leaves compared to salt-sensitive cultivars, which is consistent with our data. The beneficial effect of proline hyperaccumulation on salt tolerance has been demonstrated in Thellungiella salsuginea and Lepidium crassifolium, two halophytic wild relatives of Arabidopsis that accumulate more proline under control and salt-stressed conditions [14].
Another non-enzymatic compound regulating ROS levels and an informative marker of abiotic stress is GSH. GSH levels were increased under salinity stress in all three Brassicas in a dose-dependent manner. In a previous report, it was shown that halophytic Lycopersicon pennellii had an increased content of reduced glutathione compared to its glycophyte relative Lycopersicon esculentum [14].

3.2. Selected Metabolites Responsive to Salinity Stress

Some of the multiple biochemical pathways involved in plant defense against salinity stress lead to the synthesis of selected metabolites [28]. We evaluated several groups of natural substances, including total CAR, total GLU, and TP compounds (TPA, TF, and TFL) under increased salinity stress.
Kale and white cabbage contained higher CAR levels than Chinese cabbage, although the difference was not statistically significant under our experimental conditions. Short-term salinity stress did not significantly affect CAR content in any of the investigated species. Published data show that the salt-tolerant monocotyledonous Chloris virgate contains a constitutively higher carotenoid concentration under control conditions than the more sensitive wheat and shows a much smaller reduction in carotenoid concentration upon exposure to increased salt concentrations [29].
The GLU content was similar in untreated Chinese cabbage, white cabbage, and kale and was significantly increased in salinity treatments for all varieties, but the highest increase was observed in white cabbage. Changes in the amount and pattern of total glucosinolates in plants were found to be related to developmental stage, plant species, and duration of salinity stress. López-Berenguer et al. [30] showed that low salinity (40 mM) greatly increased the total GLU content of broccoli inflorescence, while at higher salinity (80 mM), the GLU content was reduced. Further, the GLU contents of 5- and 7-day-old radish sprouts were significantly increased, and the myrosinase activities were inhibited by 100 mM NaCl treatment [31]. Long-term salinity stress (21 days) and exposure to chloride salts caused a decrease in aliphatic GLUs in shoots of B. rapa plants, corresponding to reduced transcript level of CYP79F1 coding for the key enzyme for their biosynthesis. Similarly, elevated levels of indole and aromatic GLUs by Na2SO4 coincided with increased gene expression of enzymes responsible for the biosynthesis of these GLUs [32].
As far as polyphenolic compounds are concerned, all Brassicas contained similar TP contents, which did not change significantly under salinity stress. However, some groups of polyphenols differed in these three species and varied in different salinity conditions. Thus, kale seedlings contained the highest level of TPA than other varieties, while white cabbage and kale contained significantly higher levels of TFL than Chinese cabbage. As a result of salinity, a significant increase in TPA and TFL were observed only in kale, while TF was significantly increased in Chinese cabbage. Published data showed that the TP content was twice as high for salt-tolerant species such as Tamarix gallica, Limoniastrum monopetalum, Limoniastrum guyonianum, Suaeda fruticosa, and Mesembryanthemum edule compared to salt-sensitive species (Mentha pulegium and Nigella sativa) [33,34]. The TP content of 3- and 5-day-old sprouts of Raphanus sativus was significantly increased by 100 mM NaCl treatment [31].

3.3. Phenolic Acids in Plant Stress Responses

Although each type of stress has its own characteristics, almost all abiotic stressors change the cellular redox state, and therefore the participation of antioxidants in the plant stress responses is essential. Phenolic acids, due to their structure, are known as strong antioxidants that can contribute to ROS scavenging [35]. Hydroxycinnamic acids exhibit higher antioxidant activity than similar hydroxybenzoic acids, since their CH=CH–COOH side chain is considered to possess larger hydrogen donor and radical stabilizing properties [36].
We found that untreated kale seedlings contained a higher content of total phenolic acids than white and Chinese cabbage (Table 2). These phenolic acids are mostly present in conjugated forms, consistent with previously published data [5]. In addition, kale had the highest levels of hydroxycinnamic acids but the lowest content of hydroxybenzoic acids compared to the other two species (Figure 5). The ratio of total hydroxycinamic to total hydroxybenzoic acids was 11.2 in the control kale seedlings, 7.8 in white cabbage, and 6.5 in Chinese cabbage. After salinity treatments, this ratio constantly increased to 12.1, 8.6, and 7.7 in kale, white, and Chinese cabbage at 200 mM NaCl, respectively. It follows that short-term exposure of plants to increased salinity can cause the accumulation of total hydroxycinnamic acids over hydroxybenzoic acids in Brassicas. An increase in hydroxycinnamic acid content (especially 1,3-dicaffeoylquinic acid, 1-feruoyl-5-caffeoylquinic acid, and 3-caffeoyl-1-5-quinolactone) has been described in tomato plants exposed to salinity and combined heat and salinity [21]. These authors found a more pronounced increase in hydroxycinnamic acids than we demonstrated in our experiments. This may be due to the duration of stress and the growth stage of the plants. In their experiments, tomato plants were exposed to long-term stress for 21 days compared to our 24 h salt-stressed seedlings. A significant increase of p-cumaric and caffeic acids was reported in cabbage after osmotic dehydration [37]. Furthermore, it has been found that hydroxycinnamic acids (chlorogenic acid, caffeic acid, 1,3-dicaffeoylquinic, and 1,5-dicaffeoylquinic acid) were increased in artichoke plants grown under water deficit [38].
The most abundant phenolic acid in all three Brassica seedlings was SiA, which has already been shown to be dominant in a range of Brassica crops [5,11,39,40,41]. The higher salinity tolerance under our experimental conditions for kale and white cabbage compared to Chinese cabbage was probably associated with higher levels of hydroxicinnamic acids SiA, CaA, and FA and of hydroxybenzoic acids PA, GA, 4-HBA, and SyA. Furthermore, white cabbage and kale contain higher levels of cell wall-bound phenolic acids (SiA, FA, and pCoA) than Chinese cabbage. The published data show that FA and pCoA are involved in tolerance mechanisms for salinity stress in rice [19]. Gupta and De [42] showed that salt-tolerant rice varieties increase FA and pCoA as key components bound to cell wall formation under salt stress. CaA is elevated under salinity in some Echinacea sp. [43]. The exogenous application of phenolic acids can reduce electrolyte leakage in NaCl-treated wheat seedlings, where maximum decrease was observed in the presence of sinapic acid followed by caffeic, ferulic, and p-coumaric acids [18]. Further, lipid peroxidation decreased or remained unaffected, while H2O2 levels dropped at the maximum in seedlings treated with caffeic acid. The scavenging capacity of hydroxyl radicals in seedlings grown under strong salt stress increased to the maximum after caffeic and sinapic acid treatments. Hydroxycinnamic acids are very effective antioxidants depending on their structure [44,45]. The proven sequence of efficacy was as follows: caffeic > sinapic > chlorogenic > ferulic > p-coumaric acid [46].
Among hydroxybenzoic acids, SA is a well-known signaling molecule involved in abiotic stress responses. The exogenous use of salicylic acid and its derivatives has been reported to alleviate oxidative stress arising under salinity conditions [47]. Here, we found that Chinese cabbage contained the highest level of SA under control conditions compared to white cabbage and kale. Under the applied salt-stress conditions, a significant decrease in SA content was observed in Chinese cabbage (2.8-fold) and kale (1.4-fold) under severe stress (200 mM NaCl), while the SA content was not significantly affected in white cabbage (the reduction was 1.3-fold at 200 mM NaCl). More tolerant Brassicas are capable of maintaining unchanged SA levels, or their SA level is reduced less than that of sensitive species. The correlations between endogenous SA levels and salinity tolerance are controversial. Research with mutants with altered endogenous SA concentrations showed no clear pattern of behavior during salt stress. Some studies have found that SA-deficient Arabidopsis NahG plants showed increased growth compared to wild-type plants and SA-hyperaccumulation (snc1) mutants during salinity stress. However, in other studies, SA-hyperaccumulation mutants, namely, siz1 (a small ubiquitin-like modifier E3 ligase1) showed increased growth, while a significant growth inhibition was observed in SA-deficient plants (NahG, sid2, and eds5) during salt stress [48].

4. Materials and Methods

4.1. Plant Material and Experimental Conditions

Chinese cabbage (B. rapa var. pekinensis) was obtained from International Seeds Processing GmbH, Germany, while white cabbage (B. oleracea var. capitata cv. Varaždinski) was obtained from the Agricultural Advisory Service of Varaždin Region, Croatia, and kale seeds (B. oleracea var. acephala) from a family farm from Vrgorac, Croatia. Before germination, the seeds were surface-sterilized in 3% Izosan G (Pliva, Croatia) for 10 min, washed with sterile water (5 times), transferred to 1% agar plates, and left at +4 °C for three days in the dark. The seeded plates were placed in a growing chamber, in a vertical position, under control conditions of 16/8 h light/dark photoperiod, light intensity of 115 µmol m−2 s−1, and temperature 22 °C. After the seedlings reached about 1 cm in length, they were placed on 1% agar plates containing NaCl (in concentration range 50–200 mM). Corresponding controls were placed on 1% agar without salt. Both control and experimental plates were incubated for 24 h. Biomass, root growth, and ROS production were determined in in vivo seedlings. For biochemical analysis, five biological replicates of seedlings were collected, immediately frozen using liquid nitrogen, and stored at −80 °C. The plant material was then freeze-dried and stored until analysis.

4.2. Determination of Sodium and Potassium Content

Levels of Na+ and K+ in Brassica seedlings were determined by high-resolution inductively coupled plasma mass spectrometry (HR-ICP–MS, Element 2, Thermo, Bremen, Germany) in connection with an autosampler ESI-a SC-2 DX FAST (Elemental Scientific, Omaha, NE, USA). The measurement parameters and instrument conditions were set as described earlier [49]. Indium was used as an internal standard. Lyophilized seedling tissues (about 100 mg) were subjected to microwave- (Anton Paar Multiwave 3000, Graz, Austria) assisted acidic digestion in HNO3/HF (60:1, v/v) at 1400 W. The measurements were performed in four replicates.

4.3. Proline Quantification

Proline concentrations were assayed according to [50] with some modifications. In brief, extraction was performed using 30 mg of the freeze-dried tissue in 70% ethanol. A volume of 100 µL of the extract was mixed with 1000 µL of the reaction mixture (1% ninhydrin [w/v], 60% acetic acid [v/v], and 20% ethanol [v/v]) and then heated to 95 °C for 20 min. Proline levels were measured at 520 nm using a UV–VIS spectrophotometer (BioSpec-1601 E, Shimadzu) and calculated using a standard curve (y = 0.0015x, R2 = 0.9991; serial concentrations of proline standard (Sigma): 0.04, 0.1, 0.2, 0.4, 1.0, 1.5 mM). The results are expressed in µM L-proline mg−1 dw (dry weight).

4.4. ROS and GSH Fluorescent Measurements

The amount of ROS (SO, H2O2) as well the GSH content of the seedlings was determined in vivo using specific dyes (dihydroethidium, DHE, dichlorodihydrofluorescein diacetate, DCFH-DA, and monochlorobimane, MCB) according to reported methods [51]. All measurements were performed with the roots of stressed seedlings, compared to their appropriate controls. Briefly, the roots of stress and control seedlings were incubated in 10 μM DHE (30 min), 50 μM DCFH-DA (30 min), and 50 μM MCB (40 min) for the determination of SO, H2O2, and GSH, respectively. After incubation, the samples were washed with water to remove the dye surplus. Fluorescent signals that appeared as a result of the reaction between fluorescent dyes and substrates were determined using a fluorescent microscope (Olympus BX51, Olympus Optical Co. (Europa) GmbH) connected to the camera (Olympus DP70, Tokyo, Japan). The accumulated fluorescent products were quantified using Lucida 6.0 software (Kinetic Imaging Ltd., Wirral, UK). Twenty-five fields on each image were analyzed, and the results are presented as the mean of the fluorescence intensity of five images per treatment.

4.5. Pigment Content Determination

Plant pigments, chlorophylls a and b, and carotenoids were measured in fresh cotyledons of seedlings upon treatments, and their contents were calculated according to Lichtenthaler and Buschmann [52]. Pigments levels were measured at three different wavelengths, 663.2 nm for chlorophyll a, 646.8 nm for chlorophyll b, and 470 nm for carotenoids. The results are presented in mg g−1 fw (fresh weight).

4.6. Glucosinolate Measurements

Total glucosinolate content was measured according to Aghajanzadeh et al. [53] with certain adjustments. Lyophilized tissue (30 mg) was extracted in 80% methanol. In order to inactivate the myrosinase enzyme, the extracts were subsequently heated in a thermobloc at 95 °C for 2 min and then were cooled and centrifuged (5 min at 13 000 rpm). Glucosinolate levels were determined in a reaction mixture (930 µL) containing 30 µL methanolic plant extract and 900 µL 2 mM disodium tetrachloropalladate (Na2PdCl4) using a UV–VIS spectrophotometer (BioSpec-1601 E, Shimadzu) at 425 nm. The samples were incubated for 30 min at room temperature before the measurements. The results were calculated using a standard curve (y = 0.0003x, R2 = 0.998; serial concentrations of sinigrin standard (Carl Roth GmbH, Karlsruhe, Germany): 0.1, 0.25, 0.5, 1.0, 1.5, 3.0 mg mL−1) and are presented as sinigrin equivalents per dry weight (μg sinigrin mg−1 dw).

4.7. Determination of Polyphenolic Compounds

For the measurement of polyphenolic compounds, extractions were carried out in 2 mL 80% methanol using 60 mg of freeze-dried tissue. For tissue homogenization, a Mixer Mill MM 400 (Retsch, Haan, Germany) was used for 5 min at 30 Hz, after which the extracts were placed in a sonicator (10 min) and further mixed in a tube rotator (1 h, 15 rpm). The extracts were then centrifuged (Eppendorf centrifuge, 10 min, 13,000 rpm), and the supernatants were used for all analyses described below. All extractions were carried out in five biological replicates for all three species. The measurements were adapted to small volumes.
The Folin–Ciocalteu method for the assessment of TP was used according to Singleton and Rossi [54]. The results were calculated using a standard curve (y = 0.0011x, R2 = 0.998; serial concentrations of gallic acid (Alfa Aesar, Haverhill, MA, USA): 50, 100, 150, 250, 500 mg L−1) and are presented as equivalents of gallic acid per dry weight (mg GAE mg−1 dw). TPA were determined using Arnow’s reagent according to the European Pharmacopoeia [55]; the results were calculated by using a standard curve (y = 0.0042x, R2 = 0.9936; serial concentrations of caffeic acid (Sigma-Aldrich, St. Louis, MO, USA): 10, 50, 100, 250, 500 mg L−1) and are expressed as equivalents of caffeic acid per dry weight (mg CAE mg−1 dw). TF were measured using the AlCl3 method [56]. The results were calculated by using a standard curve (y = 0.0031x, R2 = 0.9898; serial concentrations of catechin standard (Kemika, Zagreb, Croatia): 50, 100, 150, 200, 250 mg L−1) and are presented as equivalents of catechin per dry weight (mg CE mg−1 dw). TFL were analyzed by the p-dimethylaminocinnamaldehyde (DMACA) method [57]. The results were calculated by using a standard curve (y = 0.1414x, R2 = 0.9996; serial concentrations of catechin standard (Kemika, Zagreb, Croatia): 0.5, 1, 2, 4, 6, 8, 10 mg L−1) and are presented as equivalents of catechin per dry weight (mg CE mg−1 dw).

4.8. Principle Component Analysis (PCA)

Relations between the measured values of specific metabolites (total phenolics, flavonoids, phenolic acids, flavanols, glucosinolates, and carotenoids) and the experimental variants of Brassica crops were examined by PCA. PCA was performed using a correlation matrix of the average values of traits after standardization (autoscaling). Linear correlations among variables were determined by Pearson coefficients (p < 0.05). The XLSTAT software (ver. 2017.01.40777) implemented in Microsoft Office Excel 2010 was used for all statistical procedures.

4.9. Phenolic Acid Analyses

The extraction of phenolic acids was performed using 30 mg of freeze-dried plant material in 80% methanol. Internal standards of deuterium-labeled 4-hydroxybenzoic and salicylic acids were added to all samples at a final concentration of 10−6 mol L−1. The fractions of soluble free acids, soluble ester-bound phenolic acids, and cell wall-bound phenolic acids were prepared by a previously published method [58]. Quantification and identification of phenolic acids were performed using UPLC–MS/MS as described earlier [59].

4.10. Statistical Analysis

The data were analyzed with the STATISTICA program (Version Stat Soft. Statistica.v 10.0. Enterprise). ANOVA was used to analyze the relevant factors, and values were considered to be significant at p < 0.05. Post-hoc multiple mean comparison (Tukey’s HSD test) was used for multiple comparisons.

5. Conclusions

In this work, we evaluated the effect of short-term (24 h) salt stress (influence of NaCl at concentrations of 50, 100, or 200 mM) on selected metabolites, with a special focus on phenolic acids, in Chinese cabbage, white cabbage, and kale seedlings. The negative effects of increased salinity were confirmed in all experimental variants. Seedlings showed root growth inhibition, reduced biomass production, and increased Na+/K+ ratio, elevated ROS and GSH, and proline content. Based on these parameters, a high level of stress was demonstrated due to increased salinity, especially in Chinese cabbage, suggesting that this Brassica is highly sensitive to salinity stress. PCA analysis showed a grouping of specific metabolites (carotenoids, polyphenols, and glucosinolates) closer to more tolerant species, suggesting a positive role for these natural substances in stress management. The phenolic acid analysis further confirmed that the more tolerant Brassicas, kale and white cabbage, contained a significantly higher level of total phenolic acids, especially of total hydroxycinnamic acids with respect to hydroxybenzoic acids, compared to Chinese cabbage. Total hydroxycinnamic acids tended to increase, while hydroxybenzoic acids tended to decrease under the applied salinity conditions. Furthermore, the more tolerant white cabbage and kale contained higher levels of cell wall-bound phenolic acids, particularly SiA, compared to the salt-sensitive Chinese cabbage. The most marked decrease in phenolic acids (especially PA, pCoA, SA, and CaA) was observed in salt-treated Chinese cabbage. White cabbage showed no significant changes in phenolic acid levels. In addition to the decrease in CaA, SA, and pCoA, there was also a significant increase in FA in kale under stress conditions. Our results suggest that phenolic acids are species-specific in Brassicaceae and can contribute to their stress tolerance. Salt-tolerant species exhibit a higher level of phenolic acids and suffer less from metabolic disorders under salinity stress.

Supplementary Materials

The following are available online at https://www.mdpi.com/2223-7747/8/6/155/s1, Figure S1: Representative UPLC–MS/MS chromatograms (A–J) of conjugated phenolic acids in a kale (Brassica oleracea var. acephala) extract: salicylic acid (1), ferulic acid (2), sinapic acid (3), 4-coumaric acid (4), syringic acid (5), caffeic acid (6), vanillic acid (7), 4-hydroxybenzoic acid (8), gallic acid (9), protocatechuic acid (10). Table S1: Specific metabolites in Brassica seedlings upon salinity stress (0–200 mM NaCl). Table S2: Correlation matrix (Pearson (n)). Table S3: Eigenvalues. Table S4: Factor loadings and correlations between variables and factors. Table S5: Squared cosines of the variables. Table S6: Squared cosines of the observations.

Author Contributions

B.S.-S. and D.Š. designed the research. I.L. performed most of the experimental work: salinity stress experiments, root growth bioassays and biomass production, analyzed the levels of specialized metabolites with the supervision of D.Š., performed ROS analysis with V.V.B., performed HPLC–MS/MS analysis of phenolic acids with the supervision of J.G. and M.S., conducted the statistical analysis, and designed the figures. V.V.B. performed the quantification of ROS. D.Š. conducted PCA. B.S.-S. drafted the manuscript. B.S.-S., J.G., and M.S. are responsible for project administration and funding acquisition. All authors discussed the results and implications, edited the manuscript, and approved the final manuscript.

Funding

This work was supported by the Croatian Science Foundation (project no. IP-2014-09-4359), the Czech Science Foundation Grant (grant No. 18-07563S), and the European Regional Development Fund- Project "Plants as a tool for sustainable global development" (No. CZ.02.1.01/0.0/0.0/16_019/0000827). PhD abroad practice in phenolic acids analysis for I.L. was enabled by the Erasmus+ Programme.

Acknowledgments

We thank Mara Bogović for providing the white cabbage seeds.

Conflicts of Interest

The authors declare no conflict of interest.

References

  1. Zhang, X.; Lu, G.; Long, W.; Zou, Y.; Li, F.; Nishio, T. Recent progress in drought and salt tolerance studies in Brassica crops. Breed. Sci. 2014, 64, 60–73. [Google Scholar] [CrossRef] [PubMed]
  2. Munns, R.; Gilliham, M. Salinity tolerance of crops—What is the cost? New Phytol. 2015, 208, 668–673. [Google Scholar] [CrossRef] [PubMed]
  3. Daliakopoulos, I.N.; Panagea, I.S.; Tsanis, I.K.; Grillakis, M.G.; Koutroulis, A.G.; Hessel, R.; Mayor, A.G.; Ritsema, C.J. Yield response of Mediteranean rangelands under a changing climate. Land Degrad. Dev. 2017, 28, 1962–1972. [Google Scholar] [CrossRef]
  4. Iqbal, N.; Umar, S.; Khan, N.A. Nitrogen availability regulates proline and ethylene production and alleviates salinity stress in mustard (Brassica juncea). J. Plant Physiol. 2015, 178, 84–91. [Google Scholar] [CrossRef] [PubMed]
  5. Velasco, P.; Francisco, M.; Moreno, D.A.; Ferreres, F.; García-Viguera, C.; Cartea, M.E. Phytochemical fingerprinting of vegetable Brassica oleracea and Brassica napus by simultaneous identification of glucosinolates and phenolics. Phytochem. Anal. 2011, 22, 144–152. [Google Scholar] [CrossRef] [PubMed]
  6. Šamec, D.; Pavlović, I.; Salopek-Sondi, B. White cabbage (Brassica oleracea var. capitata f. alba): Botanical, phytochemical and pharmacologicall overwiev. Phytochem. Rev. 2017, 16, 117–135. [Google Scholar]
  7. Šamec, D.; Pavlović, I.; Radojčić Redovniković, I.; Salopek-Sondi, B. Comparative analysis of phytochemicals and activity of endogenous enzymes associated with their stability, bioavailability and food quality in five Brassicaceae sprouts. Food Chem. 2018, 269, 96–102. [Google Scholar] [CrossRef] [PubMed]
  8. Šamec, D.; Urlić, B.; Salopek-Sondi, B. Kale (Brassica oleracea var. acephala) as a superfood: Review of the scientific evidence behind the statement. Crit. Rev. Food Sci. Nutr. 2018, in press. [Google Scholar]
  9. Xiao, Z.; Rausch, S.; Luo, Y.; Sun, J.; Yu, L.; Wang, Q.; Chen, P.; Yu, L.; Stommel, J.R. Microgreens of Brassicaceae: Genetic diversity of phytochemical concentrations and antioxidant capacity. LWT Food Sci. Technol. 2019, 101, 731–737. [Google Scholar] [CrossRef]
  10. Cartea, M.E.; Velasco, P. Glucosinolates in Brassica foods: Bioavailability in food and significance for human health. Phytochem. Rev. 2008, 7, 213–229. [Google Scholar] [CrossRef]
  11. Cartea, M.E.; Francisco, M.; Soengas, P.; Velasco, P. Phenolic compounds in Brassica vegetables. Molecules 2011, 16, 251–280. [Google Scholar] [CrossRef]
  12. Raiola, A.; Errico, A.; Petruk, G.; Monti, D.M.; Barone, A.; Rigano, M.M. Bioactive compounds in Brassicaceae vegetables with a role in the prevention of chronic diseases. Molecules 2018, 23, 15. [Google Scholar] [CrossRef] [PubMed]
  13. Del Carmen Martínez-Ballesta, M.; Moreno, D.M.; Carvajal, M. The physiological importance of glucosinolates on plant response to abiotic stress in Brassica. Int. J. Mol. Sci. 2013, 14, 11607–11625. [Google Scholar] [CrossRef] [PubMed]
  14. Bose, J.; Rodrigo-Moreno, A.; Shabala, S. ROS homeostasis in halophytes in the context of salinity stress tolerance. J. Exp. Bot. 2014, 65, 1241–1257. [Google Scholar] [CrossRef] [PubMed]
  15. Ksouri, R.; Megdiche, W.; Debez, A.; Falleh, H.; Grignon, C.; Abdelly, C. Salinity effects on polyphenol content and antioxidant activities in leaves of the halophyte Cakile maritima. Plant Physiol. Biochem. 2007, 45, 244–249. [Google Scholar] [CrossRef]
  16. Goleniowski, M.; Bonfill, M.; Cusido, R.; Palazón, J. Phenolic acids. In Natural Products; Ramawat, K.G., Mérillon, J.M., Eds.; Springer: Berlin, Germany, 2013. [Google Scholar]
  17. Miura, K.; Tada, Y. Regulation of water, salinity, and cold stress responses by salicylic acid. Front. Plant Sci. 2014, 5, 4. [Google Scholar] [CrossRef] [Green Version]
  18. Kaur, H.; Bhardwaj, R.D.; Grewal, S.K. Mitigation of salinity-induced oxidative damage in wheat (Triticum aestivum L.) seedlings by exogenous application of phenolic acids. Acta Physiol. Plant. 2017, 39, 221–236. [Google Scholar] [CrossRef]
  19. Minh, L.T.; Khang, D.T.; Ha, P.T.T.; Tuyen, P.T.; Minh, T.N.; Quan, N.V.; Xuan, T.D. Effects of salinity stress on growth and phenolics of rice (Oryza sativa L.). Int. Lett. Nat. Sci. 2016, 57, 1–10. [Google Scholar] [CrossRef]
  20. Yan, K.; Zhao, S.; Bian, L.; Chen, X. Saline stress enhanced accumulation of leaf phenolics in honeysuckle (Lonicera japonica Thunb.) without induction of oxidative stress. Plant Physiol. Biochem. 2017, 112, 326–334. [Google Scholar] [CrossRef]
  21. Martinez, V.; Mestre, T.C.; Rubio, F.; Girones-Vilaplana, A.; Moreno, D.A.; Mittler, R.; Rivero, R.M. Accumulation of flavonols over hydroxycinnamic acids favors oxidative damage protection under abiotic stress. Front. Plant Sci. 2016, 7, 838. [Google Scholar] [CrossRef]
  22. Pavlović, I.; Mlinarić, S.; Tarkowská, D.; Oklestkova, J.; Novák, O.; Lepeduš, H.; Vujčić Bok, V.; Radić Brkanac, S.; Strnad, M.; Salopek-Sondi, B. Early Brassica crops responses to salinity stress: A comparative analysis between Chinese cabbage, white cabbage and kale. Front. Plant Sci. 2019, 10, 450. [Google Scholar] [CrossRef] [PubMed]
  23. Pavlović, I.; Pěnčík, A.; Novák, O.; Vujčić, V.; Radić Brkanac, S.; Lepeduš, H.; Strnad, M.; Salopek-Sondi, B. Short-term salt stress in Brassica rapa seedlings causes alterations in auxin metabolism. Plant Physiol. Biochem. 2018, 125, 74–84. [Google Scholar] [CrossRef] [PubMed]
  24. Liang, W.; Ma, X.; Wan, P.; Liu, L. Plant salt-tolerance mechanism: A review. Biochem. Biophys. Res. Commun. 2018, 495, 286–291. [Google Scholar] [CrossRef] [PubMed]
  25. Ashraf, M.; McNeilly, T. Salinity tolerance in Brassica oilseeds. Crit. Rev. Plant. Sci. 2004, 23, 157–174. [Google Scholar] [CrossRef]
  26. Munns, R.; James, R.A.; Gilliham, M.; Flowers, T.J.; Colmer, T.D. Tissue tolerance: An essential but elusive trait for salt-tolerant crops. Funct. Plant Biol. 2016, 43, 1103–1113. [Google Scholar] [CrossRef]
  27. Kishor, P.B.K.; Sreenivasulu, N. Is proline accumulation per se correlated with stress tolerance or is proline homeostasis a more critical issue? Plant Cell Environ. 2014, 37, 300–311. [Google Scholar] [CrossRef]
  28. Zaghdoud, C.; Carvajal, M.; Moreno, D.A.; Ferchichia, A.; Martínez-Ballesta, M.; Del, C. Health-promoting compounds of broccoli (Brassica oleracea L. var Italica) plants as affected by nitrogen fertilisation in projected future climatic change environments. J. Sci. Food Agric. 2016, 96, 392–403. [Google Scholar] [CrossRef]
  29. Yang, C.-W.; Zhang, M.-L.; Liu, J.; Shi, D.-C.; Wang, D.-L. Effects of buffer capacity on growth, photosynthesis, and solute accumulation of a glycophyte (wheat) and a halophyte (Chloris virgata). Photosynthetica 2009, 47, 55–60. [Google Scholar] [CrossRef]
  30. López-Berenguer, C.; Martínez-Ballesta, M.C.; García-Viguera, C.; Carvajal, M. Leaf water balance mediated by aquaporins under salt stress and associated glucosinolate synthesis in broccoli. Plant Sci. 2008, 174, 321–328. [Google Scholar] [CrossRef]
  31. Yuan, G.; Wang, X.; Guo, R.; Wang, Q. Effect of salt stress on phenolic compounds, glucosinolates, myrosinase and antioxidant activity in radish sprouts. Food Chem. 2010, 121, 1014–1019. [Google Scholar] [CrossRef]
  32. Aghajanzadeh, T.A.; Reich, M.; Kopriva, S.; De Kok, L.J. Impact of chloride (NaCl, KCl) and sulphate (Na2SO4, K2SO4) salinity on glucosinolate metabolism in Brassica rapa. J. Agro. Crop Sci. 2017, 204, 137–146. [Google Scholar] [CrossRef]
  33. Ksouri, R.; Ksouri, W.M.; Jallali, I.; Debez, A.; Magné, C.; Hiroko, I.; Abdelly, C. Medicinal halophytes: Potent source of health promoting biomolecules with medical, nutraceutical and food applications. Crit. Rev. Biotechnol. 2012, 32, 289–326. [Google Scholar] [CrossRef] [PubMed]
  34. Ksouri, R.; Smaoui, A.; Isoda, H.; Abdelly, C. Utilization of halophyte species as new sources of bioactive substances. J. Arid Land Stud. 2012, 22, 41–44. [Google Scholar]
  35. Cirillo, G.; Parisi, O.I.; Restuccia, D.; Puoci, F.; Picci, N. Antioxidant activity of phenolic acids: Correlation with chemical structure and in vitro assays for their analytical determination. In Phenolic Acids: Composition, Applications and Health Benefits; Munné-Bosch, S., Ed.; Nova Science Publishers Inc.: New York, NY, USA, 2012; pp. 1–33. [Google Scholar]
  36. Michalak, A. Phenolic compounds and their antioxidant activity in plants growing under heavy metal stress. Polish J. Environ. Stud. 2006, 15, 523–530. [Google Scholar]
  37. Cvetković, B.R.; Pezo, L.L.; Mišan, A.; Mastilović, J.; Kevrešan, Ž.; Ilić, N.; Filipčev, B. The effects of osmotic dehydration of white cabbage on polyphenols and mineral content. LWT 2019, in press. [Google Scholar] [CrossRef]
  38. Nouraei, S.; Rahimmalek, M.; Saeidi, G. Variation in polyphenolic composition, antioxidants and physiological characteristics of globe artichoke (Cynara cardunculus var. scolymus Hayek L.) as affected by drought stress. Sci. Hort. 2018, 233, 378–385. [Google Scholar] [CrossRef]
  39. Ayaz, F.A.; Hayırlıoglu-Ayaz, S.; Alpay-Karaoglu, S.; Grúz, J.; Valentová, K.; Ulrichová, J.; Strnad, M. Phenolic acid contents of kale (Brassica oleraceae L. var. acephala DC.) extracts and their antioxidant and antibacterial activities. Food Chem. 2008, 107, 19–25. [Google Scholar] [CrossRef]
  40. Bhinu, V.-S.; Ulrike, A.; Schäfer, U.A.; Li, R.; Huang, J.; Hannoufa, A. Targeted modulation of sinapine biosynthesis pathway for seed quality improvement in Brassica napus. Transgenic Res. 2009, 18, 31–44. [Google Scholar] [CrossRef]
  41. Oszmiański, J.; Kolniak-Ostek, J.; Wojdyło, A. Application of ultra performance liquid chromatography photodiode detector-quadrupole/time of flight-mass spectrometry (UPLC-PDA-Q/TOF-MS) method for the characterization of phenolic compounds of Lepidium sativum L. sprouts. Eur. Food Res. Technol. 2013, 236, 699–706. [Google Scholar]
  42. Gupta, P.; De, B. Differential responses of cell wall bound phenolic compounds in sensitive and tolerant varieties of rice in response to salinity. Plant Signal. Behav. 2017, 10, e1379643. [Google Scholar] [CrossRef]
  43. Sabra, A.; Adam, L.; Daayf, F.; Renault, S. Salinity-induced changes in caffeic acid derivatives, alkamides and ketones in three Echinacea species. Environ. Exp. Bot. 2012, 77, 234–241. [Google Scholar] [CrossRef]
  44. Piazzon, A.; Vrhovsek, U.; Masuero, D.; Mattivi, F.; Mandoj, F.; Nardini, M. Antioxidant activity of phenolic acids and their metabolites: synthesis and antioxidant properties of the sulfate derivatives of ferulic and caffeic acids and of the acyl glucuronide of ferulic acid. J. Agric. Food Chem. 2012, 60, 12312–12323. [Google Scholar] [CrossRef]
  45. Razzaghi-As, N.; Garrido, J.; Khazraei, H.; Borges, F.; Firuzi, O. Antioxidant properties of hydroxycinnamic acids: A review of structure-activity relationships. Curr. Med. Chem. 2013, 20, 4436–4450. [Google Scholar] [CrossRef]
  46. Nićiforović, N.; Abramovič, H. Sinapic acid and its derivatives: Natural sources and bioactivity. Compr. Rev. Food Sci. Food Saf. 2014, 13, 34–51. [Google Scholar] [CrossRef]
  47. Hasanuzzaman, M.; Nahar, K.; Bhuiyan, T.F.; Anee, T.I.; Inafuku, M.; Oku, H.; Fujita, M. Salicylic acid: An all-rounder in regulating abiotic stress responses in plants. In Phytohormones—Signaling Mechanisms and Crosstalk in Plant Development and Stress Responses; El-Esawi, M., Ed.; IntechOpen: London, UK, 2017; pp. 31–75. [Google Scholar]
  48. Jayakannan, M.; Bose, J.; Babourina, O.; Rengel, Z.; Shabala, S. Salicylic acid in plant salinity stress signalling and tolerance. Plant Growth Regul. 2015, 76, 25–40. [Google Scholar] [CrossRef]
  49. Fiket, Ž.; Mikac, N.; Kniewald, G. Mass fractions of forty-six major and trace elements, including rare earth elements, in sediment and soil reference materials used in environmental studies. Geostand. Geoanal. Res. 2016, 41, 123–135. [Google Scholar] [CrossRef]
  50. Carillo, P.; Gibon, Z.; PrometheusWiki Contributors. Extraction and Determination of Proline. Available online: http://tiki-pagehistory.php?page=Extraction and determination of proline&preview=14. (accessed on 31 May 2011).
  51. Radić Brkanac, S.; Gerić, M.; Gajski, G.; Vujčić, V.; Garaj-Vrhovac, V.; Kremer, D.; Domijan, A.-M. Toxicity and antioxidant capacity of Frangula alnus Mill. Bark and its active component emodin. Regul. Toxicol. Pharmacol. 2015, 73, 923–929. [Google Scholar] [CrossRef] [PubMed]
  52. Lichtenthaler, H.K.; Buschmann, C. Chlorophylls and carotenoids: measurement and characterization by UV–VIS spectroscopy. In Current Protocols in Food Analytical Chemistry; John Wiley & Sons Inc.: Hoboken, NJ, USA, 2001. [Google Scholar]
  53. Aghajanzadeh, T.A.; Hawkesford, M.J.; De Kok, L.J. The significance of glucosinolates for sulfur storage in Brassicaceae seedlings. Front. Plant Sci. 2014, 5, 704. [Google Scholar] [CrossRef]
  54. Singleton, V.L.; Rossi, J.A. Colorimetry of total phenolics witphosphomolybdic–phosphotungstic acid reagents. Am. J. Enol. Vitic. 1965, 16, 144–158. [Google Scholar]
  55. European Pharmacopoeia, 4th ed.; Council of Europe: Strasbourg, France, 2004; pp. 2377–2378.
  56. Zhishen, J.; Mengcheng, T.; Jianming, W. The determination of flavonoid contents in mulberry and their scavenging effects on superoxide radicals. Food Chem. 1999, 64, 555–559. [Google Scholar] [CrossRef]
  57. Šamec, D.; Bogović, M.; Vincek, D.; Martinčić, J.; Salopek-Sondi, B. Assessing the authenticity of the white cabbage (Brassica oleracea var. capitata f. alba) cv. ‘Varaždinski’ by molecular and phytochemical markers. Food Res. Int. 2014, 60, 266–272. [Google Scholar]
  58. Gruz, J.; Ayaz, F.A.; Torun, H.; Strnad, M. Phenolic acid content and radical scavenging activity of extracts from medlar (Mespilus germanica L.) fruit at different stages of ripening. Food Chem. 2011, 124, 271–277. [Google Scholar] [CrossRef]
  59. Gruz, J.; Novák, O.; Strnad, M. Rapid analysis of phenolic acids in beverages by UPLC–MS/MS. Food Chem. 2008, 111, 789–794. [Google Scholar] [CrossRef]
Figure 1. Root growth (A) and biomass production (B) of Brassica seedlings under short-term (24 h) salinity stress (0–200 mM NaCl). Points labelled with different letters differ significantly at p < 0.05. Data are average ± SD, n = 30.
Plants 08 00155 g001
Figure 2. Brassica seedlings’ NA+/K+ ratio (A), and Na+ and K+ content (B) under control and salt stress (200 mM NaCl) treatments. Data are averages ± SD (n = 4). Points labelled with different letters differ significantly at p < 0.05.
Plants 08 00155 g002
Figure 3. Biochemical stress markers: proline content (A) and fluorescence intensity due to the reactive oxygen species (ROS) H2O2 (B), and superoxide (SO) (C), as well as glutathione (GSH) (D) in the roots of Chinese cabbage, white cabbage, and kale seedlings under increasing salt concentrations (0, 50, 100, and 200 mM NaCl). Data in figures B, C, and D were normalized according to the corresponding controls (horizontal lines normalized to 1). Data are averages ± SD (n = 5). Points labeled with different letters differ significantly at p < 0.05.
Plants 08 00155 g003
Figure 4. Two-dimensional principal component analysis (2D-PCA) of specialized metabolites in Chinese cabbage (C. c), white cabbage (W. c.), and kale (Kale) after 24 h exposure to 0 (control), 50, 100, and 200 mM NaCl. The green, orange, and red symbols indicate the positions in the score plots of glucosinolates (GLU), carotenoids (CAR), and phenolic compounds (total phenolics (TP), total flavonoids (TF), total phenolic acids (TPA), total flavonols (TFL)), respectively. The blue symbols indicate the positions of the Brassica crops following each of the treatments. PCA was created based on data presented in Supplementary Table S1. The correlation matrix used, eigenvalues, factor loadings, and factor scores are given in Supplementary Tables S2–S6.
Plants 08 00155 g004
Figure 5. Total hydroxycinnamic acids (A) and total hydroxybenzoic acids (B) in Brassica seedlings upon salinity treatments (0–200 mM). Data are averages ± SD (n = 5). Points labeled with different letters differ significantly at p < 0.05.
Plants 08 00155 g005
Table 1. Chlorophylls (Chl) levels (mg g−1 fresh weight (fw)) upon treatments with increasing concentrations of NaCl (mM). Data are averages ± SD (n = 5).
Brassica cropNaCl (mM)Chl aChl bTotal chlChl a/Chl b
Chinese cabbage00.42 ± 0.04 d0.17 ± 0.03 c0.59 ± 0.07 c2.48 ± 0.24 a
500.49 ± 0.03 bcd0.19 ± 0.01 bc0.68 ± 0.04 de2.54 ± 0.09 a
1000.64 ± 0.09 ab0.25 ± 0.04 abc0.89 ± 0.14 abcd2.60 ± 0.03 a
2000.45 ± 0.07 cd0.22 ± 0.03 bc0.67 ± 0.06 de2.07 ± 0.52 ab
White cabbage00.49 ± 0.02 bcd0.25 ± 0.05 abc0.74 ± 0.07 bcde2.00 ± 0.35 ab
500.53 ± 0.06 abcd0.24 ± 0.04 abc0.78 ± 0.09 abcde2.20 ± 0.21 ab
1000.68 ± 0.08 a0.33 ± 0.05 a1.00 ± 0.12 a2.09 ± 0.28 ab
2000.49 ± 0.09 bcd0.20 ± 0.04 bc0.69 ± 0.14 cde2.48 ± 0.06 a
Kale00.62 ± 0.08 abc0.27 ± 0.03 ab0.89 ± 0.11 abcd2.33 ± 0.27 ab
500.69 ± 0.05 a0.27 ± 0.01 ab0.95 ± 0.03 ab2.57 ± 0.32 a
1000.62 ± 0.03 abc0.24 ± 0.02 abc0.86 ± 0.05 abcd2.56 ± 0.18 a
2000.59 ± 0.05 abcd0.34 ± 0.02 a0.92 ± 0.07 abc1.76 ± 0.07 b
Points labeled with different letters (a–d) differ significantly at p < 0.05. Statistical analysis has been performed in each column, among three Brassica species.
Table 2. List of determined phenolic acids by UPLC–MS/MS, their retention times (RT) and multiple reaction monitoring transition MRM. Total levels of particular phenolic acids were expressed (pmol mg−1 dw) in untreated seedlings of Chinese cabbage, white cabbage, and kale. Color gradation from light yellow to dark green comparatively represents values among species from the lowest to the highest.
Compound (Abbreviation)RTMRMChinese CabbageWhite CabbageKale
minm/zpmol mg−1 dw
protocatechuic acid (PA)3.84153 > 10979.13 ± 4.17b173.79 ± 39.78a136.92 ± 15.84a
galic acid (GaA)2.64153 > 10965.49 ± 9.26b124.03 ± 11.81a118.66 ± 6.65a
4-hydroxybenzoic acid (pHBA)4.84137 > 93120.03 ± 29.46b174.89 ± 16.07a147.07 ± 8.58ab
vanillic acid (VA)5.44167 > 152291.96 ± 37.29a142.38 ± 26.87b153.14 ± 14.22b
caffeic acid (CaA)5.37179 > 13534.19 ± 5.23c51.30 ± 2.35b149.61 ± 9.53a
syringic acid (SyA)5.64197 > 18272.60 ± 10.41b98.61 ± 11.01a51.13 ± 4.86c
4-coumaric acid (pCoA)6.55163 > 119127.83 ± 34.47a178.18 ± 47.41a189.08 ± 23.25a
sinapic acid (SiA)7.05223 > 2084834.88 ± 290.75c5807.30 ± 677.05b7073.88 ± 669.84a
ferulic acid (FA)7.14193 > 178253.02 ± 14.59b469.18 ± 95.30a275.67 ± 29.17b
salicylic acid (SA)8.25137 > 93175.62 ± 46.53a120.49 ± 24.20b81.78 ± 4.17b
Total6054.78 ± 249.04c7340.17 ± 621.87b8376.94 ± 707.89a
Data labeled with different letters (a–c) differ significantly at p < 0.05 for each particular phenolic acid among the three species. Statistical analysis has been performed in each row.
Table 3. Phenolic acids contents (pmol mg–1 dw), soluble free (SF), soluble ester-conjugated (SC), and cell wall-bound (CWB,) measured in seedlings of Chinese cabbage, white cabbage, and kale upon salt treatments (0–200 mM NaCl). Color gradation from light yellow to dark green comparatively represents values among species from the lowest to the highest. ND-not determined.
Chinese CabbageWhite CabbageKale
Treatments (NaCl mM)
050100200050100200050100200
PASF9.45 ± 3.01a9.97 ± 0.66a10.02 ± 1.16a5.35 ± 1.85b18.33 ± 6.15a11.78 ± 4.96a11.46 ± 4.21a11.70 ± 4.14a2.61 ± 0.48a2.08 ± 0.63a2.47 ± 1.18a2.58 ± 1.60a
SC69.68 ± 1.49ab72.37 ± 7.17ab74.61 ± 5.77a63.20 ± 5.50b155.46 ± 31.01a149.93 ± 3.26a148.82 ± 34.63a143.58 ± 36.55a134.31 ± 14.26a129.72 ± 11.93a128.16 ± 4.81a125.49 ± 12.57a
CWBNDNDNDNDNDNDNDNDNDNDNDND
Total79.13 ± 4.17ab82.34 ± 8.03a84.6 3± 7.15a68.55 ± 7.45b173.79 ± 9.78a161.71 ± 44.67a160.28 ± 42.55a155.28 ± 42.82a136.92 ± 15.84a131.81 ± 13.81a130.63 ± 5.99a128.07 ± 12.73a
GaASFNDNDNDNDNDNDNDNDNDNDNDND
SC65.49 ± 9.26a65.00 ± 10.34a64.13 ± 11.11a57.62 ± 9.65a124.03 ± 11.81a118.62 ± 9.89a124.81 ± 9.28a126.85 ± 15.24a118.66 ± 6.65a111.73 ± 19.38a107.32 ± 7.30a104.56 ± 13.73a
CWBNDNDNDNDNDNDNDNDNDNDNDND
Total65.49 ± 9.26a65.00 ± 10.34a64.13 ± 11.11a57.62 ± 9.65a124.03 ± 11.81 a118.62 ± 9.89a124.81 ± 9.28a126.85 ± 15.24a118.66 ± 6.65a111.73 ± 19.38a107.32 ± 7.30a104.56 ± 13.73a
pHBASF7.24 ± 3.31a12.22 ± 3.29a6.77 ± 1.42a10.11 ± 4.35a10.91 ± 2.98a8.96 ± 2.11a10.06 ± 0.95a13.08 ± 5.76a6.18 ± 1.67a5.96 ± 0.34a7.92 ± 3.53a8.24 ± 3.17a
SC112.80 ± 23.13a120.58 ± 6.49a109.28 ± 7.96a119.38 ± 11.29a163.99 ± 11.73a170.94 ± 14.42a178.47 ± 15.51a182.81 ± 16.37a140.89 ± 6.28a134.89 ± 3.32a127.84 ± 5.79a139.51 ± 11.58a
CWBNDNDNDNDNDNDNDNDNDNDNDND
Total120.03 ± 29.46a132.80 ± 9.19a116.05 ± 9.52a129.50 ± 15.73a174.89 ± 16.07a179.90 ± 16.64a188.54 ± 17.71a195.89 ± 17.97a147.07 ± 8.58a140.85 ± 3.92a135.76 ± 9.82a147.75 ± 12.42a
VASFNDNDNDNDNDNDNDNDNDNDNDND
SC291.96 ± 37.30a263.46 ± 25.38a248.10 ± 33.25a305.44 ± 69.14a142.38 ± 26.87a126.06 ± 20.67a135.85 ± 13.34a149.09 ± 24.58a153.14 ± 14.22a155.80 ± 15.55a141.84 ± 5.46a146.49 ± 15.73a
CWBNDNDNDNDNDNDNDNDNDNDNDND
Total291.96 ± 37.30a263.46 ± 25.38a248.10 ± 33.25a305.44 ± 69.14a142.38 ± 26.87a126.06 ± 20.67a135.85 ± 13.34a149.09 ± 24.58a153.14 ± 14.22a155.80 ± 15.55a141.84 ± 5.46a146.49 ± 15.73a
CaASFNDNDNDNDNDNDNDNDNDNDNDND
SC34.19 ± 5.23a26.98 ± 1.93b25.76 ± 3.29b21.62 ± 1.79b51.30 ± 2.35a47.37 ± 7.79a47.55 ± 3.39a47.34 ± 3.84a149.61 ± 9.53a141.03 ± 10.98ab124.15 ± 10.93bc114.07 ± 14.78c
CWBNDNDNDNDNDNDNDNDNDNDNDND
Total34.19 ± 5.23a26.98 ± 1.93b25.76 ± 3.29b21.62 ± 1.79b51.30 ± 2.35a47.37 ± 7.79a47.55 ± 3.39a47.34 ± 3.84a149.61 ± 9.53a141.03 ± 10.98ab124.15 ± 10.93bc114.07 ± 14.78c
SyASFNDNDNDNDNDNDNDNDNDNDNDND
SC72.60 ± 10.41a68.48 ± 5.34a69.23 ± 8.66a72.08 ± 13.58a98.61 ± 11.01a98.98 ± 20.96a97.46 ± 13.57a97.63 ± 14.20a51.13 ± 4.86a51.13 ± 4.41a51.18 ± 3.73a53.28 ± 6.51a
CWBNDNDNDNDNDNDNDNDNDNDNDND
Total72.60 ± 10.41a68.48 ± 5.34a69.23 ± 8.66a72.08 ± 13.58a98.61 ± 11.01a98.98 ± 20.96a97.46 ± 13.57a97.63 ± 14.20a51.13 ± 4.86a51.13 ± 4.41a51.18 ± 3.73a53.28 ± 6.51a
pCoASF4.90 ± 2.92ab6.20 ± 1.19a2.46 ± 0.70b3.12 ± 0.95ab8.59 ± 3.24a5.43 ± 1.37a6.09 ± 1.63a5.30 ± 2.27a5.68 ± 2.41a3.11 ± 0.82a2.94 ± 1.48a3.23 ± 2.15a
SC116.74 ± 30.51a86.67 ± 15.09ab86.17 ± 20.10ab73.20 ± 10.40b147.45 ± 32.86a161.25 ± 17.85a163.84 ± 22.88a173.81 ± 38.67a177.90 ± 20.78a119.80 ± 19.58b110.65 ± 12.85bc81.52 ± 8.01c
CWB6.20 ± 3.11a4.85 ± 1.70a3.23 ± 0.64a3.47 ± 0.74a22.14 ± 8.95a23.03 ± 7.08a23.33 ± 6.42a26.46 ± 11.17a6.64 ± 2.35a4.82 ± 0.89a5.14 ± 1.39a6.10 ± 1.38a
Total127.84 ± 34.47a97.72 ± 15.96ab91.86 ± 23.06ab79.79 ± 11.04b178.18 ± 47.41a189.70 ± 22.79a193.26 ± 28.73a205.57 ± 45.73a189.08 ± 23.25a127.73 ± 23.28b118.15 ± 14.22bc90.85 ± 8.97c
SiASF180.29 ± 42.77ab302.02 ± 100.08a153.78 ± 36.94b261.04 ± 101.60ab162.06 ± 59.92a102.26 ± 36.36a147.12 ± 44.28a111.45 ± 28.05a115.01 ± 93.67a81.62 ± 14.93a178.18 ± 236.05a335.75 ± 221.43a
SC4348.0 ± 334.00a4468.30 ± 112.11a4655.07 ± 674.13a4524.51 ± 522.53a5008.74 ± 613.86a5504.28 ± 1058.00a5562.21 ± 1278.82a5578.33 ± 1004.63a6475.78 ± 575.80a6511.83 ± 485.33a6289.38 ± 260.04a6492.59 ± 681.11a
CWB306.55 ± 78.89a295.63 ± 107.36a257.14 ± 54.39a263.01 ± 84.34a636.51 ± 90.56a678.64 ± 119.39a666.02 ± 119.67a613.25 ± 128.86a483.09 ± 72.58a449.33 ± 77.03a427.39 ± 57.79a402.40 ± 91.84a
Total4834.8 ± 290.75a5065.95 ± 163.74a5065.99 ± 728.55a5048.56 ± 468.03a5807.30 ± 677.05a6285.18 ± 1136.82a6375.35 ± 1373.16a6303.03 ± 1123.34a7073.88 ± 669.84a7042.78 ± 588.29a6894.94 ± 117.30a7230.73 ± 620.73a
FASF20.15 ± 5.92a18.12 ± 1.96a15.99 ± 4.05a18.33 ± 3.53a7.12 ± 4.00a4.54 ± 1.41a5.82 ± 1.32a4.47 ± 2.32a1.46 ± 1.07b1.32 ± 0.71b1.47 ± 0.75b6.41 ± 3.38a
SC204.62 ± 10.90a211.87 ± 5.40a205.38 ± 29.09a187.82 ± 18.77a365.77 ± 58.68a368.83 ± 77.60a368.94 ± 63.52a378.25 ± 84.14a253.05 ± 22.47a237.43 ± 20.28a240.84 ± 15.96a261.17 ± 11.06a
CWB28.25 ± 4.52a29.48 ± 8.75a23.96 ± 3.36a24.19 ± 3.25a99.14 ± 34.37a79.05 ± 27.59a77.82 ± 25.64a89.62 ± 27.38a30.04 ± 8.20a26.04 ± 3.46a31.34 ± 5.69a34.94 ± 8.60a
Total253.02 ± 14.59a259.47 ± 9.93a245.33 ± 35.83a230.34 ± 21.64a469.18 ± 95.30a451.51 ± 108.24a451.42 ± 93.64a471.44 ± 118.46a284.55 ± 31.80a264.80 ± 24.00a273.66 ± 22.65a302.53 ± 17.81a
SASF80.23 ± 21.57a70.81 ± 21.17a62.43 ± 13.86a25.97 ± 2.08b47.00 ± 11.33 a40.48 ± 4.90a36.59 ± 10.05a32.22 ± 9.40a27.08 ± 3.36a25.83 ± 6.41ab20.02 ± 0.73bc15.73 ± 2.01c
SC95.39 ± 25.08a77.29 ± 22.68a71.87 ± 9.72a36.48 ± 3.47b82.89 ± 14.84a79.94 ± 16.82a65.14 ± 8.00a58.75 ± 11.27a54.71 ± 3.44a50.22 ± 6.18a49.57 ± 6.17a43.47 ± 7.21a
CWBNDNDNDNDNDNDNDNDNDNDNDND
Total175.62 ± 46.53a148.10 ± 42.60a134.30 ± 20.91a62.45 ± 4.49b120.49 ± 24.20a120.42 ± 24.12a101.73 ± 18.12a90.97 ± 22.07a81.78 ± 4.17a76.05 ± 10.45a69.58 ± 6.77ab59.21 ± 8.69b
Data labeled with different letters (a–c) differ significantly for each species, control and treatments, at p < 0.05.

