1. Introduction
The
Lamiaceae family consists of approximately 200 genera and over 3500 species and is widely distributed across the world. In China, there are 102 genera and approximately 800 species of
Lamiaceae, including
Mentha,
Scutellaria,
Origanum,
Nepeta,
Elsholtzia, and
Thymus [
1]. The majority of
Lamiaceae plants are rich in aromatic and non-volatile compounds and have considerable medicinal and functional value [
2]. The stems and leaves of most Lamiaceae plants are covered with glandular trichomes, which are the primary sites for the synthesis, accumulation, and storage of essential oils [
3]. The pharmacological significance of
Lamiaceae volatile oils has been well-documented across multiple genera. For instance, the essential oil (EO) of
Schizonepeta spp. has been demonstrated to exhibit a broad spectrum of pharmacological activities, including anti-inflammatory, antioxidant, antimicrobial, antiviral, insecticidal, hemostatic, and antitumor effects [
4,
5]. Similarly, EOs derived from
Agastache spp. have shown remarkable antibacterial and cytotoxic activities, displaying potent inhibitory effects against pathogenic bacteria such as
Escherichia coli (
E. coli) and
Staphylococcus aureus (
S. aureus), as well as significant cytotoxicity against triple-negative breast cancer and hepatocellular carcinoma cell lines [
6]. Furthermore,
Perilla frutescens, a traditional medicinal and edible plant widely cultivated in East Asia, has been reported to possess multiple therapeutic properties, including anti-inflammatory, antimicrobial, antioxidant, and hepatoprotective activities [
7].
Microbial contamination of food products poses a persistent challenge to the food industry and public health. In this context, plant-derived EOs have attracted considerable attention as natural flavoring, preservative, and antimicrobial agents. Several
Lamiaceae EOs, including oregano and peppermint oils, have demonstrated antibacterial activity against foodborne pathogens such as
E. coli and
S. aureus, supporting their potential applications in food preservation [
8,
9,
10]. Beyond their antimicrobial applications,
Lamiaceae EOs have also attracted considerable interest for their potential anticancer and anti-inflammatory activities. Previous studies have reported that EOs from species such as
Origanum vulgare and
Rosmarinus officinalis can inhibit tumor growth or cancer-related cellular processes, with effects associated with apoptosis and modulation of relevant signaling pathways [
11,
12,
13,
14]. These findings further highlight the diverse biological activities of
Lamiaceae EOs and support their continued investigation as potential sources of bioactive compounds.
Previous comparative studies have investigated the chemical composition and selected biological activities of EOs from multiple
Lamiaceae species [
15,
16]. However, differences in plant materials, geographical origin, harvesting conditions, developmental stage, EO extraction procedures, analytical platforms, and bioactivity assays may limit direct comparisons across species and studies. Moreover, previous comparative investigations have generally focused on selected biological endpoints, whereas comparative assessments integrating chemical profiling with multiple biological activities under a relatively consistent experimental framework remain limited. To address this gap, the present study selected 13
Lamiaceae species and systematically characterized their EO compositions and antioxidant, antibacterial, cytotoxic, and anti-inflammatory activities using a standardized experimental workflow. Multivariate analysis was used to characterize differences in EO chemical composition, while correlation analysis was performed as an exploratory approach to examine potential associations between major volatile constituents and biological activities. These associations were interpreted as exploratory and were not used to infer direct causality or experimentally validated synergistic interactions. By integrating chemical composition profiles with multiple biological endpoints, this study aimed to comparatively characterize the chemical diversity and multidimensional bioactivity patterns of 13
Lamiaceae EOs and to provide testable hypotheses for subsequent mechanistic investigations.
2. Results
2.1. Plant Resources and EO Extraction
Lamiaceae plants are widely distributed across almost all regions of China. China has approximately 99 genera and over 800 species of
Lamiaceae plants, accounting for about 25% of the global total. The color of EOs extracted from these plants can be light yellow, yellow, or orange-red. Representative photographs of the 13 extracted EOs showing their characteristic color differences are provided in
Supplementary Figure S1. In this study, the yield of EO (wt %) from 13
Lamiaceae plants ranged from 1.47% to 3.16%. The highest yield was from
Origanum vulgare (3.16%), followed by
Nepeta cataria (3.12%),
Elsholtzia ciliata (2.84%),
Perilla frutescens (2.16%),
Mentha canadensis (2.13%),
Scutellaria baicalensis (1.83%),
Rosmarinus officinalis (1.79%),
Schizonepeta tenuifolia (1.73%), and
Scutellaria scordifolia (1.52%) [
17].
Phlomis mongolica exhibited the lowest EO yield (1.47%), followed by species of the
Thymus genus (
Thymus citriodorus,
Thymus vulgaris, and
Thymus mongolicus; 1.50%) (
Table 1).
2.2. GC-MS Analysis
The total ion current chromatograms (TIC) of 13 EOs were obtained using gas chromatography–mass spectrometry (GC-MS), as shown in
Figure S2. The TIC profiles comprehensively demonstrated the composition of volatile compounds in each EO, revealing significant differences in the number of chromatographic peaks, retention time, and relative abundance among different species. The mass spectra of the main chromatographic peaks were compared with the NIST mass spectrometry database of the United States National Institute of Standards and Technology (NIST). Experimental retention indices (RI exp) were calculated using n-alkane standards (C
6–C
40) and compared with retention indices reported in the NIST database and published literature (RI lit) to assist compound identification. Based on this, a systematic analysis of the chemical composition of 13 EOs from the
Lamiaceae family was conducted, and a total of 51 volatile compounds were identified (
Table 2), mainly including monoterpenes, sesquiterpenes, and oxygen-containing derivatives. The main volatile compounds with a relative content exceeding 5% in each EO are summarized in
Table S1, and the distribution of major components exhibited significant interspecific differences and chemical diversity among the species.
Rosmarinus officinalis was characterized by high relative contents of α-pinene (16.00%) and eucalyptol (38.00%);
Scutellaria baicalensis and
Origanum vulgare were rich in limonene (41.78% and 34.48%, respectively);
Nepeta cataria and
Elsholtzia ciliata contained high proportions of iridoid nepetalactone (16.30% and 35.00%, respectively);
Mentha canadensis had an extremely high content of L-menthol (34.83%);
Perilla frutescens had a high content of perilla aldehyde (35.00%);
Origanum vulgare was rich in carvacrol (28.00%);
Scutellaria baicalensis contained a large amount of isopulegone (10.94%); and samples from the
Thymus genus (
Thymus vulgaris,
Thymus mongolicus, and
Thymus citriodorus) were mainly characterized by high contents of thymol (11.00%, 13.30%, and 25.00%, respectively). With regard to the abundance of specific compounds, limonene exhibited the highest relative content in
Scutellaria baicalensis (41.78%), whereas (Z)-nerolidol and bornylene were present at very low relative abundances in most samples, representing trace components [
16]. The above analysis revealed significant differences in the chemical fingerprint profiles of the EOs from different genera, reflecting the diversity of their volatile chemical compositions.
2.3. Chemical Profiling and Multivariate Analysis
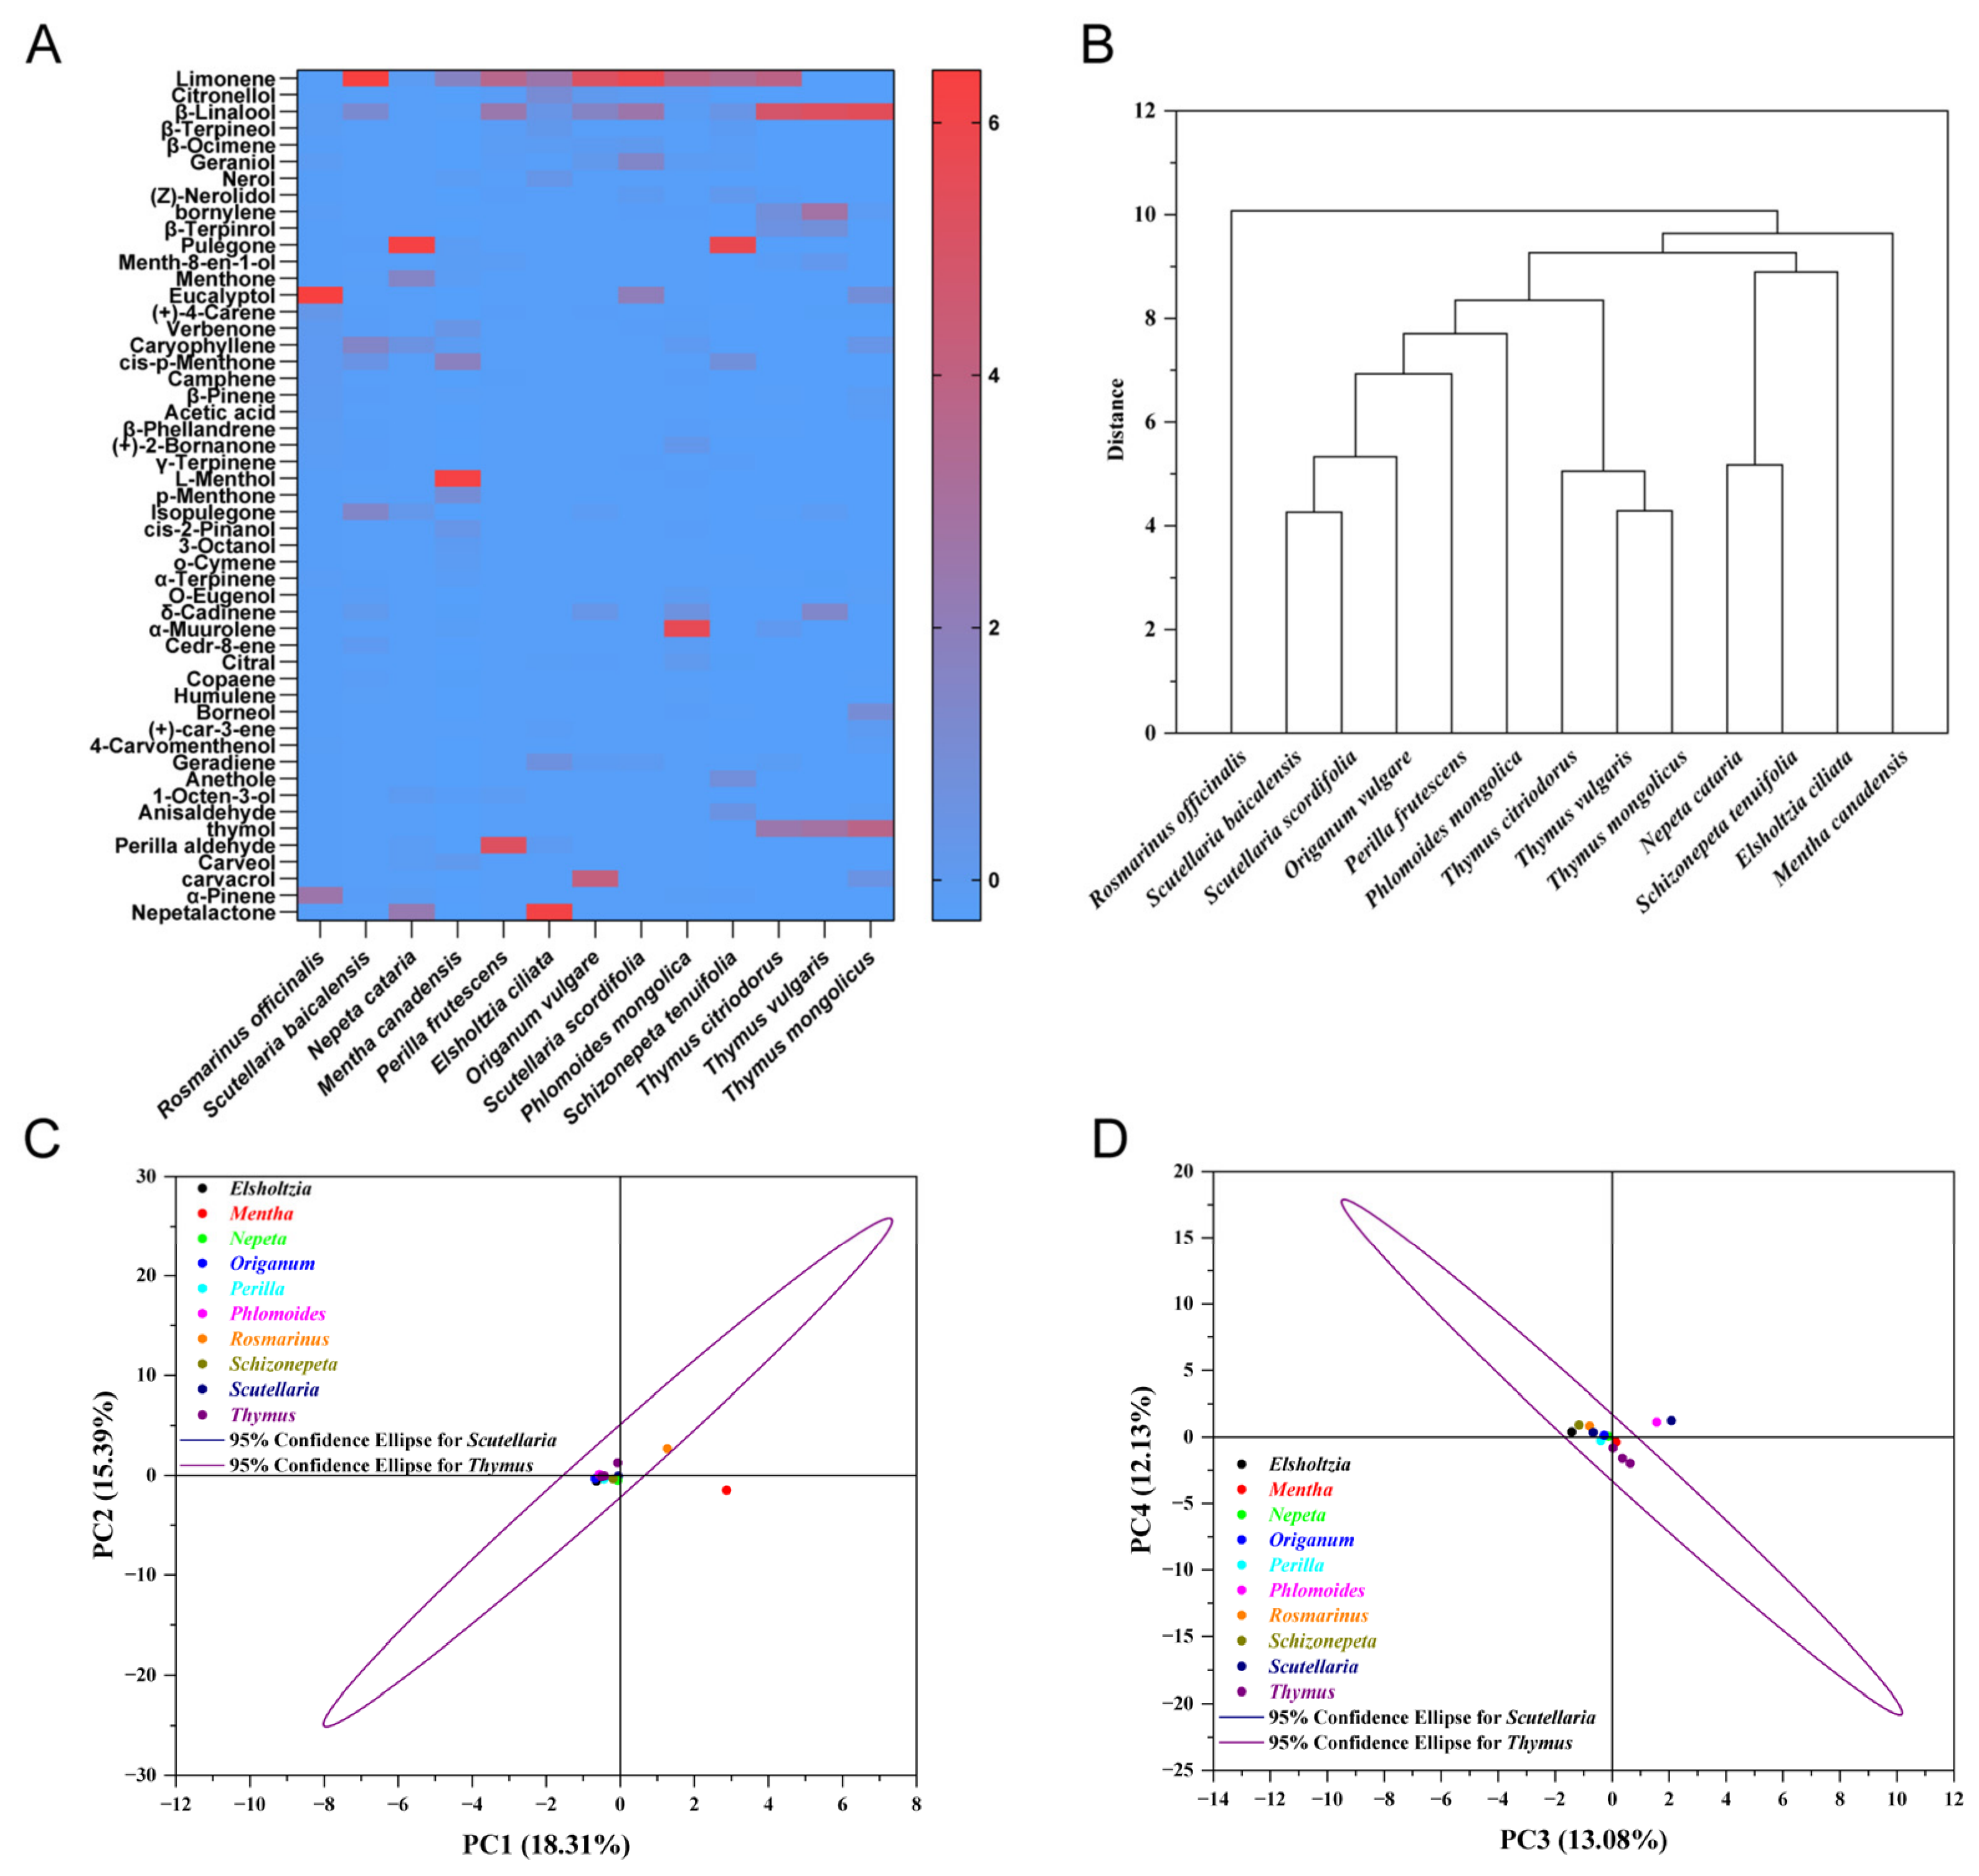
To comprehensively visualize the chemical relationships among the 13 EOs, hierarchical clustering analysis (HCA) and principal component analysis (PCA) were performed based on the GC-MS volatile profiles (
Figure 1).
A hierarchical clustering heatmap (
Figure 1A) and the corresponding dendrogram (
Figure 1B) were constructed to reveal the similarity patterns of major volatile compounds across samples. In the heatmap, the color scale from blue to red represents row-wise z-score-standardized compound abundances, indicating relative enrichment (red) or depletion (blue) across samples. Both samples and compounds were clustered using Euclidean distance and Ward’s linkage method. At the compound level, based on their distribution patterns and structural features, three compound clusters (A–C) were distinguished. Cluster A (phenolic monoterpenes: carvacrol and thymol) was highly accumulated in
Origanum and
Thymus (red) but nearly undetectable in other genera (dark blue), representing characteristic compounds of these genera. Cluster B (sesquiterpenes: β-caryophyllene, caryophyllene oxide, and α-muurolene) was enriched in specific genera, e.g.,
Scutellaria scordifolia with 31.93% α-muurolene. Cluster C (monoterpene hydrocarbons: α-pinene, limonene, and p-menthene) was ubiquitously distributed across most genera as shared skeletal components.
At the sample level, the 13 oils were classified into three chemotype groups (I–III). Group I comprised only Origanum, characterized by extreme accumulation of carvacrol (the dominant chemotaxonomic marker), accompanied by relatively high levels of limonene as a minor co-occurring monoterpene hydrocarbon. Group II included Scutellaria and Thymus as two sub-clusters: Scutellaria was enriched in sesquiterpenes (Cluster B), whereas Thymus was dominated by moderate-to-high levels of both monoterpene hydrocarbons (Cluster C) and phenolic monoterpenes (Cluster A). Group III contained the remaining six genera (Elsholtzia, Mentha, Nepeta, Perilla, Phlomis, and Schizonepeta), which exhibited moderately similar color patterns dominated by common monoterpene hydrocarbons with no genus-specific markers; however, Phlomis mongolica (40.00% pulegone) and Schizonepeta tenuifolia (characterized by phenylpropanoids anethole and anisaldehyde) showed distinct chemical features, indicating some degree of heterogeneity within this group.
PCA was performed to complement the clustering results and to explore the multidimensional variance structure of the dataset (
Figure 1C,D). The first four principal components (PC1–PC4) collectively accounted for 58.88% of the total variance. In the PC1–PC2 score plot (
Figure 1C),
Mentha and
Rosmarinus were clearly separated from the other genera along the positive directions of PC1 and PC2, respectively, which was associated with the high contents of L-menthol (34.83%) and α-pinene (16.00%)/eucalyptol (38.00%). Meanwhile, the remaining genera, including
Origanum,
Thymus, and
Scutellaria, were positioned near the origin, indicating that the primary variance captured by PC1 and PC2 was predominantly driven by the distinct chemical profiles of
Mentha and
Rosmarinus. Among the genera distributed around the origin,
Phlomis (40.00% pulegone) and
Schizonepeta (characterized by anethole and anisaldehyde) exhibited moderate deviations, consistent with their distinctive chemical features observed in the heatmap.
In the PC3–PC4 score plot (
Figure 1D), the separation pattern changed markedly, revealing finer chemical variations that were not captured by the first two principal components.
Scutellaria was positioned in the positive direction of PC3, which may be attributed to its limonene-rich profile (41.78%).
Thymus was positioned in the negative direction of PC4, possibly due to its enrichment in thymol and other oxygenated monoterpenes. These higher-order separation patterns were broadly consistent with the sub-clustering patterns observed in the heatmap and dendrogram, indicating that PC3 and PC4 captured additional chemical variation that was not apparent in the PC1–PC2 space.
Taken together, the hierarchical clustering and PCA analyses demonstrated substantial interspecific differences in the volatile chemical composition of the 13 Lamiaceae EOs and identified several characteristic chemotypes. Origanum vulgare was distinguished by a carvacrol-rich profile, whereas the Thymus oils were characterized by relatively high levels of thymol. Rosmarinus officinalis, Perilla frutescens, and Mentha canadensis showed distinctive oxygenated-monoterpene or monoterpenoid profiles dominated by eucalyptol, perillaldehyde, and L-menthol, respectively. Scutellaria baicalensis was characterized by a limonene-rich profile, while Elsholtzia ciliata and Nepeta cataria showed relatively high proportions of nepetalactone. In addition, Phlomis mongolica and Schizonepeta tenuifolia displayed distinctive pulegone- and phenylpropanoid-rich profiles, respectively.
2.4. Antioxidant Activity
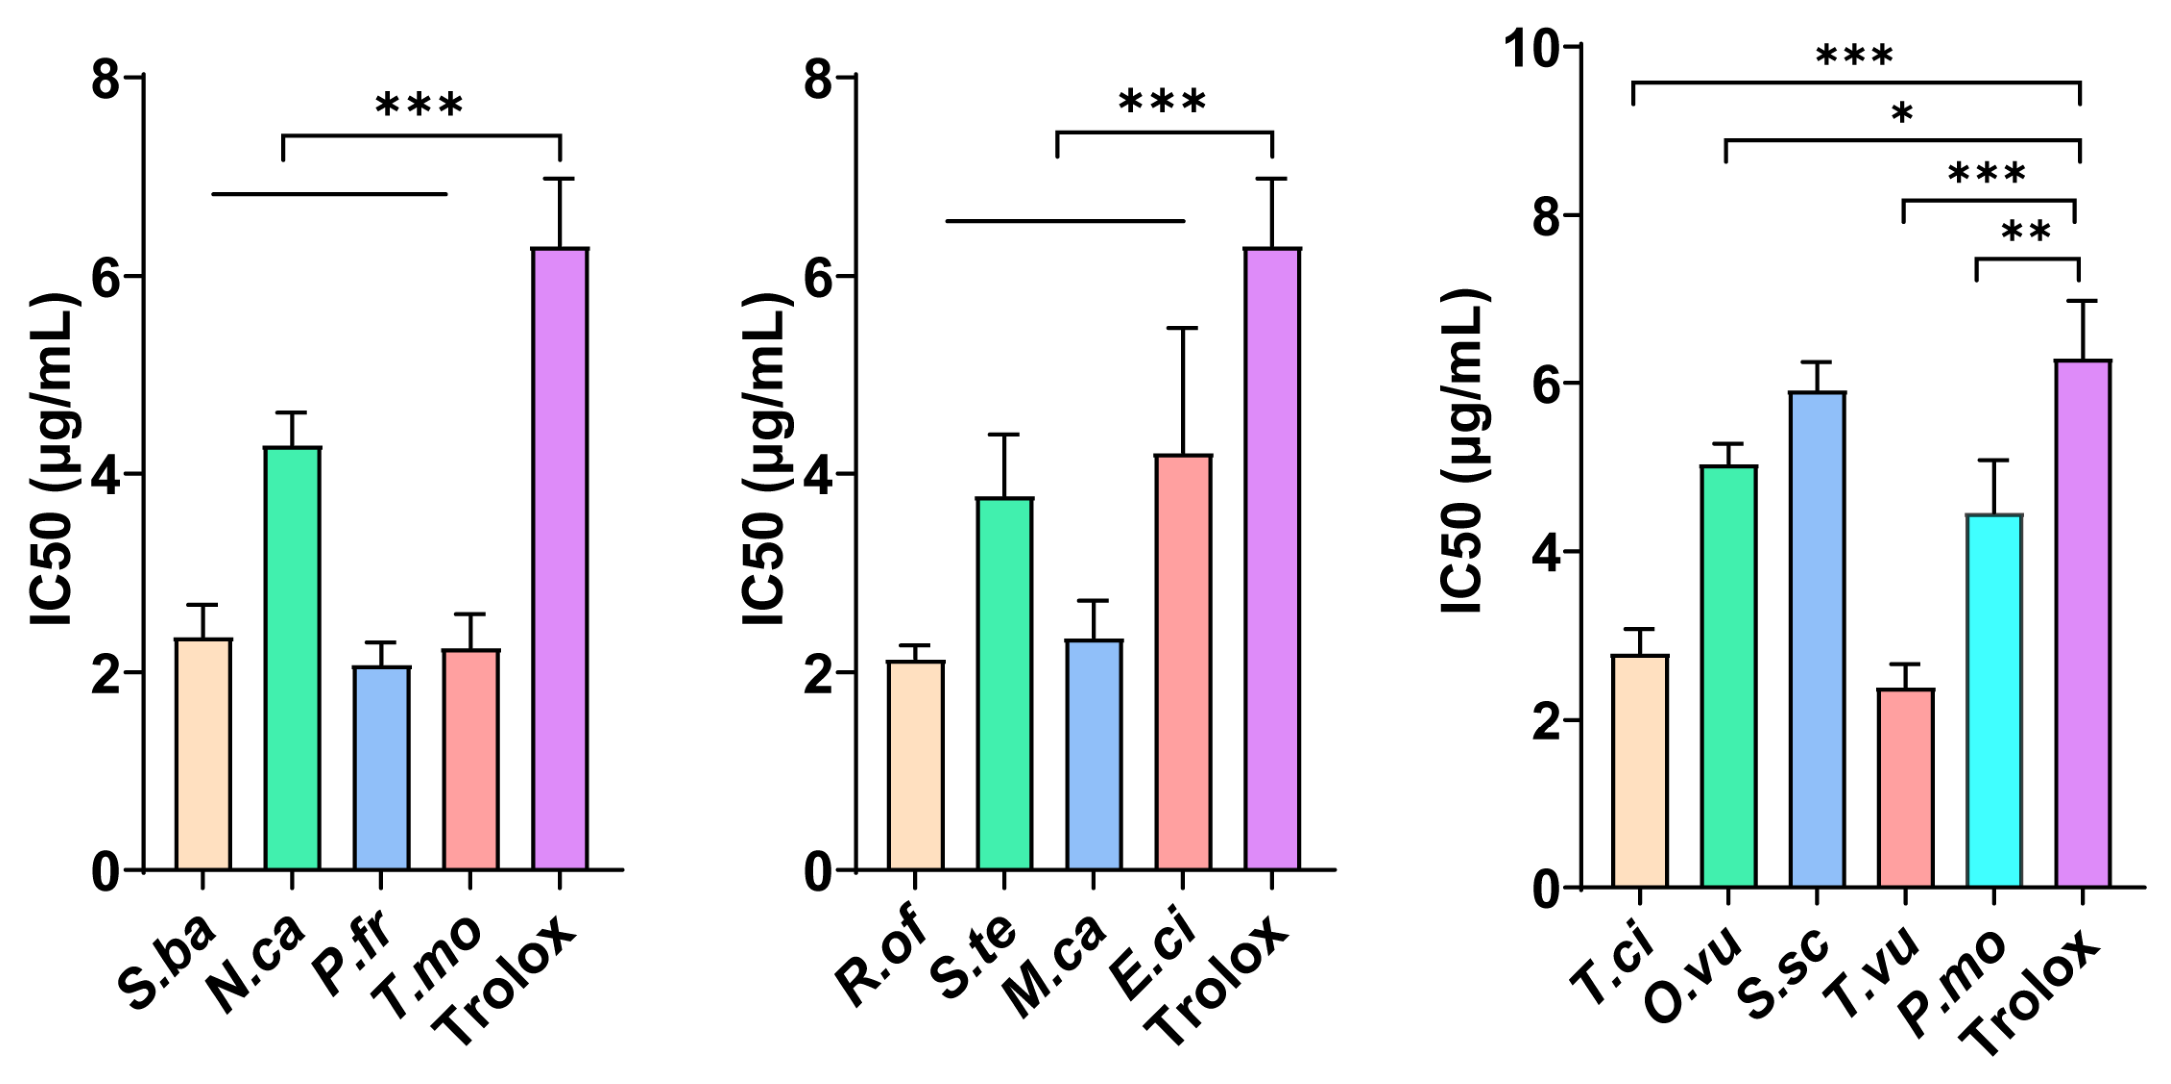
The antioxidant activities of the 13 EOs were evaluated using the 2,2-Diphenyl-1-picrylhydrazyl (DPPH) radical-scavenging assay. The IC
50 values are presented in
Figure 2, while the single-concentration DPPH scavenging rates are provided in
Table S2. The IC
50 values ranged from 2.08 to 5.92 μg/mL.
Perilla frutescens (2.08 μg/mL) and
Rosmarinus officinalis (2.14 μg/mL) exhibited the strongest antioxidant activities, followed by
Thymus mongolicus (2.25 μg/mL),
Mentha canadensis (2.35 μg/mL), and
Scutellaria baicalensis (2.36 μg/mL). The positive control Trolox showed an IC
50 value of 6.31 μg/mL under the same assay conditions. The single-concentration DPPH scavenging rates showed a generally consistent pattern.
The differences in antioxidant activity were observed across EOs with distinct chemical profiles. Rosmarinus officinalis was characterized by a high relative abundance of eucalyptol (38.00%), Perilla frutescens by perillaldehyde (35.00%), Scutellaria baicalensis by limonene (41.78%), Mentha canadensis by L-menthol (34.83%), and the Thymus oils by relatively high levels of thymol. However, Spearman’s rank correlation analysis after Benjamini–Hochberg false discovery rate (FDR) correction revealed no significant correlations between the relative abundance of the ten major volatile compounds and antioxidant activity (q > 0.05), indicating that the observed antioxidant activity could not be attributed to any single major constituent based on the present data.
2.5. Antibacterial Activity
The antibacterial activities of 13
Lamiaceae EOs were evaluated against five opportunistic pathogens (
Table 3). Inhibition zone diameters ranged from 6.00 to 38.13 mm, with NI (no inhibition) indicating no inhibition beyond the 6-mm paper disc. Overall, active oils showed stronger inhibition against Gram-positive than Gram-negative bacteria. Based on the inhibition zone results in the disc diffusion assay, four EOs showing relatively strong antibacterial activity, namely
Origanum vulgare,
Thymus citriodorus,
Thymus vulgaris, and
Thymus mongolicus, were selected from the 13 EOs for subsequent minimum inhibitory concentration (MIC) determination. Among these oils,
Thymus mongolicus produced the largest inhibition zone against
S. haemolyticus (38.13 ± 1.95 mm). The MIC results for the four selected oils (
Table 4) showed values ranging from 2 to 8 µg/mL, with generally lower MICs observed for Gram-positive strains.
Against E. coli, Thymus oils showed strong activity, with Thymus mongolicus exhibiting the largest zone (23.43 mm), while Mentha canadensis and Nepeta cataria showed NI. MICs against E. coli were 2 µg/mL for Origanum vulgare, Thymus citriodorus, and Thymus mongolicus, and 4 µg/mL for Thymus vulgaris. Against K. pneumoniae, Origanum vulgare showed the lowest MIC (2 µg/mL), followed by Thymus mongolicus (4 µg/mL), while Thymus citriodorus and Thymus vulgaris showed higher MICs (8 µg/mL each). Against S. marcescens, Origanum vulgare showed the largest inhibition zone (15.17 mm), followed by Thymus oils (12.43–13.16 mm); MICs were 4 µg/mL for Origanum vulgare and Thymus mongolicus, and 8 µg/mL for Thymus citriodorus and Thymus vulgaris.
2.6. Cytotoxicity
The cytotoxic effects of 13 EOs derived from
Lamiaceae species against human hepatocellular carcinoma-related HepG2 and prostate adenocarcinoma LNCaP cells were evaluated by determining their half-maximal inhibitory concentrations (IC
50), with the results summarized in
Table 5. Their cytotoxicity toward the corresponding normal cell lines, THLE-2 and RWPE-1, was further assessed (
Table S3), and the selectivity index (SI) of each EO was calculated (
Figure S3). The goodness-of-fit of the concentration–response curves was assessed using the coefficient of determination (
R2), with the corresponding
R2 values provided in
Table S4.
All tested EOs exhibited IC50 values below 1.0 μg/mL against both cancer cell lines, although their in vitro selectivity varied among cell lines. Against HepG2 cells, Thymus vulgaris and Elsholtzia ciliata showed relatively low IC50 values of 0.35 and 0.36 μg/mL, respectively, whereas Thymus mongolicus showed the highest IC50 value (0.95 μg/mL) among the tested EOs (p < 0.05). The corresponding SI values for T. vulgaris and E. ciliata were 14.01 and 21.80, respectively, indicating greater in vitro selectivity toward HepG2 cells relative to the tested normal hepatocyte line. Against LNCaP cells, E. ciliata, Scutellaria baicalensis, and Perilla frutescens showed relatively low IC50 values of 0.31, 0.34, and 0.35 μg/mL, respectively. In contrast, Origanum vulgare and Rosmarinus officinalis showed relatively higher IC50 values of 0.83 and 0.81 μg/mL, respectively, with corresponding SI values of 12.58 and 10.03.
A comparison between the two cancer cell lines revealed cell line-dependent differences in EO sensitivity. Origanum vulgare and Rosmarinus officinalis showed approximately 1.6-fold higher IC50 values against LNCaP than against HepG2 cells, whereas Schizonepeta tenuifolia and Thymus citriodorus showed approximately 1.5-fold higher IC50 values against HepG2 than against LNCaP cells. Among the tested EOs, Elsholtzia ciliata and Perilla frutescens showed relatively low IC50 values across both cancer cell lines (0.31–0.40 μg/mL). Their corresponding SI values were 21.80 and 23.24 for HepG2, and 19.65 and 13.15 for LNCaP, respectively, indicating greater in vitro selectivity toward the tested cancer cell lines relative to the corresponding normal cell lines.
2.7. Correlation Analysis Between Volatile Compounds and Bioactivities
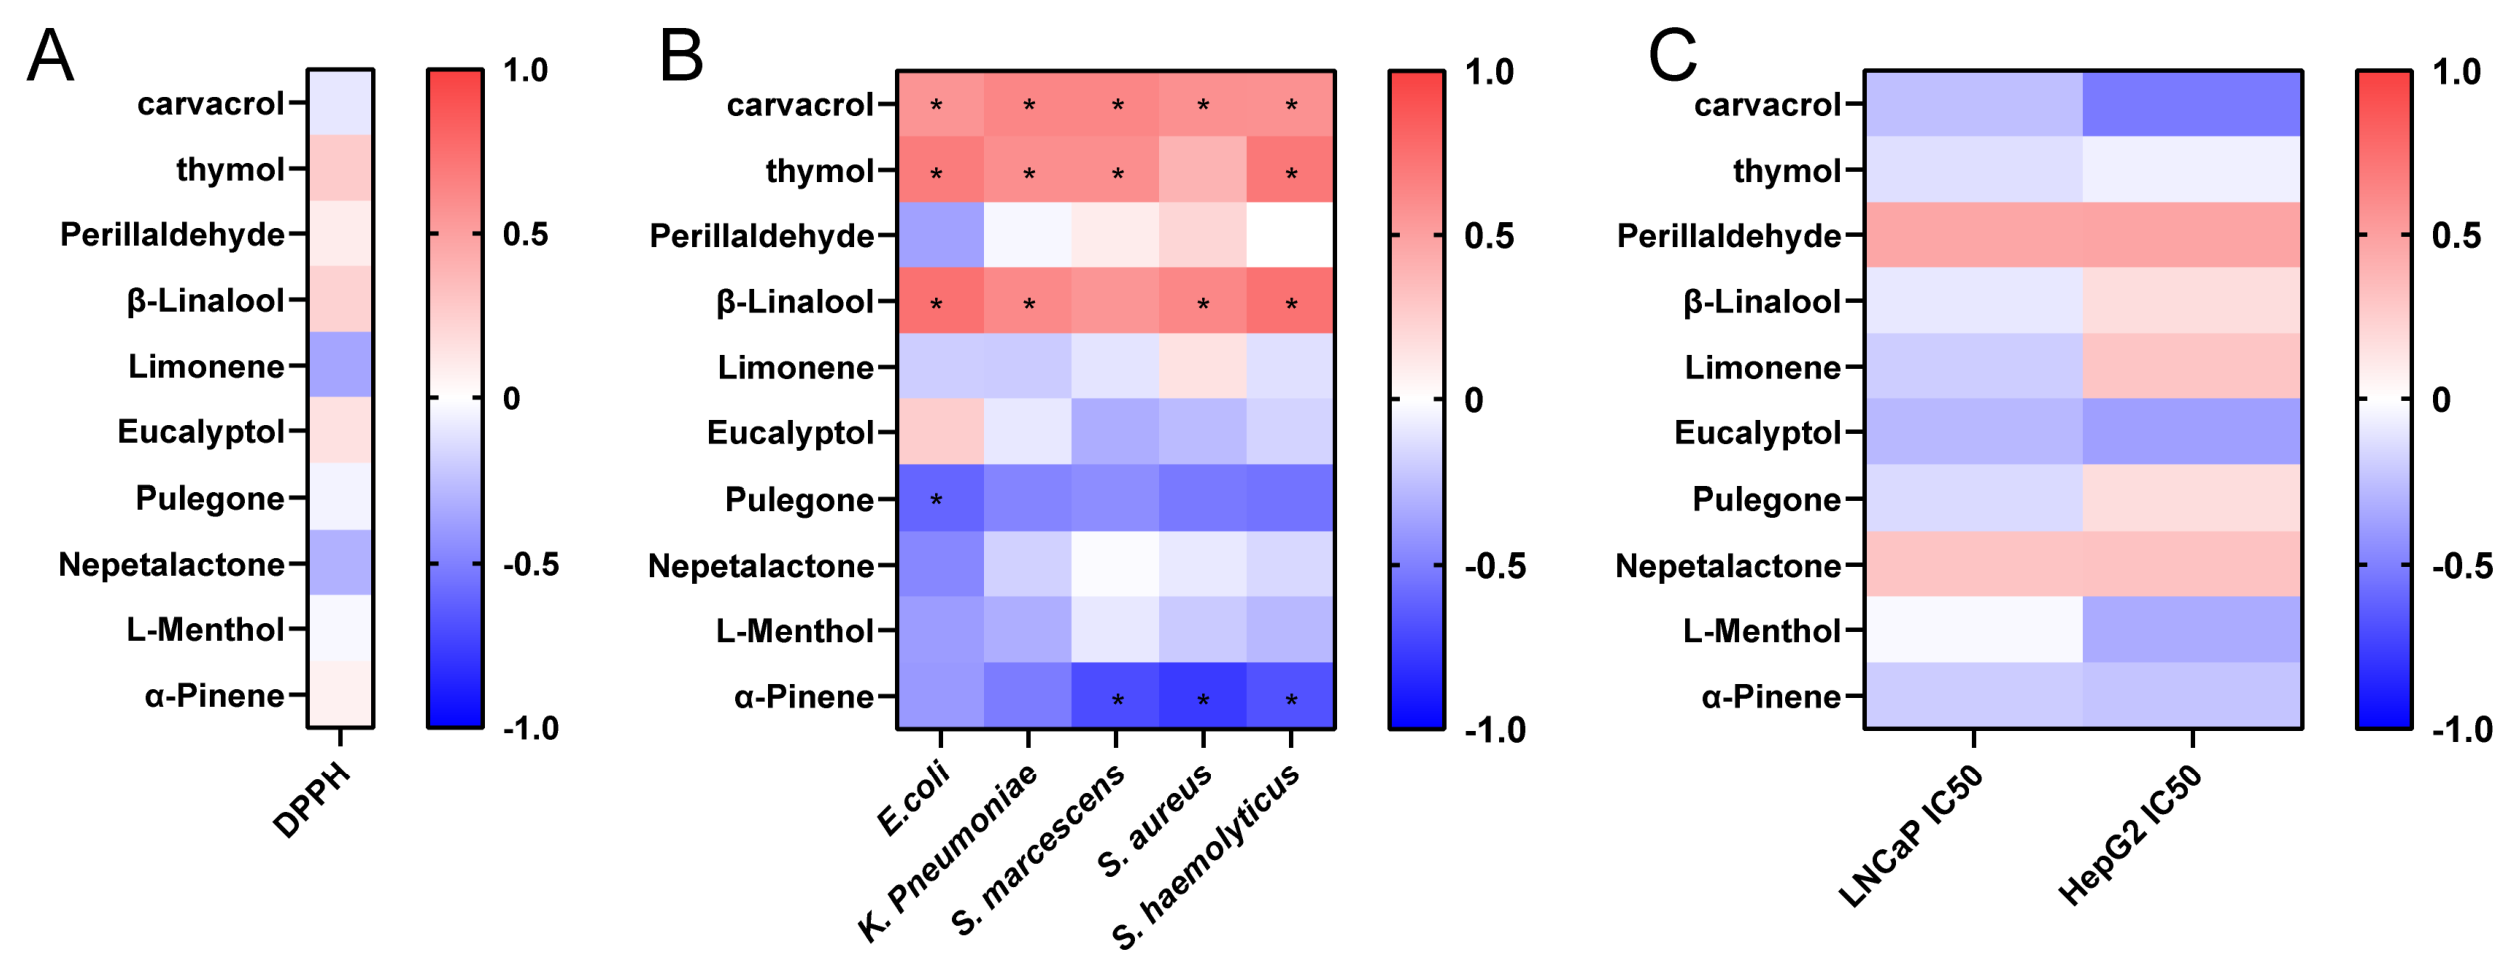
To further explore the potential chemical basis of the observed bioactivities, Spearman’s rank correlation analysis was performed between the relative contents of the ten major volatile compounds and the measured bioactivity indices (
Figure 3). GC-MS-based phytochemical profiling combined with chemical composition–activity analysis has been used to explore potential relationships between plant metabolites and biological activities [
22]. Because only 13 EOs were included, these analyses were considered exploratory and were used to identify associations rather than establish causal relationships. The complete Spearman correlation matrix, including correlation coefficients (ρ) and FDR-adjusted
q values, is provided in
Table S5.
For antioxidant activity, the strongest DPPH radical-scavenging activities were observed for Perilla frutescens and Rosmarinus officinalis, which were characterized by relatively high levels of perillaldehyde and eucalyptol, respectively. Other highly active oils, including Thymus, Mentha, and Scutellaria, were characterized by different dominant constituents. However, none of the ten major compounds showed a significant correlation with DPPH activity after Benjamini–Hochberg FDR correction (q > 0.05), indicating that the antioxidant activity could not be attributed to any single major constituent based on the present dataset.
In contrast, several volatile compounds were significantly associated with antibacterial activity [
23]. Carvacrol was positively correlated with inhibition zones against
K. pneumoniae,
S. marcescens, and
S. aureus, while thymol was positively correlated with
S. haemolyticus and
E. coli. β-Linalool was also positively correlated with
E. coli and
S. aureus. Conversely, α-pinene showed negative correlations with several bacterial strains. These findings identify carvacrol, thymol, and β-linalool as candidate constituents associated with antibacterial activity, although the correlations do not establish direct causality. For cytotoxicity, none of the ten major compounds showed significant correlations with IC
50 values against HepG2 or LNCaP cells after FDR correction (
q > 0.05).
Overall, the correlation analysis revealed activity-dependent associations between specific volatile constituents and antibacterial activity, whereas no significant associations were identified for antioxidant or cytotoxic activity. These findings suggest that the biological activities of the EOs cannot be consistently explained by the abundance of individual major constituents and may instead reflect differences in their overall chemical profiles.
2.8. EOs Alleviate Skin Inflammation by Reducing the Expression of Inflammation-Associated Molecules
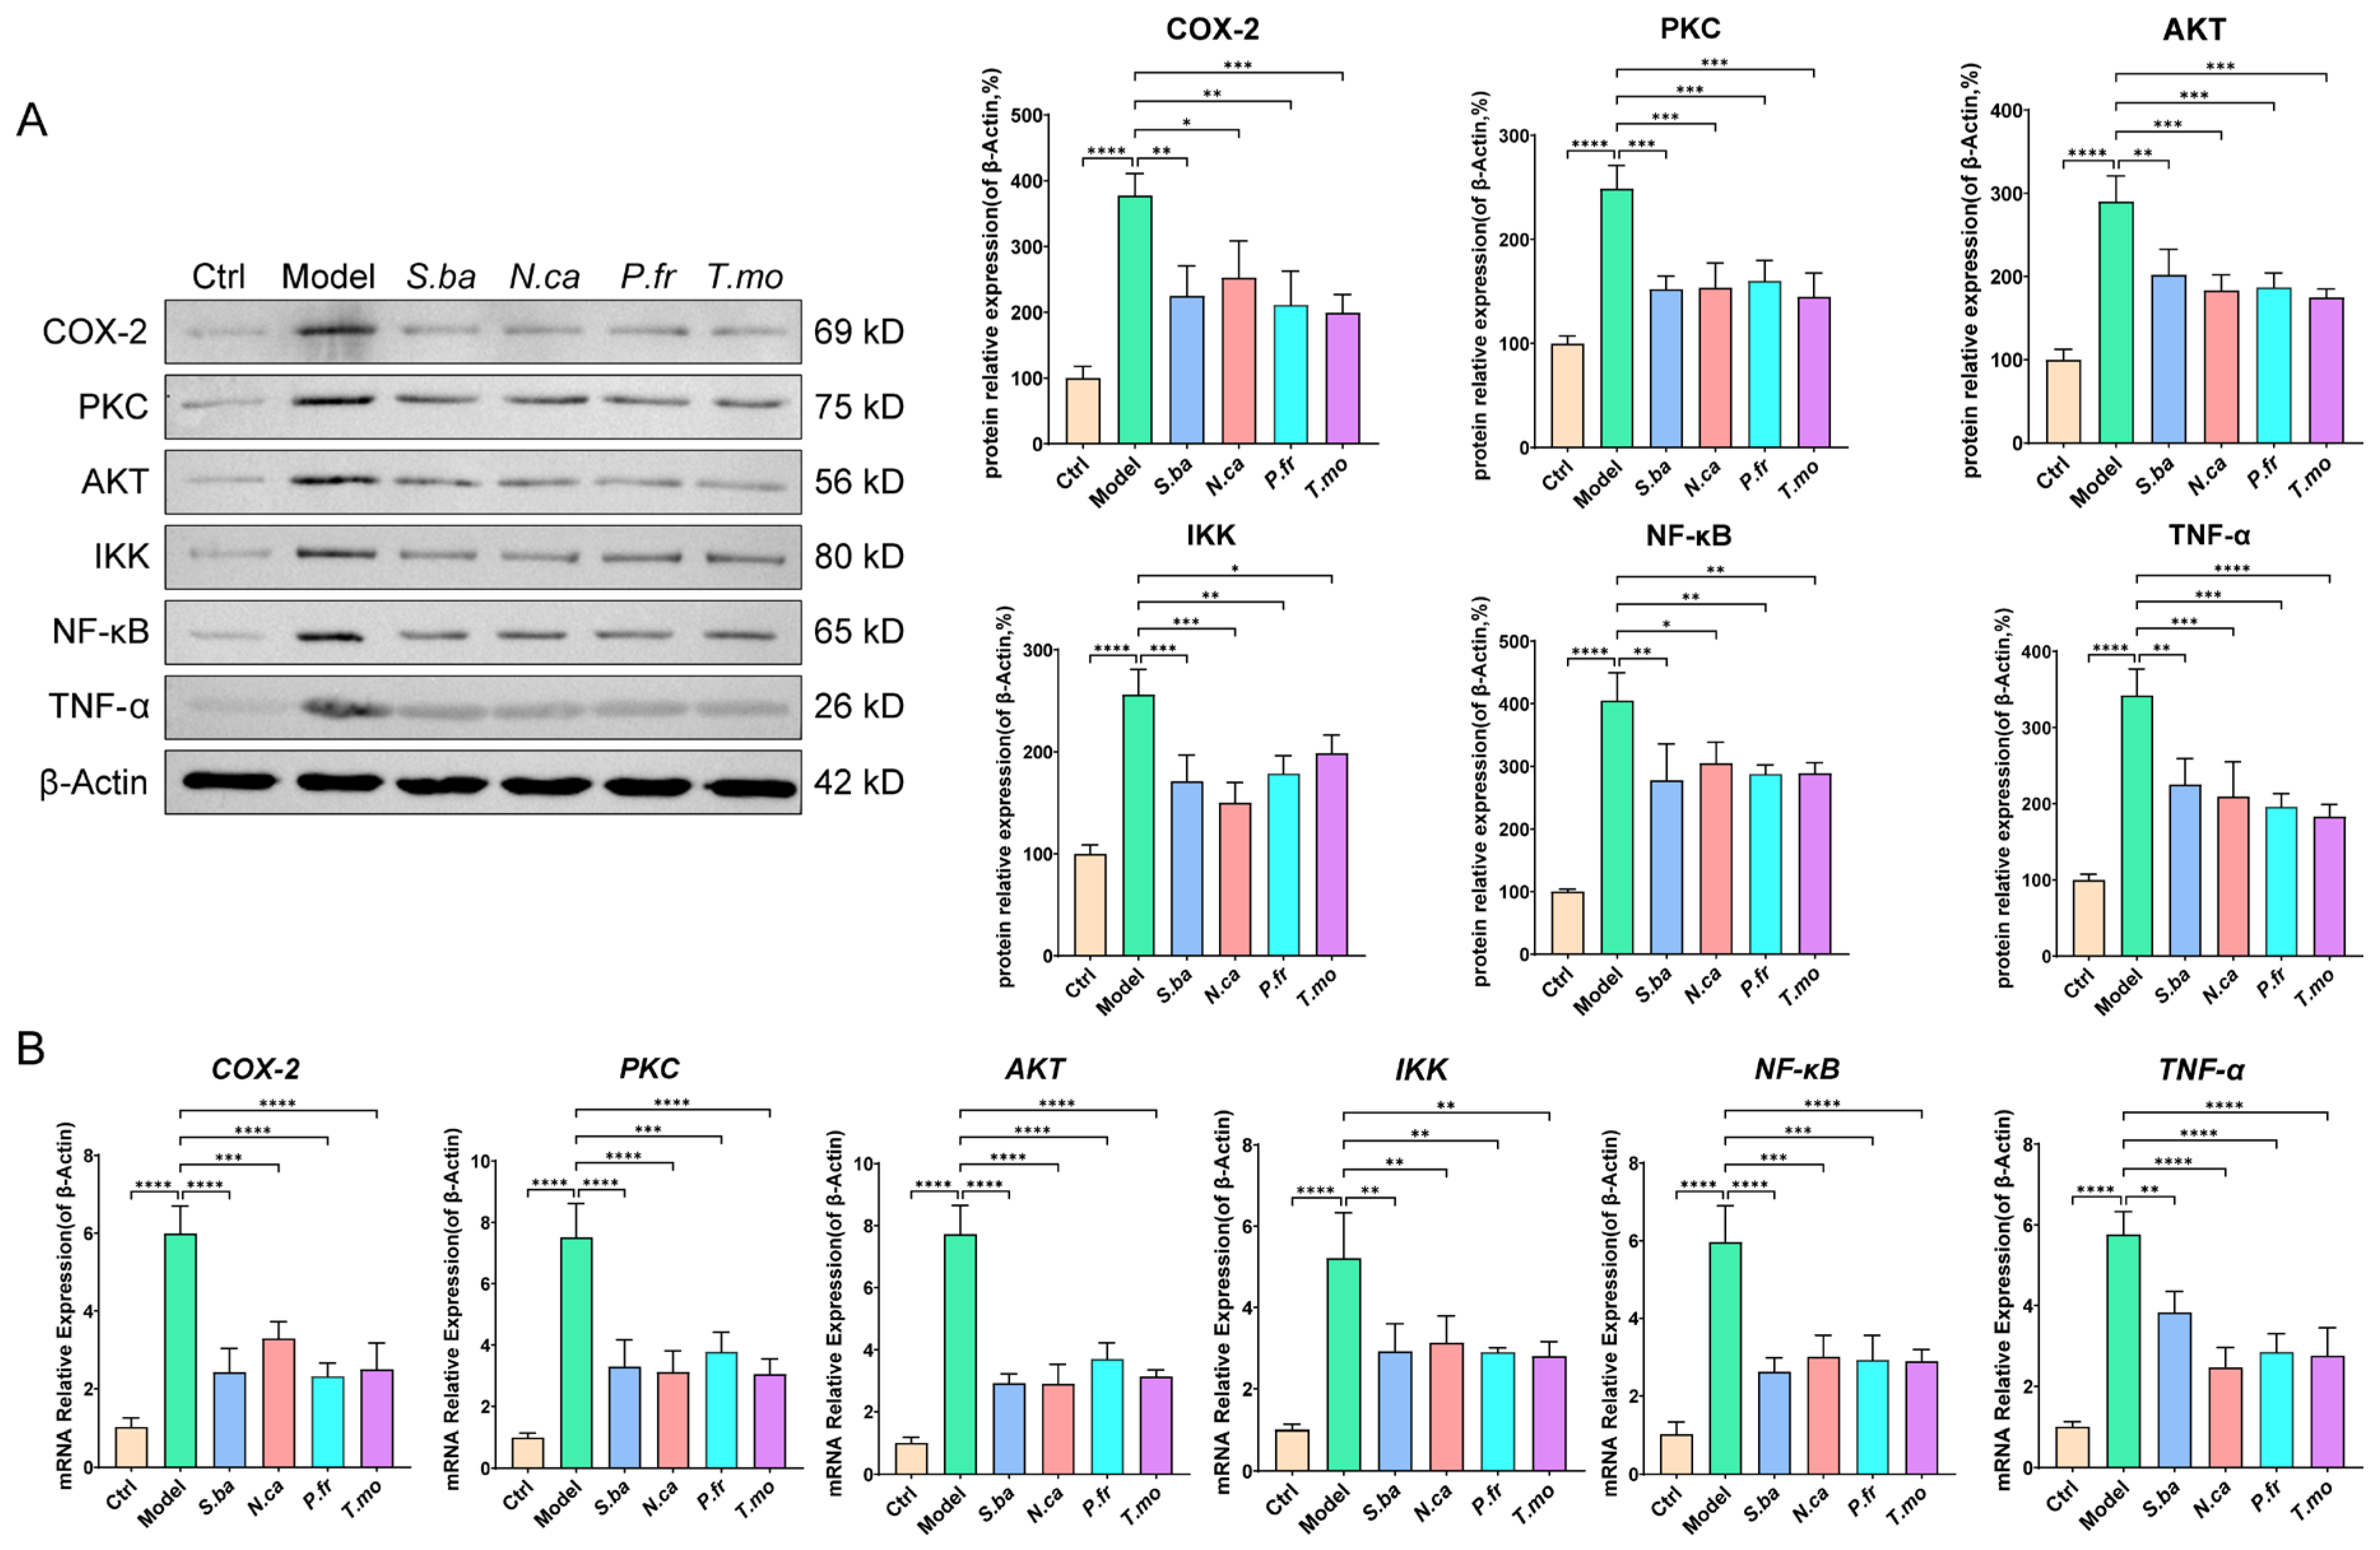
To evaluate the interventional effects of selected EOs on skin inflammation, we next investigated inflammatory signal transduction, the expression of inflammatory mediators, and histological damage. Western blotting revealed that when compared with the control group, the protein levels of Cyclooxygenase-2 (COX-2), tumor necrosis factor-alpha (TNF-α), nuclear factor-kappa B (NF-κB), IκB kinase (IKK), protein kinase B (Akt) and protein kinase C (PKC) proteins in skin tissues of the model group were significantly increased (
p < 0.05) (
Figure 4A and
Figure S4A,B), thus suggesting that the combination of sodium dodecyl sulfate (SDS) and squalene successfully induced a significant local inflammatory response. The observed increase in COX-2 indicated the active synthesis of inflammatory-related lipid mediators while the increase in TNF-α indicated an enhanced local pro-inflammatory state. The synchronous upregulation of IKK, NF-κB, and Akt was associated with changes in inflammation-related signaling. Previous studies reported that COX-2 is an important inflammatory-related enzyme in skin inflammation, that TNF-α can amplify inflammatory responses through the NF-κB/MAPK pathway, and that IKK, as the core regulatory node of NF-κB activation, plays a key role in the transduction of inflammatory signals. Furthermore, the PI3K/Akt axis plays a key role in the maintenance of skin homeostasis along with the occurrence and development of various non-tumorous skin diseases [
24,
25].
Compared with the model group, the expression levels of COX-2, PKC, Akt, IKK, NF-κB, and TNF-α proteins in each EO intervention group decreased to varying degrees (
p < 0.05) (
Figure 4A and
Figure S4C,D). Of these, the reduction in COX-2 and TNF-α indicated that EO intervention could reduce the generation of inflammatory mediators and the intensity of pro-inflammatory responses. The downregulation of PKC, Akt, IKK, and NF-κB was associated with reduced expression of inflammation-related signaling molecules. Collectively, these results indicated that different EOs were associated with reduced expression of inflammatory mediators and inflammation-related signaling molecules. Previous studies also showed that some EOs downregulated COX-2, TNF-α and NF-κB in a model of skin inflammation, accompanied by an improvement in the inflammatory phenotype, which is consistent with the changes observed in this study [
26].
Results arising from Quantitative Polymerase Chain Reaction (qPCR) confirmed the trends observed in our Western blotting analysis. Compared with the control group, the mRNA levels of
COX-2,
PKC,
Akt,
IKK,
NF-κB and
TNF-α in the model group were significantly increased (
p < 0.05,
Figure 4B and
Figure S5), indicating that the inflammatory activation induced by the model occurred not only at the protein level but also at the transcriptional level. Following intervention with different EOs, the mRNA levels of each inflammatory-related gene were lower than those in the model group (
p < 0.05), suggesting that EOs were associated with reduced transcription of inflammation-related genes. The changes in protein and mRNA levels were broadly consistent, supporting the association of EO treatment with reduced expression of inflammation-related molecules. Previous studies on the anti-inflammatory effects of EOs also suggested that the effects of EOs are often accompanied by a reduction in
NF-κB activation and a reduction in the expression of downstream pro-inflammatory cytokines.
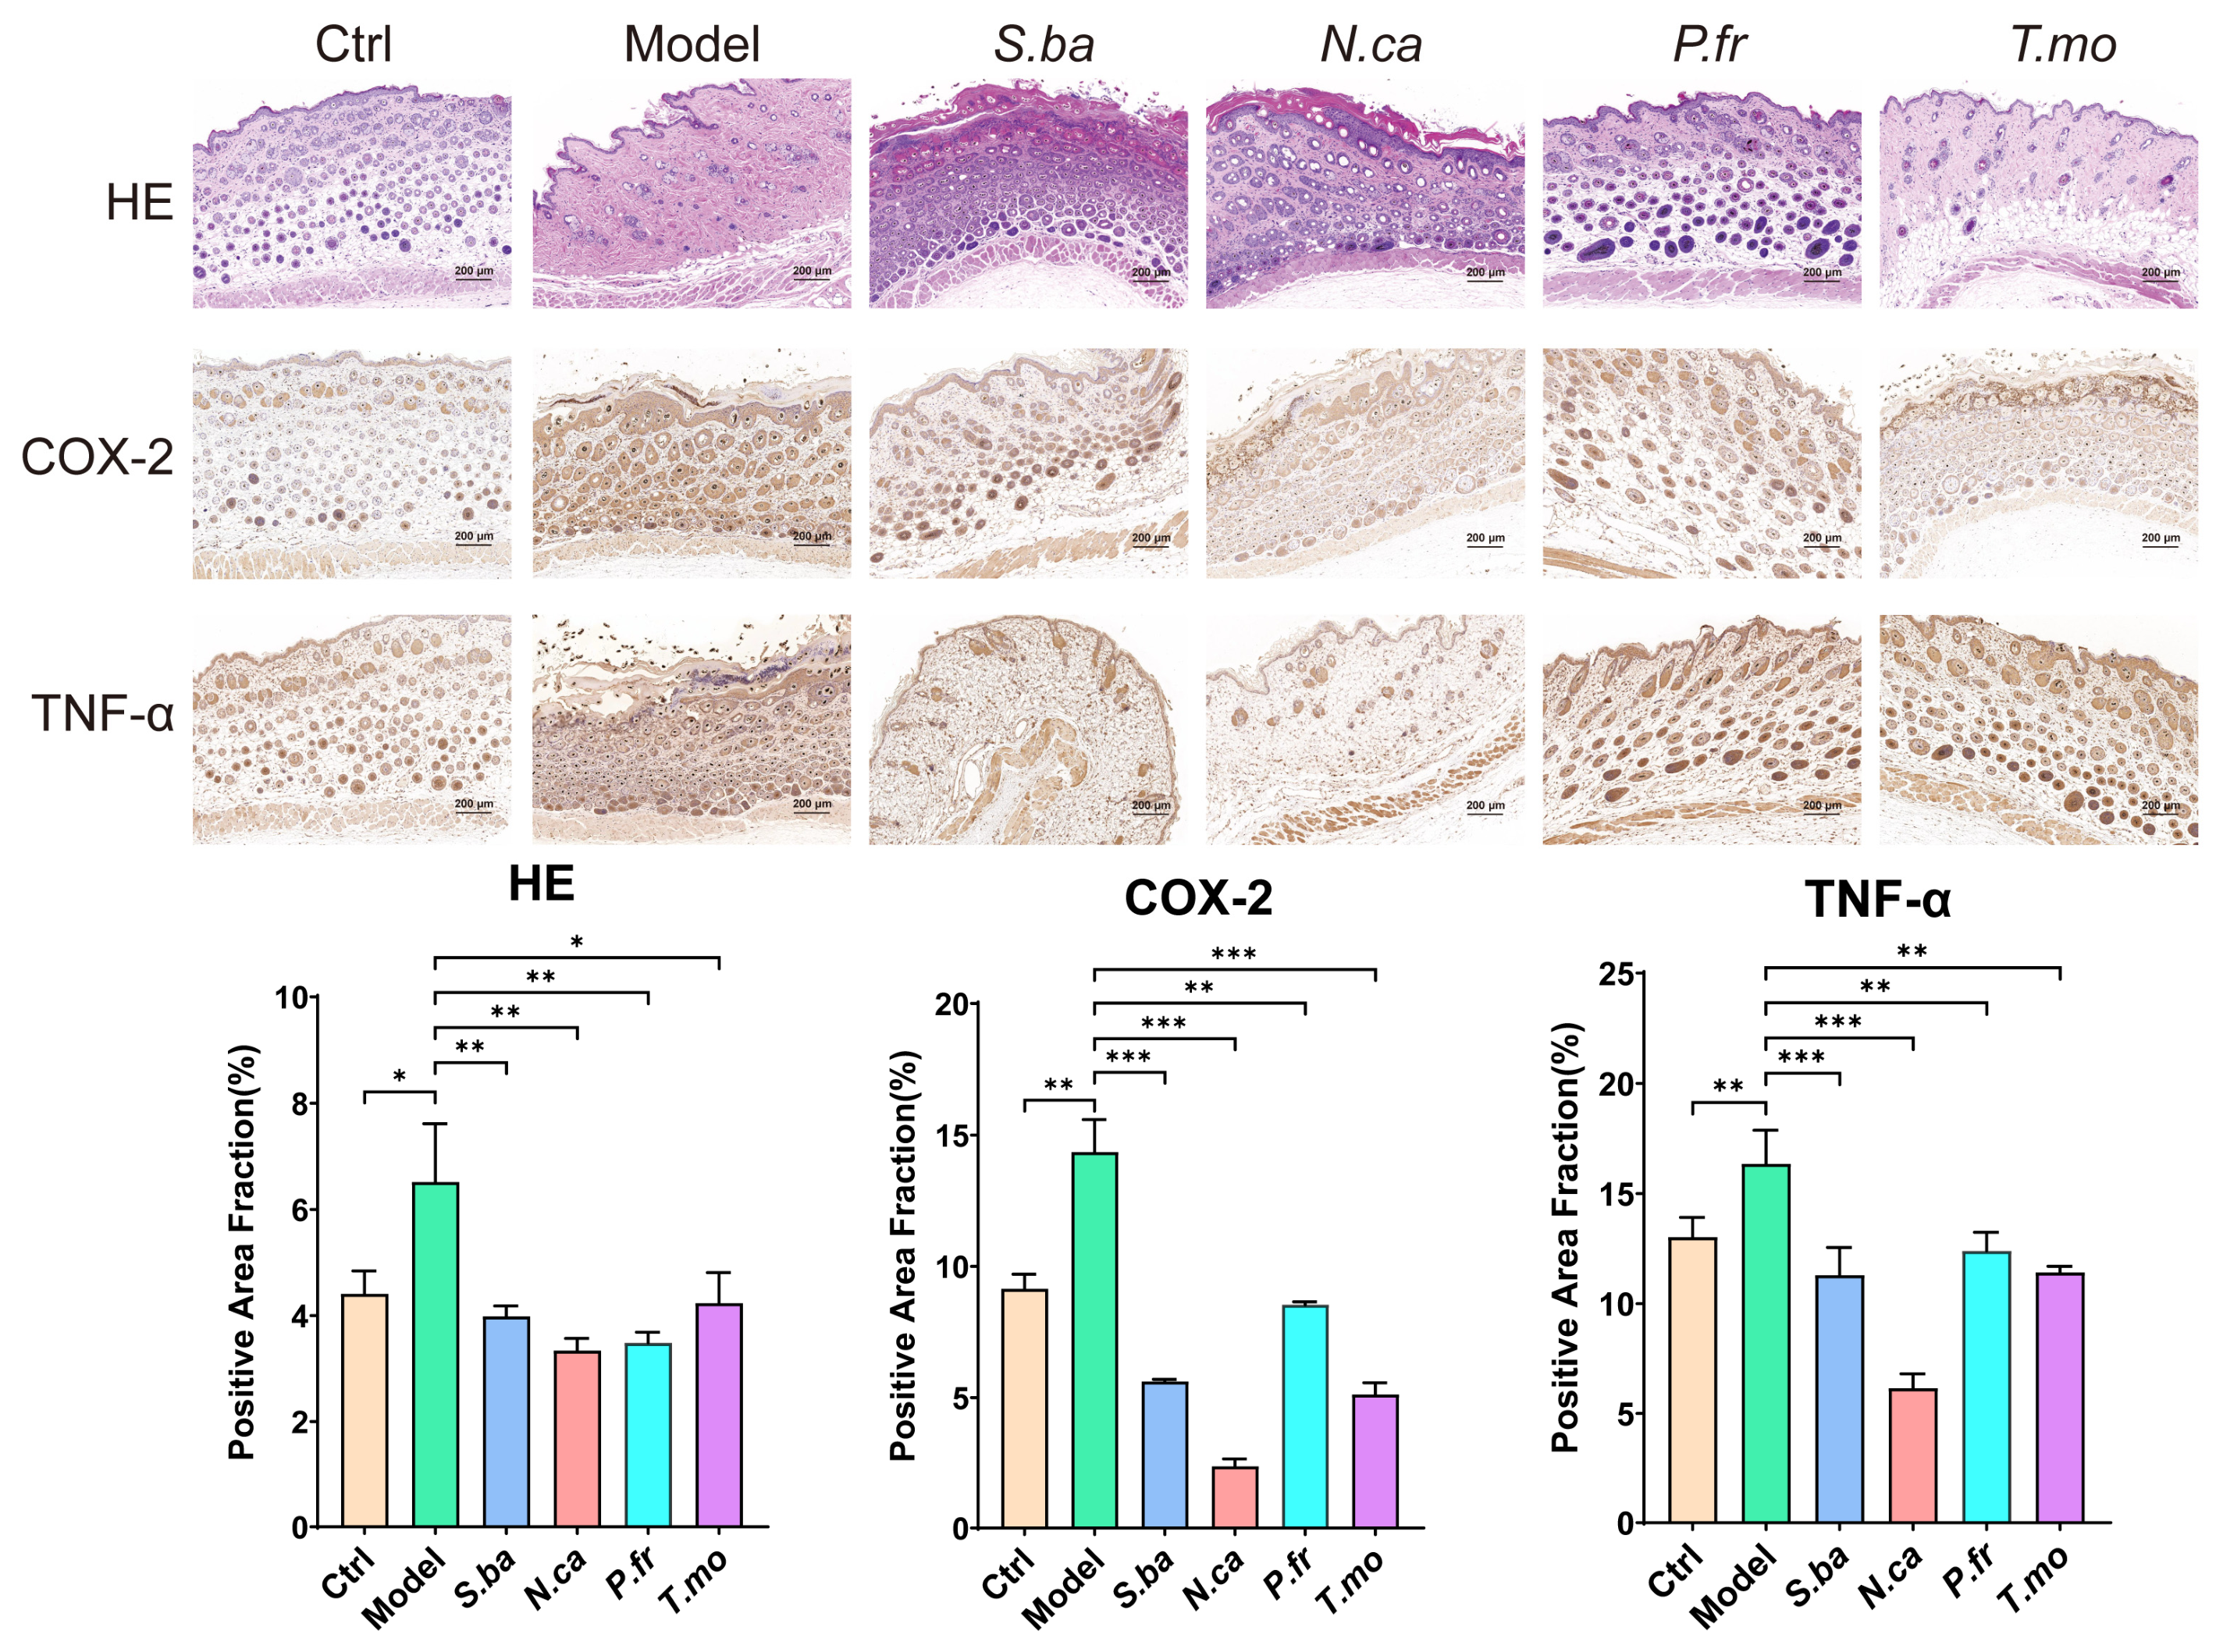
To further validate the anti-inflammatory effects at the tissue level, we next examined histopathological changes and localized expression of inflammatory mediators via histological and immunohistochemical analyses (
Figure 5 and
Figure S6).
Histological analysis further revealed that the structure of the skin tissue in the control group was intact, with uniform epidermal thickness and clear layers with no obvious abnormalities. However, in the model group, the epidermis was significantly thickened (
p < 0.05), with abnormal keratinization and increased inflammatory cell infiltration (
Figure 5). Thickening of the epidermis and abnormal keratinization reflected an imbalance in epidermal proliferation and differentiation under inflammatory conditions, while the increase in inflammatory cell infiltration indicated enhanced recruitment of local inflammatory cells, suggesting that the model group had suffered from obvious inflammatory tissue damage. Following intervention with different EOs, the epidermal thickening was reduced, the tissue structure became more regular, and inflammatory cell infiltration was decreased (
p < 0.05), indicating that EO treatment was associated with attenuation of inflammation-related histopathological damage. Previous studies have reported that in models of skin inflammation or dermatitis, increased expression of inflammatory molecules such as TNF-α and COX-2 is often accompanied by epidermal thickening and infiltration of inflammatory cells, and that reduced expression of these inflammatory molecules is associated with concomitant improvement in histological damage [
24].
Immunohistochemistry analysis further validated the changes in the levels of key inflammatory molecules at the level of tissue localization. Compared with the control group, the positive staining of COX-2 and TNF-α in skin tissues from the model group was significantly enhanced (p < 0.05), suggesting that the expression of inflammatory mediators in local lesions was significantly increased. Following intervention with different EOs, the expression levels of COX-2 and TNF-α were both weaker than those in the model group (p < 0.05), indicating that EO intervention reduced the local expression levels of inflammation-related molecules in lesions. These results were consistent with those derived from Western blotting and qPCR analyses.
In conclusion, the analysis shows that the use of SDS in mice caused significant local skin inflammation, manifested by the activation of inflammatory signaling molecules, increased expression of inflammatory mediators, and obvious pathological tissue damage. After being intervened with different EOs, these abnormal changes were reversed to varying degrees. These findings suggest that treatment with different EOs was associated with attenuation of inflammatory and histopathological changes, accompanied by reduced expression of inflammation-related molecules and inflammatory mediators.
3. Discussion
GC-MS analysis demonstrated substantial chemical heterogeneity among the 13
Lamiaceae EOs. The identified constituents mainly comprised monoterpene hydrocarbons, oxygenated monoterpenes, sesquiterpene hydrocarbons, oxygenated sesquiterpenes, and phenolic monoterpenes, although their relative contributions varied considerably among species. This finding is consistent with previous comparative investigations showing marked differences in the chemical composition of EOs among multiple
Lamiaceae species [
15,
16]. Such chemical diversity provides an important basis for interpreting the distinct biological activity profiles observed among the EOs examined in the present study.
At the level of individual constituents, several species displayed characteristic dominant compounds.
Origanum vulgare showed a carvacrol-rich profile, consistent with previous reports describing the chemical composition of
O. vulgare EO [
11]. The EO of
Rosmarinus officinalis was characterized mainly by eucalyptol and α-pinene, broadly consistent with previously reported chemical profiles of rosemary EO [
12]. The
Thymus species examined in the present study showed thymol-rich profiles, which is also in agreement with the occurrence of phenolic monoterpenes as characteristic constituents reported for other
Thymus EOs [
27]. Other species exhibited distinct dominant constituents, including limonene in
Scutellaria baicalensis, α-muurolene in
Scutellaria scordifolia, L-menthol in
Mentha canadensis, perillaldehyde in
Perilla frutescens, nepetalactone in
Nepeta cataria and
Elsholtzia ciliata, pulegone in
Phlomis mongolica, and anethole- and anisaldehyde-related constituents in
Schizonepeta tenuifolia. Collectively, these species-specific chemical profiles highlight the considerable chemical diversity of the Lamiaceae EOs and provide a phytochemical framework for interpreting their subsequent differences in antioxidant, antibacterial, cytotoxic, and anti-inflammatory activities.
In the DPPH assay, Rosmarinus officinalis exhibited the highest free radical scavenging activity, followed by Perilla frutescens and Scutellaria baicalensis. IC50 determination further confirmed that Perilla frutescens and Rosmarinus officinalis possessed the strongest antioxidant potency, followed by Thymus mongolicus, Mentha canadensis, and Scutellaria baicalensis. Although these EOs were characterized by different major constituents, including oxygenated monoterpenes (eucalyptol and perillaldehyde) and phenolic monoterpenes (thymol and carvacrol), Spearman correlation analysis after FDR correction revealed no significant individual compound–activity correlations (q > 0.05). Therefore, the present data do not support attributing antioxidant activity to any single major compound. The observed differences may instead reflect the overall chemical composition of each EO. The relatively large SDs observed for some EOs in the DPPH assay may reflect the intrinsic compositional complexity and volatility of EO samples, as well as potential differences in dispersion within the reaction system.
Regarding antibacterial activity,
Thymus mongolicus and
Origanum vulgare, characterized by relatively high proportions of thymol and carvacrol, respectively, exhibited the strongest inhibitory effects against both Gram-positive (
S. aureus) and Gram-negative (
E. coli,
K. pneumoniae, and
S. marcescens) bacteria, with MIC values ranging from 2 to 8 µg/mL. The antibacterial properties of phenolic monoterpenes have been associated with their ability to interact with and disrupt bacterial membranes [
28]. Furthermore, the differential susceptibility of Gram-positive and Gram-negative bacteria may also reflect differences in bacterial envelope structure [
29]. Consistent with these observations, carvacrol and thymol showed significant positive associations with inhibition zones against several bacterial strains in the present dataset. However, these correlations were exploratory and do not establish a direct causal contribution of individual compounds to antibacterial activity.
Regarding cytotoxicity, all tested EOs exhibited potent activity against HepG2 and LNCaP cancer cell lines. Elsholtzia ciliata and Perilla frutescens showed relatively strong activity across both tested cancer cell lines, together with differential selectivity toward cancer and normal cells. In contrast, Origanum vulgare and Rosmarinus officinalis, despite their excellent antioxidant and antibacterial activities, exhibited relatively weaker cytotoxicity. These differences in activity patterns further highlight the activity-dependent biological profiles of the tested EOs.
An exploratory positive association was observed between antioxidant capacity and anti-inflammatory activity. EOs with higher DPPH scavenging rates, such as those from
Rosmarinus officinalis and
Perilla frutescens, were more strongly associated with reduced expression of NF-κB, TNF-α, and COX-2. Consistent with previous reports that phenolic-rich
Perilla extracts exert anti-inflammatory effects via downregulating TNF-α-induced NF-κB activation and COX-2 expression [
30], our findings showed an association between antioxidant capacity and reduced expression of inflammation-related molecules, although a direct mechanistic relationship could not be established. In the SDS-induced murine skin inflammation model, the model group exhibited significantly elevated levels of COX-2, TNF-α, NF-κB, IKK, Akt, and PKC, along with epidermal thickening and inflammatory infiltration, confirming successful model establishment. EO intervention downregulated these molecules, restored epidermal thickness, and alleviated inflammation, as consistently confirmed by Western blotting, qPCR, and immunohistochemistry. The concurrent changes in NF-κB, IKK, COX-2, and TNF-α expression were associated with attenuation of inflammation-related responses. Collectively, these findings suggest that Lamiaceae EOs were associated with reduced expression of multiple inflammation-related molecules and attenuation of SDS-induced skin inflammatory responses.
Taken together, the 13 Lamiaceae EOs showed distinct chemical profiles accompanied by diverse patterns of biological activity. The standardized comparative evaluation across multiple genera allowed these chemical and biological differences to be considered within a common experimental framework. Origanum vulgare and Thymus mongolicus showed relatively strong antibacterial activity, particularly in terms of their low MIC values, whereas Rosmarinus officinalis and Perilla frutescens showed strong antioxidant activity. Elsholtzia ciliata and Perilla frutescens exhibited relatively strong cytotoxic activity across the tested cancer cell lines. These findings provide a comparative basis for further investigation of the chemical constituents associated with specific bioactivities of Lamiaceae EOs.
Nevertheless, several limitations should be acknowledged. First, the SDS-induced murine skin inflammation model lacked a positive control, such as hydrocortisone, which limited direct comparison with an established anti-inflammatory treatment. In addition, dose–response and pathway-specific intervention studies were not performed, and therefore the present findings do not establish the direct mechanisms underlying the observed anti-inflammatory effects. Second, although a standardized hydrodistillation procedure was used, potential losses of volatile constituents during plant material handling and extraction cannot be completely excluded, particularly because glandular trichomes on Lamiaceae leaves may release volatile components during processing. Thus, the chemical profiles reported here represent the composition obtained under the present extraction conditions and may not fully reflect the native or commercial EO composition. Third, commercially available EOs were not included as reference materials, limiting direct comparison between the experimental samples and marketed products. Finally, the correlation analyses were exploratory and cannot establish causal relationships between individual constituents and bioactivities, while the contribution of individual compounds within complex EO mixtures could not be distinguished. Future studies incorporating appropriate positive controls, commercial reference oils, standardized quality-control procedures, and purified or defined constituents, together with dose–response and pathway-specific validation, are warranted to further clarify the reproducibility and biological relevance of these findings.
4. Materials and Methods
4.1. Plant Materials
Thirteen Lamiaceae species at the full flowering stage, with consistent growth conditions and the same number of growth years, were selected from the Experimental Base of Inner Mongolia Agricultural University in August 2025. The plant materials were taxonomically identified by Professor Li Hong from Inner Mongolia Agricultural University based on their morphological characteristics and relevant taxonomic references.
4.2. Extraction of EO
Fresh above-ground parts of the plants were washed, dried in the shade, then ground and sieved immediately before hydrodistillation to minimize the loss of volatile components. Then, 50 g of the dried and uniformly powdered plant material was accurately weighed and placed in a round-bottomed flask, and 800 mL of distilled water and 3–5 zeolite boiling stones were added. The flask was then heated until the water boiled and generated steam, which contained vaporized EOs. The extraction temperature was maintained at approximately 100 °C. The mixture was maintained at a gentle boil for 3–4 h, and the steam was condensed through a water-cooled condenser and collected in a receiving flask to form a milky oil–water emulsion. After completion of the distillation, the collected emulsion was transferred to a separatory funnel and allowed to stand until the oil and aqueous phases separated. The aqueous phase was removed through the stopcock of the separatory funnel, and the oil phase was collected separately. The collected oil layer was dehydrated by the addition of approximately 1–2 g of anhydrous sodium sulfate and allowed to stand until the oil phase became clear. The dried oil was then filtered, transferred to amber glass vials, sealed, and stored at 4 °C in the dark until further analysis. The EO yield (%) was determined as the ratio of the extracted oil mass to the dry weight of the aerial parts of the plant, multiplied by 100. Three independent extractions were performed for each sample, and the results are expressed as mean ± standard deviation (SD) [
31].
Conventional hydrodistillation was applied to all 13
Lamiaceae species using the same sample mass, water-to-sample ratio, extraction time (3–4 h), and downstream processing procedure to ensure methodological consistency and facilitate comparison of EO yields and chemical profiles among species [
32].
4.3. EO Analysis
EOs were analyzed using a DSQ-II ultra (Thermo Electron, USA) GC-MS instrument (Agilent, Santa Clara, CA, USA) with a DB-5MS capillary column (0.25 mm × 30 m, 0.25 μm film thickness). The operating conditions were as follows: the GC temperature program commenced at 40 °C for 1 min, increased at 5 °C/min from 40 °C to 280 °C, and then remained at 280 °C for 5 min. The carrier gas was helium with a flow rate of 1.0 mL/min; the injection temperature was 250 °C; the injection volume was 1 μL; and the split ratio was 100:1. The mass spectrometry conditions were as follows: the pre-column pressure was 70 kPa; the electron energy was 70 eV; and the ion source temperature was 230 °C. The RI of each compound was calculated using the van den Dool and Kratz equation for linearly temperature-programmed gas chromatography, based on the n-alkane standard substances (C
6–C
40) [
33]. The RI was calculated according to the following equation:
where t
R(x) is the retention time of the compound of interest, t
R(n) and t
R(n + 1) are the retention times of the n-alkanes eluting immediately before and after the compound, respectively, and n is the carbon number of the preceding n-alkane.
Compound identification was achieved by comparing the mass spectra with the National Institute of Standards and Technology mass spectral library, in conjunction with RI matching. Compounds were tentatively identified when the mass spectrum match factor was ≥80% and the experimental RI was consistent with the literature RI. Additionally, squalene was analyzed as an external reference compound to confirm the identification of triterpene-related compounds and to verify the stability of the chromatographic system; it was not used for compound-specific quantitative calibration.
The chemical composition of the EOs was evaluated using relative peak-area normalization. The relative content of each identified compound was calculated as the peak area of the individual compound divided by the total peak area of all identified compounds and expressed as a percentage:
Relative content (%) = (peak area of an individual compound/total peak area of all identified compounds) × 100.
These values represent the relative abundance of individual constituents within each EO rather than absolute concentrations.
4.4. HCA and PCA
Based on the GC-MS chemical profiles of the 13 EOs, HCA and PCA were performed to visualize the chemical variation among the samples. The data matrix consisted of 13 samples (rows) × 51 identified compounds (columns), with the relative content (%) of each compound used as variables. A single representative EO sample was analyzed for each species, and the relative content of each compound was averaged from triplicate injections. For compounds not detected (below the limit of detection) in some samples, a value of 0.0001% was assigned to ensure data completeness. Prior to multivariate analysis, all content data were Z-score standardized to ensure equal contribution of all variables, regardless of their absolute abundances; no logarithmic transformation was applied. HCA was performed using Euclidean distance as the similarity measure and Ward’s linkage method for dendrogram construction. The dendrogram was generated using OriginPro 2024 (OriginLab Corporation, Northampton, MA, USA), and the heatmap was generated using GraphPad Prism software 10.1.2 (GraphPad Software, San Diego, CA, USA). PCA was also conducted using Origin software, with the first four principal components (PC1–PC4; eigenvalues > 1) extracted. Variable loadings were calculated to assess the contribution of individual compounds to the principal components, and the cumulative variance explained was reported. Given the limited sample size (n = 13) relative to the number of variables (p = 51), the multivariate analyses were interpreted as exploratory. Together, HCA and PCA provide complementary visualizations of chemical variation within the same dataset and facilitate exploratory characterization of chemotype patterns.
4.5. Antioxidant Activity Assay
The antioxidant activity of 13 EOs from the
Lamiaceae family was determined using the DPPH free radical scavenging capacity assay. Each EO sample was freshly prepared in anhydrous ethanol before the experiment. A single concentration screening experiment was conducted, where the EO samples were diluted to a working concentration of 2 μg/mL. 400 μL of the EO solution was mixed with 600 μL of the DPPH working solution and placed in a measurement tube for 30 min at 25 °C in the dark. Then, the mixture was centrifuged at 4000 rpm for 5 min, and 800 μL of the supernatant was measured at a wavelength of 517 nm to determine the absorbance. The absorbance was recorded after zeroing with anhydrous ethanol. Trolox and methanol were used as positive and negative controls, respectively. Three independent experiments were performed, and the results are presented as mean ± SD. After confirming that the EOs had antioxidant activity at a concentration of 2 μg/mL, a series of concentration gradients were set for the samples to determine the IC
50 value. DPPH free radical scavenging rate was determined using Equation:
In Equation, Control represents the absorbance of the DPPH solution without the oil sample; A
sample represents the absorbance of the DPPH solution containing the test oil sample; and A
sample blank represents the absorbance of the oil sample without the DPPH solution [
34,
35,
36].
4.6. Antibacterial Activity Assay
The antibacterial activity of EOs from 13
Lamiaceae species was evaluated using the filter paper diffusion method, and the inhibition zone diameters were measured in millimeters. The test strains were
Staphylococcus aureus (ATCC 6538),
Escherichia coli (ATCC 25922),
Serratia marcescens (ATCC 14041),
Staphylococcus haemolyticus (ATCC 29970), and
Klebsiella pneumoniae (ATCC 13883). Bacterial cultures were adjusted to a concentration of 1 × 10
6 CFU/mL, and 150 μL aliquots were evenly spread onto LB agar plates. Sterile filter paper discs (diameter: 6 mm) impregnated with 2 μL of each EO sample were then placed on the surface of the inoculated agar plates. Following incubation at 37 °C for 24 h, the diameters of the inhibition zones were measured using a vernier caliper for each EO, and three independent experiments were performed for each EO–bacterial strain combination [
27,
37]. A disc diameter of 6 mm indicated no noticeable inhibitory activity, whereas any inhibition zone diameter greater than 6 mm was considered to indicate antimicrobial effectiveness.
Based on the results of the paper disc diffusion assay, four EOs (Origanum vulgare, Thymus citriodorus, Thymus vulgaris, and Thymus mongolicus) exhibiting the largest inhibition zone diameters among the 13 tested EOs were selected for subsequent minimum inhibitory concentration (MIC) determination. The final bacterial inoculum in each well of the 96-well microplate was approximately 5 × 10⁵ CFU/mL. The EOs were subjected to two-fold serial dilution to obtain final concentrations of 32, 16, 8, 4, 2, 1, and 0.5 μg/mL in the wells. Gentamicin was used as the positive control and was tested at final concentrations of 8, 4, 2, 1, 0.5, 0.25, and 0.125 μg/mL, 10% ethanol containing 1% Tween-80 was used as the solvent negative control, cation-adjusted Mueller–Hinton broth (CAMHB) without EO was used as the growth control, and uninoculated CAMHB was used as the blank control. After incubation at 37 °C for 16–18 h, the MIC was defined as the lowest EO concentration at which no visible bacterial growth was observed at the bottom of the well.
4.7. Cytotoxicity Assay
The cytotoxicity of the 13 EOs was evaluated using the Cell Counting Kit-8 (CCK-8) assay, with LNCaP, HepG2, THLE-2, and RWPE-1 as test models. The cell lines used were all purchased from Zhejiang Meisen Cell Technology Co., Ltd. (Hangzhou, China). HepG2, LNCaP, THLE-2, and RWPE-1 cells were seeded into 96-well plates at a density of 1 × 10
4 cells per well. The plates were then incubated at 37 °C in 5% CO
2 to allow cell attachment. Following adhesion, the experimental groups were treated with the test EOs diluted in the culture medium at a starting concentration of 1 μg/mL, followed by two-fold serial dilutions to obtain concentrations of 0.5, 0.25, 0.125, and 0.0625 μg/mL, while the control group cells were only treated with the culture medium. After 72 h of incubation, 10 μL of CCK-8 solution was added to each well, and the cells were incubated for another 2 h. Subsequently, absorbance was measured at 450 nm using a microplate reader. Cell inhibition rate (%) was calculated using Equation.
In Equation, As = absorbance of the test well (the absorbance of the well containing cells, culture medium, CCK-8, and the test compound); Ab = absorbance of the blank well (the absorbance of the well containing culture medium and CCK-8); and Ac = absorbance of the control well (the absorbance of the well containing cells, culture medium, and CCK-8) [
38,
39].
The IC
50 values were calculated by nonlinear regression using a four-parameter logistic model with a variable slope in GraphPad Prism and expressed as mean ± SD from three independent experiments. The selectivity index (SI) was calculated as follows:
THLE-2 and RWPE-1 were used as the corresponding normal cell lines for HepG2 and LNCaP, respectively.
4.8. Spearman’s Rank Correlation Analysis
To evaluate the relationships between the major volatile compounds and the bioactivity parameters, Spearman’s rank correlation analysis was performed on the 13 EO samples using GraphPad Prism software. The bioactivity indices included DPPH scavenging activity (1/IC50), antibacterial activity (inhibition zone diameter, mm), and cytotoxicity (1/IC50 against HepG2 and LNCaP cells). A positive correlation coefficient indicates that higher compound content is associated with enhanced activity, whereas a negative coefficient indicates the opposite. p-values were adjusted for multiple testing using the Benjamini–Hochberg FDR method, and FDR-adjusted p < 0.05 was considered statistically significant (n = 13).
4.9. Establishment of a Murine Skin Inflammation Model and EO Intervention
The anti-inflammatory activities of the 13 EOs were evaluated using a mouse model of dorsal skin inflammation induced by topical application of SDS. All animal experimental procedures were reviewed and approved by the Animal Experiment Center of Inner Mongolia Agricultural University (Approval No. NND2025065). Eight-week-old female Balb/c mice weighing 20.0 ± 1.6 g were used in this study. Prior to the experiment, all mice were acclimatized for one week under specific pathogen-free conditions with free access to food and water, and constant environmental temperature, humidity, and light cycle were maintained to ensure physiological stability. After one week of acclimatization, the dorsal hair of the mice was shaved, and 100 μL of 10% SDS solution was topically applied once daily for three consecutive days to induce inflammation. After successful induction, SDS application was stopped, and the mice were randomly divided into the control group, the model group, and the 13 kinds of EO treatment groups (1%,
v/
v), with random number tables for grouping, with six mice in each group. Each EO was dissolved in a solubilizing system consisting of 10% ethanol and 1% Tween-80, and the solution was diluted with sterile physiological saline to a final volume of 10 mL to prepare a 1% (
v/
v) working solution. In the intervention groups, 100 μL of the corresponding EO preparation was topically applied to the inflamed area twice daily for 7 consecutive days, while the model group received an equal volume of the vehicle solution. The administration time, site, and dosage were consistent across all groups. After the final administration, the mice were deeply anesthetized by intraperitoneal injection of an overdose of sodium pentobarbital and euthanized by cervical dislocation. Dorsal skin tissues from the inflamed areas were subsequently collected. A portion of the tissue samples was fixed in 4% paraformaldehyde for histological examination, while the remaining tissues were immediately frozen in liquid nitrogen and stored at −80 °C for subsequent molecular analyses [
40,
41].
4.10. Quantitative Real-Time PCR
Total RNA was extracted from mouse skin samples using TRIzol Reagent (Invitrogen, Carlsbad, CA, USA). The concentration and purity of the extracted RNA were determined using a NanoDrop 2000 spectrophotometer (Thermo Fisher Scientific, Wilmington, DE, USA). Subsequently, complementary DNA (cDNA) was synthesized using the GoScript Reverse Transcription System (Promega, Madison, WI, USA). Quantitative Real-Time Polymerase Chain Reaction (qRT-PCR) was performed on an ABI QuantStudio 5 Real-Time PCR System (Applied Biosystems, Foster City, CA, USA) using GoTaq qPCR Master Mix (Promega, Madison, WI, USA). The 20 μL reaction mixture consisted of 2 × Master Mix (10 μL), forward and reverse primers (0.4 μL each), cDNA template (2 μL), and nuclease-free water (7.2 μL). The amplification protocol was as follows: initial denaturation at 95 °C for 30 s, followed by 40 cycles of denaturation at 95 °C for 5 s and annealing/extension at 60 °C for 30 s. After amplification, melt curve analysis was performed to verify the specificity of the amplified products. β-actin was used as the internal reference gene, and the relative expression levels of target genes were calculated using the 2
−ΔΔCt method [
42]. The primer sequences for all genes are listed in
Table S6 [
43].
4.11. Western Blot Analysis
Dorsal skin tissues were collected from mice in each group and homogenized in precooled radioimmunoprecipitation assay (RIPA) lysis buffer supplemented with protease inhibitors on an ice-bath. Homogenates were then centrifuged at 12,000×
g for 15 min at 4 °C, and the supernatants were collected. Total protein concentration was determined using a bicinchoninic acid protein assay kit (Beyotime Biotechnology, Shanghai, China), with β-actin as the internal reference protein. Semi-quantitative analysis of band intensity was performed using ImageJ (version 1.54k, Wayne Rasband, National Institutes of Health, Bethesda, MD, USA;
https://imagej.net), and the relative expression levels of each target protein were expressed as the ratio of the grayscale intensity of the target protein to that of the internal reference protein [
44]. The primary antibodies used were as follows: anti-COX-2 (1:1000, ab179800, Abcam, UK), anti-PKC (1:1000, ab32376, Abcam, UK), anti-IKK (1 μg/mL, ab7891, Abcam, UK), anti-TNF-α (1:1000, ab183218, Abcam, UK), anti-NF-κB (1:1000, ab32536, Abcam, UK), anti-AKT (1:2000, R380617, ZEN-BIO, China), and anti-β-actin (1:1000, ab8227, Abcam, UK). The secondary antibodies used were goat anti-mouse IgG H&L (HRP) (1:2000, ab97023, Abcam, UK) and goat anti-rabbit IgG H&L (HRP) (1:2000, ab205718, Abcam, UK).
4.12. Histopathological Analysis
Dorsal skin tissues were collected from mice in each group and fixed in 4% paraformaldehyde (Solarbio, Beijing, China) for 24 h. After routine dehydration, clearing, and paraffin embedding, the tissues were sectioned at a thickness of 4 μm. For hematoxylin and eosin (H&E) staining, the sections were deparaffinized in xylene, rehydrated through a graded series of ethanol concentrations, and then stained with hematoxylin and eosin. Following dehydration, clearing, and mounting, the sections were observed and imaged using a Nikon microscope system (Nikon, Tokyo, Japan). Histopathological changes, including epidermal thickness, the degree of keratinization, acanthosis, dermal edema, and inflammatory cell infiltration, were also evaluated to assess the effects of different treatments on inflammatory skin injury, as described previously [
45].
For immunohistochemical, paraffin sections were deparaffinized and rehydrated, followed by antigen retrieval in citrate buffer (pH 6.0). After natural cooling, the sections were washed three times with PBS for 5 min each. Endogenous peroxidase activity was blocked with 3% hydrogen peroxide for 10 min at room temperature, followed by blocking with 5% BSA for 30 min at room temperature. After removal of the blocking solution, the sections were incubated with the appropriate primary antibodies overnight at 4 °C. On the following day, after PBS washing, the sections were incubated with the corresponding secondary antibodies for 30 min at room temperature. The immunoreactivity was then visualized using DAB, followed by hematoxylin counterstaining. After dehydration, clearing, and mounting, the sections were observed and imaged using a Nikon microscope system (Nikon, Japan) to evaluate the positive expression of target proteins. According to the experimental design, inflammation-related proteins in skin tissues were detected, and semi-quantitative analysis of the positive staining area or mean optical density was performed using ImageJ software.
4.13. Statistical Analysis
All experiments were performed with at least three independent biological replicates, and results are presented as mean ± SD. Technical replicates are specified in the corresponding method sections. Prior to statistical analysis, normality and homogeneity of variances were assessed. Data satisfying both assumptions were analyzed by one-way analysis of variance (ANOVA), and SPSS version 13.0 software (SPSS Inc., Chicago, IL, USA) was employed for Duncan’s multiple range test (p < 0.05) to determine the significant differences between groups. Data violating either assumption were analyzed using non-parametric tests.