Article

Hydraulic Traits Constrain Salinity-Dependent Niche Segregation in Mangroves

by
Haijing Cheng
1,†,
Yinjie Chen
2,†,
Yunhui Peng
1,
Mi Wei
3 and
Junfeng Niu
1,*
1
College of Life Sciences and Oceanography, Shenzhen University, Shenzhen 518060, China
2
The Wetland Park of Overseas Chinese Town, Shenzhen 518052, China
3
School of Agriculture, Shenzhen Campus, Sun Yat-Sen University, Shenzhen 518107, China
*
Author to whom correspondence should be addressed.
These authors contributed equally to this work.
Plants 2025, 14(12), 1850; https://doi.org/10.3390/plants14121850
Submission received: 12 April 2025 / Revised: 22 May 2025 / Accepted: 11 June 2025 / Published: 16 June 2025
(This article belongs to the Special Issue Aquatic Plants and Wetland)

Abstract

To understand the mechanisms underlying species assemblage along salt gradients in intertidal zones, we measured the xylem hydraulic vulnerability curves (HVCs), leaf water potential (ψ), stomatal conductance (gs), specific leaf area (SLA), and wood density (WD) for six mangrove species of Avicennia marina, Bruguiera gymnorrhiza, Aegiceras corniculatum, Kandelia obovata, Sonneratia apetala, and Sonneratia caseolaris. We found the following: (1) A. marina and B. gymnorhiza had the most negative P50 (water potential at which 50% of hydraulic conductivity was lost), while S. caseolaris and S. apetala had the least negative P50, indicating different resistance to embolism in xylem; (2) P50 and P88 (water potential at which 88% of hydraulic conductivity was lost) declined with increasing salinity from the onshore to offshore species, as their water regulation strategy meanwhile transitioned from isohydry to anisohydry; (3) B. gymnorhiza had smaller SLA but larger hydraulic safety margin (HSM), implying potentially higher capacity of water retention in leaves and lower risk of hydraulic failure in xylem. These results suggest that hydraulic traits play an important role in shaping the salt-driven niche segregation of mangroves along intertidal zones. Our research contributes to a more comprehensive understanding of the hydraulic physiology of mangroves in salt adaption and may facilitate a general modeling framework for examining and predicting mangrove resilience to a changing climate.

1. Introduction

Mangroves grow in tidal, saline wetlands along tropical and subtropical coasts worldwide [1]. They provide important habitats for terrestrial and marine animals including birds, insects, mammals, reptiles, and shellfish, and have the function of improving water quality and protecting dikes from waves and storms [2]. Salinity is one of the most important factors shaping the morphology and typology of mangrove ecosystems, largely accounting for the niche differentiation among sympatric species in coastal regions [3,4]. Therefore, it is necessary to perform interspecies comparative studies to better understand the competitive advantages of different mangroves colonizing along a varying salt gradient.
High and fluctuating salinity may cause water deficit for mangrove trees [5]. To extract water efficiently from saline substrates, mangroves have to maintain a lower internal osmotic potential [6]. Meanwhile, many mangrove species have evolved physiological adaptations similar to those of xerophytes for water conservation [1,7]. Global warming and intensifying heat waves may boost evapotranspiration and exacerbate hydraulic tensions, leading to embolism in mangrove xylem vessels. That could in turn induce stomatal closure, limit carbon assimilation, and affect plant survival and growth [8]. Thus, it is important to improve our understanding of mangrove xylem hydraulics so that we can better predict and assess their responses to future climate scenarios.
Water potential, inducing a specific percentage decrease in hydraulic conductivity (Px), is often used to characterize xylem embolism resistance [9]. Salt tolerance in mangroves can also be described in the same way if its ionic effect was neglected and only the osmotic effect was considered [7]. P12, P50, and P88, representing xylem water potentials corresponding to the loss of hydraulic conductivity by 12%, 50%, and 88%, respectively, are the most frequently adopted indexes. P50 was considered as a key indicator for plant tolerance to stress and extensively used in hydraulic safety or vulnerability assessments [10,11]. P12, P50, and P88 are all generally extracted from hydraulic vulnerability curves (HVCs). However, HVCs also bear information about the sensitivity of conductivity loss (Sx) to water potential changes, and this Sx has so far been largely underappreciated.
The hydraulic safety margin (HSM) is another important indicator for plant hydraulic risk, and is commonly quantified as the difference between the minimum water potential (ψmin) experienced by plants under natural conditions and their P50 [12,13]. A large positive HSM means a relatively low risk of embolism, and thus a low level of hydraulic failure; by contrast, a small positive or even negative HSM may imply potential hydraulic threat [10,14]. It can be speculated that mangroves are different in HSMs due to their different P50 and ψmin.
Plant functional traits can track environmental changes, affect plant fitness, and play an important role in shaping species co-occurrence patterns within ecosystems [15,16]. Both specific leaf area (SLA) and wood density (WD) are widely used functional traits. SLA reflects plant adaptive response to optimize light capture in leaves [17]; meanwhile, WD accounts for a tradeoff between carbon storage and hydraulic efficiency in xylem [18,19]. Mangrove plants can adjust leaf size and thickness to improve their adaptability to salt [20]. It has also been reported that the mangrove species of Avicennia germinan, which inhabits the most seaward saline environment, had the highest WD on the Amazon coast [21]. However, there is still a lack of research that can directly link SLA and WD to mangrove niche partitioning along salinity gradients in intertidal zones.
Plant tolerance to drought and salt highly depends on leaf stomatal behaviors: isohydric species close stomata rapidly, while anisohydric species tend to keep stomata open and maintain water transpiration even under more negative osmotic potentials [22,23]. More generally, plants coexist along a continuous spectrum from isohydry to anisohydry, with the former being resistant to embolism and the latter being tolerant of embolism [24]. If salinity increases (and thus water potential decreases) from the onshore to offshore habitats, the stomatal water regulation strategies of mangroves should also transition from isohydry to anisohydry along this coastal region.
In the present study, we selected six representative mangrove species, including Sonneratia caseolaris, Sonneratia apetala, Kandelia obovate, Bruguiera gymnorrhiza, Aegiceras corniculatum, and Avicennia marina in Shenzhen Overseas Chinese Town National Wetland Park. We measured leaf water potential (ψ) dynamics, stomatal conductance (gs), WD, and SLA and we constructed xylem HVCs, analyzed Px and Sx, and calculated the HSM for each species. We hypothesized the following: (1) salt resistance varied among mangroves distributed along salinity gradient from the onshore to offshore sites; (2) water regulation strategies changed from isohydry to anisohydry in mangroves as substrate salinity increased toward the offshore habitats; (3) HSM and WD tend to be low and SLA tend to be high for the onshore species of S. caseolaris and S. apetala, while the offshore species of B. gymnorrhiza and A. marina should have high HSM and WD, but low SLA. We aim to elucidate the underlying mechanisms that constrain mangrove distribution along salt gradients in intertidal zones. The results are meaningful for the monitoring, protection, reestablishment, and restoration of coastal mangrove ecosystems.

2. Materials and Methods

2.1. Field Site and Study Species

This study was conducted in the Overseas Chinese Town (OCT) Wetland Park (113.99 N, 22.53 E) in Shenzhen. It is the only coastal mangrove wetland in the urban hinterland in China. It covers an area of about 68.5 ha, and has a subtropical monsoon climate with mean annual precipitation and air temperature of 1823 mm and of 24 °C, respectively. The regional dominant mangrove species include Sonneratia caseolaris, Sonneratia apetala, Kandelia obovate, Bruguiera gymnorrhiza, Aegiceras corniculatum and Avicennia marina, distributing sequentially along the intertidal zone.
S. caseolaris and S. apetala occupy the most inland estuary area (flooded only during high tide) with continuous freshwater replenishment from an inner lake, leading to a relatively low substrate salinity of between 3.5 and 6.2‰. A. marina is located exclusively in the most seaward site and is immersed throughout the year in seawater with a changing salinity from 17.3‰ to 24.5‰. The distribution of A. corniculatum is partially overlapped with that of K. obovate and B. gymnorrhiza (with a substrate salinity of 9.1–15.4‰). They are geographically closer to A. marina than S. caseolaris and S. apetala, and their roots are also immersed in seawater most of the time. All salinity was measured monthly with a YSI Pro30 field conductivity meter (YSI Inc., Yellow Springs, OH, USA). For each species, we selected four to six individual trees of similar physical status to carry out measurements. All measurements were taken in trees that represent typical site characteristics.

2.2. Leaf Water Potential and Stomatal Conductance

ψ (leaf water potential) was measured using a Model 1505D-EXP pressure chamber (PMS Instrument Company, Corvallis, OR, USA), and gs (stomatal conductance) was screened by a SC-1 leaf porometer (METER, San Francisco, CA, USA). To compensate for the possible effect of the sensor head on gs, the porometer took readings within 30 s [25]. For the measurement of ψ, leaves were carefully excised, sealed in plastic bags, and stored in a portable icebox for 20 min. The equilibrated leaves were taken out and inserted into the chamber lid with the petiole cut surface protruding out through a gasket. The lid is replaced, holding the leaf blade within the sealed chamber, and the chamber is pressurized slowly (0.01 Mpa s−1) until the petiole cut surface is wetted by the rising sap meniscus. The ‘balancing pressure’ applied has exactly compensated for the negative pressure in the xylem water column [26]. Four to six fully expanded, healthy, and sun-exposed leaves for each tree and four to six individual trees for each species were sampled. Measurements were taken every two hours in the field from 5:00 to 19:00 on clear days over the summer growing season in 2020.

2.3. Hydraulic Vulnerability Curves

Sun-exposed terminal branches (about 1–1.2 m in length) were harvested from the upper canopy positions of the sample trees at predawn (5:00–6:00 am), and transported immediately to the laboratory in black plastic bags to prevent moisture loss [27]. In the laboratory, a stem section (about 3–5 cm in length) was cut off from the bottom of each branch sample under water to avoid the inclusion of embolized vessels [28]. Stem segments measuring 6–8 cm in length and 0.8–1 cm in diameter were then prepared, and both the basal and distal ends were trimmed using a razor blade. The bark of the central part of each stem segment was removed and the sapwood was slightly notched using sharp blade to facilitate air seeding [29].
Embolism was induced by injecting air into a steel sleeve (4 cm in length) at different pressure levels. The sleeve was connected to a Model 1505D-EXP pressure chamber, allowing the injection of compressed nitrogen gas. Stem segment samples were inserted into the sleeve with two ends protruding out. Air was injected for 5 min at each of the following pressure levels: 1.0, 2.0, 3.0, 4.0, 5.0, 6.0, 7.0, 8.0, 9.0, and 10.0 Mpa. The injected segments were allowed at least 30 min to equilibrate after each pressurization until no more bubbles came out of the xylem [30].
Post-injection hydraulic conductivity (K) was assessed with a commercial XYL’EM apparatus (Bronkhorst, Montigny-les-Cormeilles, France). At least 5 subsamples (0.8–1 cm in diameter) measuring 2 cm in length were excised under water, and their proximal ends were connected to the tubing system of XYL’EM. The flow was measured by a high-resolution liquid mass flow meter, and K (kg m−1 s−1 Mpa−1) was calculated as the ratio of flow rate to pressure gradient (6 kPa). Initial hydraulic conductivity (Kini) was measured using the unpressured stem samples. They were then flushed with ultrapure water at 0.15 Mpa for 30 s and remeasured to determine the maximal conductivity (Kmax). The percentage loss of hydraulic conductivity (PLC) at each pressure level was calculated as (Equation (1)):
P L C = ( K max K ) K max × 100 %
HVCs (hydraulic vulnerability curves) were constructed by fitting PLC with xylem water potentials (equal in number to the injection pressure but with opposite signs) using an exponential–sigmoidal function (Equation (2)). P12, P50, and P88 (water potential corresponding to 12%, 50% and 88% loss in hydraulic conductivity) were assessed from the HVC for each tree species. P12 measures the initiation of embolism and P88 signifies complete embolism. P50 is the most commonly used index of embolism resistance, at which HVCs are steepest [31]. We also assessed the slope (Sx) of HVCs at P12, P50 and P88 (S12, S50 and S88). (Table 1) These parameters represent the sensitivity of conductivity loss to water potential changes in the xylem vessels. The 95% confidence intervals (CIs) for Px and Sx were estimated by the bootstrap resampling approach with replacement (N = 1000) [32].
P L C = 100 1 + exp ( a ( ψ b ) )
where a is the slope at the inflection point and b is the ψ value of the inflection point of the fitting curve. It can be easily proved that b equals P50 [33]. The HSM (hydraulic safety margin) was computed as the difference between the minimum leaf water potential (ψmin) and P50 [34].

2.4. Specific Leaf Area and Wood Density

Sun-exposed healthy leaves were taken from the same sample trees for gs and ψ measurements. Fresh leaves were scanned and weighted in field as soon as they were collected, then put in labelled envelopes and brought to the laboratory. Leaf areas were analyzed using ImageJ (Version 1.54). Leaves were then oven dried at 75 °C for 72 h, and dry mass was determined by an analytical balance with an accuracy of 0.0001 g (Thermo Fisher Scientific Inc., Waltham, MA, USA). SLA (specific leaf area) was calculated as the ratio of leaf area to dry mass [35].
Stem segments about 1.5 cm in length and 0.8–1.0 cm in diameter were cut from the harvested stem branches. Barks were removed, and fresh volume (FV) was determined with the water-displacement method (available online: https://prometheusprotocols.net). Stem segments were then oven-dried at 80 °C until constant dry weight (DW) was obtained (Thermo Fisher Scientific Inc., Waltham, MA, USA). WD (wood density) was calculated as the ratio of DW to FV.

2.5. Statistical Analyses

The HVC was fitted using the fitplc package [32] in R-4.2.1. Data were analyzed with SPSS 20 and visualized in origin 2023. Normality and homogeneity of variance were examined before analyses. One-way analyses of variance (ANOVA) with Duncan’s multiple-range tests were performed to test trait differences among tree species. Relationships between two quantitative variables were assessed based on Pearson correlation tests and linear regression models. Statistical analyses were considered significant if p < 0.05.

3. Results

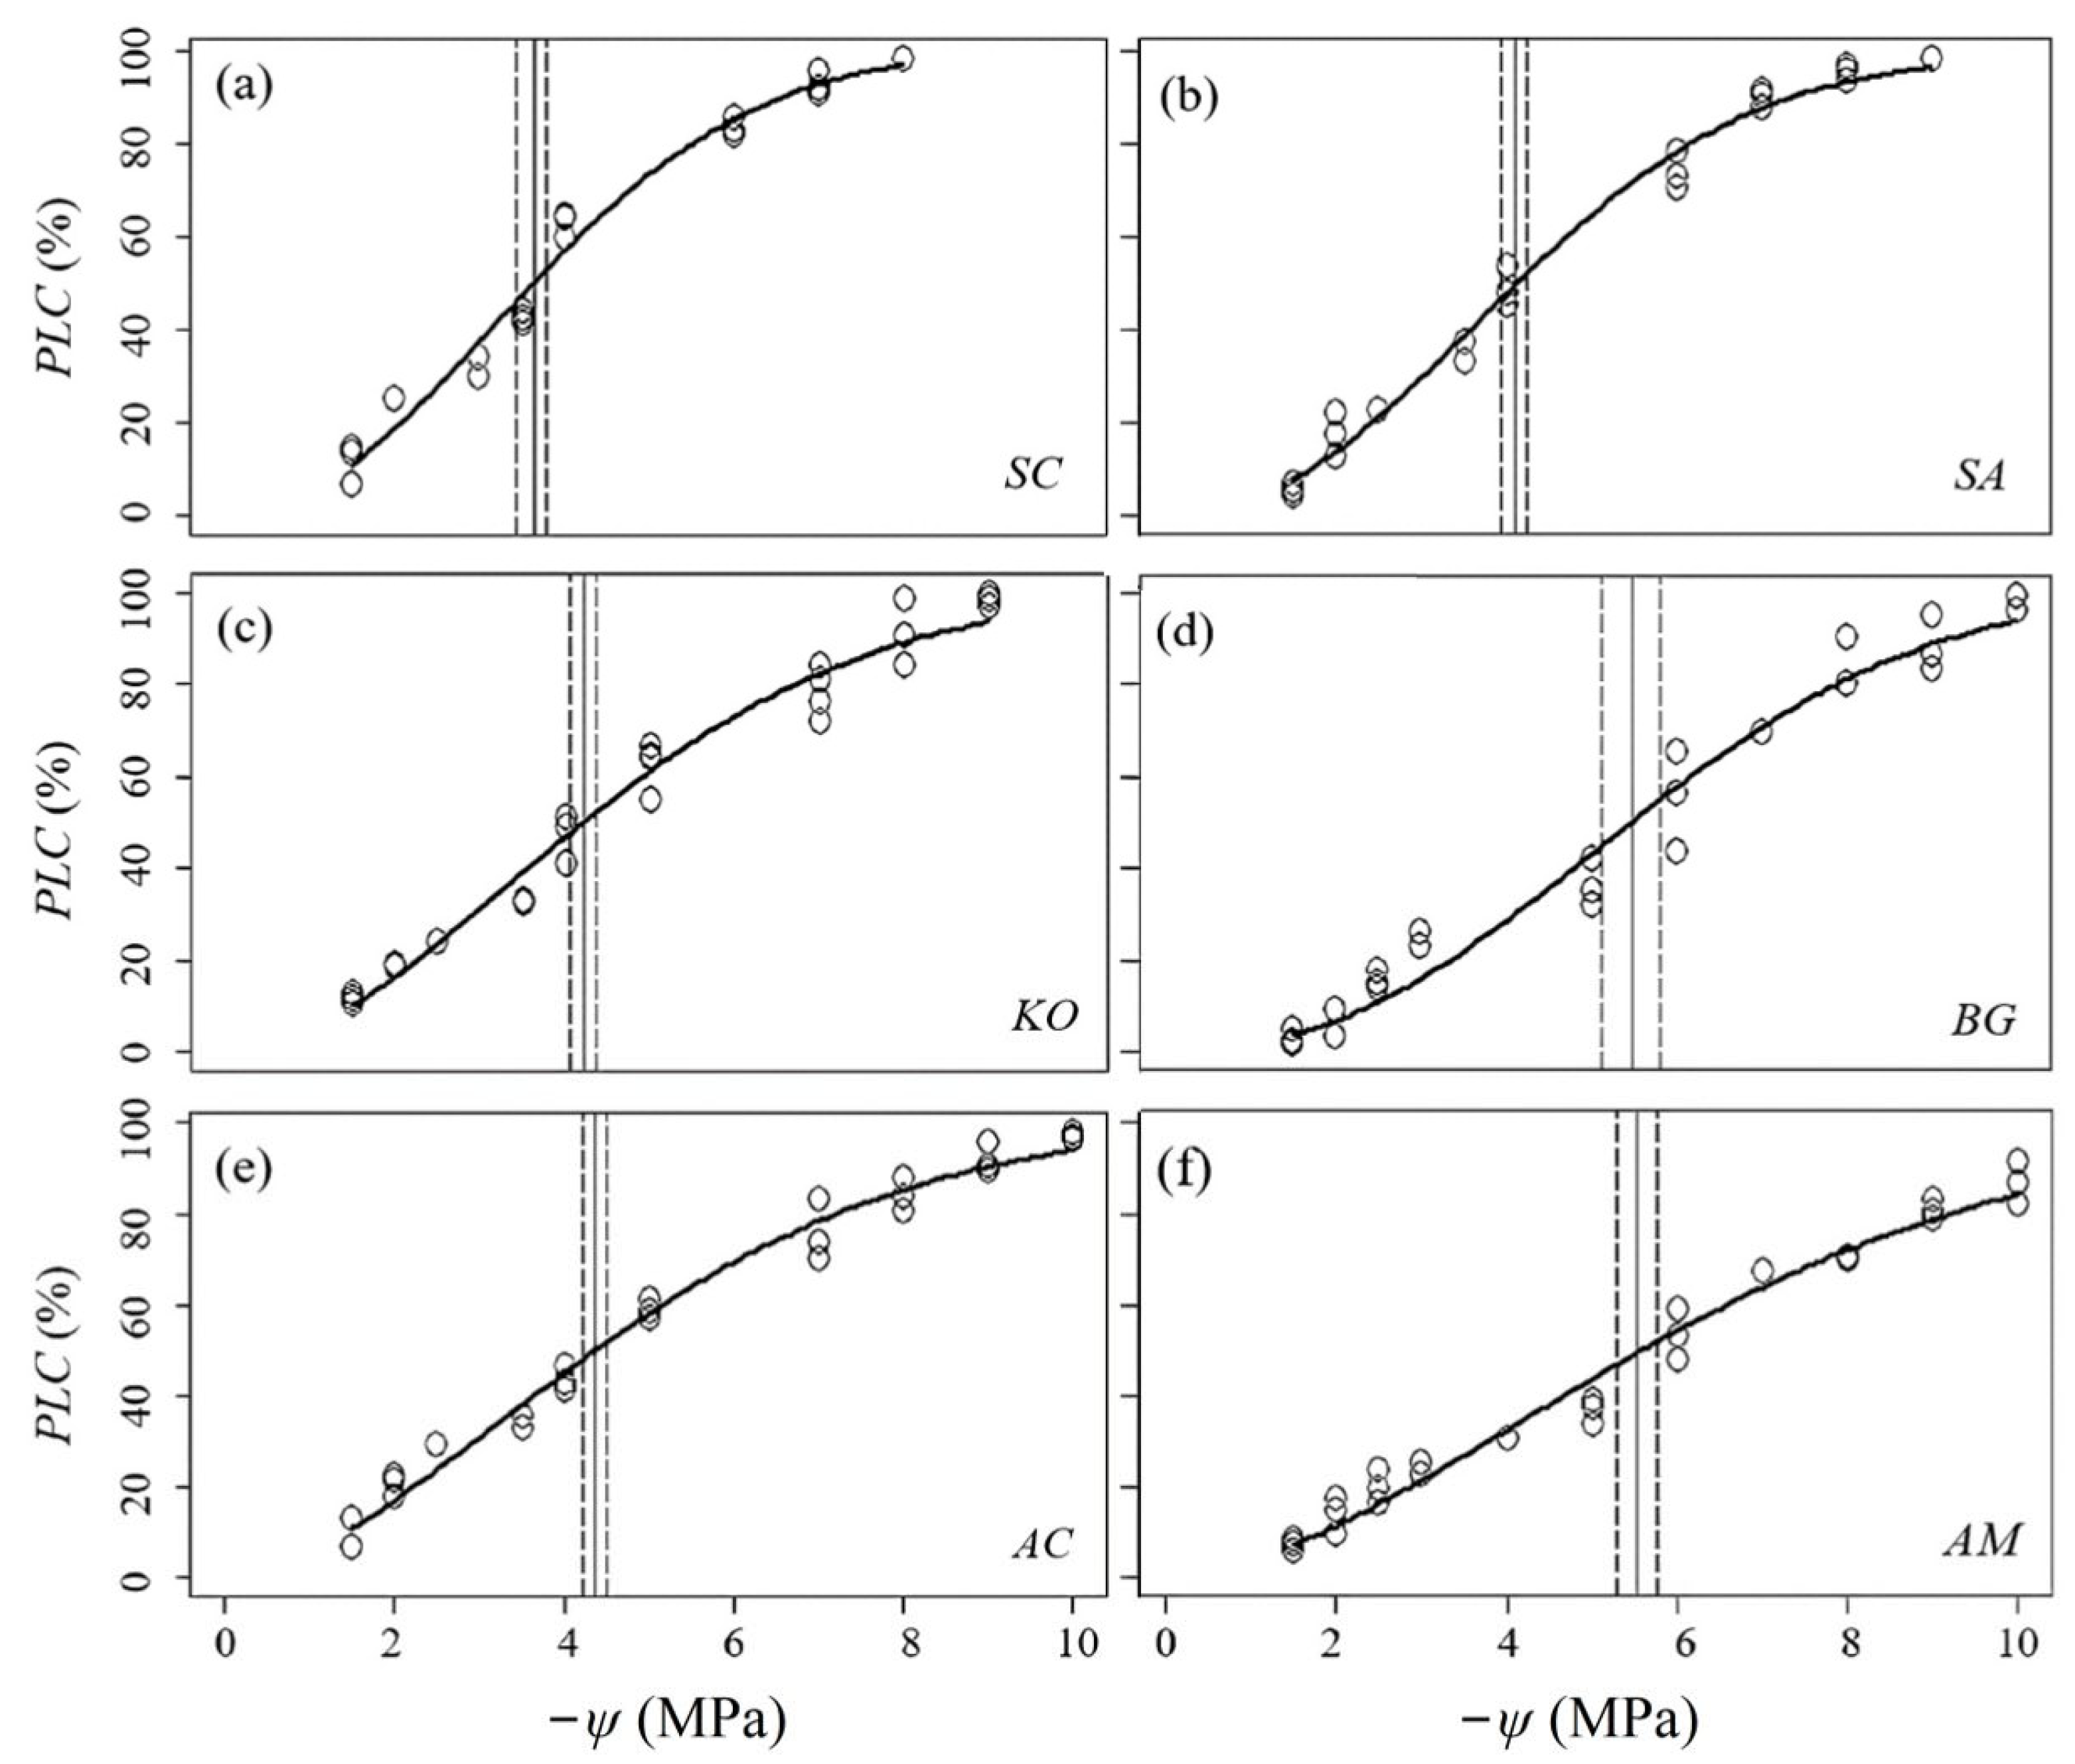
3.1. Hydraulic Vulnerability and Sensitivity

PLC (percentage loss of hydraulic conductivity) fitted well with the chamber pressures adopted to induce cavitation in branch xylem (Figure 1). Decreased ψ (leaf water potential) led to increased embolism. Px (water potential corresponding to x% loss in hydraulic conductivity) varied significantly (p < 0.05) among the six mangroves, and was generally lower (more negative) in the offshore species of Bruguiera gymnorrhiza and Avicennia marina. A. marina also had a significantly lower (more negative) P88 (water potential corresponding to 88% loss in hydraulic conductivity) than B. gymnorrhiza, while the differences of P12 (water potential corresponding to 12% loss in hydraulic conductivity) and P50 (water potential corresponding to 50 % loss in hydraulic conductivity) were not significant between them. For the onshore species of Sonneratia caseolaris and Sonneratia apetala, P50 was significantly higher (less negative) in the former than in the latter, while the differences of P12 and P88 were not significant. The mangrove species of Kandelia obovata and Aegiceras corniculatum tended to have intermediate Px (Table 2).
Sx (slope of hydraulic vulnerability curves) tend to increase first, reach their maximum at S50 (the slope of the hydraulic vulnerability curve at P50), and then decrease as embolism percentages (x) increase. Sx varied significantly (p < 0.05) among the six mangroves, and was generally larger in the onshore species of S. caseolaris and S. apetala. S. caseolaris had a significantly larger S12 (the slope of the hydraulic vulnerability curve at P12) than S. apetala, while the differences of S50 and S88 (the slope of the hydraulic vulnerability curve at P88) were not significant between them. For the offshore species of B. gymnorrhiza and A. marina, S50 and S88 were significantly larger in the former than in the latter, while the difference of S12 was not significant. The mangrove species of K. obovate and A. corniculatum tended to have intermediate Sx (Table 2).

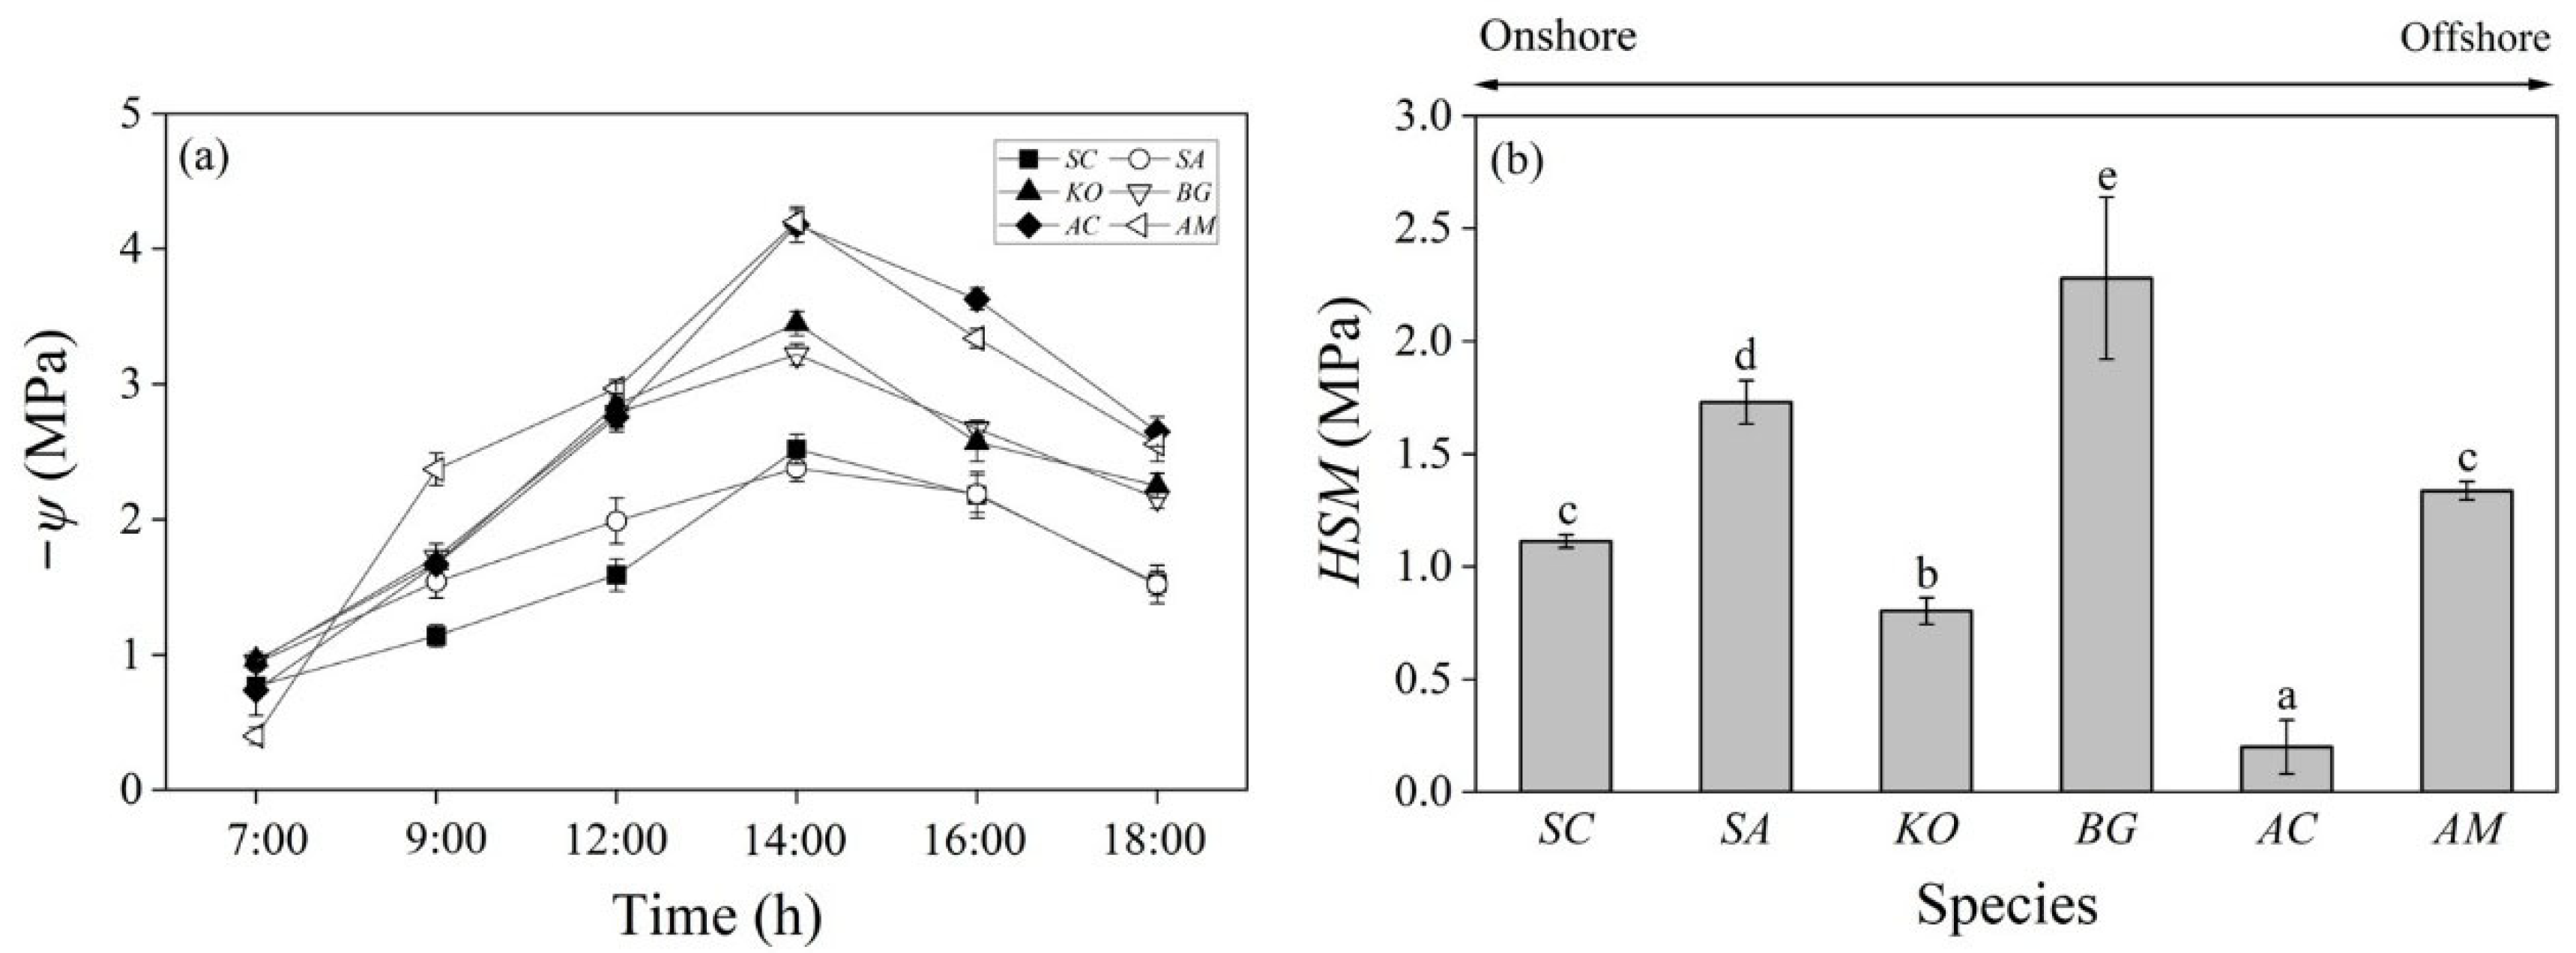
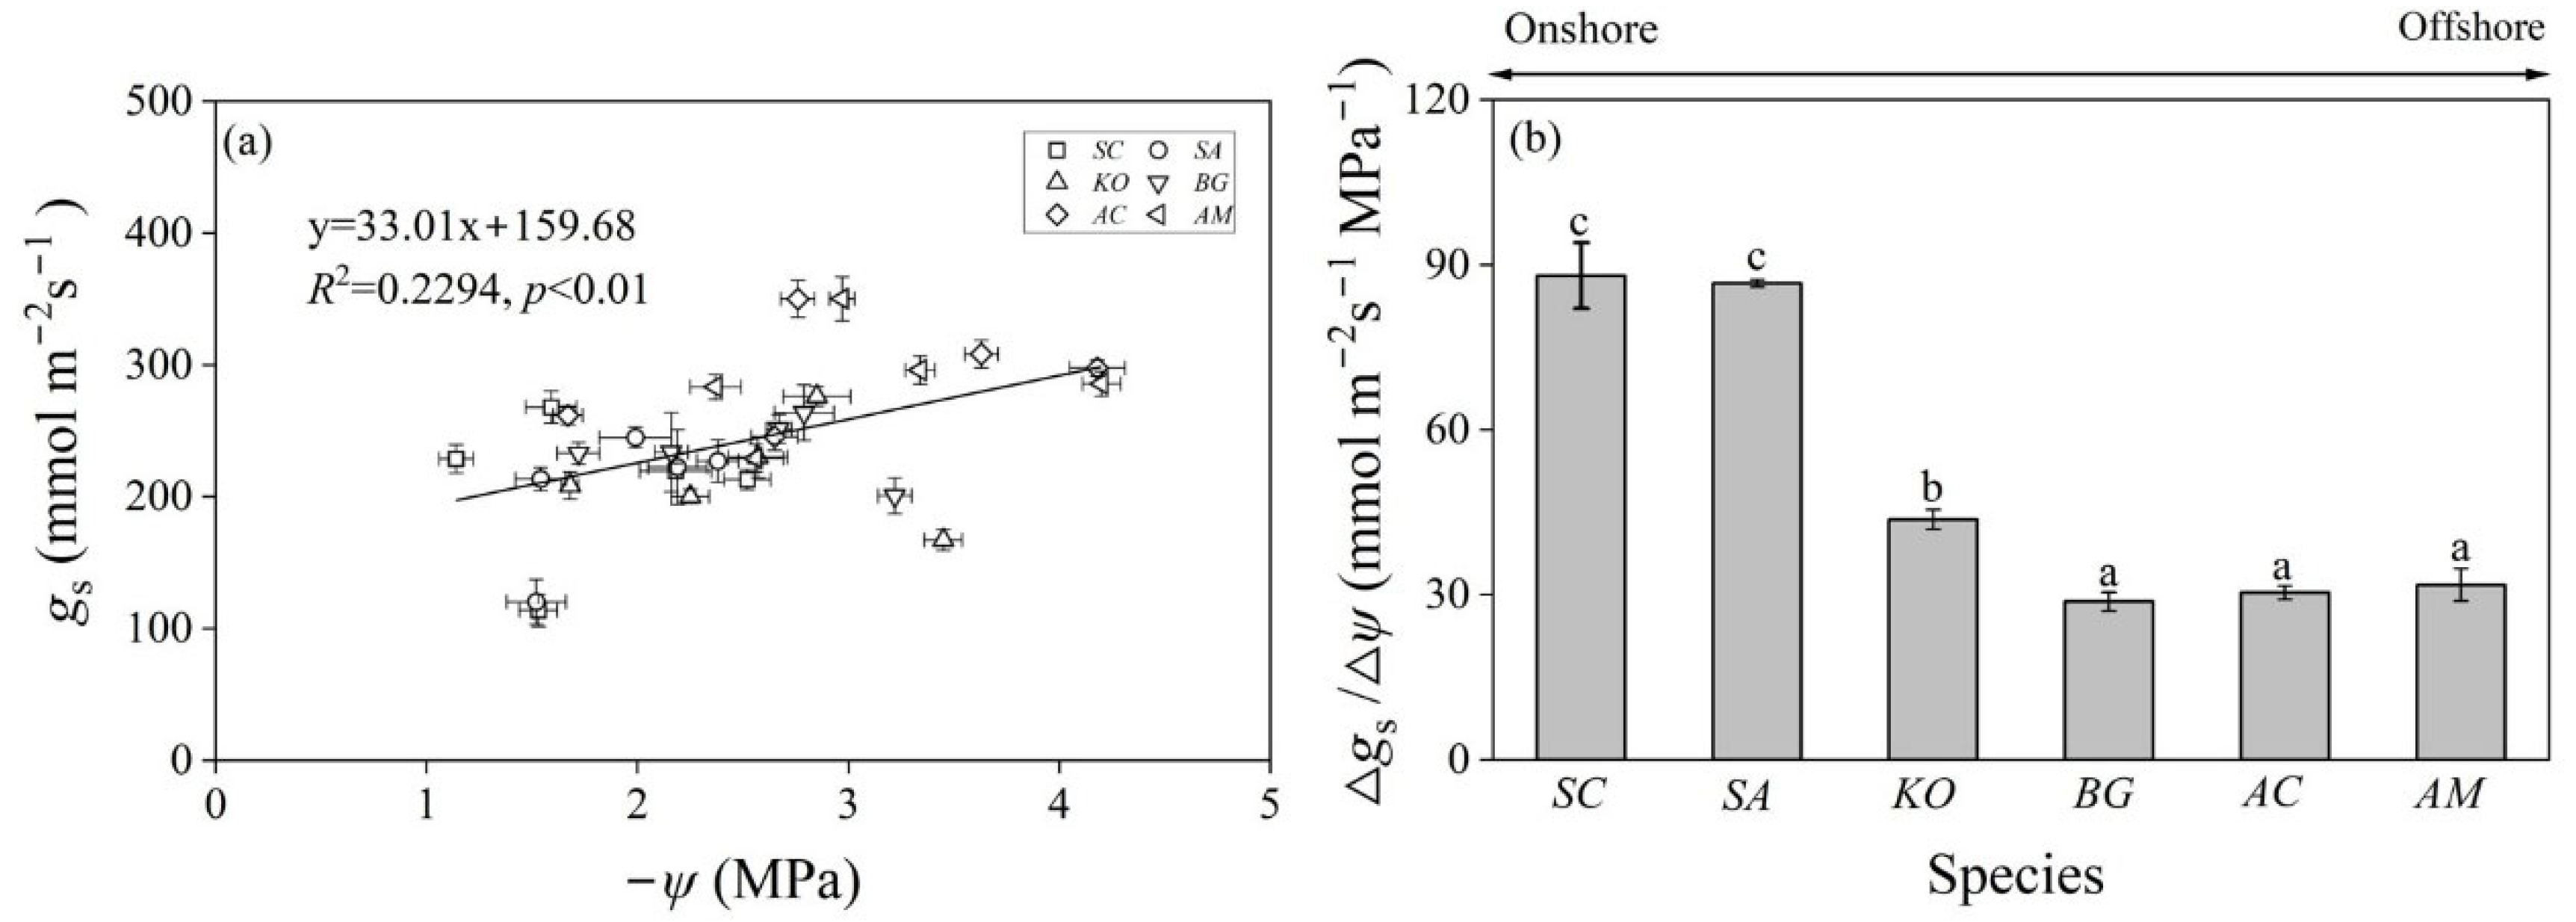
3.2. Stomatal Conductance and Water Potential

Daily changes in gs (leaf stomatal conductance) showed a unimodal pattern for the onshore species of S. caseolaris and S.apetala, with the maximum gs occurring at about 10:00 am and then decreasing all the way to below 130 mmol m−2 s−1 at 17:00. By contrast, K. obovate, B. gymnorrhiza, A. corniculatum, and A. marina had bimodal gs dynamics, also peaking at about 10:00 am, but decreasing at noon and then increasing after 14:00 for a period of time, consistently maintaining above 200 mmol m−2 s−1 throughout the whole day of the measurement (Table 3).
While gs was generally larger in A. corniculatum and A. marina than in S. caseolaris, S. apetala, K. obovate, and B. gymnorrhiza, its variation was significantly larger in S. caseolaris and S. apetala than in the other four species. During the measurement period from 6:00 to 17:00, the variation of gs was largest in S. caseolaris with a coefficient of variation (CV = standard deviation/mean) of 27% and a changing range (△gs, the difference between the maximum and minimum gs) of 178.5 mmol m−2 s−1. By contrast, gs varied least in B. gymnorrhiza with a CV of 10% and △gs of 99.5 mmol m−2 s−1. For other species, the CV (14–23%) and △gs (108–124 mmol m−2 s−1) fell between S. caseolaris and B. gymnorrhiza (Table 3).
ψ (leaf water potential) decreased from 7:00 to 14:00 and then increased gradually until 18:00. ψpre (the predawn ψ) was below 0 Mpa, but above −1 Mpa for all six mangrove species. A. corniculatum, A. marina, and S. caseolaris had significantly higher (less negative) ψpre than S. apetala, K. obovate, and B. gymnorrhiza, with A. marina having the highest (least negative) ψpre of −0.40 Mpa. Meanwhile, A. marina and A. corniculatum also had the lowest (most negative) ψmin (the minimum ψ), significantly lower (more negative) than that of the other four species. ψ was consistently lower (more negative) in A. marina and A. corniculatum than in other species from 14:00 to 18:00. By contrast, S. caseolaris and S. apetala had significantly higher (less negative) ψ throughout the whole day except for the predawn time of between 06:00–07:00 (Figure 2a and Table A1). Due to the similar ψpre, but contrasting ψmin, the range of ψ (△ψ) was significantly wider in A. marina (3.80 Mpa) and A. corniculatum (3.44 Mpa) than in other species (1.44–2.49 Mpa) (Table A1).

3.3. Hydraulic Safety Margin

The mangrove species of our present study all had a positive HSM (hydraulic safety margin), meaning that their ψmin was higher (less negative) than the P50 calculated from HVCs. The HSM was significantly wider in B. gymnorrhiza than in other mangroves. S. apetala also had a significantly wider HSM than S. caseolaris, K. obovate, A. corniculatum, and A. marina. S. caseolaris and A. marina had similar HSMs of between 1 and 1.5 Mpa, while A. corniculatum had the narrowest HSM (0.2 Mpa). The HSM of K. obovate was significantly wider than that of A. corniculatum, but significantly narrower than those of S. apetala, B. gymnorrhiza, and A. marina (Figure 2b).

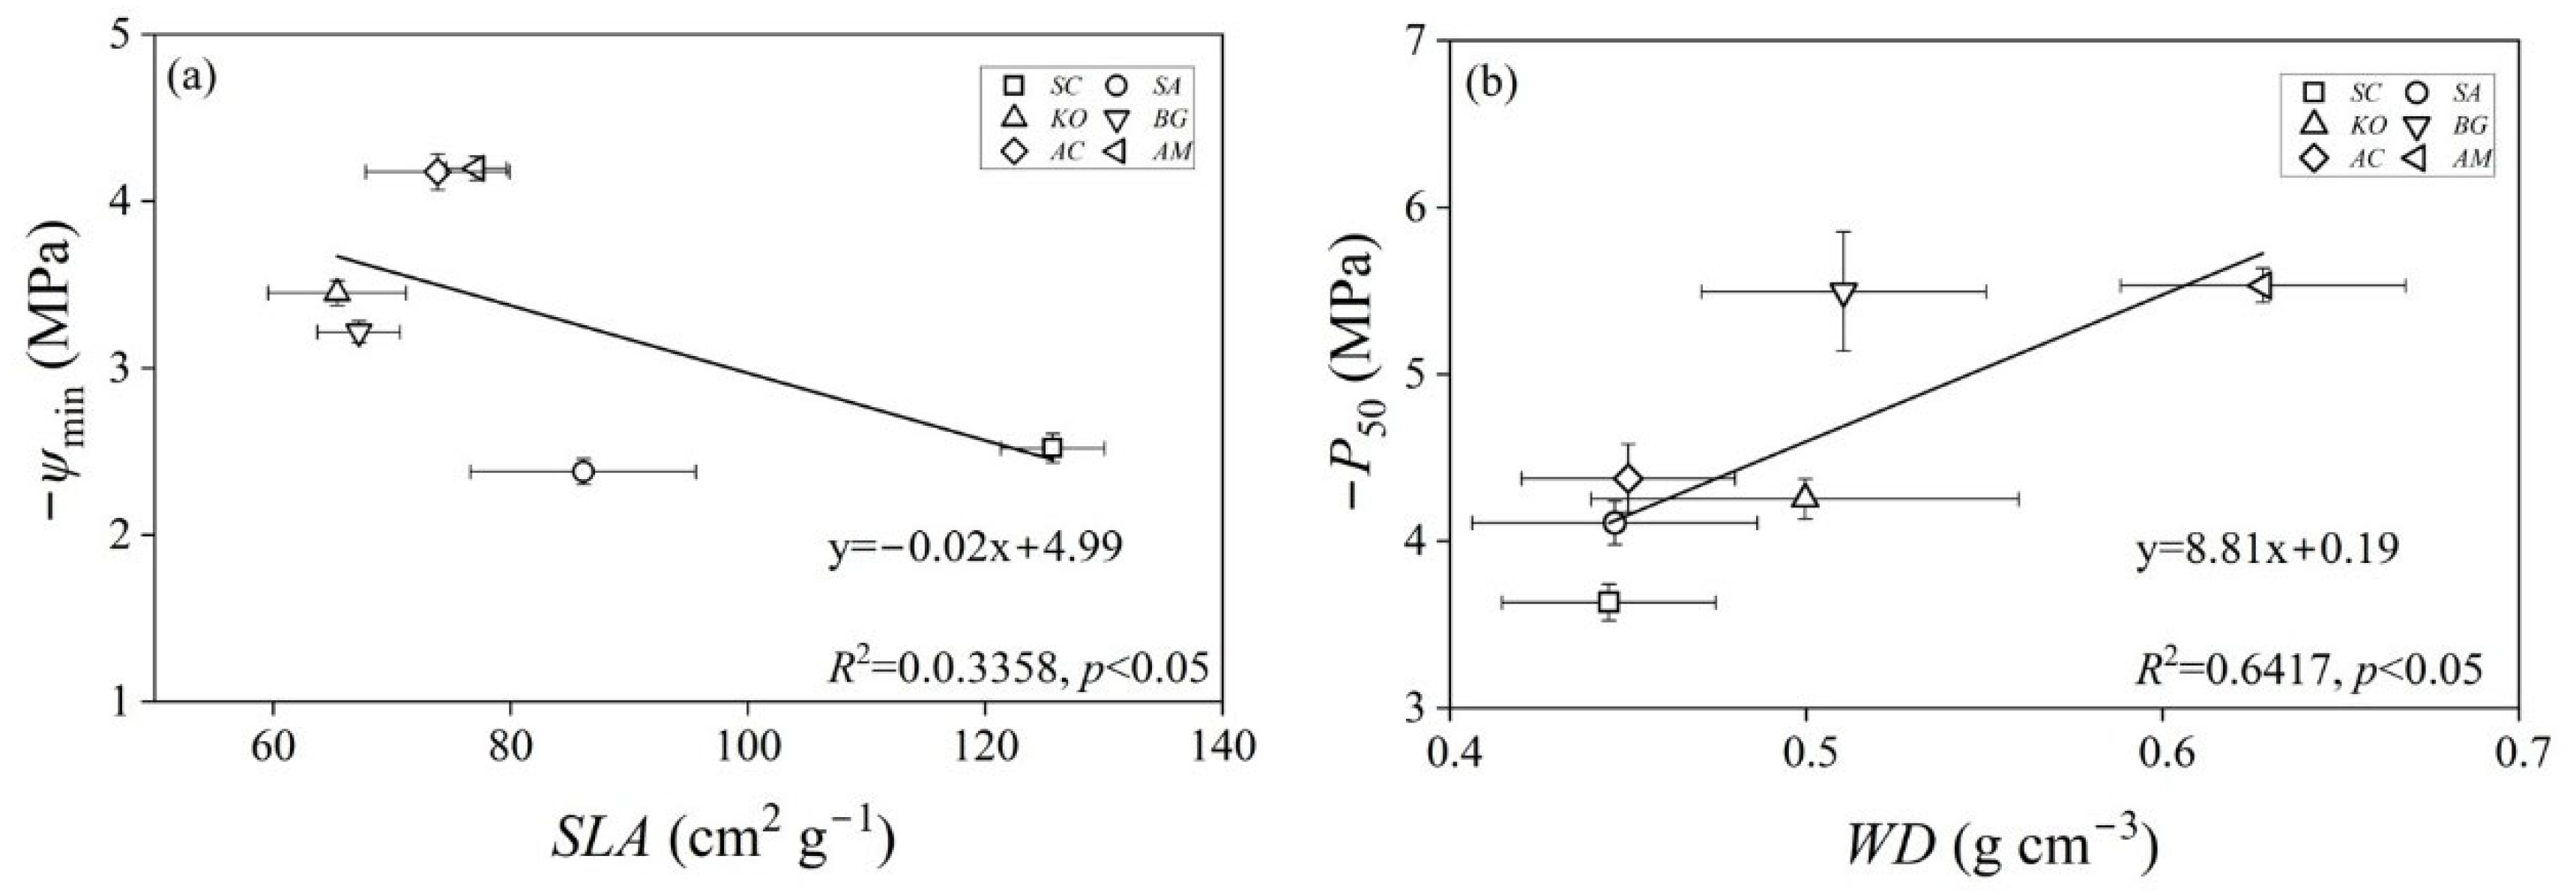
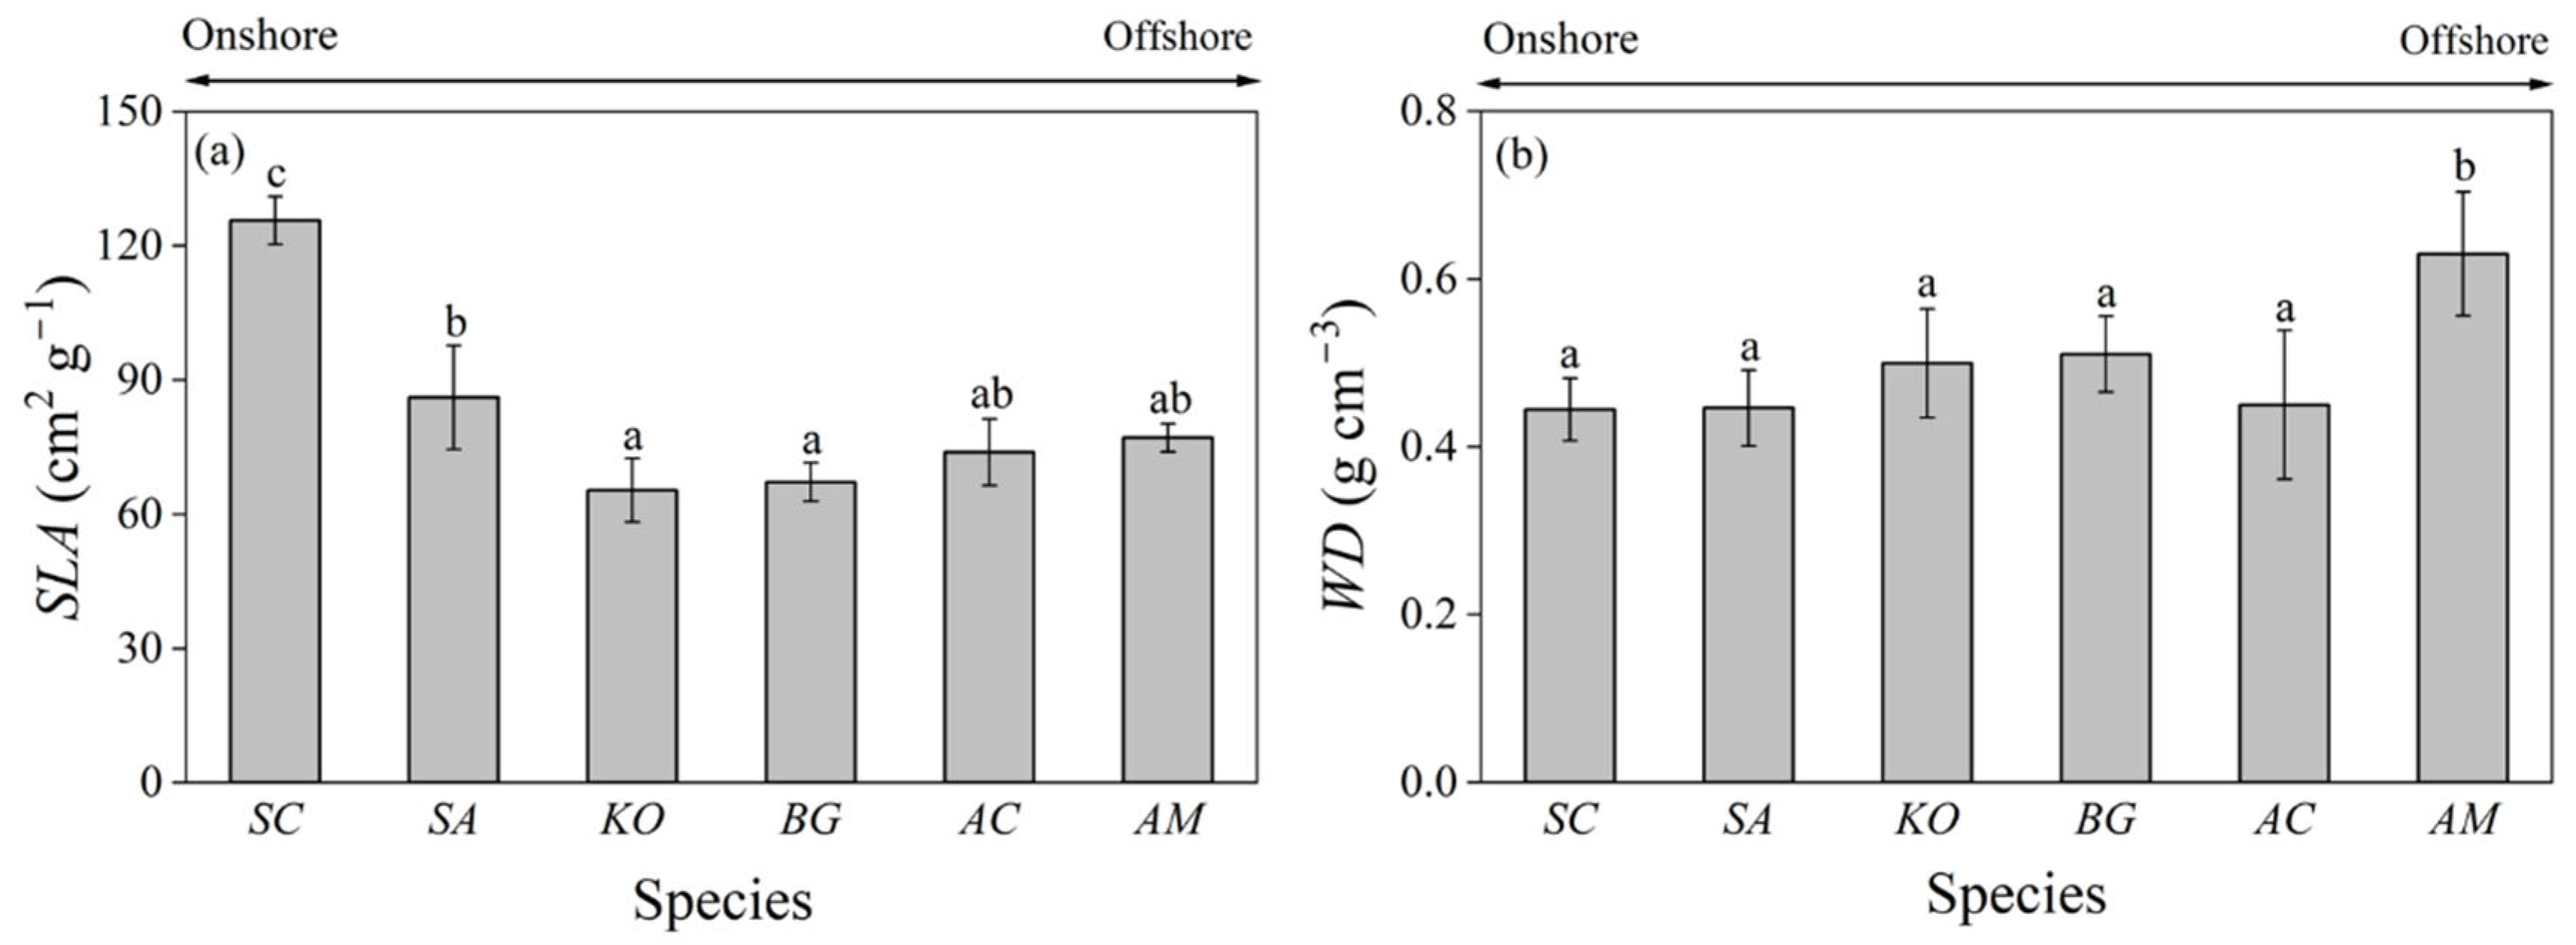
3.4. Specific Leaf Area and Wood Density

S. caseolaris and S. apetala had a significantly larger SLA (specific leaf area) than K. obovate and B. gymnorhiza. The SLA of S. caseolaris was nearly twice that of K. obovate (125.68 vs. 65.36 cm2 g−1). The SLA of A. corniculatum and A. marina also tended to be larger than those of K. obovate and B. gymnorhiza, but was smaller in comparison to those of S. caseolaris and S. apetala; yet, none of these differences were statistically significant (Figure 3a).
WD (wood density) was significantly larger in A. marina (0.63 g cm−3) than in other five mangrove species. Although K. obovate and B. gymnorhiza also tended to have larger WD than S. caseolaris, S. apetala, and A. corniculatum, the differences among them were not statistically significant (Figure 3b).

4. Discussion

Mangroves are periodically inundated by tides, and the high salinity of seawater may pose a great challenge to their growth [36]. Although the ion toxicity of salt is commonly ion-specific, its osmotic stress on plants is intrinsically similar to that of drought. Mangroves may therefore experience a physiological drought, and be potentially at the risk of drought-induced cavitation and embolism [37]. If that were the case, there would be trait differentiation among mangrove species distributed along salinity gradients. Traits relate to plant form and function, and the functional traits in turn affect plant responses to climate change and abiotic stresses [11,38]. The covariation between plant functional traits and various environmental factors has been well established in the literature [39,40,41].
SLA (specific leaf area) and WD (wood density) have been related to growth performance of trees and forests in response to drought across biomes. Species in arid environments tend to have low SLA and high WD [42,43]. In the present study, we found that SLA was significantly larger (p < 0.05) in the onshore species of Sonneratia caseolaris and Sonneratia apetala, while WD was significantly larger (p < 0.05) in the offshore species of Avicennia marina (Figure 3). These results concurred with the findings that SLA decreased while WD increased with salinity across mangroves in the Bangladesh Sundarbans [44]. We also noticed that S. caseolaris had significantly larger SLA than the introduced species of S. apetala (Figure 3a). This difference may come from the comparative advantage of the native species of S. caseolaris through long-term evolutionary adaptation to local hydro-environmental conditions to maximize leaf area and thus photosynthetic carbon assimilation [16].
In our present study, we observed that SLA and WD were marginally related to ψmin (the minimum leaf water potential) and P50 (water potential corresponding to 50% loss in hydraulic conductivity) (Figure A1). However, SLA was not significantly different among other mangroves except for S. caseolaris and S. apetala (Figure 3a). Also, except for A. marina, the differences of WD were not significant among other mangrove species (Figure 3b). Such a dichotomy of SLA and WD of the studied mangroves further undermines their linear regression relationships with ψmin and P50. These results corroborated the previous finding that SLA and WD were only weakly correlated with cross-species drought response patterns due to their loose connection to plant hydro-physiological processes [19]. Serra-Maluquer et al. [45] found that SLA and WD accounted for only 7% of drought-induced tree mortality variation across the globe. Powell et al. [46] showed that drought tolerance was independent of WD among mature Amazon rainforest trees. Therefore, despite the advantage of being easily measured for a large number of individual trees, SLA and WD per se do not necessarily presage plant vulnerability to drought or any other abiotic stress.
By contrast, hydraulic traits are generally considered to be more mechanistically linked to water use and transport in plants [47]. A large number of studies have demonstrated that hydraulic traits correlate tightly with plant vulnerability to drought [10,31]. We found that both P50 (water potential corresponding to 50% loss in hydraulic conductivity), P88 (water potential corresponding to 88% loss in hydraulic conductivity) and ψ (leaf water potential) decreased significantly along the salinity gradient from the onshore to offshore mangroves (Table 2 and Table A1). Jiang et al. [27] also observed that the P50 and ψmin of the offshore salt-adapted mangroves were significantly lower than those of onshore species at Guangxi Beilun Estuary National Mangrove Reserve. It should also be noted that Aegiceras corniculatum had higher (less negative) Px (including P12, P50 and P88) than Bruguiera gymnorrhiza in the present study (Table 2). This might be a result of the adaption of A. corniculatum to long-term inundation, being more available to water under the same or similar salinity. In natural conditions, A. corniculatum generally inhabits low tidal regions, while B. gymnorrhiza is commonly a mid–high tidal species [48,49].
The lower (more negative) P50 (<−5 Mpa) led to larger HSMs (hydraulic safety margins) (Figure 2b) for the offshore species of A. marina and B. gymnorrhiza, implying higher resistance to dehydration [11,46]. Yet, no obvious trends for HSMs were observed along the salinity gradient (Figure 2b). A. corniculatum and K. obovate had significantly narrower HSMs, signifying greater vulnerability to cavitation. Cavitated xylem conduits can be refilled at night through nocturnal sap flow, providing an effective compensation strategy for water deficits in these species [50]. On the other hand, although it is comparable in ψmin (Table A1), S. apetala had a significantly larger HSM than S. caseolaris (Figure 2b). Photosynthesis and growth may be prioritized over drought resistance, restricting carbon investment to xylem and thus resulting in a less negative P50 and a narrower HSM for the native species of S. caseolaris.
Px measures the water potential at which plants suffer a x% loss of hydraulic conductivity due to cavitation [32,51]; HSMs reflect the degree of conservatism of a plant’s hydraulic strategy [10,52]. The Sx, which quantifies xylem embolism sensitivity to water potential changes, is also important. In alignment with the decline in P50 and P88, Sx (S12, S50 and S88) also decreased along the salinity gradient from the onshore to offshore species (Table 2). Low Sx may serve as a buffer for plants to activate the ABA (abscisic acid) signaling pathway, inducing stomatal closure to reduce water loss through transpiration and preventing a further decline in ψ [53,54]. To sum up, it seems to be the case that there is a more gradual and slow progression of embolism than a sudden and rapid xylem embolization that dominates the acclimation and adaptation to salt in mangroves.
Hydraulic traits such as Px, Sx, and HSMs mainly depict the capacity of the xylem of a plant species to resist cavitation and embolism [52]. Regulation of gs (leaf stomatal conductance) represents another common strategy that plants adopt to cope with water deficiency under drought or saline conditions [55,56]. Species closing stomata rapidly can reduce transpiration water loss and maintain a relatively stable ψ in leaves (isohydry); by contrast, a loose control over gs often leads to fluctuating ψ (anisohydry) [57]. The decreasing ψmin (with a similar ψpre) (Figure 2a and Table A1) indicated a gradual transition from isohydry to anisohydry for mangroves distributed along the onshore to offshore salinity gradient. Further analyses revealed that the onshore species of S. caseolaris and S. Apetala had significantly larger △gs/△ψ than the offshore species of A. marina and A. corniculatum (Figure 4b), supporting the argument that strict stomatal control over ψ prevailed in the inland mangrove species.
Across the six mangrove species studied here, gs was significantly related to ψ (Figure 4a), suggesting that species with larger gs exert less control over ψ (and thus leads to more negative ψ). Klein [22] compiled the response curves of gs to ψ for 70 woody species from major forest biomes and found a continuum spectrum from anisohydry to isohydry. Other studies demonstrated that anisohydric species are more prone to be drought tolerant due to their embolism-resistant xylem and thick, dense leaves with lower turgor loss points [23,58]. In contrast, isohydric species often adopt a drought-avoidance strategy to prevent hydraulic failure during dry periods [59]. In the present study, we also observed smaller SLA, larger WD, and more negative P50 and P88 in the anisohydric species of A. marina and A. corniculatum. However, it is worth noting that a strict regulation of ψ is not necessarily associated with closed stomata and constrained carbon assimilation [60]. For a better prediction of plant responses to drought stress and a more reliable interpretation of community assemblage along salinity gradients, a prospective framework involves the integration of xylem hydraulics with stomatal behaviors as has been proposed by Klein [22] and Skelton et al. [61].

5. Conclusions

Based on the findings shown in the Section 3 and Section 4, and in correspondence to the hypotheses proposed in the introduction part, we make the following conclusions: (1) Hydraulic traits such as Px (water potential corresponding to x% loss in hydraulic conductivity), Sx (slope of the hydraulic vulnerability curve), and HSMs (hydraulic safety margins) differentiated markedly among the studied mangrove species: species inhabiting high salinity sites tended to have more negative P50 (water potential corresponding to 50% loss in hydraulic conductivity) and P88 (water potential corresponding to 88% loss in hydraulic conductivity), and smaller Sx, but P12 (water potential corresponding to 12% loss in hydraulic conductivity) and HSM displayed no salinity-associated trend. (2) Stomatal control over ψ (leaf water potential) decreased, and mangroves transitioned gradually from isohydry to anisohydry along the salinity gradient from the onshore to the offshore sites. (3) The onshore species of S. caseolaris and S. apetala had thinner leaves (larger SLA (specific leaf area )), while the offshore species of A. marina had significantly denser wood (larger WD (wood density)); both SLA and WD seemed to be more species-dependent rather than tolerance-related. More physiological features such as turgor loss points and a broader screening of mangrove species along topographically heterogenous coastal regions are needed to generalize our conclusions.

Author Contributions

Investigation, Y.P.; Writing—original draft, H.C.; Writing—review & editing, Y.C. and M.W.; Supervision, J.N. All authors have read and agreed to the published version of the manuscript.

Funding

This study was supported by China National Key Research and Development Project (No. 2023YFF1001200), China National Natural Science Foundation Youth Program (No. 31700365) and Shenzhen University Youth Teacher Launching Project (No. 000002110527). Any opinions, findings, and conclusions or recommendations expressed in this material are those of the authors and do not necessarily reflect the views of funding sources.

Data Availability Statement

The original contributions presented in this study are included in the article. Further inquiries can be directed to the corresponding author.

Conflicts of Interest

The authors declare no conflict of interest.

Appendix A

Table A1. Leaf water potential (ψ, Mpa) of the six mangrove species. Different letters indicate significant differences among species (mean ± SD, n = 3). SC: Sonneratia caseolaris; SA: Sonneratia apetala; KO: Kandelia obovata; BG: Bruguiera gymnorrhiza; AC: Aegiceras corniculatum; AM: Avicennia marina.
Species/Time06:00–08:008:00–10:0010:00–13:0013:00–15:0015:00–17:0017:00–19:00
SC−0.77 ± 0.02 b−1.14 ± 0.08 d−1.59 ± 0.12 c−2.52 ± 0.11 d−2.18 ± 0.17 d−1.53 ± 0.09 c
SA−0.94 ± 0.05 a−1.54 ± 0.12 c−1.99 ± 0.17 b−2.38 ± 0.10 d−2.19 ± 0.14 d−1.52 ± 0.14 c
KO−0.96 ± 0.06 a−1.68 ± 0.04 bc−2.85 ± 0.16 a−3.45 ± 0.09 b−2.57 ± 0.14 c−2.25 ± 0.09 b
BG−0.95 ± 0.03 a−1.72 ± 0.1 b−2.79 ± 0.14 a−3.22 ± 0.08 c−2.67 ± 0.06 c−2.16 ± 0.08 b
AC−0.74 ± 0.04 b−1.67 ± 0.07 bc−2.76 ± 0.08 a−4.18 ± 0.13 a−3.63 ± 0.08 a−2.65 ± 0.11 a
AM−0.40 ± 0.06 c−2.37 ± 0.12 a−2.97 ± 0.06 a−4.20 ± 0.09 a−3.34 ± 0.07 b−2.56 ± 0.13 a
Table A2. Specific leaf area (SLA, cm2 g−1), wood density (WD, g cm−3), and hydraulic safety margin (HSM) of the six mangrove species. Different letters indicate significant differences among species (mean ± SD, n = 3–15). SC: Sonneratia caseolaris; SA: Sonneratia apetala; KO: Kandelia obovata; BG: Bruguiera gymnorrhiza; AC: Aegiceras corniculatum; AM: Avicennia marina.
TraitsSCSAKOBGACAM
SLA125.68 ± 5.37 c86.11 ± 11.65 b65.36 ± 7.11 a67.19 ± 4.27 a73.84 ± 7.42 ab77.12 ± 3.13 ab
WD0.44 ± 0.04 a0.45 ± 0.05 a0.50 ± 0.06 a0.51 ± 0.05 a0.45 ± 0.09 a0.63 ± 0.07 b
HSM1.11 ± 0.03 c1.73 ± 0.10 d0.8 ± 0.06 b2.28 ± 0.36 e0.20 ± 0.10 a1.34 ± 0.04 c
Figure A1. The linear regression relationships between the minimum leaf water potential (ψmin, −Mpa) and specific leaf area (SLA, cm2 g−1) (a) and the xylem water potential corresponding to 50% loss of hydraulic conductivity (P50, −Mpa) and wood density (WD, g cm−3) (b) across the six mangroves species. SC: Sonneratia caseolaris; SA: Sonneratia apetala; KO: Kandelia obovata; BG: Bruguiera gymnorrhiza; AC: Aegiceras corniculatum; AM: Avicennia marina.
Plants 14 01850 g0a1

References

  1. Wang, W.Q.; Yan, Z.Z.; You, S.Y.; Zhang, Y.H.; Chen, L.Z.; Lin, G.H. Mangroves: Obligate or facultative halophytes? A review. Trees-Struct. Funct. 2011, 25, 953–963. [Google Scholar] [CrossRef]
  2. Basha, S.K.C. An overview on global mangroves distribution. Indian J. Mar. Sci. 2018, 47, 766–772. [Google Scholar]
  3. Robert, E.M.R.; Koedam, N.; Beeckman, H.; Schmitz, N. A safe hydraulic architecture as wood anatomical explanation for the difference in distribution of the mangroves Avicennia and Rhizophora. Funct. Ecol. 2009, 23, 649–657. [Google Scholar] [CrossRef]
  4. Barik, J.; Mukhopadhyay, A.; Ghosh, T.; Mukhopadhyay, S.K.; Chowdhury, S.M.; Hazra, S. Mangrove species distribution and water salinity: An indicator species approach to Sundarban. J. Coastal Conserv. 2018, 22, 361–368. [Google Scholar] [CrossRef]
  5. Reef, R.; Lovelock, C.E. Regulation of water balance in mangroves. Ann. Bot. 2015, 115, 385–395. [Google Scholar] [CrossRef]
  6. Brodersen, C.R.; Roddy, A.B.; Wason, J.W.; McElrone, A.J. Functional status of xylem through time. Annu. Rev. Plant Biol. 2019, 70, 407–433. [Google Scholar] [CrossRef] [PubMed]
  7. Parida, A.K.; Jha, B. Salt tolerance mechanisms in mangroves: A review. Trees-Struct. Funct. 2010, 24, 199–217. [Google Scholar] [CrossRef]
  8. dos Santos, T.B.; Ribas, A.F.; de Souza, S.G.H.; Budzinski, I.G.F.; Domingues, D.S. Physiological responses to drought, salinity, and heat stress in plants: A Review. Stresses 2022, 2, 113–135. [Google Scholar] [CrossRef]
  9. Gupta, A.; Rico-Medina, A.; Cano-Delgado, A.I. The physiology of plant responses to drought. Sci. 2020, 368, 266–269. [Google Scholar] [CrossRef]
  10. Choat, B.; Jansen, S.; Brodribb, T.J.; Cochard, H.; Delzon, S.; Bhaskar, R.; Bucci, S.J.; Feild, T.S.; Gleason, S.M.; Hacke, U.G.; et al. Global convergence in the vulnerability of forests to drought. Nature. 2012, 491, 752–756. [Google Scholar] [CrossRef]
  11. Anderegg, W.R.L.; Konings, A.G.; Trugman, A.T.; Yu, K.; Bowling, D.R.; Gabbitas, R.; Karp, D.S.; Pacala, S.; Sperry, J.S.; Sulman, B.N.; et al. Hydraulic diversity of forests regulates ecosystem resilience during drought. Nature 2018, 561, 538–541. [Google Scholar] [CrossRef]
  12. Tan, F.-S.; Song, H.-Q.; Fu, P.-L.; Chen, Y.-J.; Siddiq, Z.; Cao, K.-F.; Zhu, S.-D. Hydraulic safety margins of co-occurring woody plants in a tropical karst forest experiencing frequent extreme droughts. Agric. For. Meteorol. 2020, 292, 108107. [Google Scholar] [CrossRef]
  13. Yan, C.-L.; Ni, M.-Y.; Cao, K.-F.; Zhu, S.-D. Leaf hydraulic safety margin and safety-efficiency trade-off across angiosperm woody species. Biol. Lett. 2020, 16, 20200456. [Google Scholar] [CrossRef] [PubMed]
  14. Delzon, S.; Cochard, H. Recent advances in tree hydraulics highlight the ecological significance of the hydraulic safety margin. New Phytol. 2014, 203, 355–358. [Google Scholar] [CrossRef]
  15. Zhang, B.; Lu, X.; Jiang, J.; DeAngelis, D.L.; Fu, Z.; Zhang, J. Similarity of plant functional traits and aggregation pattern in a subtropical forest. Ecol. Evol. 2017, 7, 4086–4098. [Google Scholar] [CrossRef] [PubMed]
  16. Liu, Z.; Zhao, M.; Zhang, H.; Ren, T.; Liu, C.; He, N. Divergent response and adaptation of specific leaf area to environmental change at different spatio-temporal scales jointly improve plant survival. Global Change Biol. 2022, 29, 1144–1159. [Google Scholar] [CrossRef]
  17. Uchiya, P.; Escaray, F.J.; Bilenca, D.; Pieckenstain, F.; Ruiz, O.A.; Menendez, A.B. Salt effects on functional traits in model and in economically important Lotus species. Plant Biol. 2016, 18, 703–709. [Google Scholar] [CrossRef]
  18. Chave, J.; Coomes, D.; Jansen, S.; Lewis, S.L.; Swenson, N.G.; Zanne, A.E. Towards a worldwide wood economics spectrum. Ecol. Lett. 2009, 12, 351–366. [Google Scholar] [CrossRef]
  19. Greenwood, S.; Ruiz-Benito, P.; Martinez-Vilalta, J.; Lloret, F.; Kitzberger, T.; Allen, C.D.; Fensham, R.; Laughlin, D.C.; Kattge, J.; Bönisch, G.; et al. Tree mortality across biomes is promoted by drought intensity, lower wood density and higher specific leaf area. Ecol. Lett. 2017, 20, 539–553. [Google Scholar] [CrossRef]
  20. Del Campo, J.T.F.; Olvera-Vargas, M.; Figueroa-Rangel, B.L.; Cuevas-Guzman, R.; Casanoves, F. Intraspecific functional variability and functional changes along environmental gradients associated to mangrove forest zonation in West-Central Mexico. Wetlands. 2022, 42, 115. [Google Scholar] [CrossRef]
  21. Virgulino-Junior, P.C.C.; Gardunho, D.C.L.; Silva, D.N.C.; Fernandes, M.E.B. Wood density in mangrove forests on the Brazilian Amazon coast. Trees-Struct. Funct. 2020, 34, 51–60. [Google Scholar] [CrossRef]
  22. Klein, T. The variability of stomatal sensitivity to leaf water potential across tree species indicates a continuum between isohydric anisohydric behaviours. Funct. Ecol. 2014, 28, 1313–1320. [Google Scholar] [CrossRef]
  23. Fu, X.; Meinzer, F.C. Metrics and proxies for stringency of regulation of plant water status (iso/anisohydry): A global data set reveals coordination and trade-offs among water transport traits. Tree Physiol. 2019, 39, 122–134. [Google Scholar] [CrossRef]
  24. Martin-StPaul, N.; Delzon, S.; Cochard, H. Plant resistance to drought depends on timely stomatal closure. Ecol. Lett. 2017, 20, 1437–1447. [Google Scholar] [CrossRef]
  25. Murray, M.; Soh, W.K.; Yiotis, C.; Batke, S.; Parnell, A.C.; Spicer, R.A.; Lawson, T.; Caballero, R.; Wright, I.J.; Purcell, C.; et al. Convergence in maximum stomatal conductance of C3 woody angiosperms in natural ecosystems across bioclimatic zones. Front. Plant Sci. 2019, 10, 558. [Google Scholar] [CrossRef] [PubMed]
  26. Rodriguez-Dominguez, C.M.; Forner, A.; Martorell, S.; Choat, B.; Lopez, R.; Peters, J.M.R.; Pfautsch, S.; Mayr, S.; Carins-Murphy, M.R.; McAdam, S.A.M.; et al. Leaf water potential measurements using the pressure chamber: Synthetic testing of assumptions towards best practices for precision and accuracy. Plant Cell Environ. 2022, 45, 2037–2061. [Google Scholar] [CrossRef]
  27. Jiang, Z.-K.; Tuo, L.; Huang, D.-L.; Osterman, I.A.; Tyurin, A.P.; Liu, S.-W.; Lukyanov, D.A.; Sergiev, P.V.; Dontsova, O.A.; Korshun, V.A.; et al. Diversity novelty antimicrobial activity of endophytic actinobacteria from mangrove plants in Beilun Estuary National Nature Reserve of Guangxi China. Front. Microbiol. 2018, 9, 868. [Google Scholar] [CrossRef]
  28. Secchi, F.; Zwieniecki, M.A. Analysis of xylem sap from functional (nonembolized) and nonfunctional (embolized) vessels of Populus nigra: Chemistry of refilling. Plant Physiol. 2012, 160, 955–964. [Google Scholar] [CrossRef]
  29. Brodersen, C.R.; Roark, L.C.; Pittermann, J. The physiological implications of primary xylem organization in two ferns. Plant Cell Environ. 2012, 35, 1898–1911. [Google Scholar] [CrossRef]
  30. Liu, Y.Y.; Song, J.; Wang, M.; Li, N.; Niu, C.Y.; Hao, G.Y. Coordination of xylem hydraulics and stomatal regulation in keeping the integrity of xylem water transport in shoots of two compound-leaved tree species. Tree Physiol. 2015, 35, 1333–1342. [Google Scholar] [CrossRef]
  31. Anderegg, W.R.L.; Klein, T.; Bartlett, M.; Sack, L.; Pellegrini, A.F.A.; Choat, B.; Jansen, S. Meta-analysis reveals that hydraulic traits explain cross-species patterns of drought-induced tree mortality across the globe. Proc. Natl. Acad. Sci. USA 2016, 113, 5024–5029. [Google Scholar] [CrossRef] [PubMed]
  32. Duursma, R.; Choat, B. Fitplc—An R package to fit hydraulic vulnerability curves. Hydrol. 2017, 4, e-002. [Google Scholar] [CrossRef]
  33. Pammenter, N.W.; Vander Willigen, C. A mathematical and statistical analysis of the curves illustrating vulnerability of xylem to cavitation. Tree Physiol. 1998, 18, 589–593. [Google Scholar] [CrossRef] [PubMed]
  34. Bryant, C.; Fuenzalida, T.I.; Brothers, N.; Mencuccini, M.; Sack, L.; Binks, O.; Ball, M.C. Shifting access to pools of shoot water sustains gas exchange and increases stem hydraulic safety during seasonal atmospheric drought. Plant Cell Environ. 2021, 44, 2898–2911. [Google Scholar] [CrossRef] [PubMed]
  35. Garnier, E.; Shipley, B.; Roumet, C.; Laurent, G. A standardized protocol for the determination of specific leaf area and leaf dry matter content. Funct. Ecol. 2001, 15, 688–695. [Google Scholar] [CrossRef]
  36. Zheng, Y.; Takeuchi, W. Estimating mangrove forest gross primary production by quantifying environmental stressors in the coastal area. Sci. Rep. 2022, 12, 2238. [Google Scholar] [CrossRef]
  37. Wang, Y.S.; Gu, J.D. Ecological responses, adaptation and mechanisms of mangrove wetland ecosystem to global climate change and anthropogenic activities. Int. Biodeterior. Biodegrad. 2021, 162, 105248. [Google Scholar] [CrossRef]
  38. Funk, J.L.; Larson, J.E.; Ames, G.M.; Butterfield, B.J.; Cavender-Bares, J.; Firn, J.; Laughlin, D.C.; Sutton-Grier, A.E.; Williams, L.; Wright, J. Revisiting the Holy Grail: Using plant functional traits to understand ecological processes. Biol. Rev. 2017, 92, 1156–1173. [Google Scholar] [CrossRef]
  39. Li, X.; Piao, S.; Wang, K.; Wang, X.; Wang, T.; Ciais, P.; Chen, A.; Lian, X.; Peng, S.; Peñuelas, J. Temporal trade-off between gymnosperm resistance and resilience increases forest sensitivity to extreme drought. Nat. Ecol. Evol. 2020, 4, 1075–1083. [Google Scholar] [CrossRef]
  40. Wang, Y.; Zhang, L.M.; Chen, J.; Feng, L.; Li, F.B.; Yu, L.F. Study on the relationship between functional characteristics and environmental factors in karst plant communities. Ecol. Evol. 2022, 12, e9335. [Google Scholar] [CrossRef]
  41. Ma, J.G.; Wang, X.B.; Hou, F.J. A general pattern of plant traits and their relationships with environmental factors and microbial life-history strategies. Sci. Total Environ. 2024, 931, 172670. [Google Scholar] [CrossRef] [PubMed]
  42. Costa-Saura, J.M.; Martinez-Vilalta, J.; Trabucco, A.; Spano, D.; Mereu, S. Specific leaf area and hydraulic traits explain niche segregation along an aridity gradient in Mediterranean woody species. Perspect Plant Ecol. 2016, 21, 23–30. [Google Scholar] [CrossRef]
  43. Serra-Maluquer, X.; Gazol, A.; Anderegg, W.R.L.; Martinez-Vilalta, J.; Mencuccini, M.; Julio Camarero, J. Wood density and hydraulic traits influence species’ growth response to drought across biomes. Global. Change Biol. 2022, 28, 3871–3882. [Google Scholar] [CrossRef] [PubMed]
  44. Ahmed, S.; Sarker, S.K.; Friess, D.A.; Kamruzzam, M.; Jacobs, M.; Islam, A.; Alam, A.; Suvo, M.J.; Sani, N.H.; Dey, T.; et al. Salinity reduces site quality and mangrove forest functions. From monitoring to understanding. Sci. Total Environ. 2022, 853, 158662. [Google Scholar] [CrossRef]
  45. Serra-Maluquer, X.; Granda, E.; Camarero, J.J.; Vila-Cabrera, A.; Jump, A.S.; Sanchez-Salguero, R.; Sangüesa-Barreda, G.; Imbert, J.B.; Gazol, A.; Jucker, T. Impacts of recurrent dry and wet years alter long-term tree growth trajectories. J. Ecol. 2021, 109, 1561–1574. [Google Scholar] [CrossRef]
  46. Powell, T.L.; Wheeler, J.K.; de Oliveira, A.A.R.; Lola da Costa, A.C.; Saleska, S.R.; Meir, P.; Moorcroft, P.R. Differences in xylem and leaf hydraulic traits explain differences in drought tolerance among mature Amazon rainforest trees. Global Change Biol. 2017, 23, 4280–4293. [Google Scholar] [CrossRef]
  47. Kotowska, M.M.; Link, R.M.; Roell, A.; Hertel, D.; Hoelscher, D.; Waite, P.-A.; Moser, G.; Tjoa, A.; Leuschner, C.; Schuldt, B. Effects of wood hydraulic properties on water use and productivity of tropical rainforest trees. Front. For. Global. Change 2021, 3, 598759. [Google Scholar] [CrossRef]
  48. Jiang, C.P.; Pauly, D.; Wang, W.Q.; Du, J.G.; Cheng, J.H.; Wang, M. A preliminary model of the mangrove ecosystem of Dongzhaigang Bay, Hainan, (China) based on Ecopath and Ecospace. Front. Mar. Sci. 2023, 10, 1277226. [Google Scholar] [CrossRef]
  49. Jiang, D.A.; Nie, T.; He, Q.Y.; Yan, J.; Feng, E.H.; Ye, Q. A trade-off between leaf carbon economics and plant size among mangrove species in Dongzhaigang, China. Ecol. Evol. 2024, 14, e70559. [Google Scholar] [CrossRef]
  50. Wu, S.; Gu, X.; Zheng, Y.; Chen, L. Nocturnal sap flow as compensation for water deficits: An implicit water-saving strategy used by mangroves in stressful environments. Front. Plant Sci. 2023, 14, 1118970. [Google Scholar] [CrossRef]
  51. Santiago, L.S.; De Guzman, M.E.; Baraloto, C.; Vogenberg, J.E.; Brodie, M.; Herault, B.; Fortunel, C.; Bonal, D. Coordination and trade-offs among hydraulic safety, efficiency and drought avoidance traits in Amazonian rainforest canopy tree species. New Phytol. 2018, 218, 1015–1024. [Google Scholar] [CrossRef]
  52. Fuchs, S.; Leuschner, C.; Mathias Link, R.; Schuldt, B. Hydraulic variability of three temperate broadleaf tree species along a water availability gradient in central Europe. New Phytol. 2021, 231, 1387–1400. [Google Scholar] [CrossRef]
  53. Jiang, G.-F.; Brodribb, T.J.; Roddy, A.B.; Lei, J.-Y.; Si, H.-T.; Pahadi, P.; Zhang, Y.-J.; Cao, K.-F. Contrasting water use, stomatal regulation, embolism resistance, and drought responses of two co-occurring mangroves. Water. 2021, 13, 1945. [Google Scholar] [CrossRef]
  54. Yang, Y.-J.; Bi, M.-H.; Nie, Z.-F.; Jiang, H.; Liu, X.-D.; Fang, X.-W.; Brodribb, T.J. Evolution of stomatal closure to optimize water-use efficiency in response to dehydration in ferns and seed plants. New Phytol. 2021, 230, 2001–2010. [Google Scholar] [CrossRef] [PubMed]
  55. Lu, Y.; Duursma, R.A.; Farrior, C.E.; Medlyn, B.E.; Feng, X. Optimal stomatal drought response shaped by competition for water and hydraulic risk can explain plant trait covariation. New Phytol. 2020, 225, 1206–1217. [Google Scholar] [CrossRef] [PubMed]
  56. Yang, X.; Cushman, J.C.; Borland, A.M.; Liu, Q. Editorial: Systems biology and synthetic biology in relation to drought tolerance or avoidance in Plants. Front. Plant Sci. 2020, 11, 394. [Google Scholar] [CrossRef]
  57. Martinez-Vilalta, J.; Garcia-Forner, N. Water potential regulation, stomatal behaviour and hydraulic transport under drought: Deconstructing the iso/anisohydric concept. Plant Cell Environ. 2017, 40, 962–976. [Google Scholar] [CrossRef]
  58. Zhu, S.D.; Chen, Y.J.; Ye, Q.; He, P.C.; Liu, H.; Li, R.H.; Fu, P.-L.; Jiang, G.-F.; Cao, K.-F. Leaf turgor loss point is correlated with drought tolerance and leaf carbon economics traits. Tree Physiol. 2018, 38, 658–663. [Google Scholar] [CrossRef]
  59. Hoffmann, W.A.; Marchin, R.M.; Abit, P.; Lau, O.L. Hydraulic failure and tree dieback are associated with high wood density in a temperate forest under extreme drought. Global Change Biol. 2011, 17, 2731–2742. [Google Scholar] [CrossRef]
  60. Garcia-Forner, N.; Adams, H.D.; Sevanto, S.; Collins, A.D.; Dickman, L.T.; Hudson, P.J.; Zeppel, M.J.; Jenkins, M.W.; Powers, H.; Martínez-Vilalta, J.; et al. Responses of two semiarid conifer tree species to reduced precipitation and warming reveal new perspectives for stomatal regulation. Plant Cell Environ. 2016, 39, 38–49. [Google Scholar] [CrossRef]
  61. Skelton, R.P.; West, A.G.; Dawson, T.E. Predicting plant vulnerability to drought in biodiverse regions using functional traits. Proc. Natl. Acad. Sci. USA 2015, 112, 5744–5749. [Google Scholar] [CrossRef] [PubMed]
Figure 1. Percentage loss of xylem hydraulic conductivity (PLC, %) as a function of xylem water potential (ψ, −Mpa) for the six mangrove species. The vertical solid lines indicate the ψ corresponding to 50% loss of hydraulic conductivity (P50) and vertical dashed lines indicate the bootstrap (N = 1000) estimated 95% confidence intervals for P50. (a) Sonneratia caseolaris; (b) Sonneratia apetala; (c) Kandelia obovata; (d) Bruguiera gymnorrhiza; (e) Aegiceras corniculatum; (f) Avicennia marina.
Plants 14 01850 g001
Figure 2. Diurnal leaf water potential (ψ, −Mpa) (a) and hydraulic safety margins (HSMs, Mpa) (b) of the six mangrove species. The HSM was calculated as the difference between the minimal leaf water potential (ψmin) under field conditions and the water potential corresponding to 50% loss of hydraulic conductivity (P50). Different letters indicate significant differences among species (mean ± SD, n = 3). SC: Sonneratia caseolaris; SA: Sonneratia apetala; KO: Kandelia obovata; BG: Bruguiera gymnorrhiza; AC: Aegiceras corniculatum; AM: Avicennia marina.
Plants 14 01850 g002
Figure 3. Specific leaf area (SLA, cm2 g−1) (a) and wood density (WD, g cm−3) (b) of the six mangrove species. Different letters indicate significant differences among species (mean ± SD, n = 3–15). SC: Sonneratia caseolaris; SA: Sonneratia apetala; KO: Kandelia obovata; BG: Bruguiera gymnorrhiza; AC: Aegiceras corniculatum; AM: Avicennia marina.
Plants 14 01850 g003
Figure 4. The linear regression relationship between leaf stomatal conductance (gs, mmol m−2 s−1) and water potential (ψ, −Mpa) (a) and the range ratio of stomatal conductance (△gs, mmol m−2 s−1) and water potential (△ψ, Mpa) (b) of the six mangrove species. Different letters indicate significant differences among species (mean ± SD, n = 3). SC: Sonneratia caseolaris; SA: Sonneratia apetala; KO: Kandelia obovata; BG: Bruguiera gymnorrhiza; AC: Aegiceras corniculatum; AM: Avicennia marina.
Plants 14 01850 g004
Table 1. Symbols, descriptions, and units of measurement.
SymbolsDescriptionsUnits
Kxylem hydraulic conductivitykg m−1 s−1 Mpa−1
Kiniinitial xylem hydraulic conductivitykg m−1 s−1 Mpa−1
Kmaxmaximum xylem hydraulic conductivitykg m−1 s−1 Mpa−1
Pxxylem water potential corresponding to x% loss in hydraulic conductivityMpa
P12xylem water potential corresponding to 12% loss in hydraulic conductivityMpa
P50xylem water potential corresponding to 50% loss in hydraulic conductivityMpa
P88xylem water potential corresponding to 88% loss in hydraulic conductivityMpa
Sxslope of the hydraulic vulnerability curve at Px% Mpa−1
S12slope of the hydraulic vulnerability curve at P12% Mpa−1
S50slope of the hydraulic vulnerability curve at P50% Mpa−1
S88slope of the hydraulic vulnerability curve at P88% Mpa−1
ψleaf water potentialMpa
ψminminimum leaf water potentialMpa
ψrange from the minimum to the maximum leaf water potentialMpa
gsleaf stomatal conductancemmol m−2 s−1
gsrange from the minimum to the maximum leaf stomatal conductancemmol m−2 s−1
HSMhydraulic safety marginMpa
SLAspecific leaf areacm2 g−1
WDwood densityg cm−3
Table 2. Xylem water potential (Mpa) corresponding to hydraulic conductivity loss by 12% (P12), 50% (P50), and 88% (P88) and the slopes (% Mpa−1) of hydraulic vulnerability curves at P12 (S12), P50 (S50), and P88 (S88) for the six mangrove species. The 95% confidence intervals (CIs) for Px and Sx were estimated by the bootstrap resampling approach with replacement (N = 1000). Different letters indicate significant differences among species. SC: Sonneratia caseolaris; SA: Sonneratia apetala; KO: Kandelia obovata; BG: Bruguiera gymnorrhiza; AC: Aegiceras corniculatum; AM: Avicennia marina.
SpeciesP12 (Mpa) P50 (Mpa) P88 (Mpa) S12 (% Mpa−1) S50 (% Mpa−1) S88 (% Mpa−1)
SC−1.59 [−1.40, −1.77] a−3.64 [−3.46, −3.80] a−6.31 [−5.93, −6.59] a14.42 [13.90, 15.11] a19.34 [17.97, 21.74] a8.19 [7.31, 9.67] a
SA−1.87 [−1.69, −1.9] ab−4.10 [−3.94, −4.24] b−6.90 [−6.58, −7.20] a12.95 [12.56, 13.40] b18.17 [16.89, 19.67] ab7.93 [7.04, 8.93] a
KO−1.66 [−1.51, −1.83] a−4.22 [−4.06, −4.39] b−7.81 [−7.35, −8.29] b12.29 [11.85, 12.76] bc14.91 [13.67, 16.33] c5.91 [5.16, 6.85] b
BG−2.65 [−2.27, −3.16] c−5.47 [−5.09, −5.79] c−8.83 [−8.33, −9.34] c9.90 [9.47, 10.51] d14.79 [13.09, 17.05] bc6.73 [5.66, 8.38] ab
AC−1.62 [−1.47, −1.76] a−4.37 [−4.20, −4.51] b−8.49 [−8.07, −8.90] bc11.83 [11.45, 12.31] c13.36 [12.41, 14.40] c5.05 [4.50, 5.71] bc
AM−2.07 [−1.86, −2.34] bc−5.53 [−5.29, −5.79] c−10.59 [−10.11, −11.19] d9.34 [8.99, 9.77] d10.79 [9.91, 11.61] d4.14 [3.64, 4.77] c
Table 3. Diurnal leaf stomatal conductance (mmol m−2 s−1) of the six mangrove species. Different letters indicate significant differences among species (mean ± SD, n = 3). SC: Sonneratia caseolaris; SA: Sonneratia apetala; KO: Kandelia obovate; BG: Bruguiera gymnorrhiza; AC: Aegiceras corniculatum; AM: Avicennia marina.
Species/Time06:00–08:008:00–10:0010:00–13:0013:00–15:0015:00–17:00
SC228.93 ± 10.75 bc268.10 ± 12.21 ab213.33 ± 7.63 bc219.67 ± 5.85 a113.93 ± 12.21 a
SA213.57 ± 8.90 ab245.13 ± 7.60 a227.23 ± 16.07 c222.70 ± 28.38 a120.47 ± 17.00 a
KO208.67 ± 10.35 a276.27 ± 7.35 b167.43 ± 8.14 a230.27 ± 15.43 ab200.40 ± 5.36 b
BG233.13 ± 8.20 c263.90 ± 21.11 ab200.87 ± 13.66 b251.73 ± 10.92 b233.93 ± 30.05 c
AC261.87 ± 6.89 d350.23 ± 13.98 c297.80 ± 6.15 d308.30 ± 10.42 c245.63 ± 10.23 c
AM283.47 ± 9.30 e350.37 ± 16.61 c285.87 ± 9.49 d296.13 ± 10.73 c229.33 ± 10.45 c
Disclaimer/Publisher’s Note: The statements, opinions and data contained in all publications are solely those of the individual author(s) and contributor(s) and not of MDPI and/or the editor(s). MDPI and/or the editor(s) disclaim responsibility for any injury to people or property resulting from any ideas, methods, instructions or products referred to in the content.

