
Supercritical Fluid and Conventional Extractions of High Value-Added Compounds from Pomegranate Peels Waste: Production, Quantification and Antimicrobial Activity of Bioactive Constituents

 ,
,  , , ,
, , ,  and
and 
Abstract
:
1. Introduction
2. Results and Discussion
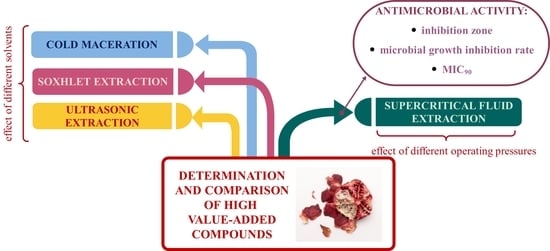
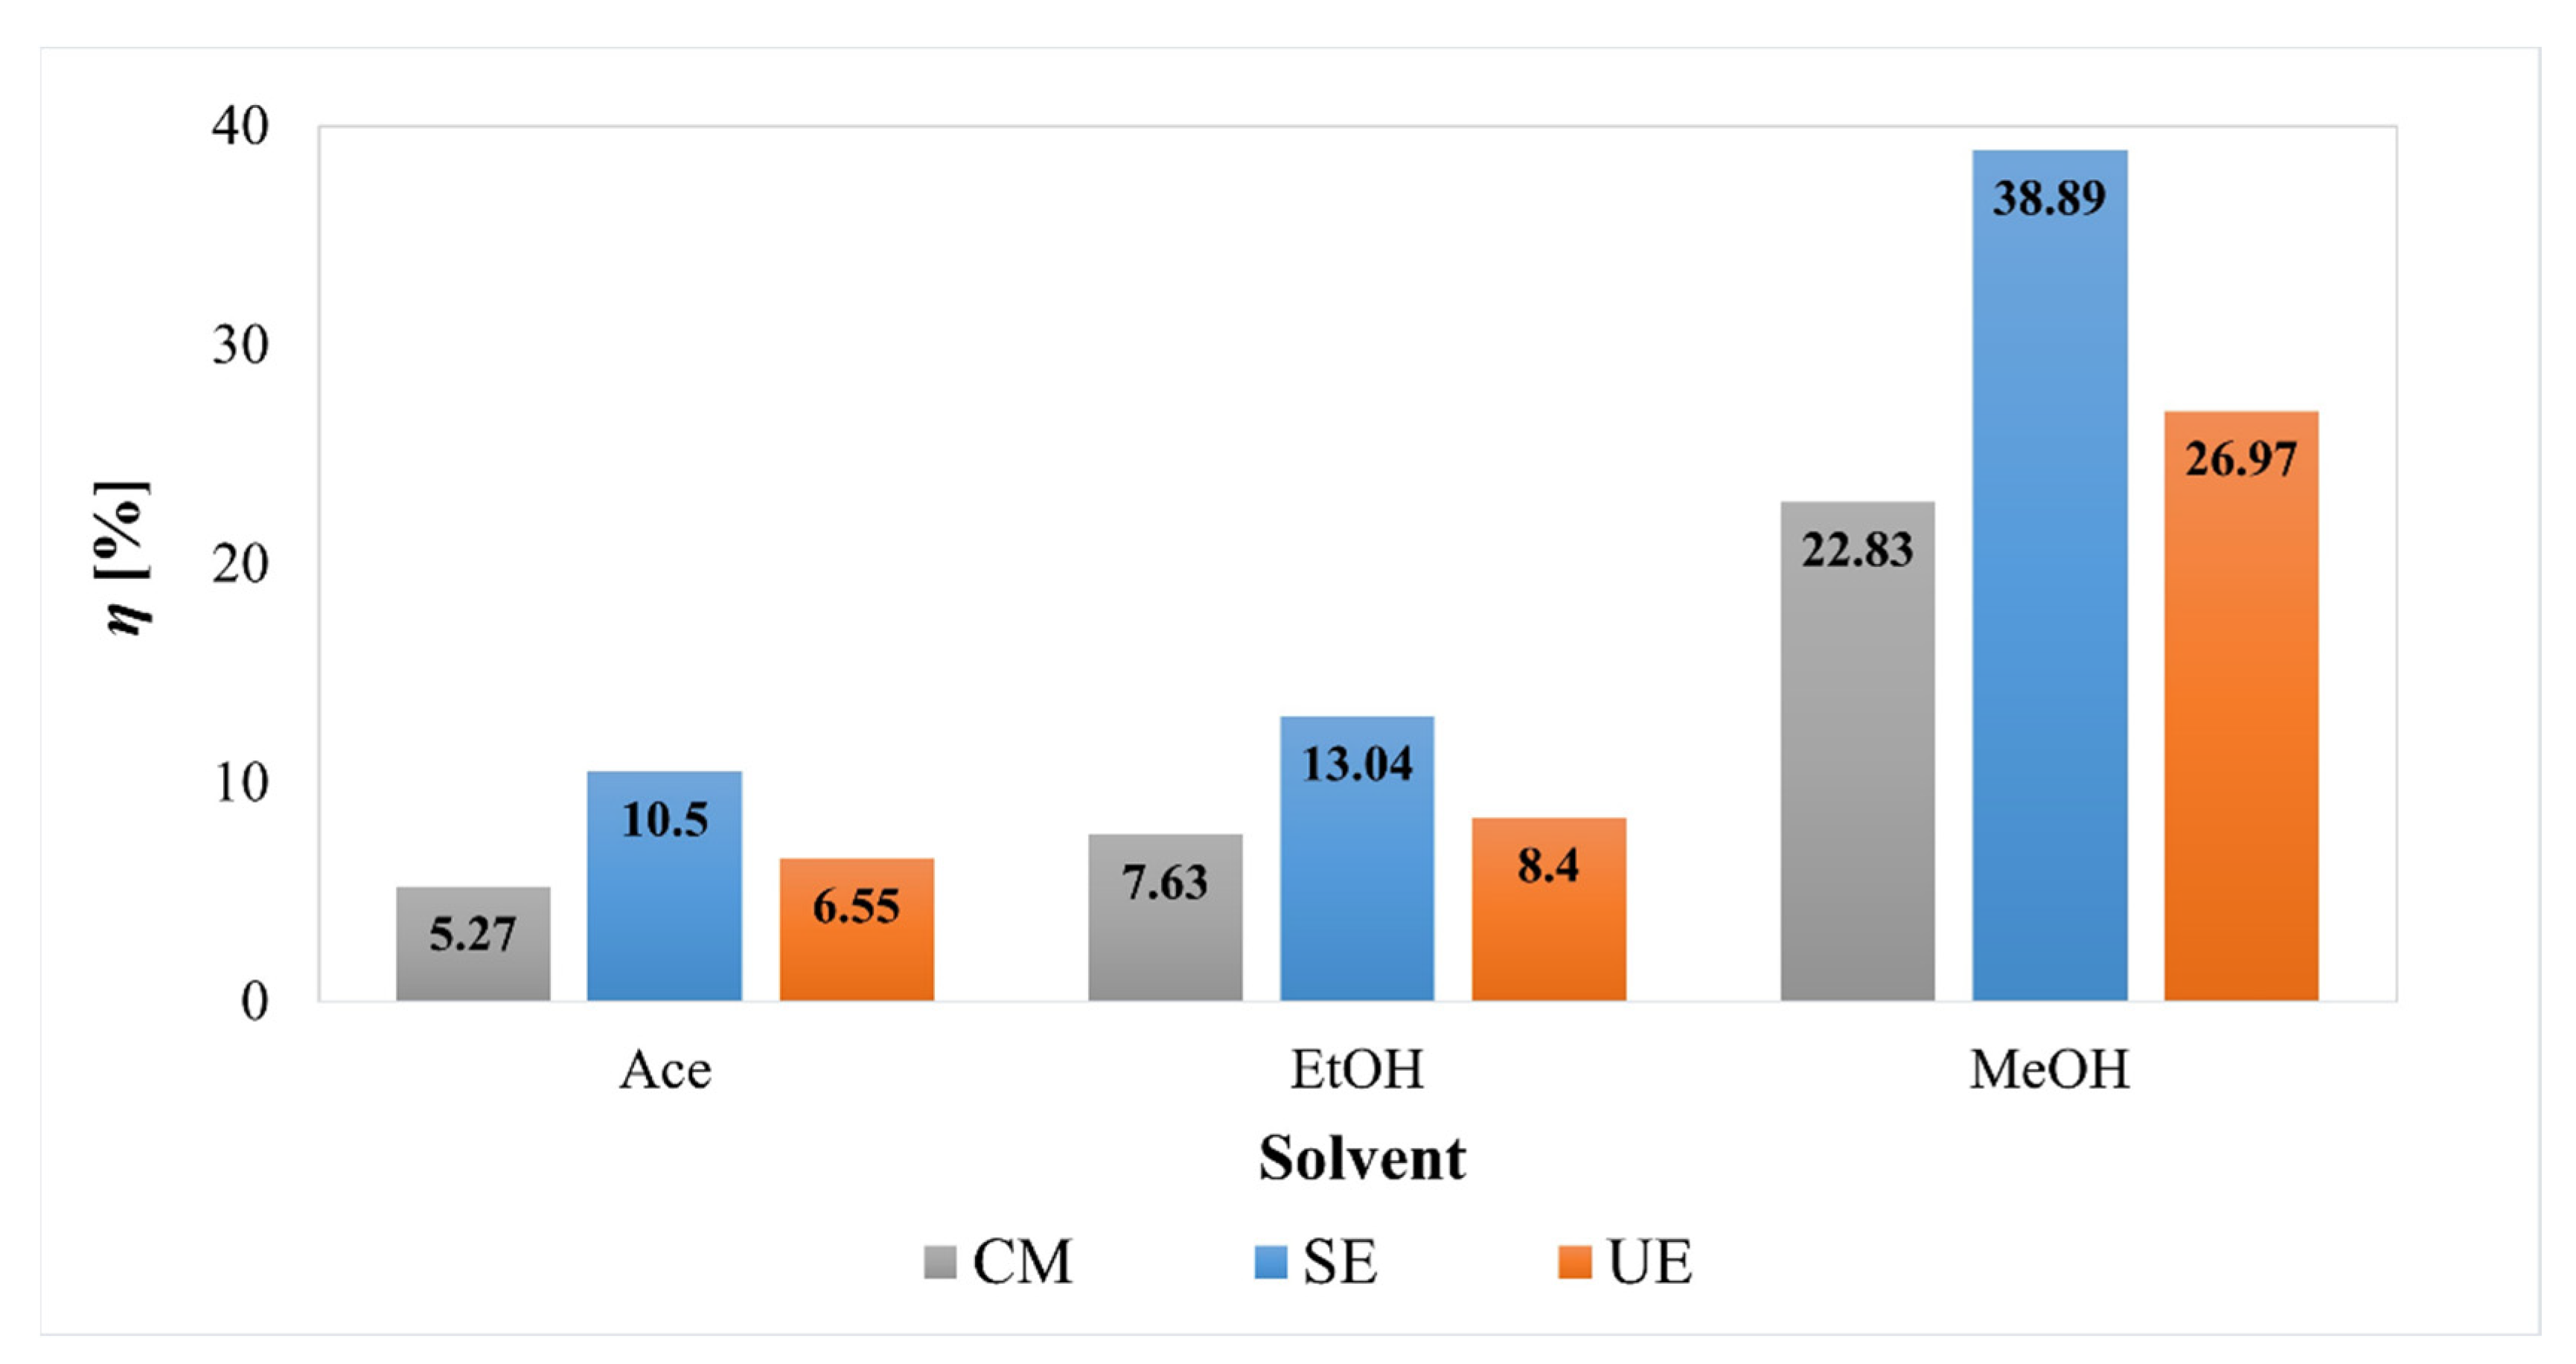
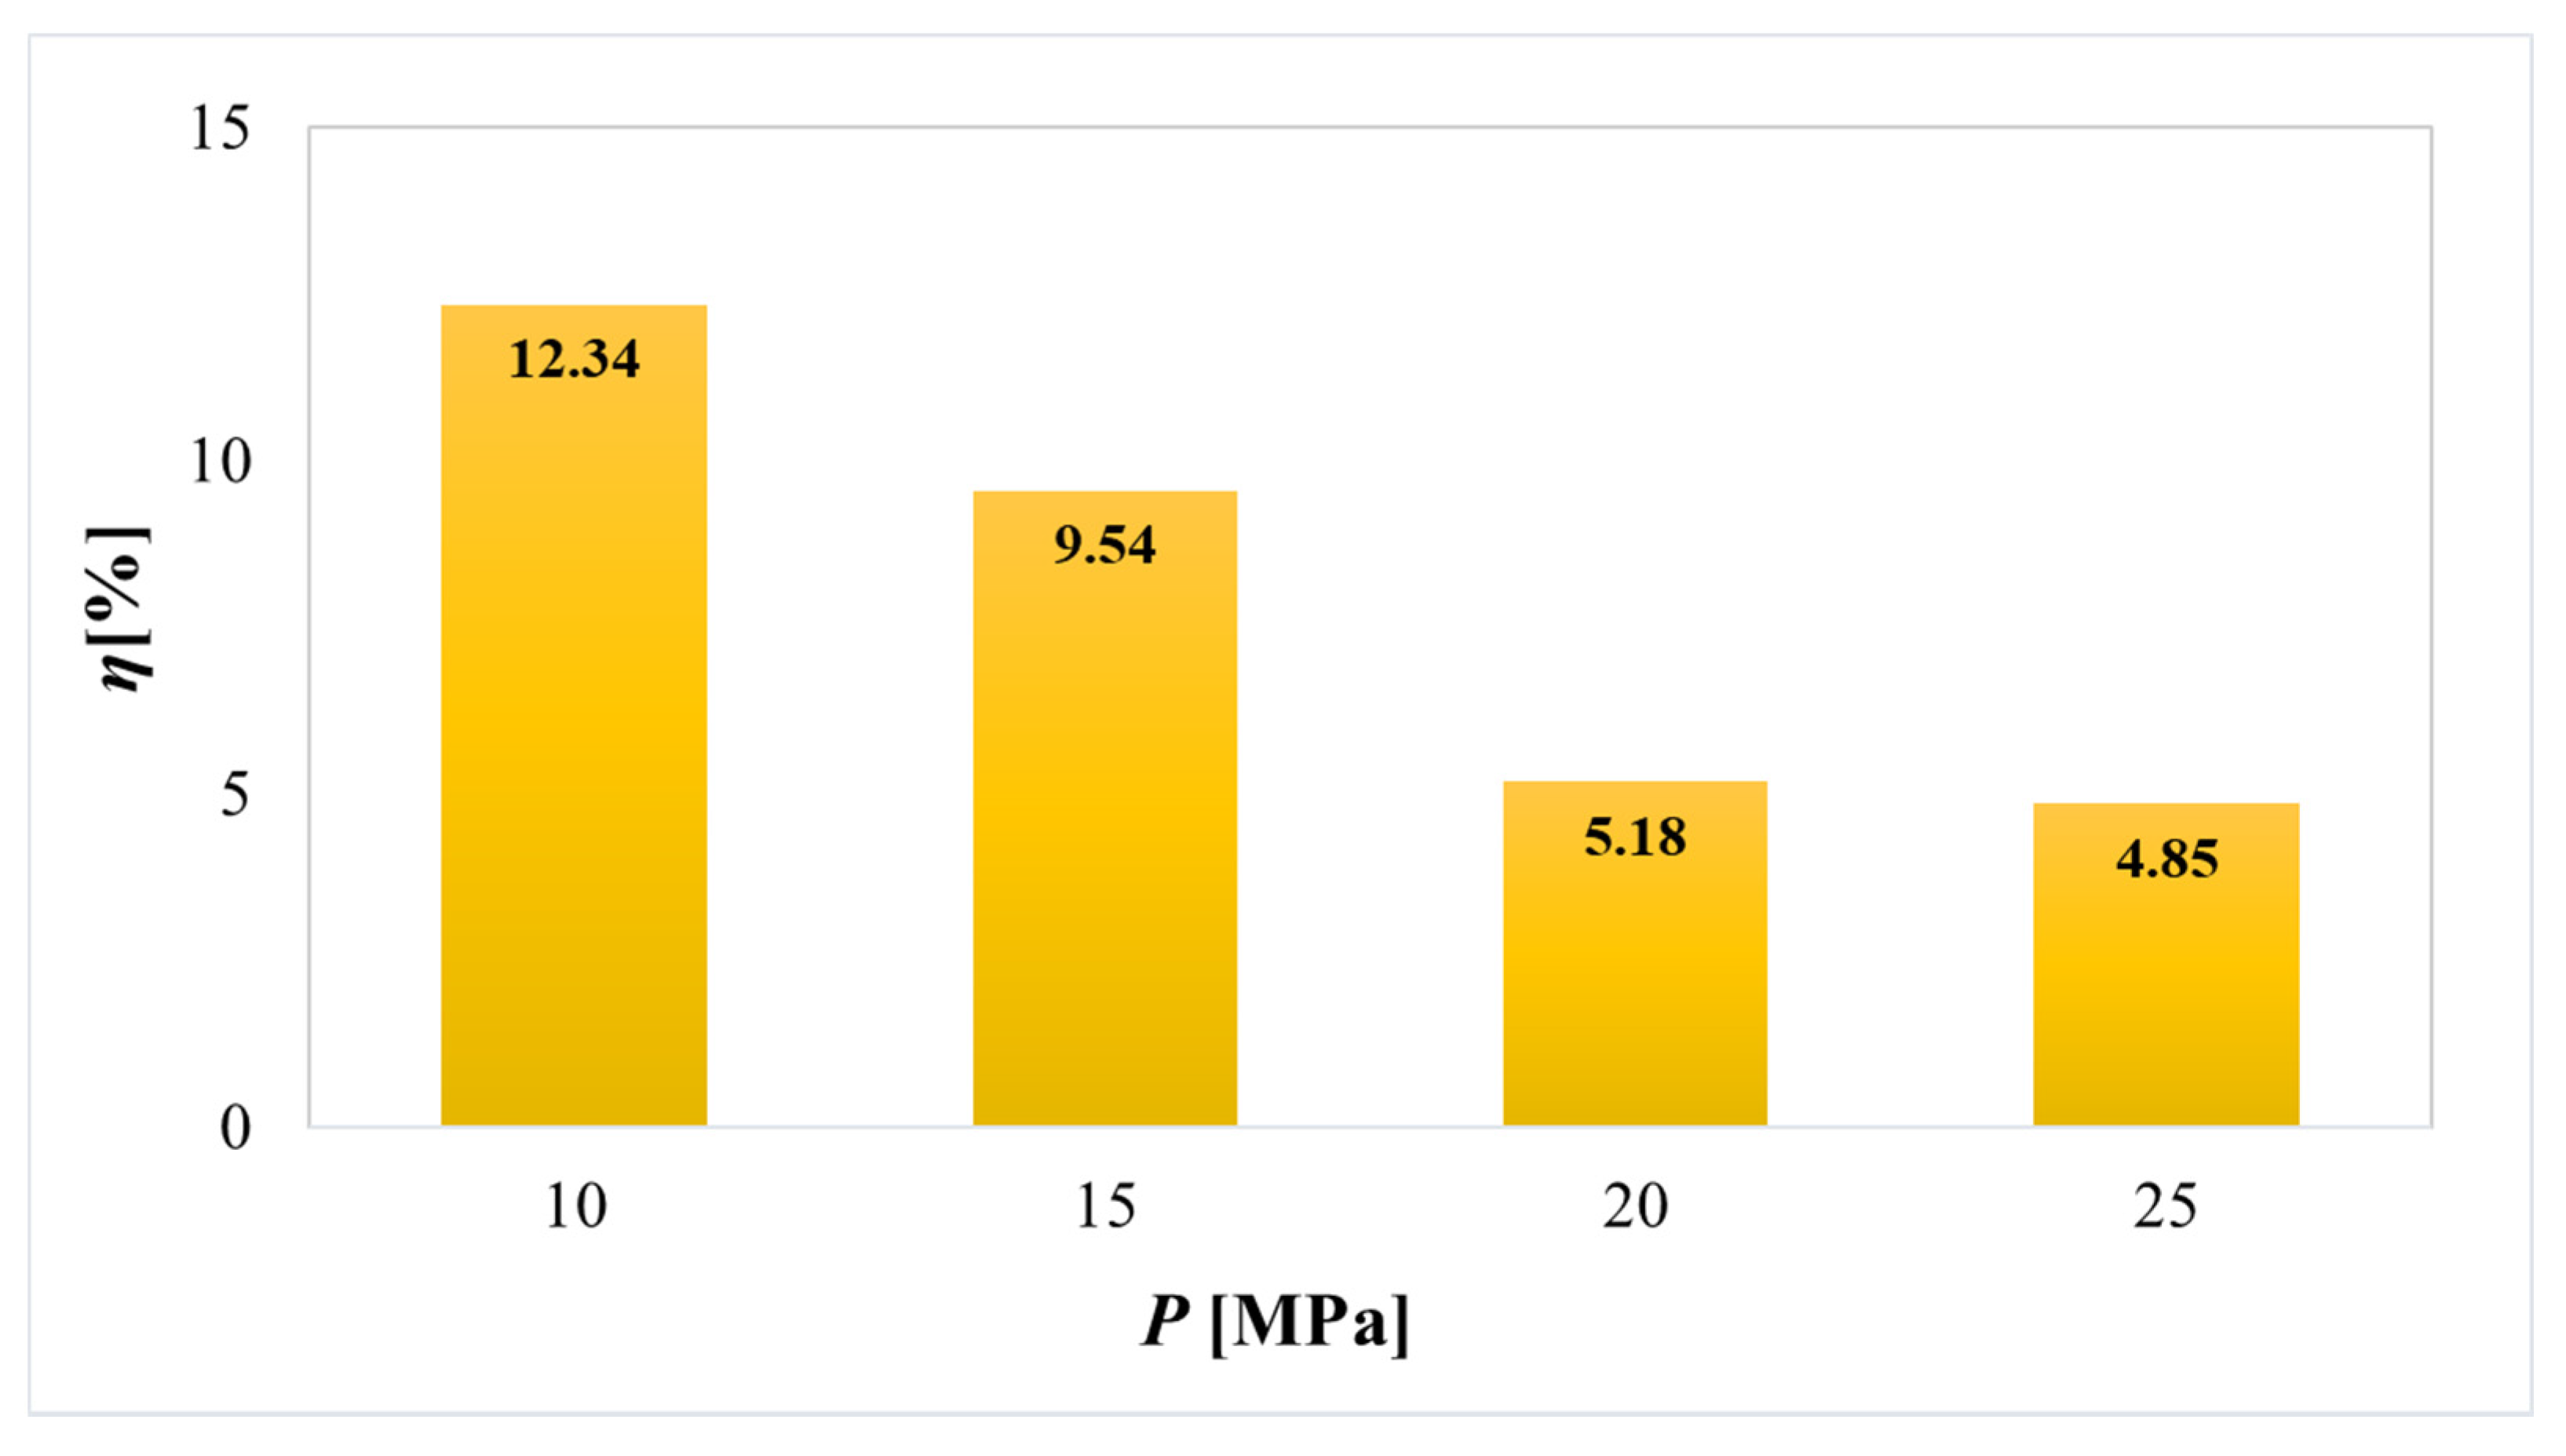
2.1. Effect of Extraction Methods and Changing Solvent/Pressure on the Extraction Yield
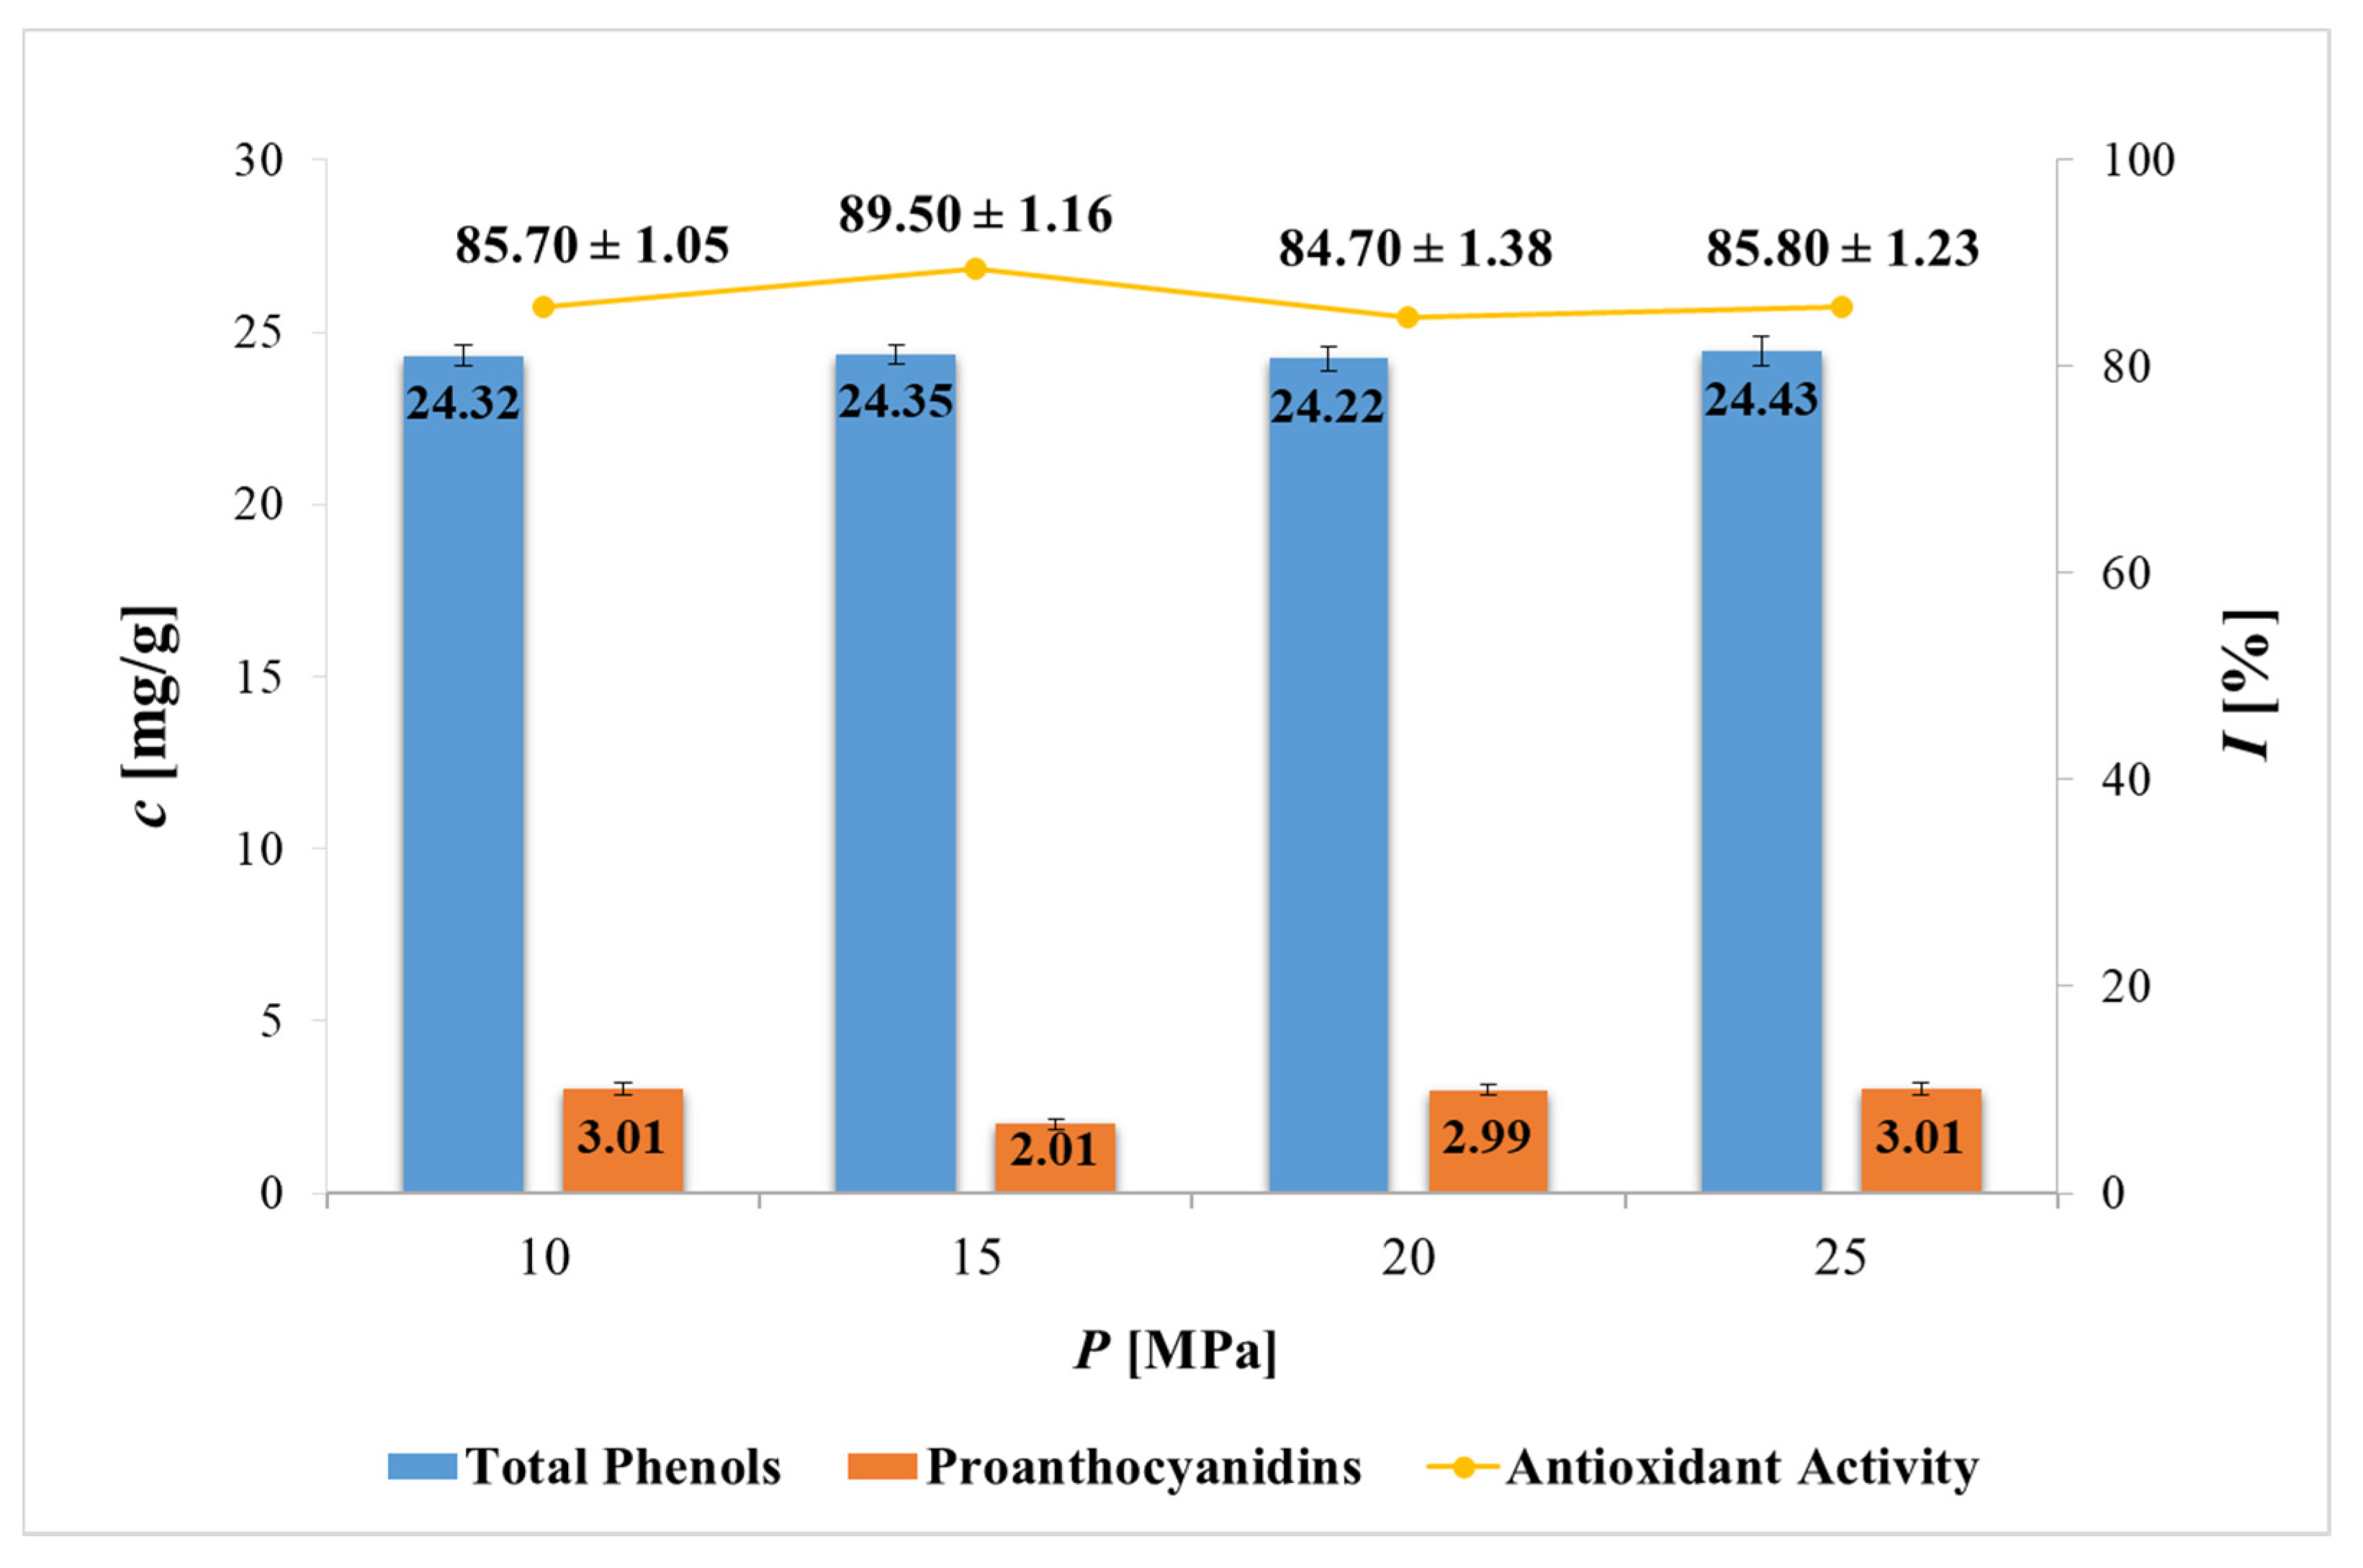
2.2. Content of Total Phenols, Proanthocyanidins and Antioxidant Activity of PP Extracts
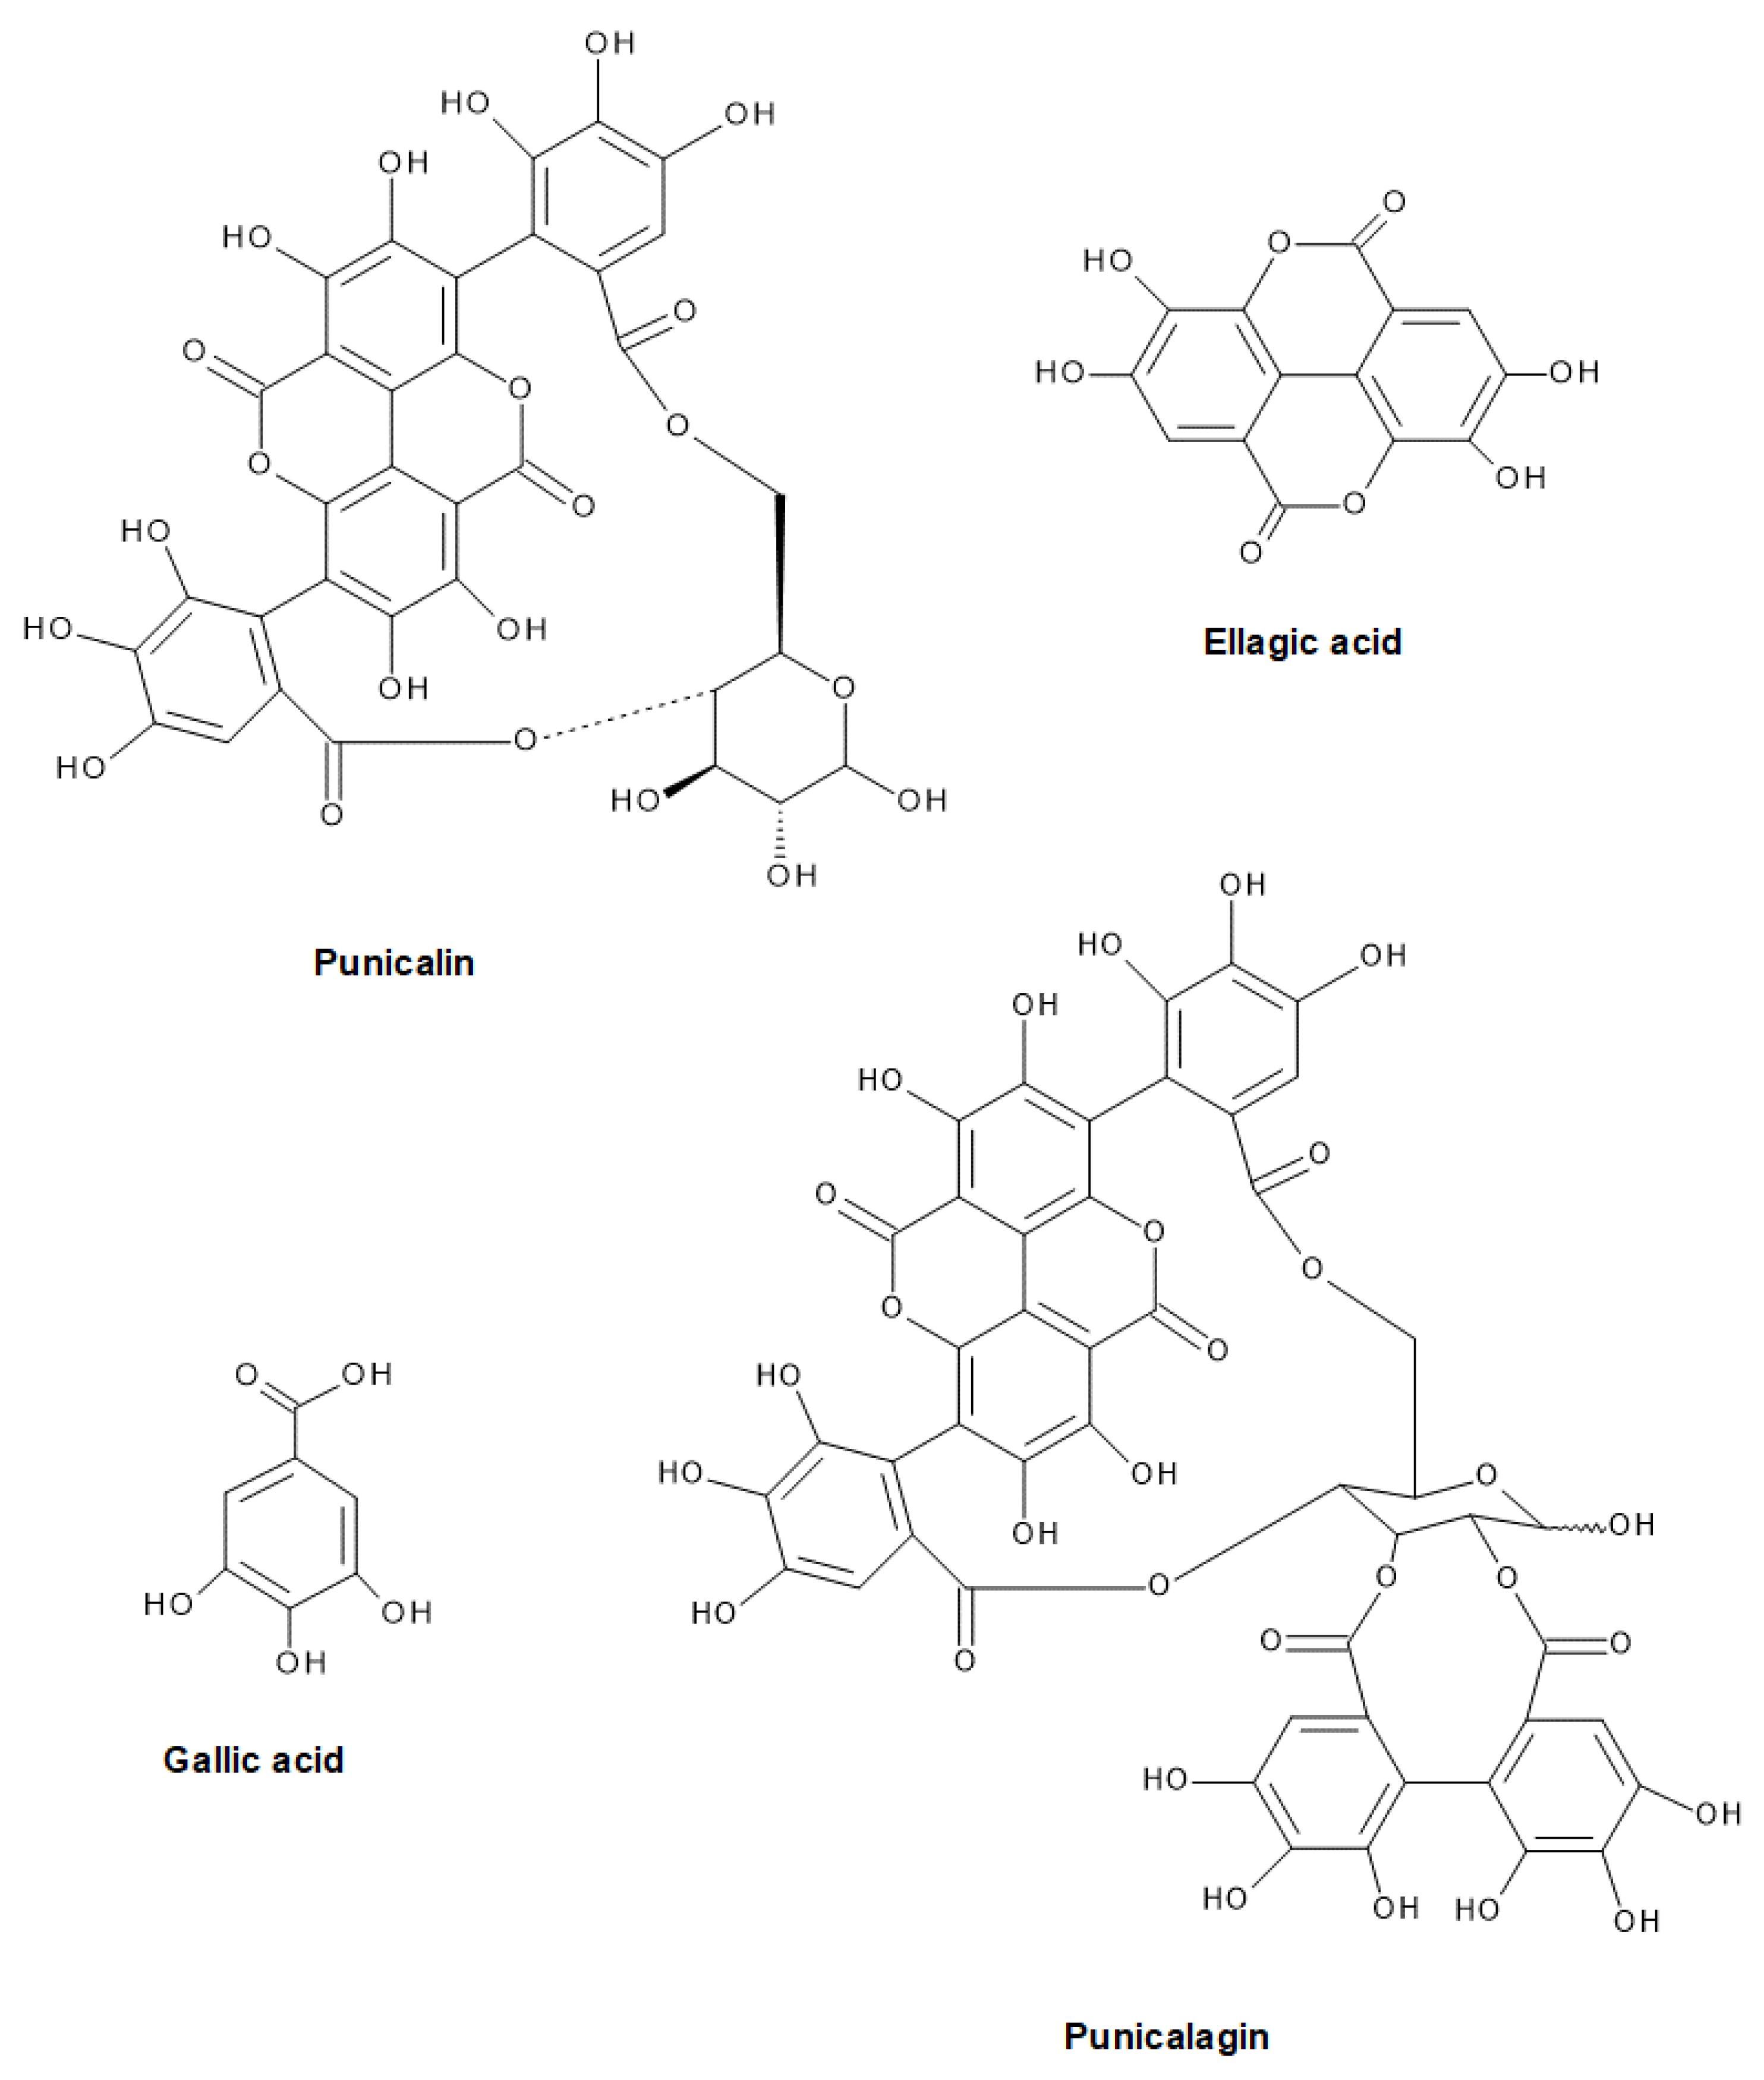
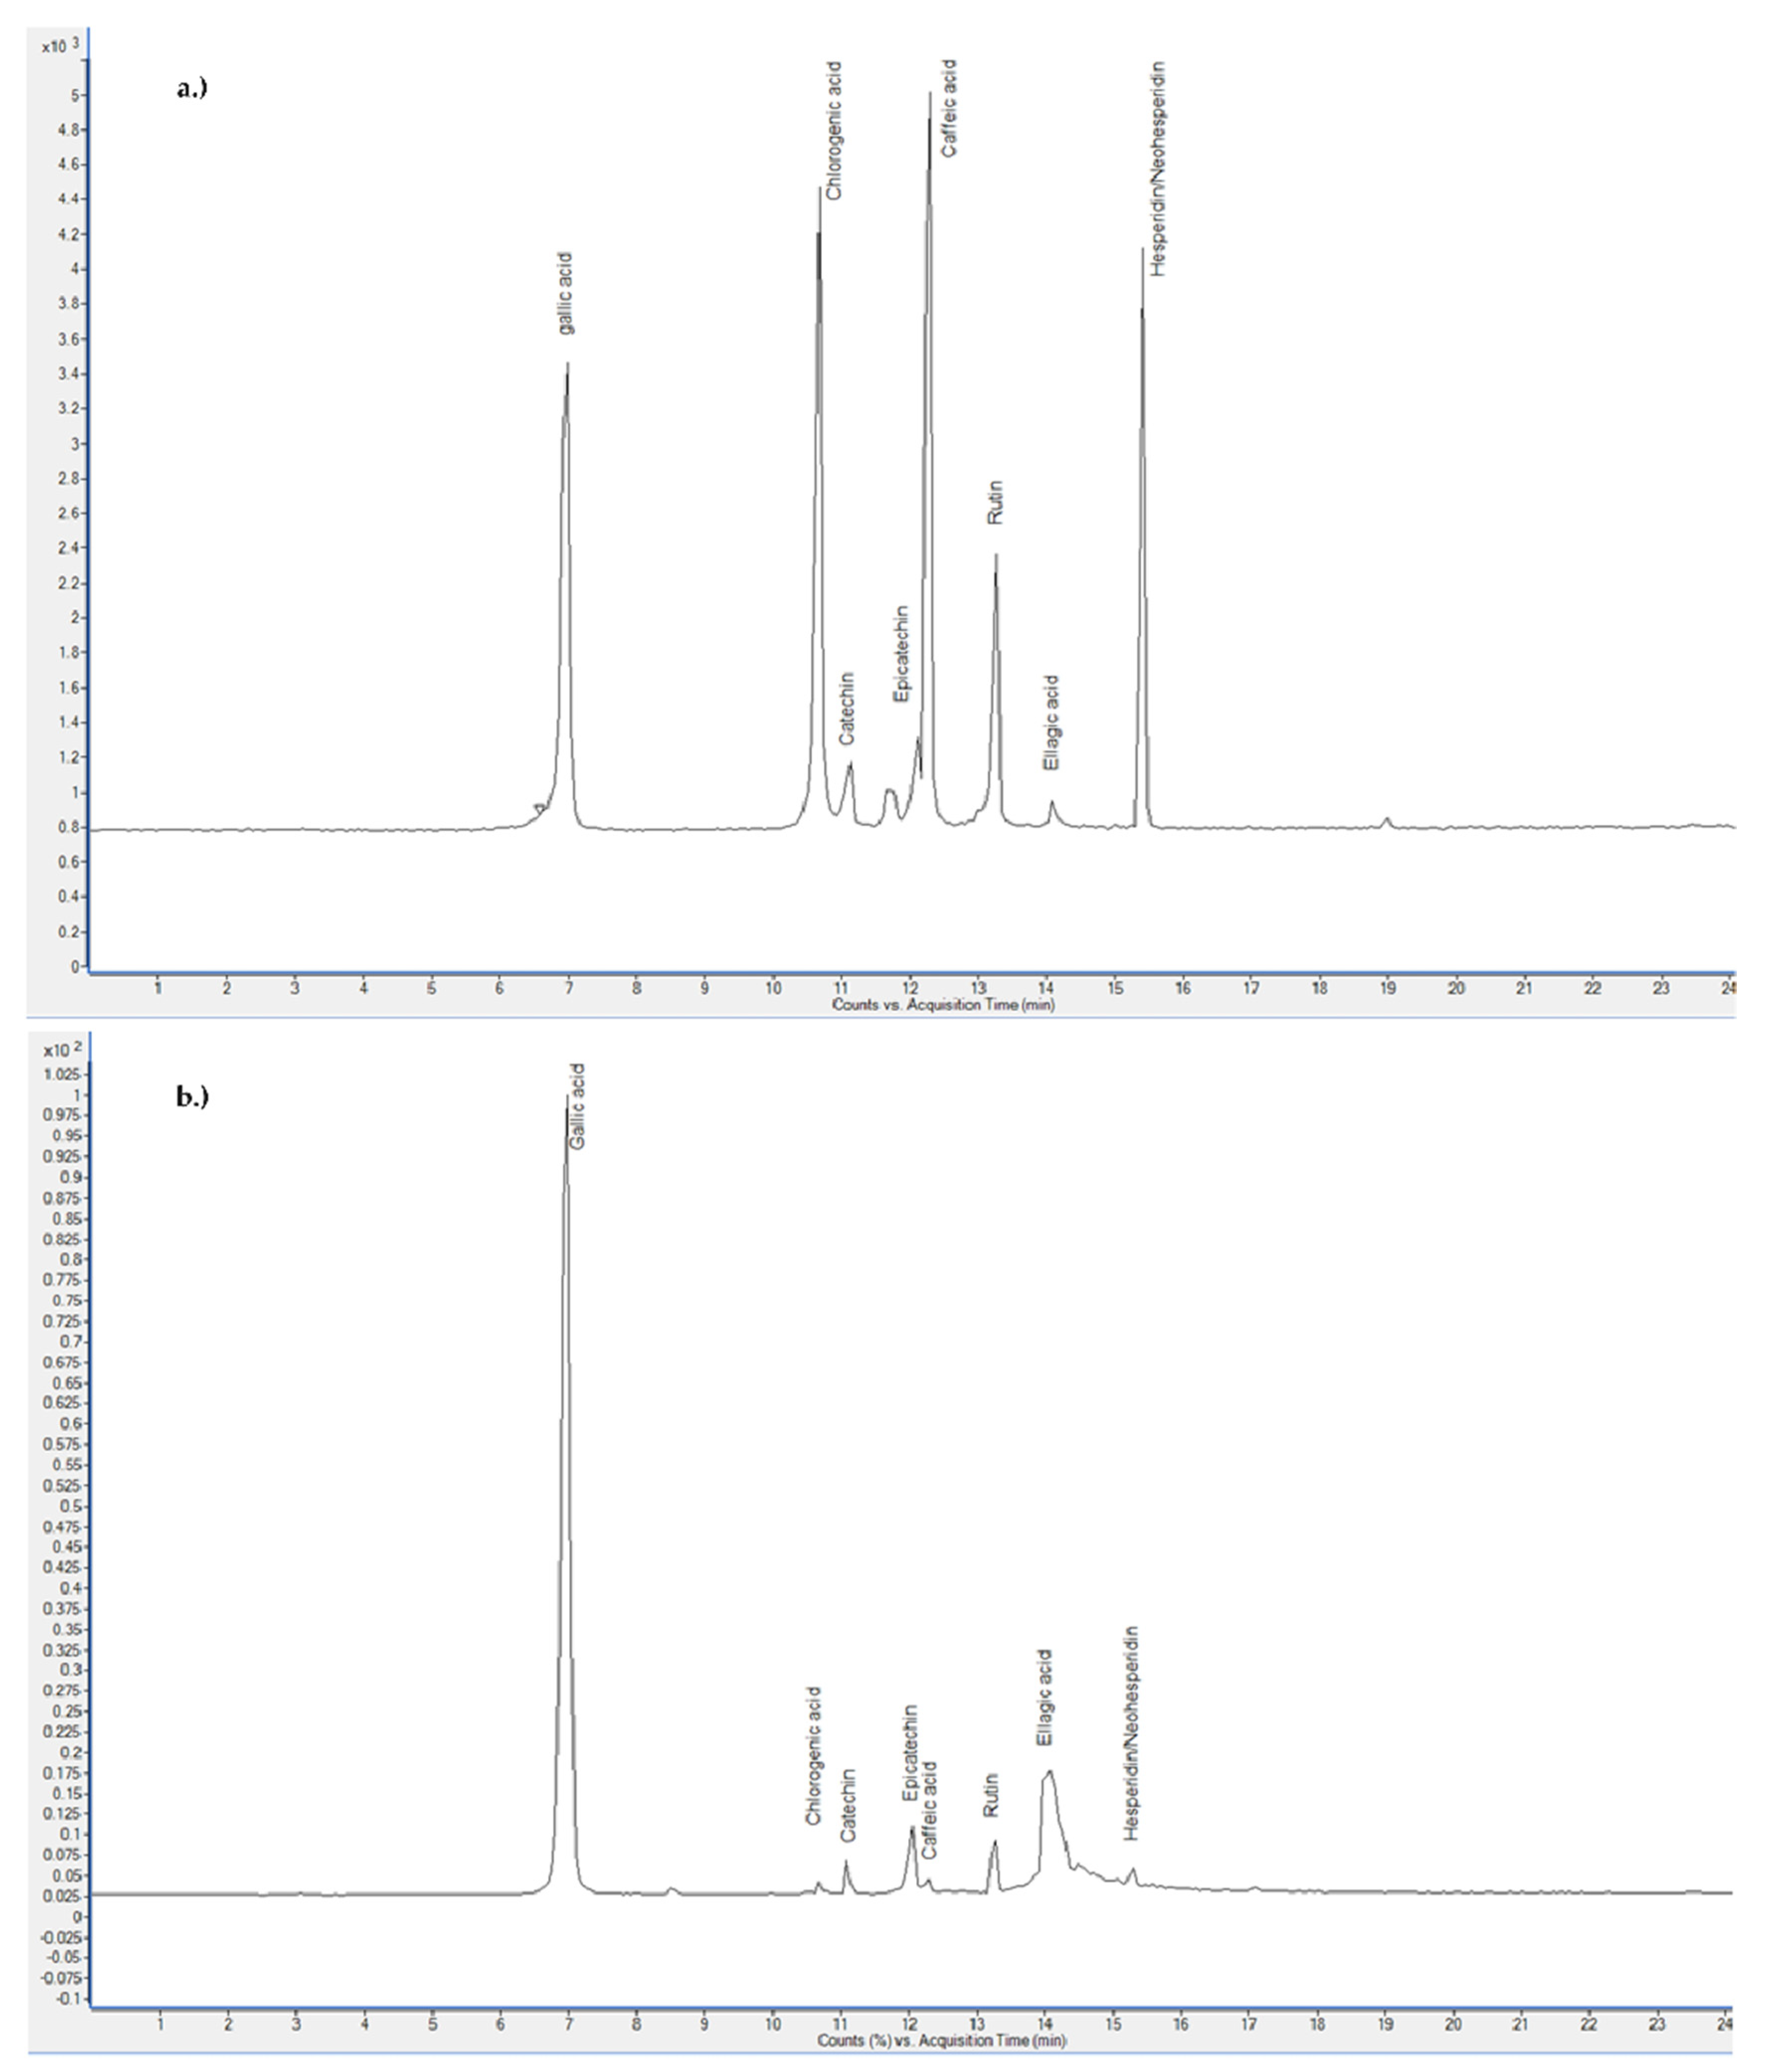
2.3. Content of Certain Flavonoids and Phenolic Acids in PP Extracts
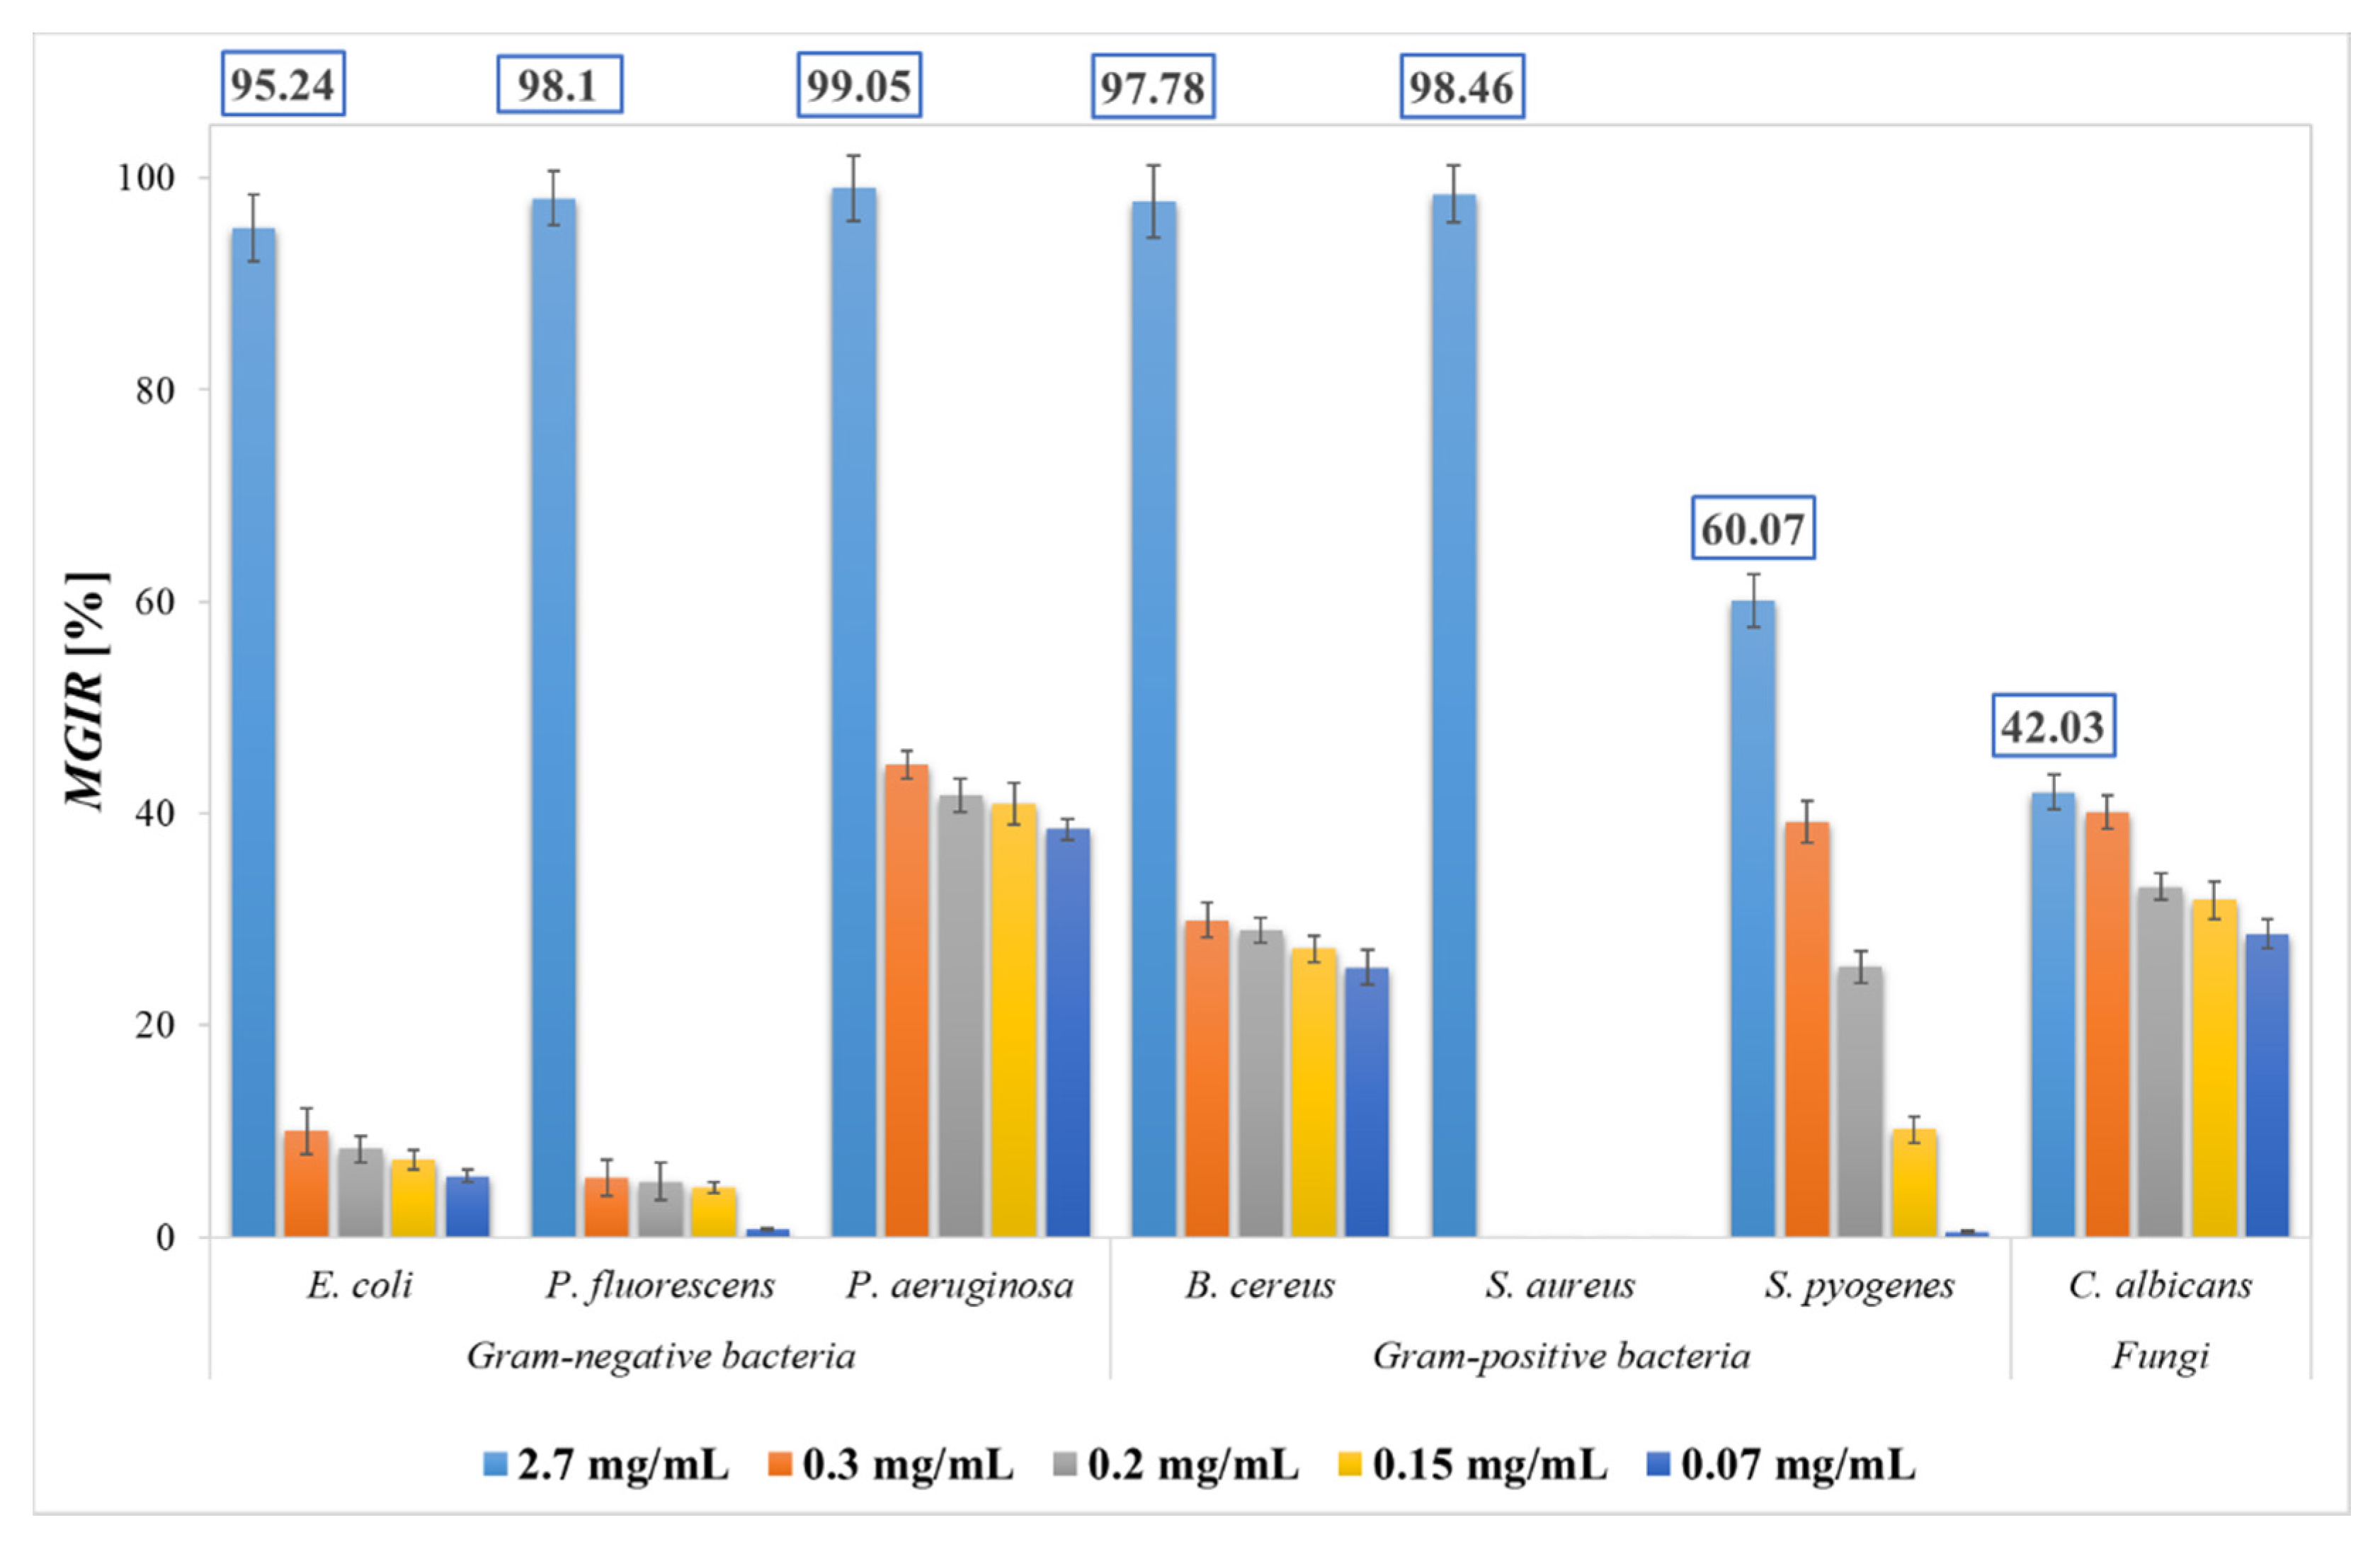
2.4. Antimicrobial Activity of SFE PP Extract
3. Materials and Methods
3.1. Materials
3.2. Extractions
3.3. Extraction Yield Determination
3.4. Determination of Total Phenols and Proanthocyanidins
3.5. Determination of Antioxidant Activity
3.6. Liquid Chromatography-Mass Spectrometry Analysis
3.7. Determination of Antimicrobial Activity
3.7.1. Disc Diffusion Method
3.7.2. Broth Microdilution Method
3.8. Statistical Analysis
4. Conclusions
Author Contributions
Funding
Data Availability Statement
Conflicts of Interest
References
- Campos, D.A.; Gómez-García, R.; Vilas-Boas, A.A.; Madureira, A.R.; Pintado, M.M. Management of Fruit Industrial By-Products—A Case Study on Circular Economy Approach. Molecules 2020, 25, 320. [Google Scholar] [CrossRef] [PubMed] [Green Version]
- Venkitasamy, C.; Zhao, L.; Zhang, R.; Pan, Z. Chapter 8—Pomegranate. In Integrated Processing Technologies for Food and Agricultural By-Products; Pan, Z., Zhang, R., Zicari, S., Eds.; Academic Press: Cambridge, MA, USA, 2019; pp. 181–216. ISBN 978-0-12-814138-0. [Google Scholar]
- Mourtzinos, I.; Goula, A. Chapter 2—Polyphenols in Agricultural Byproducts and Food Waste. In Polyphenols in Plants (Second Edition); Watson, R.R., Ed.; Academic Press: Cambridge, MA, USA, 2019; pp. 23–44. ISBN 978-0-12-813768-0. [Google Scholar]
- Bar-Ya’akov, I.; Tian, L.; Amir, R.; Holland, D. Primary Metabolites, Anthocyanins, and Hydrolyzable Tannins in the Pomegranate Fruit. Front. Plant Sci. 2019, 10, 620. [Google Scholar] [CrossRef] [PubMed] [Green Version]
- Li, J.; He, X.; Li, M.; Zhao, W.; Liu, L.; Kong, X. Chemical Fingerprint and Quantitative Analysis for Quality Control of Polyphenols Extracted from Pomegranate Peel by HPLC. Food Chem. 2015, 176, 7–11. [Google Scholar] [CrossRef] [PubMed]
- Gullón, P.; Astray, G.; Gullón, B.; Tomasevic, I.; Lorenzo, J.M. Pomegranate Peel as Suitable Source of High-Added Value Bioactives: Tailored Functionalized Meat Products. Molecules 2020, 25, 2859. [Google Scholar] [CrossRef]
- El-Shamy, S.; Farag, M.A. Novel Trends in Extraction and Optimization Methods of Bioactives Recovery from Pomegranate Fruit Biowastes: Valorization Purposes for Industrial Applications. Food Chem. 2021, 365, 130465. [Google Scholar] [CrossRef]
- Brglez Mojzer, E.; Knez Hrnčič, M.; Škerget, M.; Knez, Ž.; Bren, U. Polyphenols: Extraction Methods, Antioxidative Action, Bioavailability and Anticarcinogenic Effects. Molecules 2016, 21, 901. [Google Scholar] [CrossRef]
- Hrnčič, M.K.; Cör, D.; Verboten, M.T.; Knez, Ž. Application of Supercritical and Subcritical Fluids in Food Processing. Food Qual. Saf. 2018, 2, 59–67. [Google Scholar] [CrossRef] [Green Version]
- Pimentel-Moral, S.; Cádiz-Gurrea, M.d.l.L.; Rodríguez-Pérez, C.; Segura-Carretero, A. 7—Recent Advances in Extraction Technologies of Phytochemicals Applied for the Revaluation of Agri-Food by-Products. In Functional and Preservative Properties of Phytochemicals; Prakash, B., Ed.; Academic Press: Cambridge, MA, USA, 2020; pp. 209–239. ISBN 978-0-12-818593-3. [Google Scholar]
- Herrero, M.; Cifuentes, A.; Ibañez, E. Sub- and Supercritical Fluid Extraction of Functional Ingredients from Different Natural Sources: Plants, Food-by-Products, Algae and Microalgae: A Review. Food Chem. 2006, 98, 136–148. [Google Scholar] [CrossRef] [Green Version]
- Singh, B.; Singh, J.P.; Kaur, A.; Singh, N. Antimicrobial Potential of Pomegranate Peel: A Review. Int. J. Food Sci. Technol. 2019, 54, 959–965. [Google Scholar] [CrossRef]
- Akhtar, S.; Ismail, T.; Fraternale, D.; Sestili, P. Pomegranate Peel and Peel Extracts: Chemistry and Food Features. Food Chem. 2015, 174, 417–425. [Google Scholar] [CrossRef]
- Iqbal, S.; Haleem, S.; Akhtar, M.; Zia-ul-Haq, M.; Akbar, J. Efficiency of Pomegranate Peel Extracts in Stabilization of Sunflower Oil under Accelerated Conditions. Food Res. Int. 2008, 41, 194–200. [Google Scholar] [CrossRef]
- Wang, Z.; Pan, Z.; Ma, H.; Atungulu, G.G. Extract of Phenolics From Pomegranate Peels. Open Food Sci. J. 2011, 5, 17–25. [Google Scholar] [CrossRef]
- Torres-Valenzuela, L.S.; Ballesteros-Gómez, A.; Rubio, S. Green Solvents for the Extraction of High Added-Value Compounds from Agri-Food Waste. Food Eng. Rev. 2020, 12, 83–100. [Google Scholar] [CrossRef]
- Mushtaq, M.; Sultana, B.; Anwar, F.; Adnan, A.; Rizvi, S.S.H. Enzyme-Assisted Supercritical Fluid Extraction of Phenolic Antioxidants from Pomegranate Peel. J. Supercrit. Fluids 2015, 104, 122–131. [Google Scholar] [CrossRef]
- Bustamante, A.; Hinojosa, A.; Robert, P.; Escalona, V. Extraction and Microencapsulation of Bioactive Compounds from Pomegranate (Punica Granatum Var. Wonderful) Residues. Int. J. Food Sci. Technol. 2017, 52, 1452–1462. [Google Scholar] [CrossRef]
- Rivas, M.Á.; Casquete, R.; de Guía Córdoba, M.; Benito, M.J.; Hernández, A.; Ruiz-Moyano, S.; Martín, A. Functional Properties of Extracts and Residual Dietary Fibre from Pomegranate (Punica Granatum L.) Peel Obtained with Different Supercritical Fluid Conditions. LWT 2021, 145, 111305. [Google Scholar] [CrossRef]
- Ara, K.M.; Raofie, F. Application of Response Surface Methodology for the Optimization of Supercritical Fluid Extraction of Essential Oil from Pomegranate (Punica Granatum L.) Peel. J. Food Sci. Technol. 2016, 53, 3113–3121. [Google Scholar] [CrossRef] [Green Version]
- Sharmin, T.; Ahmed, N.; Hossain, A.; Hosain, M.M.; Mondal, S.C.; Haque, M.R.; Almas, M.; Siddik, M.A.B. Extraction of Bioactive Compound from Some Fruits and Vegetables (Pomegranate Peel, Carrot and Tomato). Am. J. Food Nutr. 2016, 4, 8–19. [Google Scholar] [CrossRef]
- Ranjha, M.M.A.N.; Amjad, S.; Ashraf, S.; Khawar, L.; Safdar, M.N.; Jabbar, S.; Nadeem, M.; Mahmood, S.; Murtaza, M.A. Extraction of Polyphenols from Apple and Pomegranate Peels Employing Different Extraction Techniques for the Development of Functional Date Bars. Int. J. Fruit Sci. 2020, 20, S1201–S1221. [Google Scholar] [CrossRef]
- Manapure, N.V.; Naik, R.M.; Satbhai, R.D.; Mohite, S.G. Evaluation of Antioxidant Activity of Solvent Extracted Pomegranate Peel and Its Effect against Plant Pathogenic Bacteria and Fungi. J. Pure Appl. Microbiol. 2015, 9, 1081–1089. [Google Scholar]
- Padmaja, A.; Prasad, N.B.L. Pomegranate (Punica Granatum L.) Peel Extract as a Source of Natural Antioxidant. J. Food Sci. Eng. 2011, 1, 171–182. [Google Scholar]
- Fawole, O.A.; Makunga, N.P.; Opara, U.L. Antibacterial, Antioxidant and Tyrosinase-Inhibition Activities of Pomegranate Fruit Peel Methanolic Extract. BMC Complement. Altern. Med. 2012, 12, 200. [Google Scholar] [CrossRef] [PubMed] [Green Version]
- Živković, J.; Šavikin, K.; Janković, T.; Ćujić, N.; Menković, N. Optimization of Ultrasound-Assisted Extraction of Polyphenolic Compounds from Pomegranate Peel Using Response Surface Methodology. Sep. Purif. Technol. 2018, 194, 40–47. [Google Scholar] [CrossRef]
- Ali, U.; Kumar, P. Effect of Soxhlet and Ultrasound Assisted Extraction on Antioxidant Activity of Pomegranate Peel Extract. Int. J. Food Nutr. Sci. 2014, 3, 265. [Google Scholar]
- Yasoubi, P.; Barzegar, M.; Sahari, M.A.; Azizi, M. Total Phenolic Contents and Antioxidant Activity of Pomegranate (Punica Granatum L.) Peel Extracts. J. Agric. Sci. Technol. 2010, 9, 35–42. [Google Scholar]
- Benslimane, S.; Rebai, O.; Djibaoui, R.; Arabi, A. Pomegranate Peel Extract Activities as Antioxidant and Antibiofilm against Bacteria Isolated from Caries and Supragingival Plaque. Jordan J. Biol. Sci. 2020, 13, 10. [Google Scholar]
- Kupnik, K.; Primožič, M.; Vasić, K.; Knez, Ž.; Leitgeb, M. A Comprehensive Study of the Antibacterial Activity of Bioactive Juice and Extracts from Pomegranate (Punica Granatum L.) Peels and Seeds. Plants 2021, 10, 1554. [Google Scholar] [CrossRef]
- Kumar, N.; Neeraj, D. Study on Physico-Chemical and Antioxidant Properties of Pomegranate Peel. J. Pharmacogn. Phytochem. 2018, 7, 2141–2147. [Google Scholar]
- Sharayei, P.; Azarpazhooh, E.; Zomorodi, S.; Ramaswamy, H.S. Ultrasound Assisted Extraction of Bioactive Compounds from Pomegranate (Punica Granatum L.) Peel. LWT 2019, 101, 342–350. [Google Scholar] [CrossRef]
- Rosas-Burgos, E.C.; Burgos-Hernández, A.; Noguera-Artiaga, L.; Kačániová, M.; Hernández-García, F.; Cárdenas-López, J.L.; Carbonell-Barrachina, Á.A. Antimicrobial Activity of Pomegranate Peel Extracts as Affected by Cultivar. J. Sci. Food Agric. 2017, 97, 802–810. [Google Scholar] [CrossRef]
- Russo, M.; Fanali, C.; Tripodo, G.; Dugo, P.; Muleo, R.; Dugo, L.; De Gara, L.; Mondello, L. Analysis of Phenolic Compounds in Different Parts of Pomegranate (Punica Granatum) Fruit by HPLC-PDA-ESI/MS and Evaluation of Their Antioxidant Activity: Application to Different Italian Varieties. Anal Bioanal. Chem. 2018, 410, 3507–3520. [Google Scholar] [CrossRef] [PubMed]
- Fischer, U.A.; Carle, R.; Kammerer, D.R. Identification and Quantification of Phenolic Compounds from Pomegranate (Punica Granatum L.) Peel, Mesocarp, Aril and Differently Produced Juices by HPLC-DAD–ESI/MSn. Food Chem. 2011, 127, 807–821. [Google Scholar] [CrossRef] [PubMed]
- Ruslan, M.S.H.; Idham, Z.; Nian Yian, L.; Ahmad Zaini, M.A.; Che Yunus, M.A. Effect of Operating Conditions on Catechin Extraction from Betel Nuts Using Supercritical CO2-Methanol Extraction. Sep. Sci. Technol. 2018, 53, 662–670. [Google Scholar] [CrossRef]
- Putra, N.R.; Rizkiyah, D.N.; Zaini, A.S.; Machmudah, S.; Yunus, M.A.C. Solubility of Catechin and Epicatechin from Arachis Hypogea Skins Wastes by Using Supercritical Carbon Dioxide-Ethanol and Its Optimization. Food Meas. 2021, 15, 2031–2038. [Google Scholar] [CrossRef]
- Žitek, T.; Leitgeb, M.; Golle, A.; Dariš, B.; Knez, Ž.; Knez Hrnčič, M. The Influence of Hemp Extract in Combination with Ginger on the Metabolic Activity of Metastatic Cells and Microorganisms. Molecules 2020, 25, 4992. [Google Scholar] [CrossRef]
- Talmaciu, A.I.; Ravber, M.; Volf, I.; Knez, Ž.; Popa, V.I. Isolation of Bioactive Compounds from Spruce Bark Waste Using Sub- and Supercritical Fluids. J. Supercrit. Fluids 2016, 117, 243–251. [Google Scholar] [CrossRef]
- Škerget, M.; Kotnik, P.; Hadolin, M.; Hraš, A.R.; Simonič, M.; Knez, Ž. Phenols, Proanthocyanidins, Flavones and Flavonols in Some Plant Materials and Their Antioxidant Activities. Food Chem. 2005, 89, 191–198. [Google Scholar] [CrossRef]
- Hrnčič, M.K.; Cör, D.; Kotnik, P.; Knez, Ž. Extracts of White and Red Grape Skin and Rosehip Fruit: Phenolic Compounds and Their Antioxidative Activity. Acta Chim. Slov. 2019, 66, 751–761. [Google Scholar] [CrossRef]
- Leitgeb, M.; Kupnik, K.; Knez, Ž.; Primožič, M. Enzymatic and Antimicrobial Activity of Biologically Active Samples from Aloe Arborescens and Aloe Barbadensis. Biology 2021, 10, 765. [Google Scholar] [CrossRef]
- Kupnik, K.; Primožič, M.; Knez, Ž.; Leitgeb, M. Antimicrobial Efficiency of Aloe Arborescens and Aloe Barbadensis Natural and Commercial Products. Plants 2021, 10, 92. [Google Scholar] [CrossRef]


| Extraction Method | Solvent | Total Phenols [mg GAE/g] | Proanthocyanidins [mg PAC/g] | Antioxidant Activity [% inhibition] |
|---|---|---|---|---|
| UE | MeOH | 25.92 ± 0.13 | 3.71 ± 0.08 | 91.92 ± 1.01 |
| EtOH | 25.41 ± 0.22 | 2.58 ± 0.04 | 90.12 ± 2.20 | |
| Ace | 24.50 ± 0.11 | 3.54 ± 0.02 | 90.50 ± 3.21 | |
| SE | MeOH | 40.55 ± 0.23 | 4.47 ± 0.06 | 93.33 ± 1.55 |
| EtOH | 40.33 ± 0.43 | 3.26 ± 0.02 | 91.50 ± 2.18 | |
| Ace | 39.26 ± 0.61 | 2.47 ± 0.03 | 91.08 ± 1.14 | |
| CM | MeOH | 42.92 ± 0.65 | 4.88 ± 0.07 | 94.35 ± 1.31 |
| EtOH | 40.89 ± 0.81 | 5.37 ± 0.02 | 90.97 ± 1.24 | |
| Ace | 40.19 ± 0.41 | 5.82 ± 0.02 | 91.30 ± 1.52 |
| Content (μg/g ± SD) | UE | SE | CM | |||
|---|---|---|---|---|---|---|
| MeOH | EtOH | Ace | Ace | Ace | ||
| Flavonoids | Catechin | 169.37 ± 5.45 | 78.14 ± 2.69 | 121.73 ± 2.11 | 60.84 ± 2.79 | 246.73 ± 4.83 |
| Epicatechin | 989.13 ± 16.02 | 350.74 ± 5.55 | 510.01 ± 14.79 | 1594.62 ± 69.77 | 433.64 ± 12.90 | |
| Hesperidin/Neohesperidin | 8.85 ± 0.95 | 22.34 ± 1.05 | 44.76 ± 1.98 | 11.20 ± 0.68 | 41.51 ± 2.11 | |
| Rutin | 9.34 ± 0.56 | 23.65 ± 1.71 | 54.39 ± 2.44 | 8.25 ± 1.15 | 87.02 ± 5.80 | |
| Phenolic acids | Caffeic acid | 16.25 ± 1.59 | 12.24 ± 2.55 | 28.44 ± 1.63 | 20.33 ± 1.89 | 18.21 ± 2.00 |
| Chlorogenic acid | 1.33 ± 0.02 | 2.03 ± 0.03 | 5.53 ± 0.05 | 8.41 ± 0.10 | 2.37 ± 0.02 | |
| Ellagic acid | 4585.77 ± 222.12 | 4798.66 ± 198.25 | 6883.41 ± 111.89 | 6377.43 ± 291.11 | 5601.08 ± 211.87 | |
| Gallic acid | 4256.04 ± 187.45 | 1652.95 ± 52.49 | 2656.32 ± 105.30 | 3396.03 ± 99.58 | 1018.71 ± 20.98 | |
| Total content of analyzed polyphenols | 10036.08 ± 434.16 | 6940.74 ± 264.32 | 10304.60 ± 240.19 | 11477.11 ± 467.07 | 7449.26 ± 260.51 | |
| Content (μg/g ± SD) | SFE | ||||
|---|---|---|---|---|---|
| 10 MPa | 15 MPa | 20 MPa | 25 MPa | ||
| Flavonoids | Catechin | 312.39 ± 10.52 | 366.57 ± 9.85 | 121.07 ± 6.87 | 138.33 ± 7.56 |
| Epicatechin | 618.56 ± 20.85 | 688.27 ± 19.25 | 718.75 ± 5.85 | 561.73 ± 11.59 | |
| Hesperidin/Neohesperidin | 9.13 ± 0.09 | 11.71 ± 0.50 | 62.02 ± 1.36 | 48.88 ± 2.10 | |
| Rutin | 8.90 ± 0.05 | 55.51 ± 1.23 | 87.85 ± 2.25 | 66.91 ± 2.81 | |
| Phenolic acids | Caffeic acid | 12.29 ± 0.19 | 10.76 ± 0.20 | 34.60 ± 0.59 | 16.41 ± 1.20 |
| Chlorogenic acid | 3.06 ± 0.03 | 3.61 ± 0.03 | 12.92 ± 0.05 | 3.39 ± 0.03 | |
| Ellagic acid | 4518.16 ± 157.36 | 4679.24 ± 209.85 | 7492.53 ± 345.25 | 4844.81 ± 221.58 | |
| Gallic acid | 1501.49 ± 100.90 | 1467.13 ± 59.36 | 3032.11 ± 128.47 | 1150.95 ± 62.58 | |
| Total content of analyzed polyphenols | 6983.99 ± 289.99 | 7282.80 ± 300.27 | 11561.84 ± 490.69 | 6831.41 ± 309.45 | |
| Microorganism | Inhibition Zone [mm] | |
|---|---|---|
| Gram-negative bacteria | E. coli | 18 ± 1 |
| P. fluorescens | 37 ± 2 | |
| P. aeruginosa | 31 ± 3 | |
| Gram-positive bacteria | B. cereus | 36 ± 2 |
| S. platensis | - | |
| S. aureus | 21 ± 1 | |
| S. pyogenes | 18 ± 1 | |
| Fungi | A. brasiliensis | - |
| A. flavus | 11 ± 1 | |
| A. fumigatus | - | |
| A. niger | - | |
| C. albicans | 18 ± 2 | |
| P. cyclopium | 11 ± 1 | |
| S. cerevisiae | - | |
| T. viride | 35 ± 2 | |
| Extraction Method | Solvent | Temperature [°C] | Solvent Volume [mL] | Time [min] |
|---|---|---|---|---|
| UE | MeOH | 45 | 150 | 180 |
| EtOH | ||||
| Ace | ||||
| SE | MeOH | 70 | 150 | 420 |
| EtOH | 80 | 360 | ||
| Ace | 70 | 300 | ||
| CM | MeOH | room | 150 | 240 |
| EtOH | ||||
| Ace | ||||
| Pressure [MPa] | Temperature [°C] | Co-Solvent Volume [mL] | Time [min] | |
| SFE | 10 | 40 | 113 | 60 |
| 15 | 101 | 50 | ||
| 20 | 88 | 45 | ||
| 25 | 83 | 40 |
| Analyte | Rt (min) | Precursor Ion (m/z) | Product Ions (m/z) | CE (V) | Concentration Range (µg/mL) | LOQ (S/N ≥ 10) (µg/mL) |
|---|---|---|---|---|---|---|
| Gallic acid | 6.98 | 169 | 125, 119 | 12, 48 | 0.039–1.960 | 0.025 |
| Chlorogenic acid | 10.63 | 353 | 191 | 24 | 0.020–1.095 | 0.020 |
| Catechin | 11.11 | 289 | 245, 109 | 4, 16 | 0.020–0.965 | 0.020 |
| Epicatechin | 12.10 | 289 | 245, 109 | 4, 20 | 0.021–1.090 | 0.020 |
| Caffeic acid | 12.28 | 179 | 135, 107 | 16, 24 | 0.250–1.150 | 0.025 |
| Rutin | 13.33 | 609 | 300, 271 | 36, 45 | 0.019–0.970 | 0.010 |
| Ellagic acid | 14.16 | 301 | 145, 229.7 | 20, 36 | 0.190–0.965 | 0.050 |
| Hesperidin/neo | 15.40 | 609 | 301, 271 | 35, 40 | 0.017–0.878 | 0.010 |
Publisher’s Note: MDPI stays neutral with regard to jurisdictional claims in published maps and institutional affiliations. |
© 2022 by the authors. Licensee MDPI, Basel, Switzerland. This article is an open access article distributed under the terms and conditions of the Creative Commons Attribution (CC BY) license (https://creativecommons.org/licenses/by/4.0/).
Share and Cite
Kupnik, K.; Leitgeb, M.; Primožič, M.; Postružnik, V.; Kotnik, P.; Kučuk, N.; Knez, Ž.; Marevci, M.K. Supercritical Fluid and Conventional Extractions of High Value-Added Compounds from Pomegranate Peels Waste: Production, Quantification and Antimicrobial Activity of Bioactive Constituents. Plants 2022, 11, 928. https://doi.org/10.3390/plants11070928
Kupnik K, Leitgeb M, Primožič M, Postružnik V, Kotnik P, Kučuk N, Knez Ž, Marevci MK. Supercritical Fluid and Conventional Extractions of High Value-Added Compounds from Pomegranate Peels Waste: Production, Quantification and Antimicrobial Activity of Bioactive Constituents. Plants. 2022; 11(7):928. https://doi.org/10.3390/plants11070928
Chicago/Turabian StyleKupnik, Kaja, Maja Leitgeb, Mateja Primožič, Vesna Postružnik, Petra Kotnik, Nika Kučuk, Željko Knez, and Maša Knez Marevci. 2022. "Supercritical Fluid and Conventional Extractions of High Value-Added Compounds from Pomegranate Peels Waste: Production, Quantification and Antimicrobial Activity of Bioactive Constituents" Plants 11, no. 7: 928. https://doi.org/10.3390/plants11070928
APA StyleKupnik, K., Leitgeb, M., Primožič, M., Postružnik, V., Kotnik, P., Kučuk, N., Knez, Ž., & Marevci, M. K. (2022). Supercritical Fluid and Conventional Extractions of High Value-Added Compounds from Pomegranate Peels Waste: Production, Quantification and Antimicrobial Activity of Bioactive Constituents. Plants, 11(7), 928. https://doi.org/10.3390/plants11070928