
Salinity and Salt-Priming Impact on Growth, Photosynthetic Performance, and Nutritional Quality of Edible Mesembryanthemum crystallinum L.


Abstract
:1. Introduction
2. Results
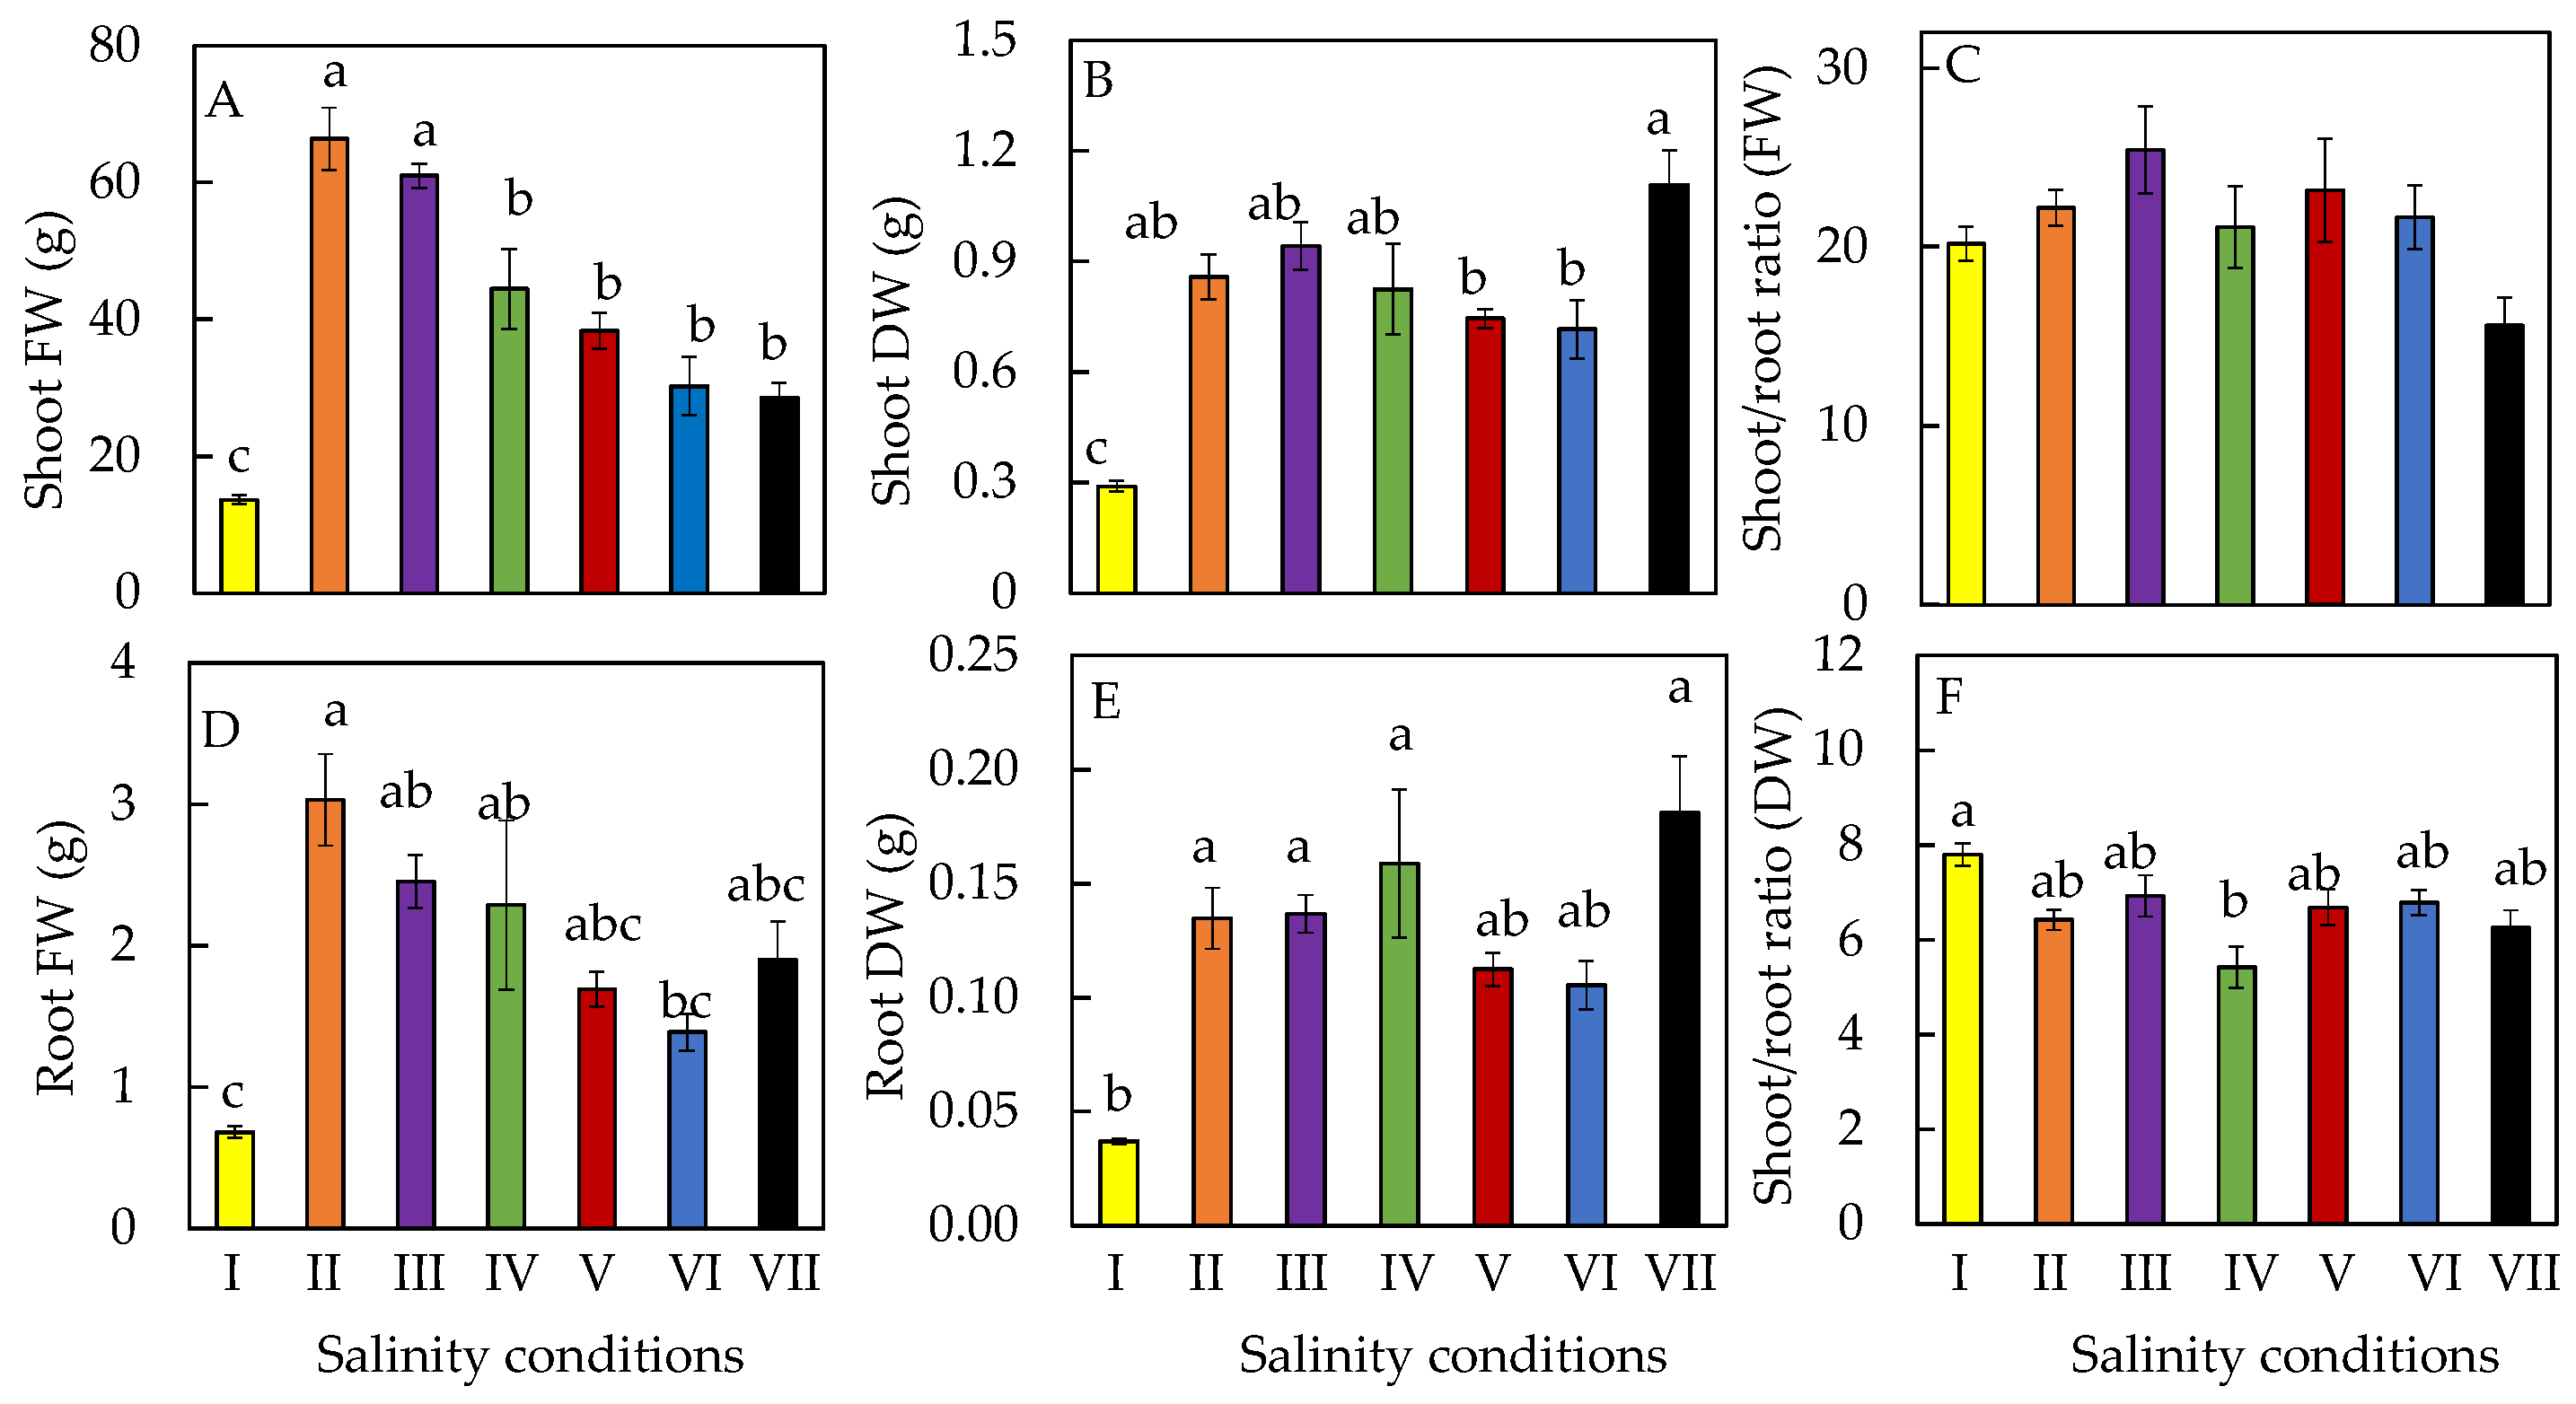
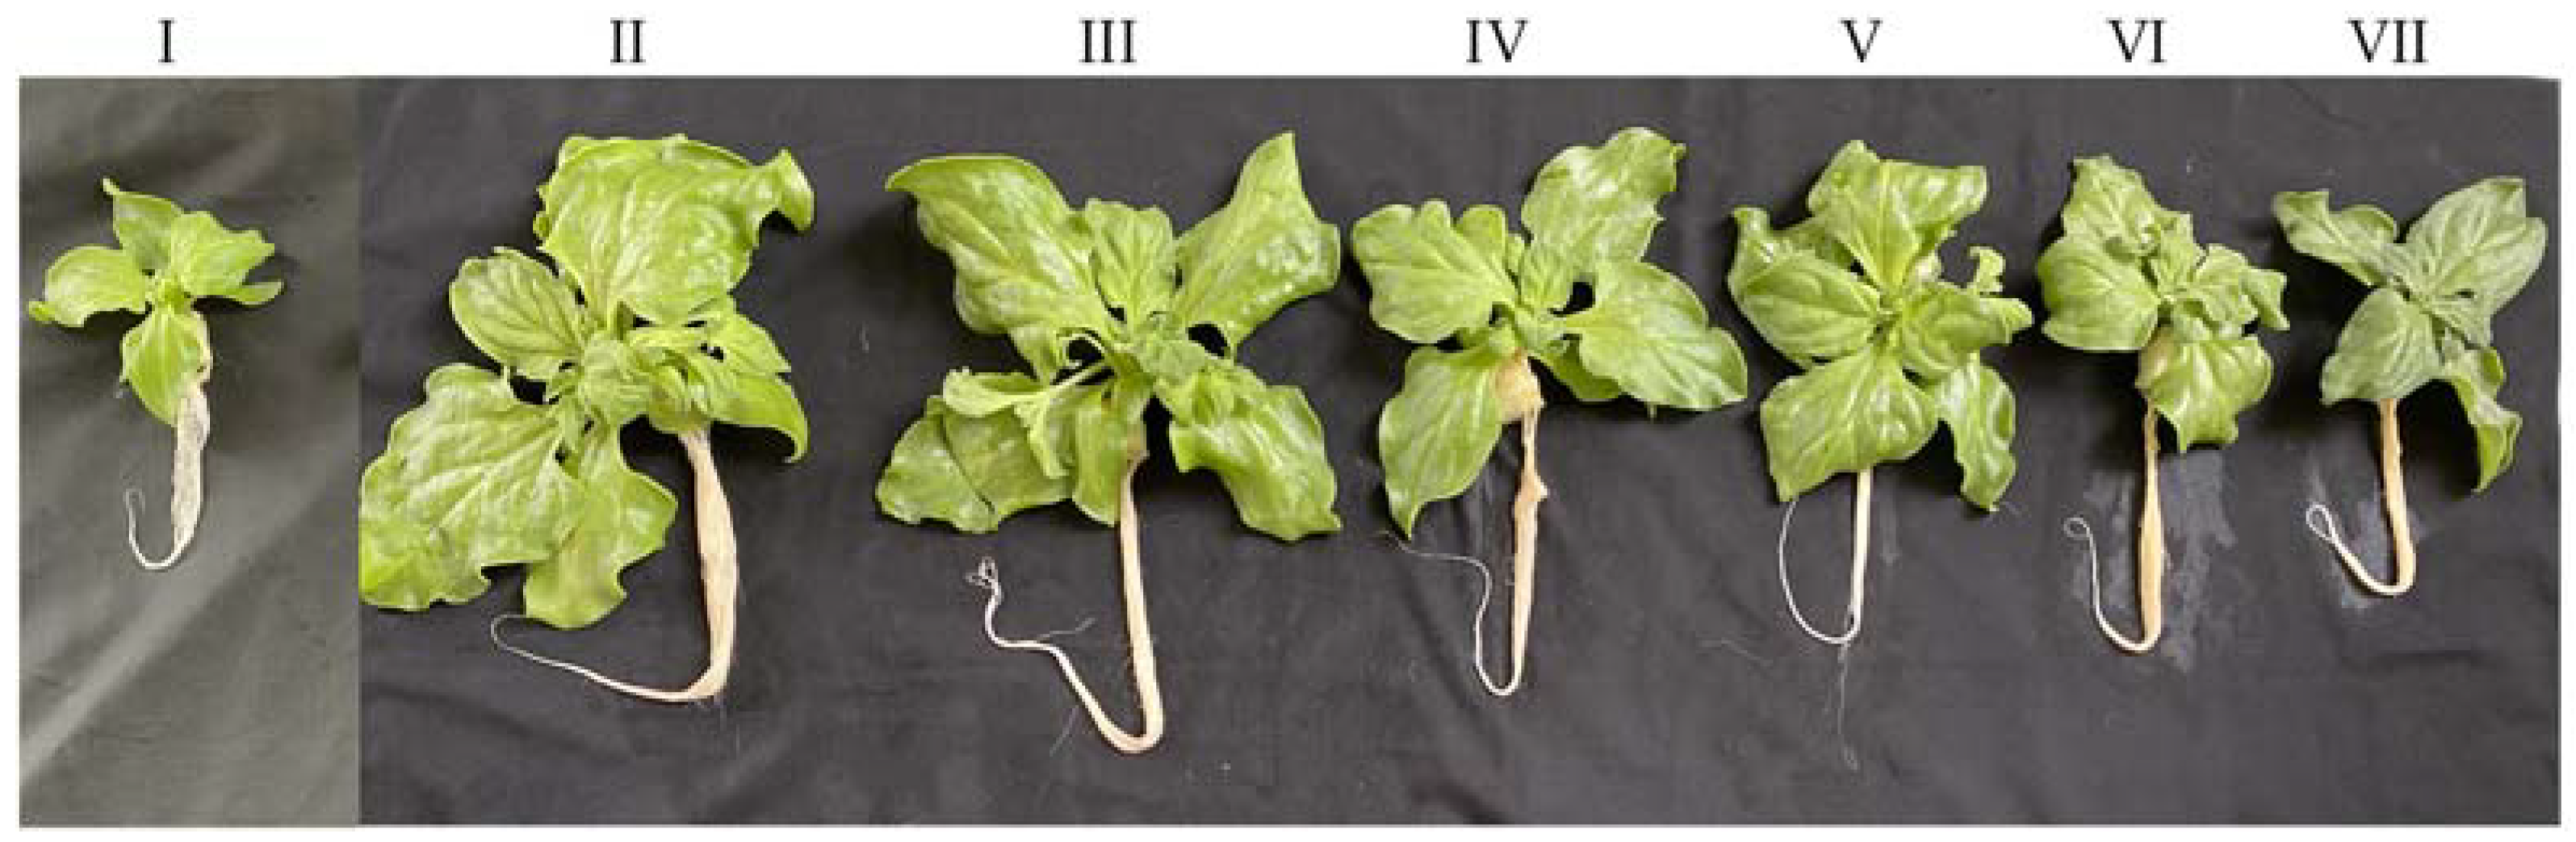
2.1. Productivity
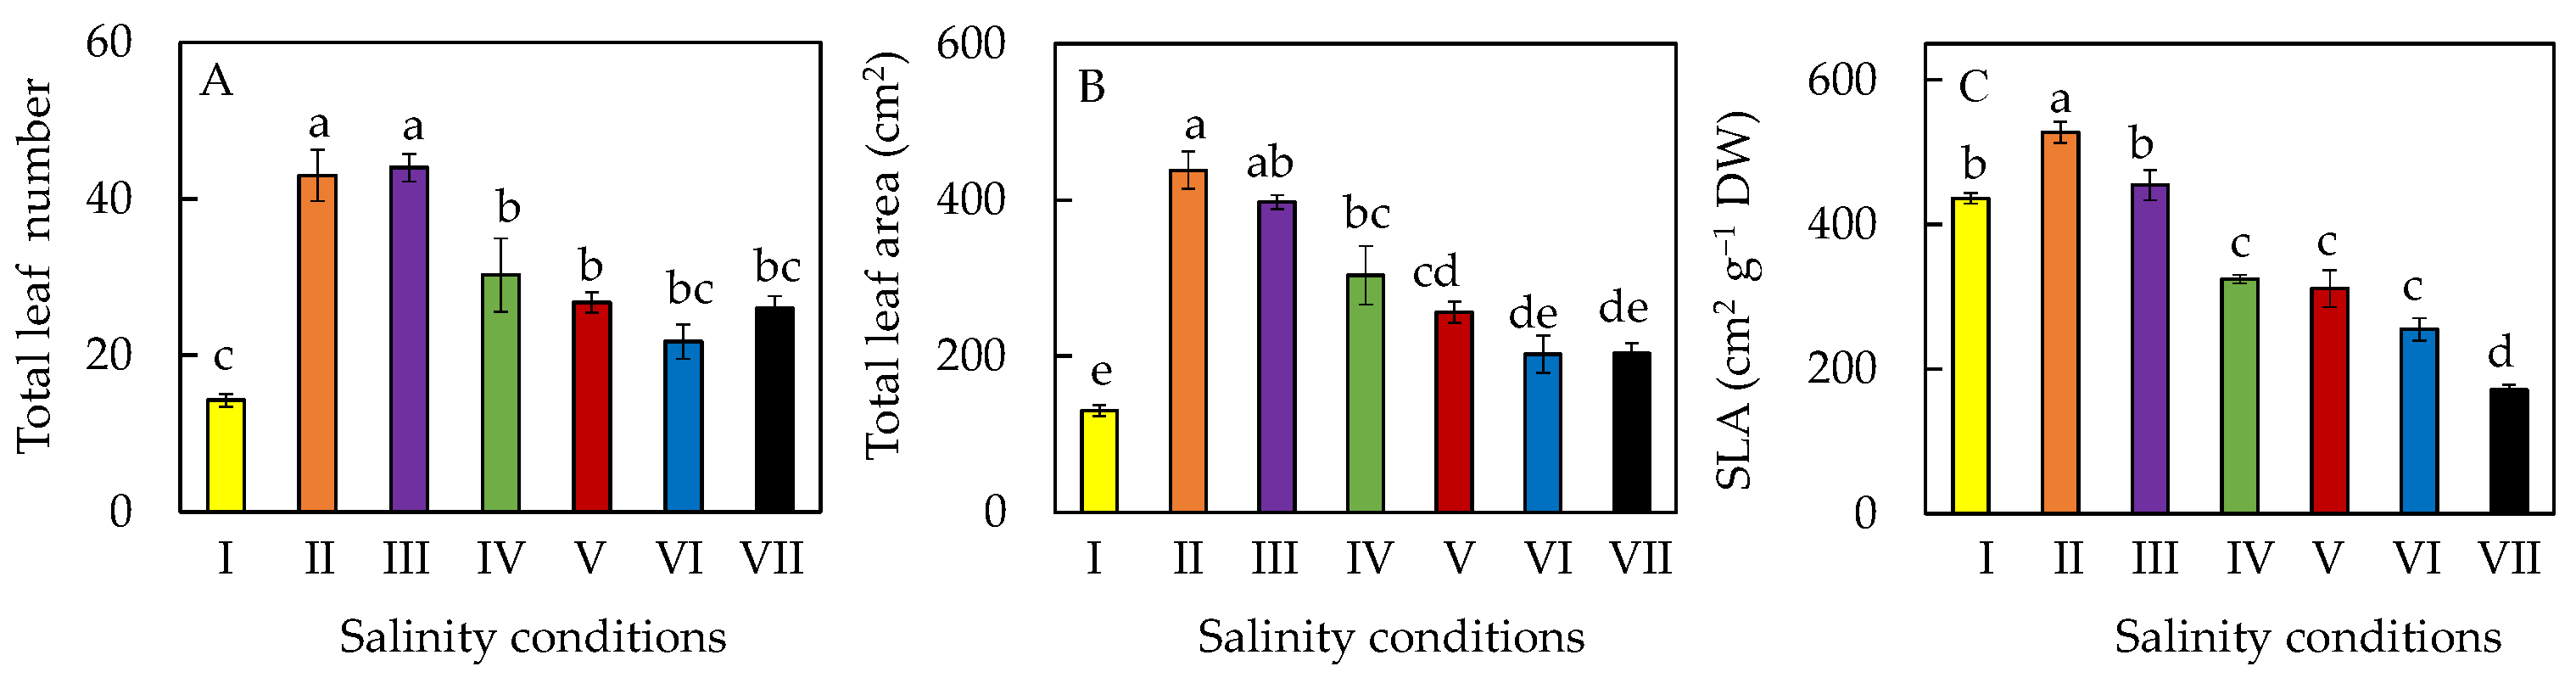
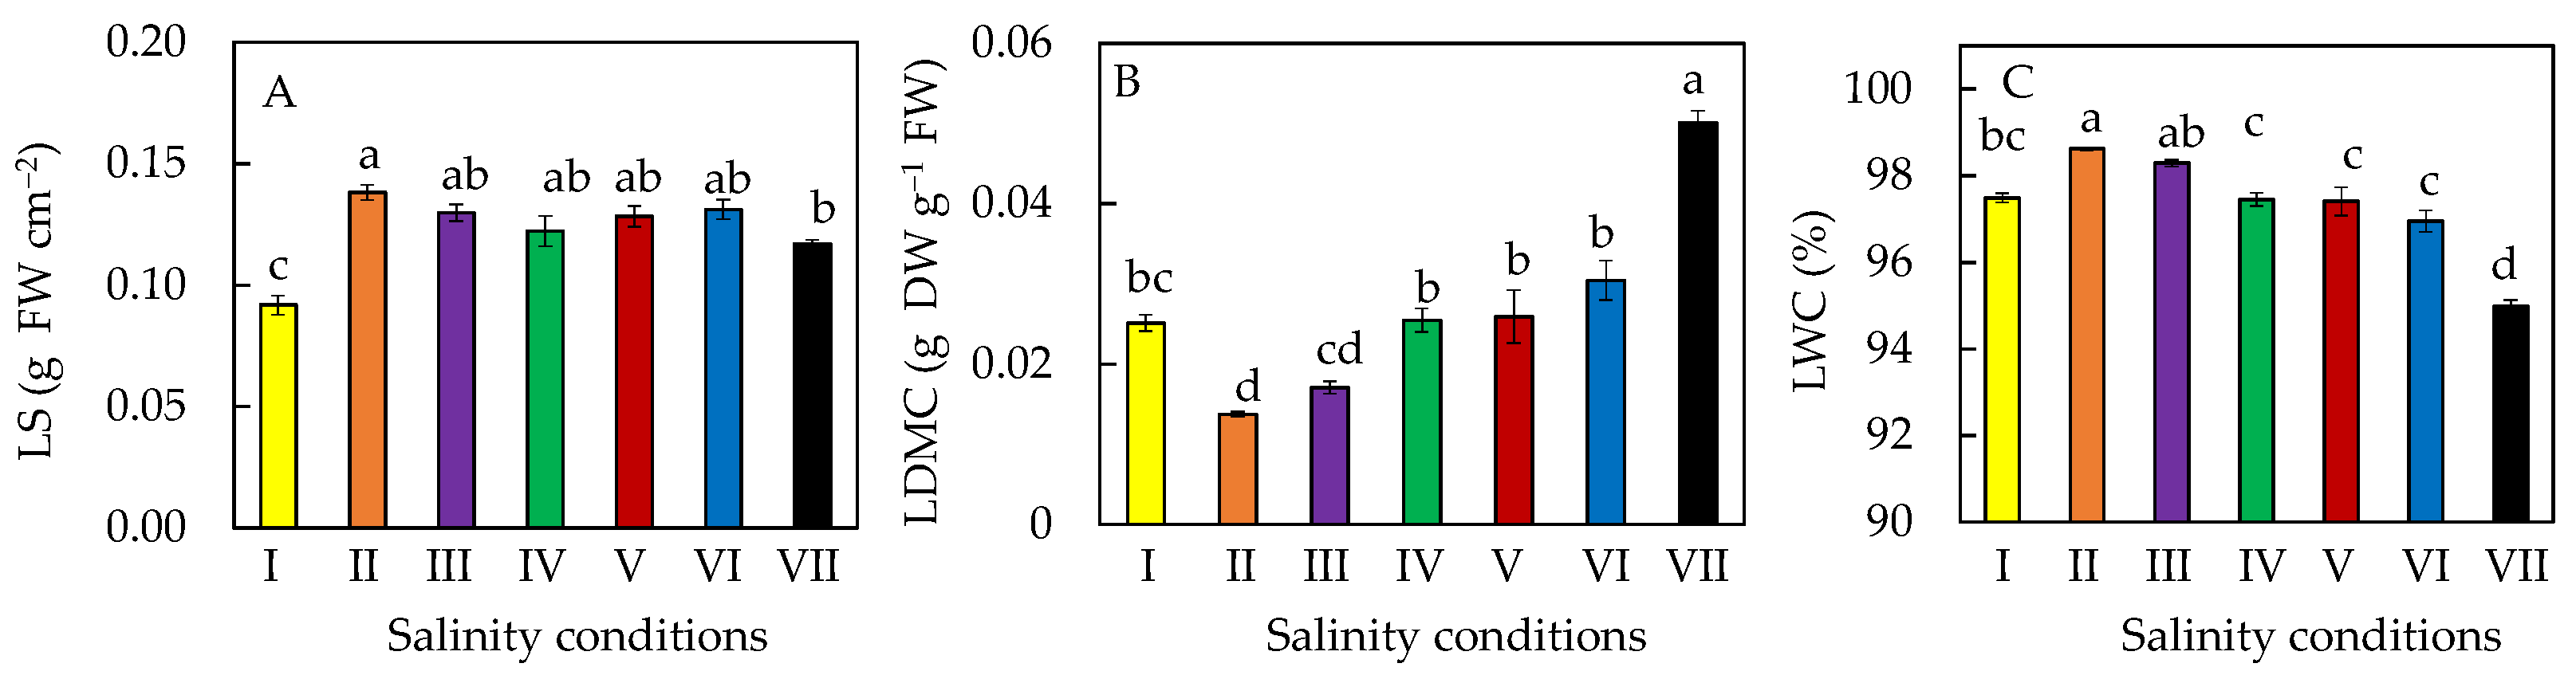
2.2. Leaf Growth
2.3. Leaf Water Status
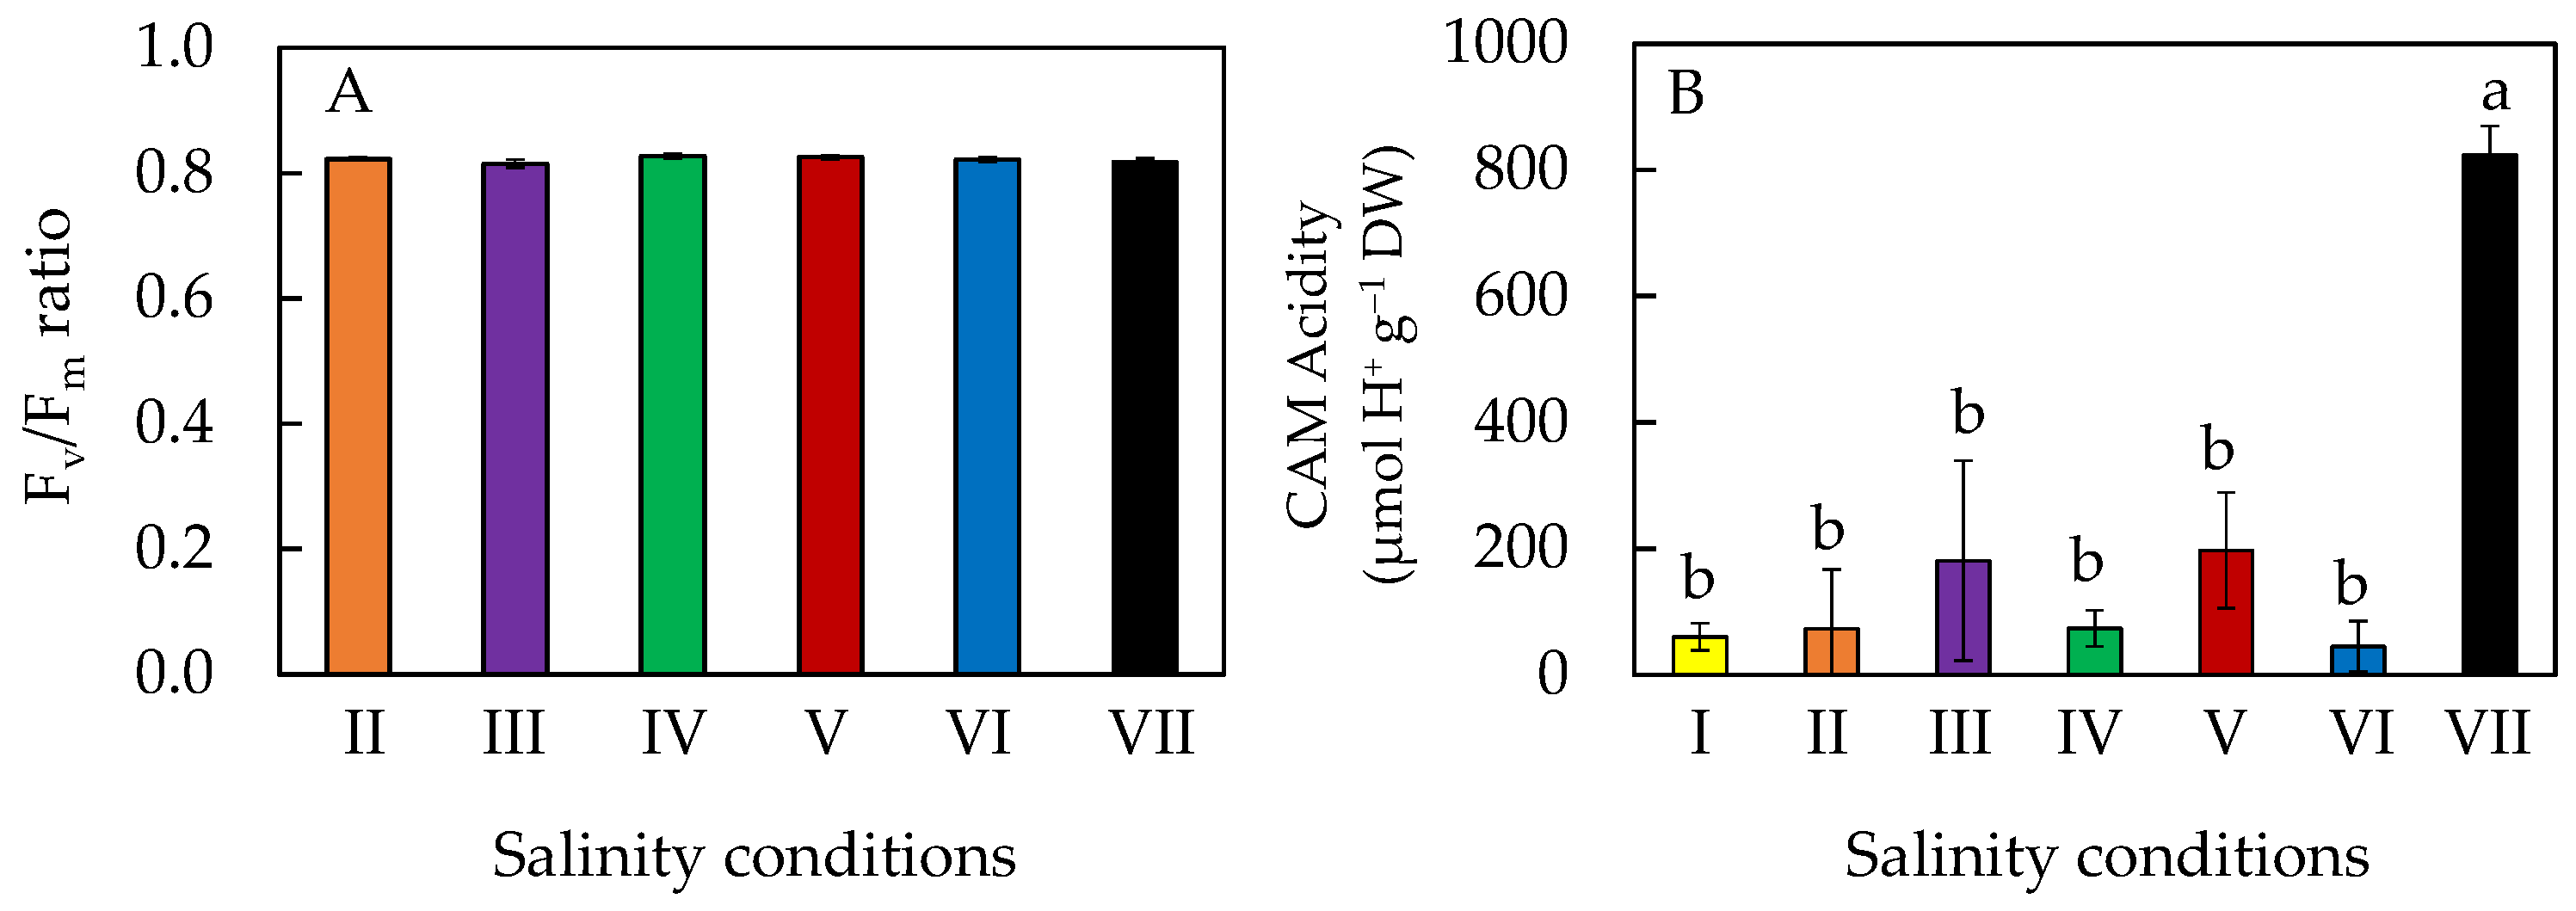
2.4. Chlorophyll (Chl) Fluorescence Fv/Fm (Variable/Maximal Fluorescence) Ratio and CAM (Crassulacean Acid Metabolism) Acidity
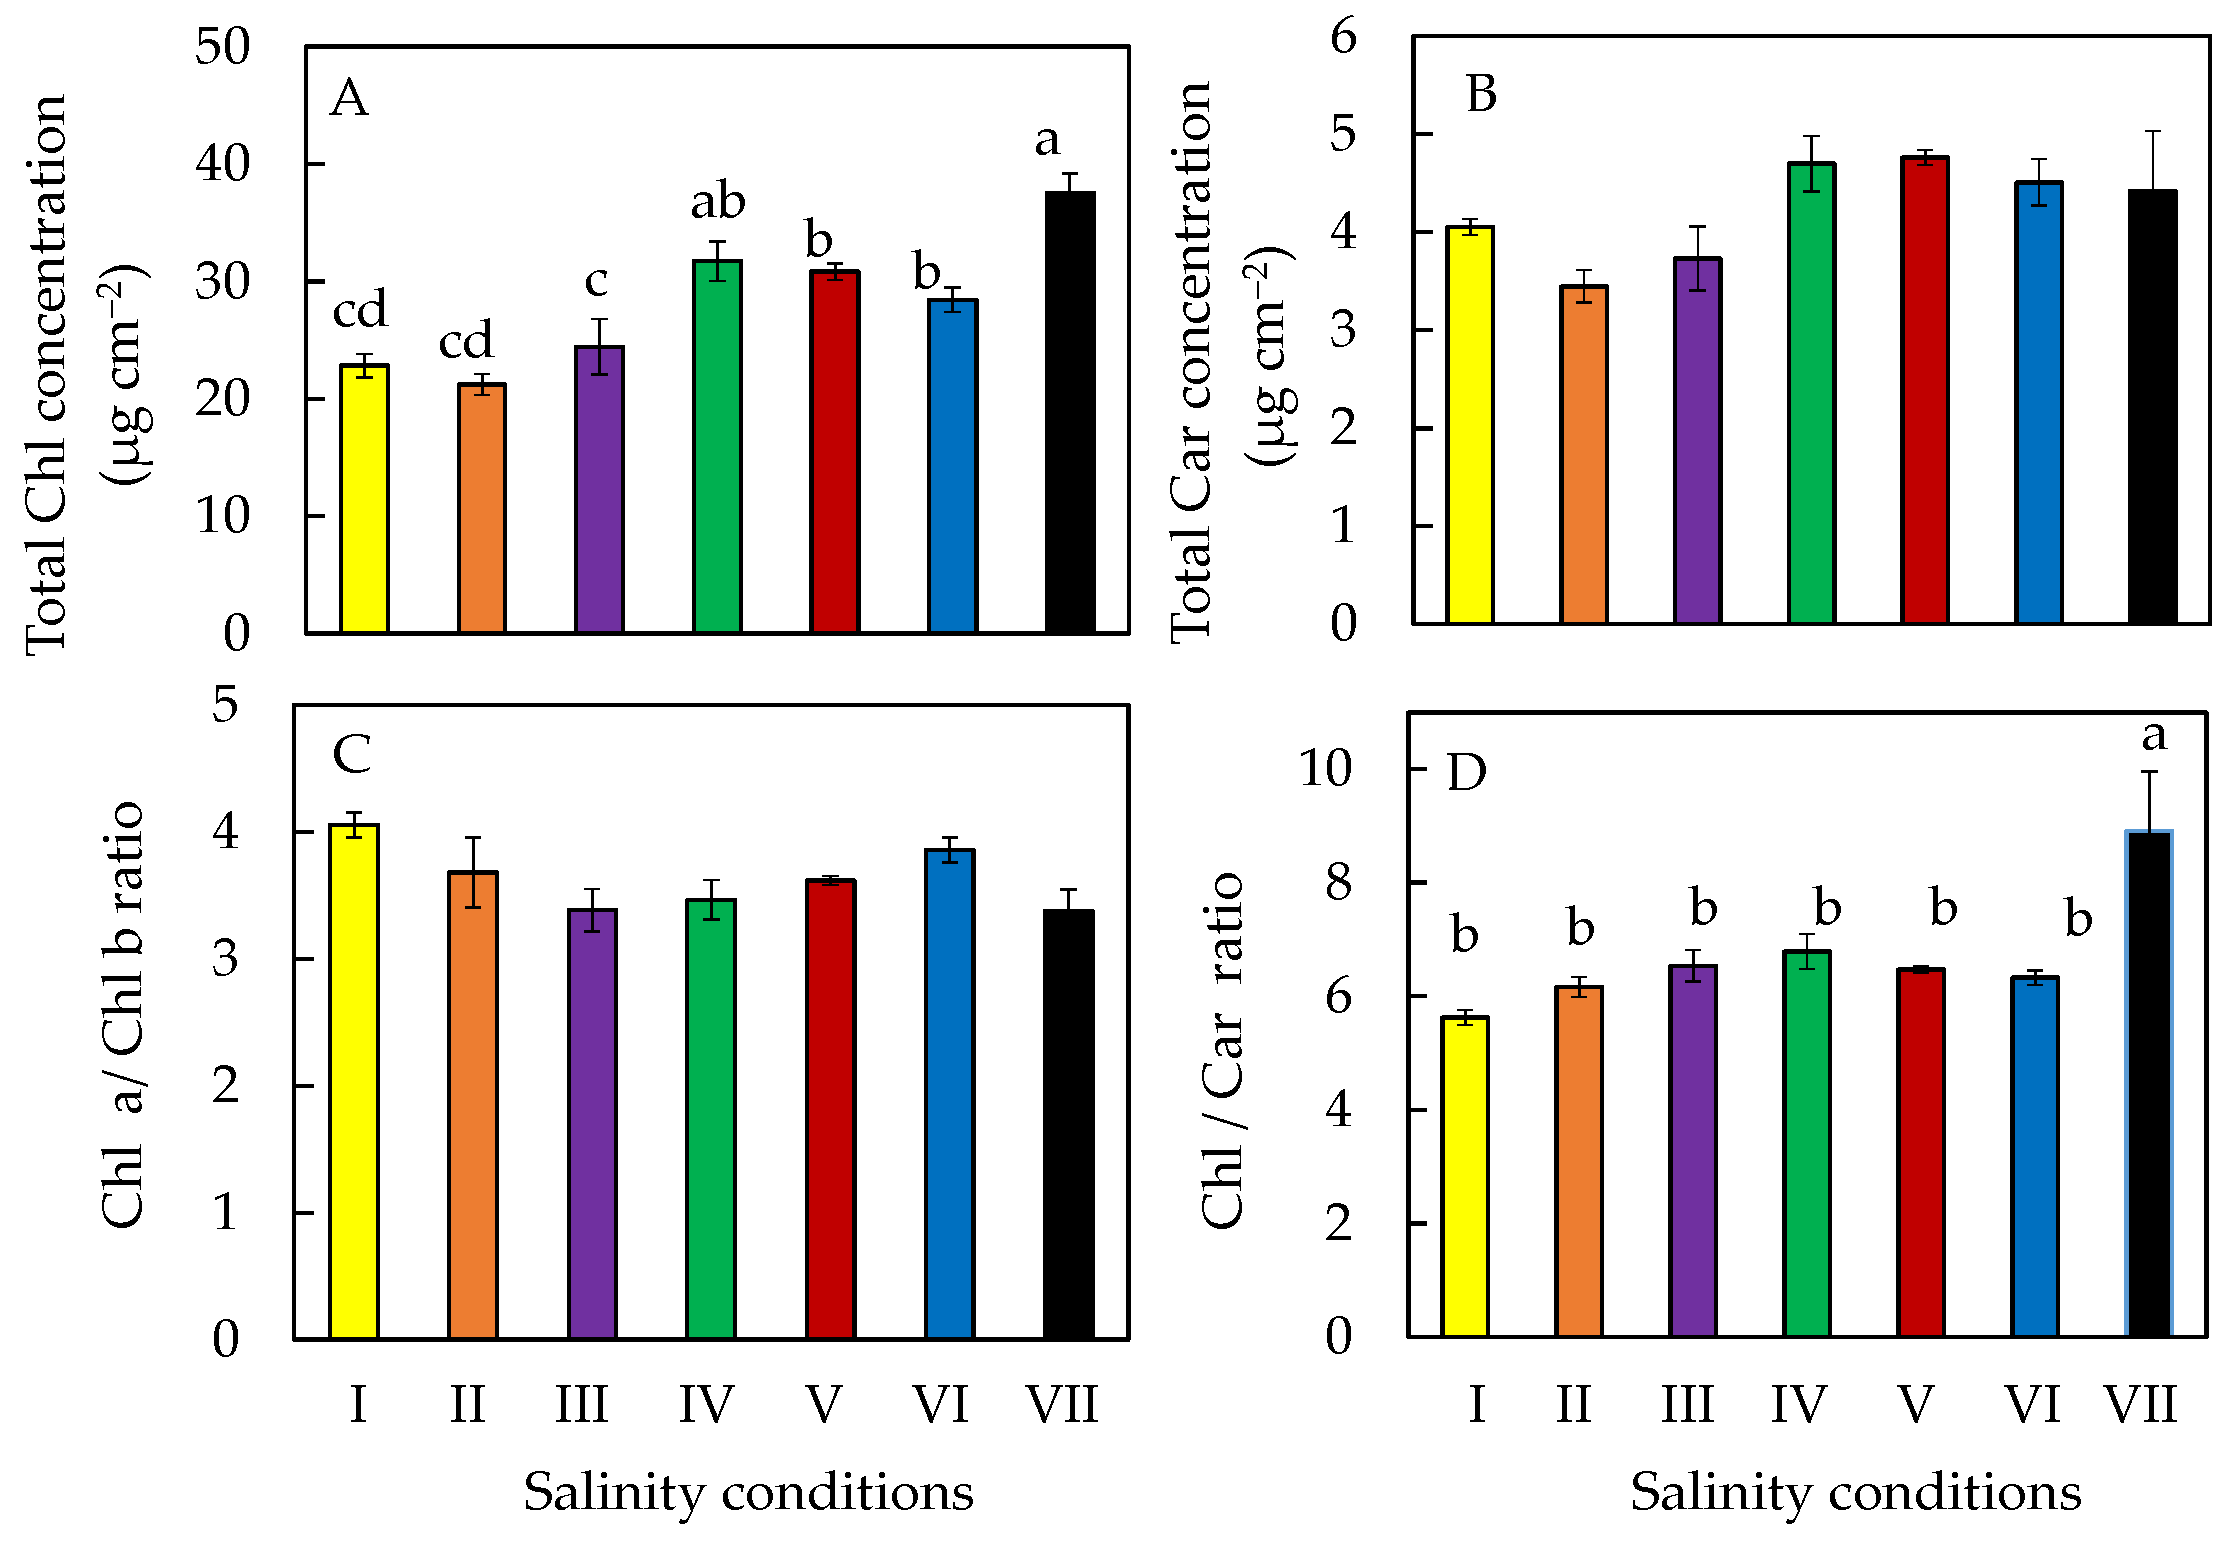
2.5. Photosynthetic Pigments
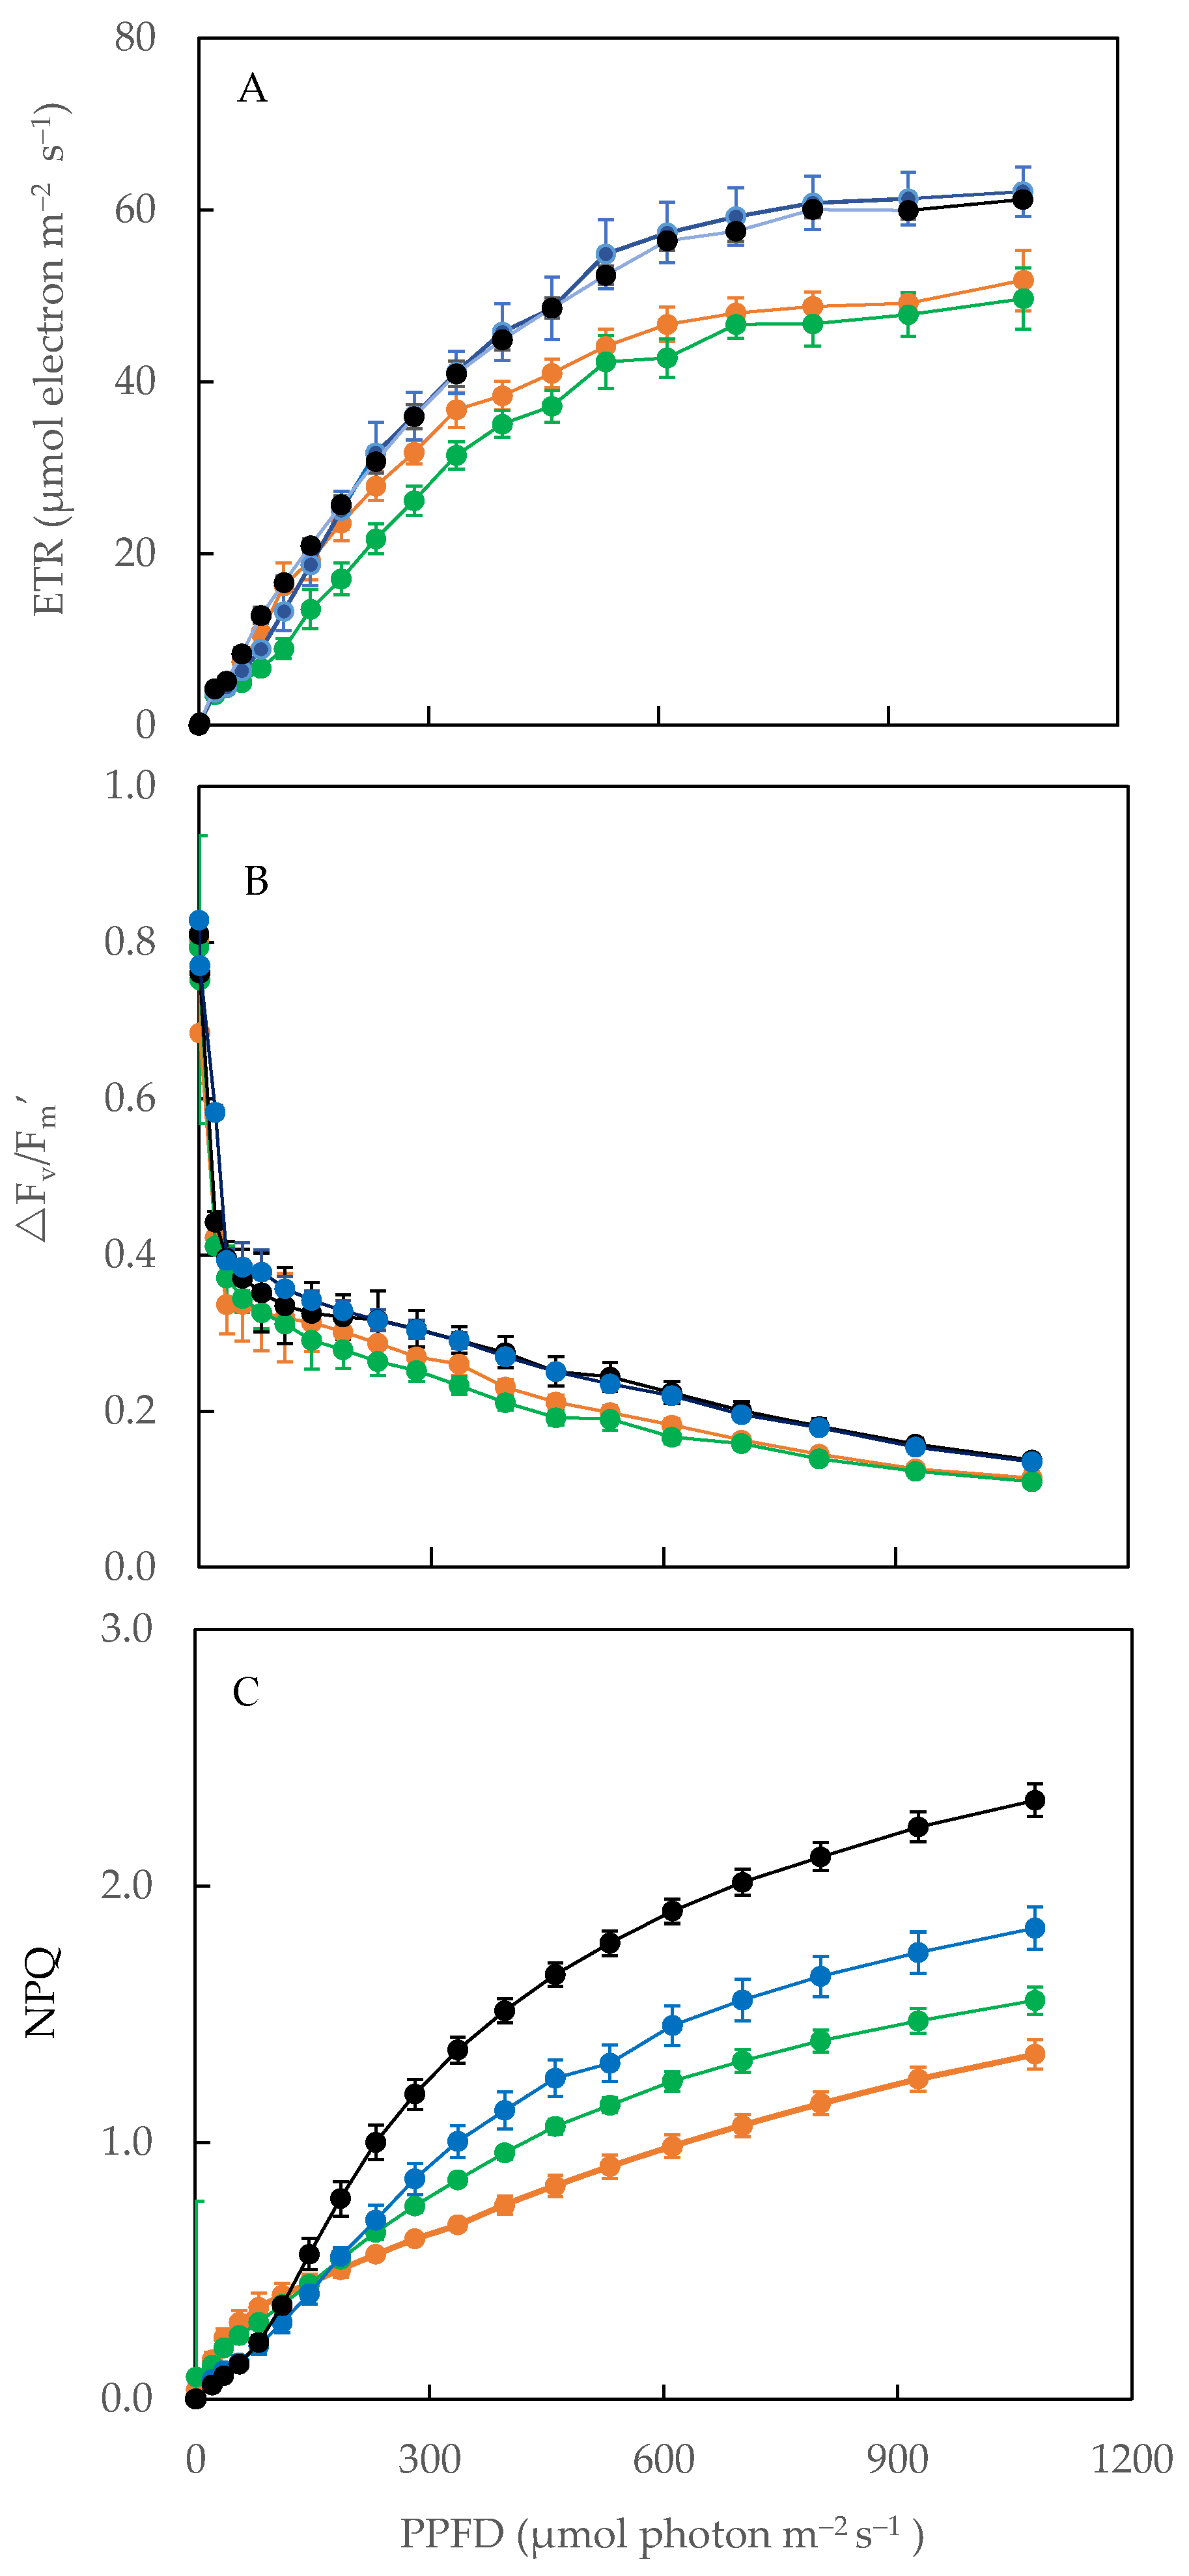
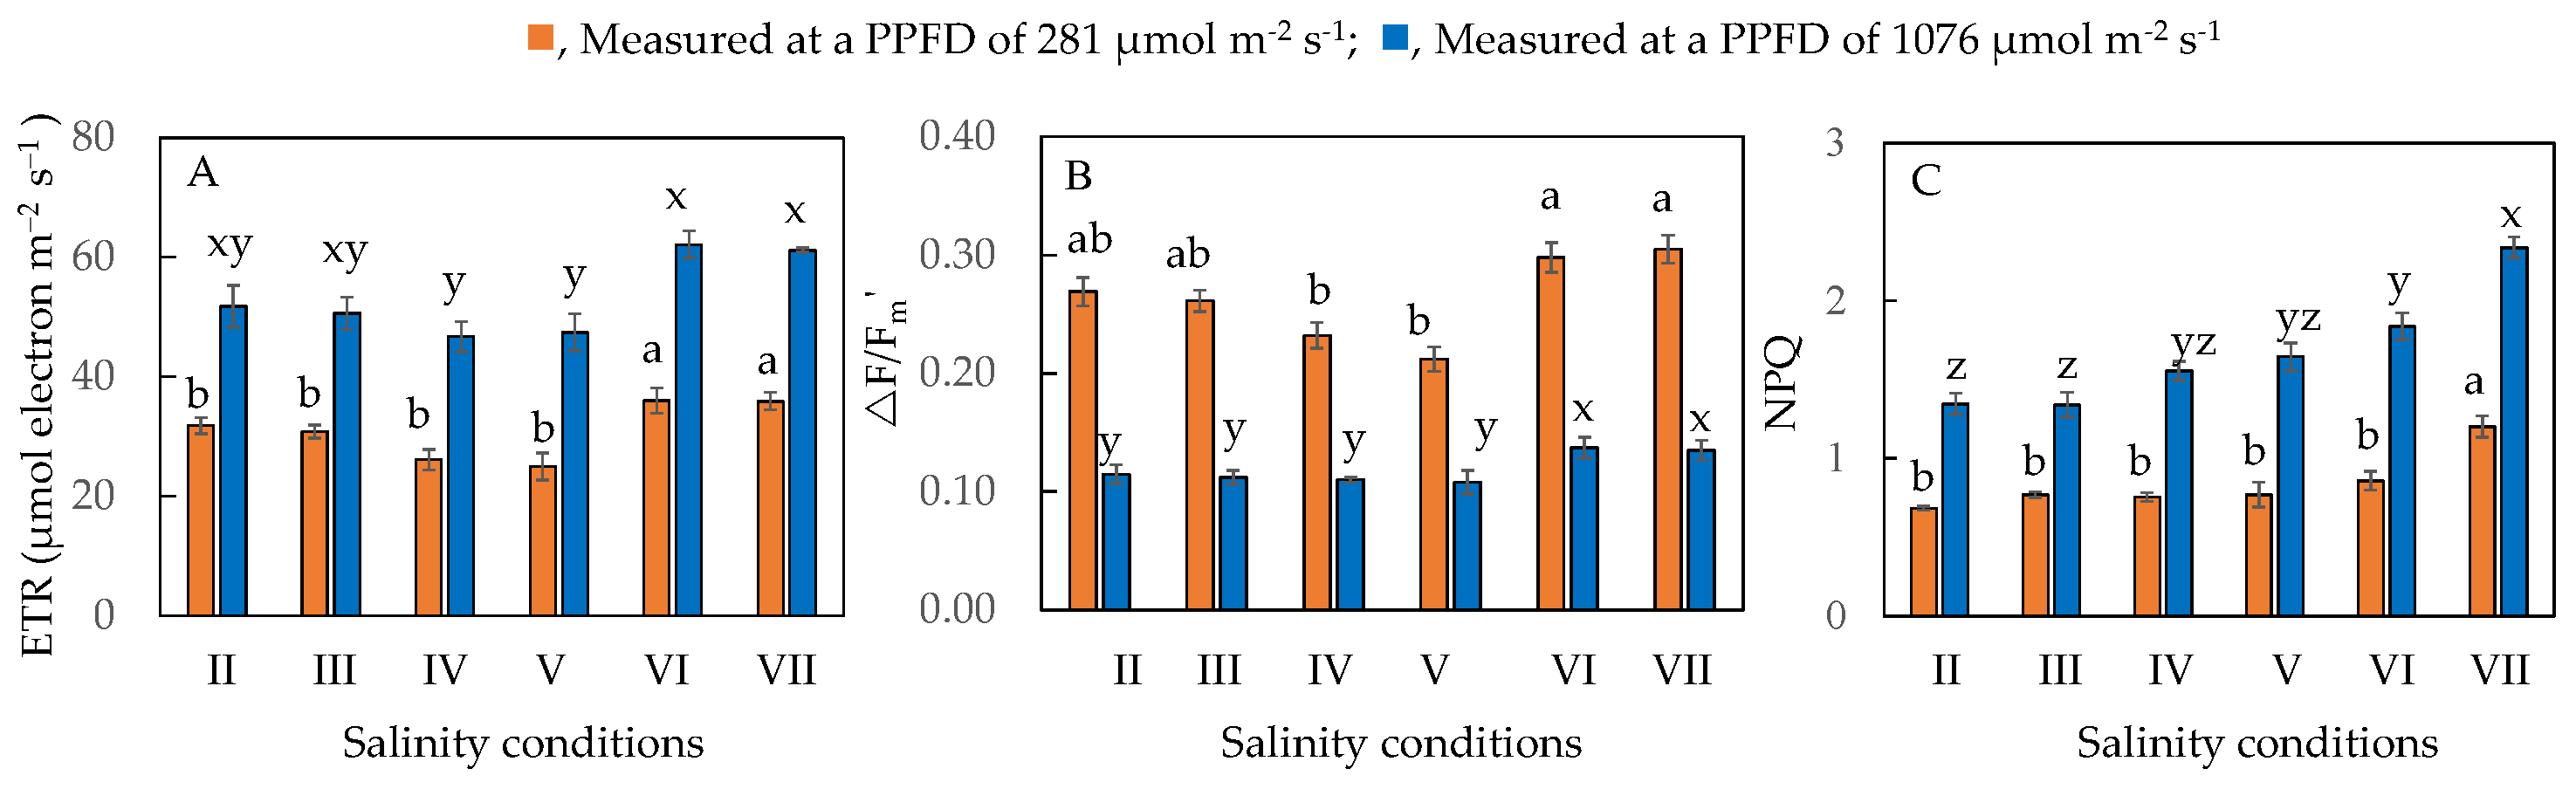
2.6. Electron Transport Rate (ETR), Effective Quantum Yield of PS II (ΔF/Fm′) and Non-Photochemical Quenching (NPQ)
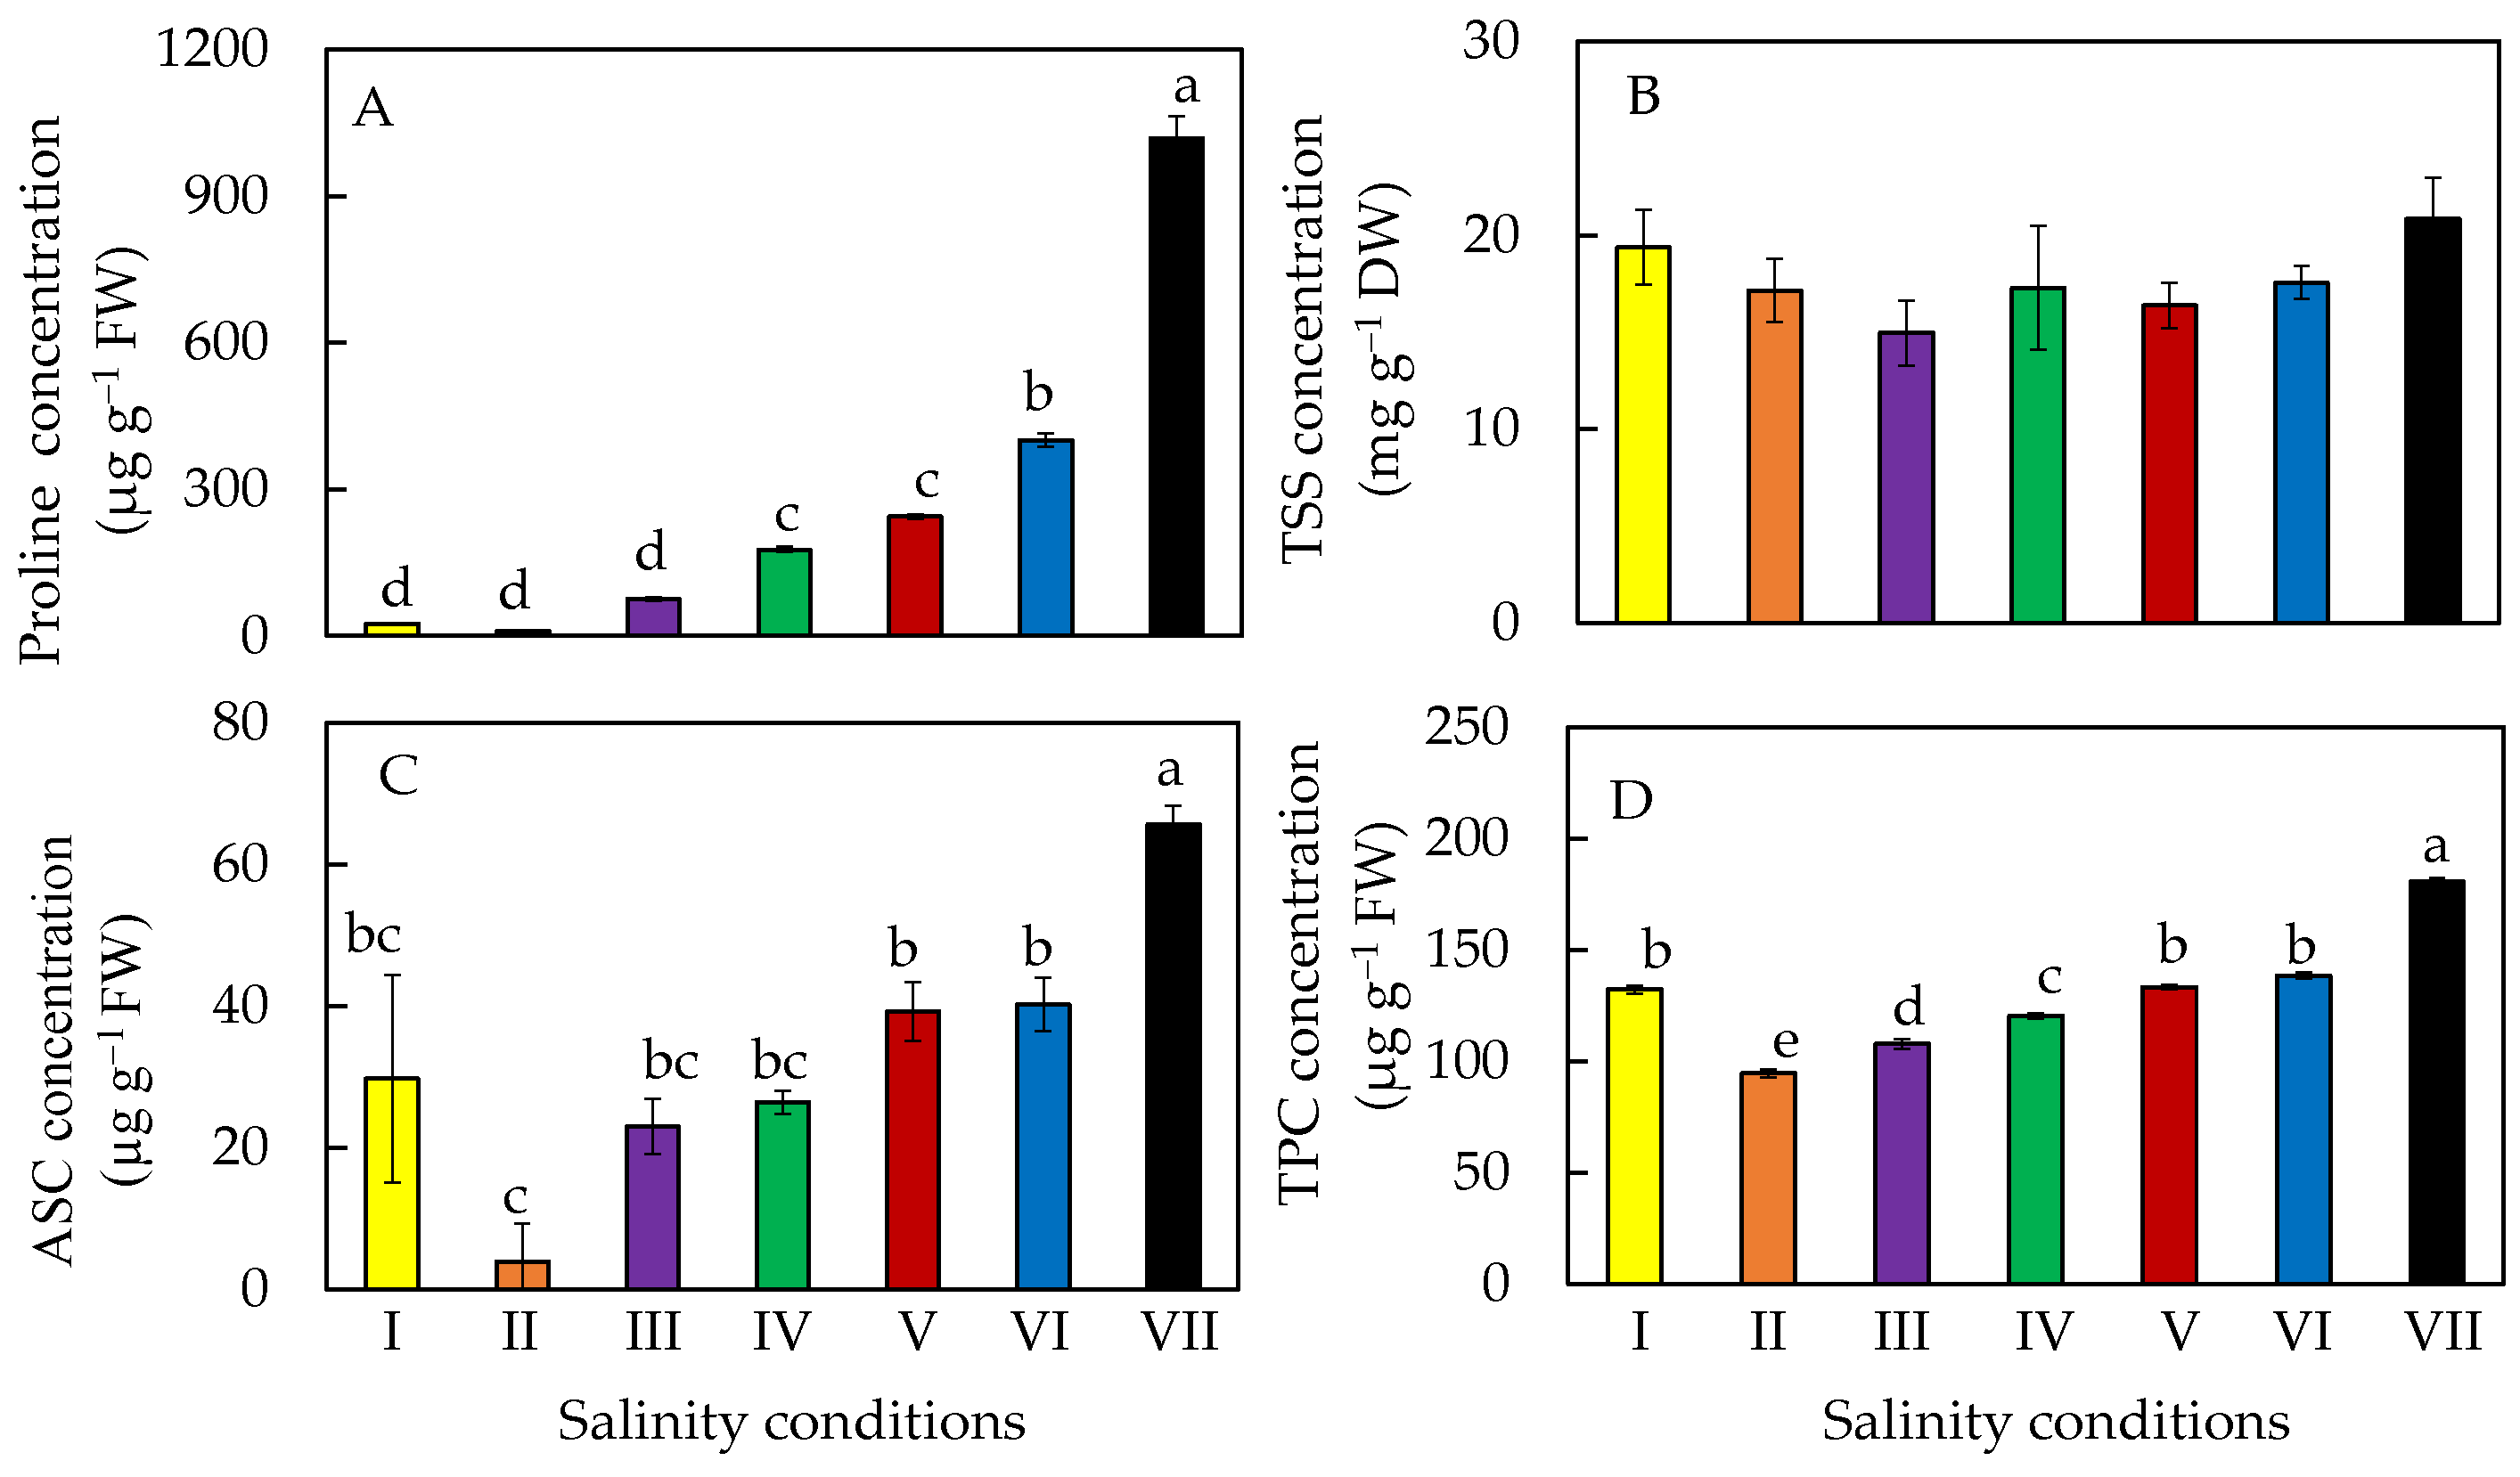
2.7. Accumulation of Phytochemicals
3. Discussion
4. Materials and Methods
4.1. Plant Materials and Experimental Design
4.2. Productivity, Leaf Growth and Leaf Water Status
4.3. Measurement of Chl Fluorescence Fv/Fm Ratio
4.4. Determination of CAM Acidity
4.5. Determinations of Chl and Car Concentrations
4.6. Measurements of ETR, ΔF/Fm′ and NPQ
4.7. Determination of Proline
4.8. Determination of TSS
4.9. Determination of ASC
4.10. Determination of TPC
4.11. Statistical Analysis
Author Contributions
Funding
Data Availability Statement
Conflicts of Interest
References
- Adams, P.; Nelson, D.E.; Yamada, S.; Chmara, W.; Jensen, R.G.; Bohnert, H.J.; Griffiths, H. Growth and development of Mesembryanthemum crystallinum. New Phytol. 1998, 138, 171–190. [Google Scholar] [CrossRef] [PubMed]
- Loconsole, D.; Murillo-Amador, B.; Cristiano, G.; De Lucia, B. Halophyte common ice plants: A future solution to arable land salinization. Sustainability 2019, 11, 6076. [Google Scholar] [CrossRef] [Green Version]
- Abd El-Gawad, A.M.; Shehata, H.S. Ecology and development of Mesembryanthemum crystallinum L. in the Deltaic Mediterranean coast of Egypt. Egy. J. Basic Appl. Sci. 2014, 1, 29–37. [Google Scholar] [CrossRef] [Green Version]
- Ibtissem, B.; Abdelly, C.; Sfar, S. Antioxidant and antibacterial properties of Mesembryanthemum crystallinum and Carpobrotus edulis extracts. Adv. Chem. Eng. Sci. 2012, 2, 359–365. [Google Scholar] [CrossRef] [Green Version]
- Iglesias, A.; Garrote, L. Adaptation strategies for agricultural water management under climate change in Europe. Agric. Water Manag. 2015, 155, 113–124. [Google Scholar] [CrossRef] [Green Version]
- Ai-Lien, C. Singapore sets 30% Goal for Home-Grown food by 2030. The Straits Times, Singapore Press Holdings, Singapore. 2019. Available online: https://www.straitstimes.com/singapore/spore-sets-30-goal-for-home-grown-food-by-2030 (accessed on 3 December 2021).
- Flowers, T.J.; Hajibagheri, M.A.; Clipson, N.J.W. Halophytes. Q. Rev. Biol. 1986, 61, 313–337. [Google Scholar] [CrossRef]
- Askari, H.; Edqvist, J.; Hajheidari, M.; Kafi, M.; Salekdeh, G.H. Effects of salinity levels on proteome of Suaeda aegyptiaca leaves. Proteomics 2006, 6, 2542–2554. [Google Scholar] [CrossRef]
- Yu, J.; Chen, S.; Zhao, Q.; Wang, T.; Yang, C.; Diaz, C.; Sun, G.; Dai, S. Physiological and proteomic analysis of salinity tolerance in Puccinellia tenuiflora. J. Proteome Res. 2011, 10, 3852–3870. [Google Scholar] [CrossRef]
- Flowers, T.J.; Colmer, T.D. Salinity tolerance in halophytes. New Phytol. 2008, 179, 945–963. [Google Scholar] [CrossRef]
- Kumari, A.; Das, P.; Parida, A.K.; Agarwal, P.K. Proteomics, metabolomics, and ionomics perspectives of salinity tolerance in halophytes. Front. Plant Sci. 2015, 6, 537. [Google Scholar] [CrossRef] [Green Version]
- Zhu, J.K. Plant salt tolerance. Trends Plant Sci. 2001, 6, 66–71. [Google Scholar] [CrossRef]
- Slama, I.; Abdelly, C.; Bouchereau, A.; Flower, T.; Savouré, A. Diversity, distribution and roles of osmoprotective compounds accumulated in halophytes under abiotic stress. Ann. Bot. 2015, 115, 433–447. [Google Scholar] [CrossRef] [PubMed] [Green Version]
- Stuchlík, M.; Žák, S. Vegetable lipids as components of functional foods. Biomed. Pap.-Palacky Univ. Olomouc 2002, 146, 3–10. [Google Scholar] [CrossRef] [PubMed] [Green Version]
- Buhmann, A.; Papenbrock, J. An economic point of view of secondary compounds in halophytes. Func. Plant Biol. 2013, 40, 952–967. [Google Scholar] [CrossRef]
- Flowers, T.J. Improving crop salt tolerance. J. Exp. Bot. 2004, 55, 307–319. [Google Scholar] [CrossRef]
- Cheeseman, J.M. The evolution of halophytes, glycophytes and crops, and its implications for food security under saline conditions. New Phytol. 2015, 206, 557–570. [Google Scholar] [CrossRef]
- Abd Elgawad, H.; Zinta, G.; Hegab, M.M.; Pandey, R.; Asard, H.; Abuelsoud, W. High salinity induces different oxidative stress and antioxidant responses in maize seedlings organs. Front. Plant Sci. 2016, 7, 276. [Google Scholar] [CrossRef] [Green Version]
- He, J.; You, X.; Qin, L. High salinity reduces plant growth and photosynthetic performance but enhances certain nutritional quality of C4 Halophyte Portulaca oleracea L. grown hydroponically under LED lighting. Front. Plant Sci. 2021, 12, 651341. [Google Scholar] [CrossRef]
- Crozier, A.; Jaganath, I.B.; Clifford, M.N. Dietary phenolics: Chemistry, bioavailability and effects on health. Nat. Prod. Rep. 2009, 26, 1001–1043. [Google Scholar] [CrossRef]
- Panta, S.; Flowers, T.; Lane, P.; Doyle, R.; Haros, G.; Shabala, S. Halophyte agriculture: Success stories. Environ. Exp. Bot. 2014, 107, 71–83. [Google Scholar] [CrossRef]
- Sivritepe, N.; Sivritepe, H.O.; Eris, A. The effects of NaCl priming on salt tolerance in melon seedlings grown under saline conditions. Sci. Hortic. 2003, 97, 229–237. [Google Scholar] [CrossRef]
- Cayuela, E.; Perez-Alfocea, F.; Caro, M.; Bolarin, M.C. Priming of seeds with NaCl induces physiological changes in tomato plants grown under salt stress. Physiol. Plant. 1996, 96, 231–236. [Google Scholar] [CrossRef]
- Farhoudi, R.; Sharifzadeh, F.; Poustini, K.; Makkizadeh, M.T.; Kochakpor, M. The effects of NaCl priming on salt tolerance in canola (Brassica napus) seedlings grown under saline conditions. Seed Sci. Technol. 2007, 35, 754–759. [Google Scholar] [CrossRef] [Green Version]
- Khan, H.A.; Ayub, C.M.; Pervez, M.A.; Bilal, R.M.; Shahid, M.A.; Ziaf, K. Effect of seed priming with NaCl on salinity tolerance of hot pepper (Capsicum annuum L.) at seedling stage. Soil Environ. 2009, 28, 81–87. [Google Scholar]
- Farhoudi1, R.; Saeedipour, S.; Mohammadreza, D. The effect of NaCl seed priming on salt tolerance, antioxidant enzyme activity, proline and carbohydrate accumulation of Muskmelon (Cucumis melo L.) under saline condition. Afr. J. Agric. Res. 2011, 6, 1363–1370. [Google Scholar]
- He, J.; Qin, L. Productivity and photosynthetic characteristics of the facultative halophyte Mesembryanthemum crystallinum grown indoors with LED lighting under different salinities. Acta. Hortic. 2020, 1296, 219–226. [Google Scholar] [CrossRef]
- He, J.; Koh, D.J.Q.; Qin, L. LED spectral quality and NaCl salinity interact to affect growth, photosynthesis and phytochemical production of Mesembryanthemum crystallinum. Funct. Plant Biol. 2021. [Google Scholar] [CrossRef]
- Winter, K.; Holtum, J.A.M. Facultative crassulacean acid metabolism (CAM) plants: Powerful tools for unravelling the functional elements of CAM photosynthesis. J. Exp. Bot. 2014, 65, 3425–3441. [Google Scholar] [CrossRef] [Green Version]
- Acosta-Motos, J.; Ortuño, M.; Bernal-Vicente, A.; Diaz-Vivancos, P.; Sanchez-Blanco, M.; Hernandez, J. Plant responses to salt stress: Adaptive mechanisms. Agronomy 2017, 7, 18. [Google Scholar] [CrossRef] [Green Version]
- Franco, J.A.; Fernández, J.A.; Bañón, S.; González, A. Relationship between the effects of salinity on seedling leaf area and fruit yield of six muskmelons cultivars. J. Hortic. Sci. 1997, 32, 642–647. [Google Scholar] [CrossRef]
- Rodríguez, P.; Torrecillas, A.; Morales, M.A.; Ortuño, M.F.; Sánchez-Blanco, M.J. Effects of NaCl salinity and water stress on growth and leaf water relations of Asteriscus maritimus plants. Environ. Exp. Bot. 2005, 53, 113–123. [Google Scholar] [CrossRef]
- Muchate, N.S.; Rajurkar, N.S.; Suprasanna, P.; Nikam, T.D. NaCl induced salt adaptive changes and enhanced accumulation of 20-hydroxyecdysone in the in vitro shoot cultures of Spinacia oleracea (L.). Sci. Rep. 2019, 9, 12522. [Google Scholar] [CrossRef] [PubMed] [Green Version]
- Haider, M.S.; Barnes, J.D.; Cushman, J.C.; Borland, A.M. A CAM- and starch-deficient mutant of the facultative CAM species Mesembryanthemum crystallinum reconciles sink demands by repartitioning carbon during acclimation to salinity. J. Exp. Bot. 2012, 63, 1985–1986. [Google Scholar] [CrossRef] [PubMed]
- Matsuoka, T.A.; Onozawa, K.; Sonoike, S.; Kore-eda, S. Crassulacean acid metabolism induction in Mesembryanthemum crystallinum can be estimated by non-photochemical quenching upon actinic illumination during the dark period. Plant Cell Physiol. 2018, 59, 1966–1975. [Google Scholar] [CrossRef]
- Broettoa, F.; Duarteb, H.M.; Lüttge, U. Responses of chlorophyll fluorescence parameters of the facultative halophyte and C3–CAM intermediate species Mesembryanthemum crystallinum to salinity and high irradiance stress. J. Plant Physiol. 2007, 164, 904–912. [Google Scholar] [CrossRef]
- Stepien, P.; Johnson, G.N. Contrasting responses of photosynthesis to salt stress in the glycophyte Arabisopsis and the halophyte Thellungiella: Role of plastid terminal oxidase as an alternative election sink. Plant Physiol. 2009, 149, 1154–1165. [Google Scholar] [CrossRef] [Green Version]
- Shin, Y.K.; Bhandari, S.R.; Jo, J.S.; Song, J.W.; Cho, M.C.; Yang, E.Y.; Lee, J.G. Response to Salt Stress in Lettuce: Changes in Chlorophyll Fluorescence Parameters, Phytochemical Contents, and Antioxidant Activities. Agronomy 2020, 10, 1627. [Google Scholar] [CrossRef]
- Wang, X.; Mao, Z.; Zhang, J.; Hemat, M.; Huang, M.; Cai, J.; Qin, Z.; Dai, T.; Dong, J. Osmolyte accumulation plays important roles in the drought priming induced tolerance to post-anthesis drought stress in winter wheat (Triticum aestivum L.). Environ. Exp. Bot. 2019, 166, 103804. [Google Scholar] [CrossRef]
- Santos, C.V. Regulation of chlorophyll biosynthesis and degradation by salt stress in sunflower leaves. Sci. Hortic. 2004, 103, 93–99. [Google Scholar] [CrossRef]
- Guan, Q.; Tan, B.; Kelley, T.M.; Tian, J.; Chen, S. Physiological changes in Mesembryanthemum crystallinum during the C3 to CAM transition induced by salt stress. Front. Plant Sci. 2020, 11, 283. [Google Scholar] [CrossRef] [Green Version]
- Hsouna, A.B.; Ghneim-Herrera, T.; Romdhane, W.B.; Dabbous, A.; Saad, R.B.; Brini, F.; Abdelly, C.; Hamed, B.K. Early effects of salt stress on the physiological and oxidative status of the halophyte Lobularia maritima. Funct. Plant. Biol. 2020, 47, 912–924. [Google Scholar] [CrossRef] [PubMed]
- Blum, A.; Munns, R.; Passioura, J.B.; Turner, N.C.; Sharp, R.E.; Boyer, J.S.; Nguyen, H.T.; Hsiao, T.C.; Verma, D.P.S.; Hong, Z. Genetically engineered plants resistant to soil drying and salt stress: How to interpret osmotic relations? Plant Physiol. 1996, 10, 1051–1053. [Google Scholar] [CrossRef] [PubMed] [Green Version]
- Abogadallah, G.M. Antioxidative defense under salt stress. Plant Signal. Behav. 2010, 5, 369–374. [Google Scholar] [CrossRef] [PubMed]
- Hunt, R.; Causton, D.R.; Shipley, B.; Askew, A.P. A modern tool for classical plant growth analysis. Ann. Bot. 2002, 90, 485–488. [Google Scholar] [CrossRef] [PubMed] [Green Version]
- Agarie, S.; Shimoda, T.; Shimizu, Y.; Baumann, K.; Sunagawa, H.; Kondo, A.; Ueno, O.; Nakahara, T.; Nose, A.; Cushman, J.C. Salt tolerance, salt accumulation, and ionic homeostasis in an epidermal bladder-cell-less mutant of the common ice plant Mesembryanthemum crystallinum. J. Exp. Bot. 2007, 58, 1957–1967. [Google Scholar] [CrossRef] [PubMed]
- Garnier, E.; Shipley, B.; Roumet, C.; Laurent, G. A standardized protocol for the determination of specific leaf area and leaf dry matter content. Funct. Ecol. 2001, 15, 688–695. [Google Scholar] [CrossRef]
- He, J.; Tan, B.H.G.; Qin, L. Source-to-sink relationship between green leaves and green pseudobulbs of C3 orchid in regulation of photosynthesis. Photosynthetica 2011, 49, 209–218. [Google Scholar] [CrossRef]
- He, J.; Teo, L.C.D. Susceptibility of CAM Dendrobium Burana Jade green leaves and green flower petals to high light under tropical natural conditions. Photosynthetica 2007, 45, 214–221. [Google Scholar] [CrossRef]
- Welburn, A.R. The spectral determination of chlorophylls a and b, as well as carotenoids, using various solvents with spectrophotometers of different resolution. J. Plant Physiol. 1994, 144, 307–313. [Google Scholar] [CrossRef]
- Bates, L.S.; Waldren, R.P.; Teare, I.D. Rapid determination of free proline for water- stress studies. Plant Soil 1973, 39, 205–207. [Google Scholar] [CrossRef]
- Dubois, M.; Gilles, K.A.; Hamilton, J.K.; Rebers, A.; Smith, F. Colorimetric method for determination of sugars and related substances. Anal. Chem. 1956, 28, 350–356. [Google Scholar] [CrossRef]
- Leipner, J.; Fracheboud, Y.; Stamp, P. Acclimation by suboptimal temperature diminishes photooxidative damage in maize leaves. Plant. Cell Environ. 1997, 20, 366–372. [Google Scholar] [CrossRef]
- Ragee, S.; Abdel-Aal, E.M.; Noaman, M. Antioxidant activity and nutrient composition of selected cereals for food use. Food Chem. 2006, 98, 32–38. [Google Scholar] [CrossRef]


Publisher’s Note: MDPI stays neutral with regard to jurisdictional claims in published maps and institutional affiliations. |
© 2022 by the authors. Licensee MDPI, Basel, Switzerland. This article is an open access article distributed under the terms and conditions of the Creative Commons Attribution (CC BY) license (https://creativecommons.org/licenses/by/4.0/).
Share and Cite
He, J.; Ng, O.W.J.; Qin, L. Salinity and Salt-Priming Impact on Growth, Photosynthetic Performance, and Nutritional Quality of Edible Mesembryanthemum crystallinum L. Plants 2022, 11, 332. https://doi.org/10.3390/plants11030332
He J, Ng OWJ, Qin L. Salinity and Salt-Priming Impact on Growth, Photosynthetic Performance, and Nutritional Quality of Edible Mesembryanthemum crystallinum L. Plants. 2022; 11(3):332. https://doi.org/10.3390/plants11030332
Chicago/Turabian StyleHe, Jie, Olivia Wei Jin Ng, and Lin Qin. 2022. "Salinity and Salt-Priming Impact on Growth, Photosynthetic Performance, and Nutritional Quality of Edible Mesembryanthemum crystallinum L." Plants 11, no. 3: 332. https://doi.org/10.3390/plants11030332
APA StyleHe, J., Ng, O. W. J., & Qin, L. (2022). Salinity and Salt-Priming Impact on Growth, Photosynthetic Performance, and Nutritional Quality of Edible Mesembryanthemum crystallinum L. Plants, 11(3), 332. https://doi.org/10.3390/plants11030332