Machine Learning for Gully Feature Extraction Based on a Pan-Sharpened Multispectral Image: Multiclass vs. Binary Approach


Abstract
1. Introduction
2. Materials and Methods
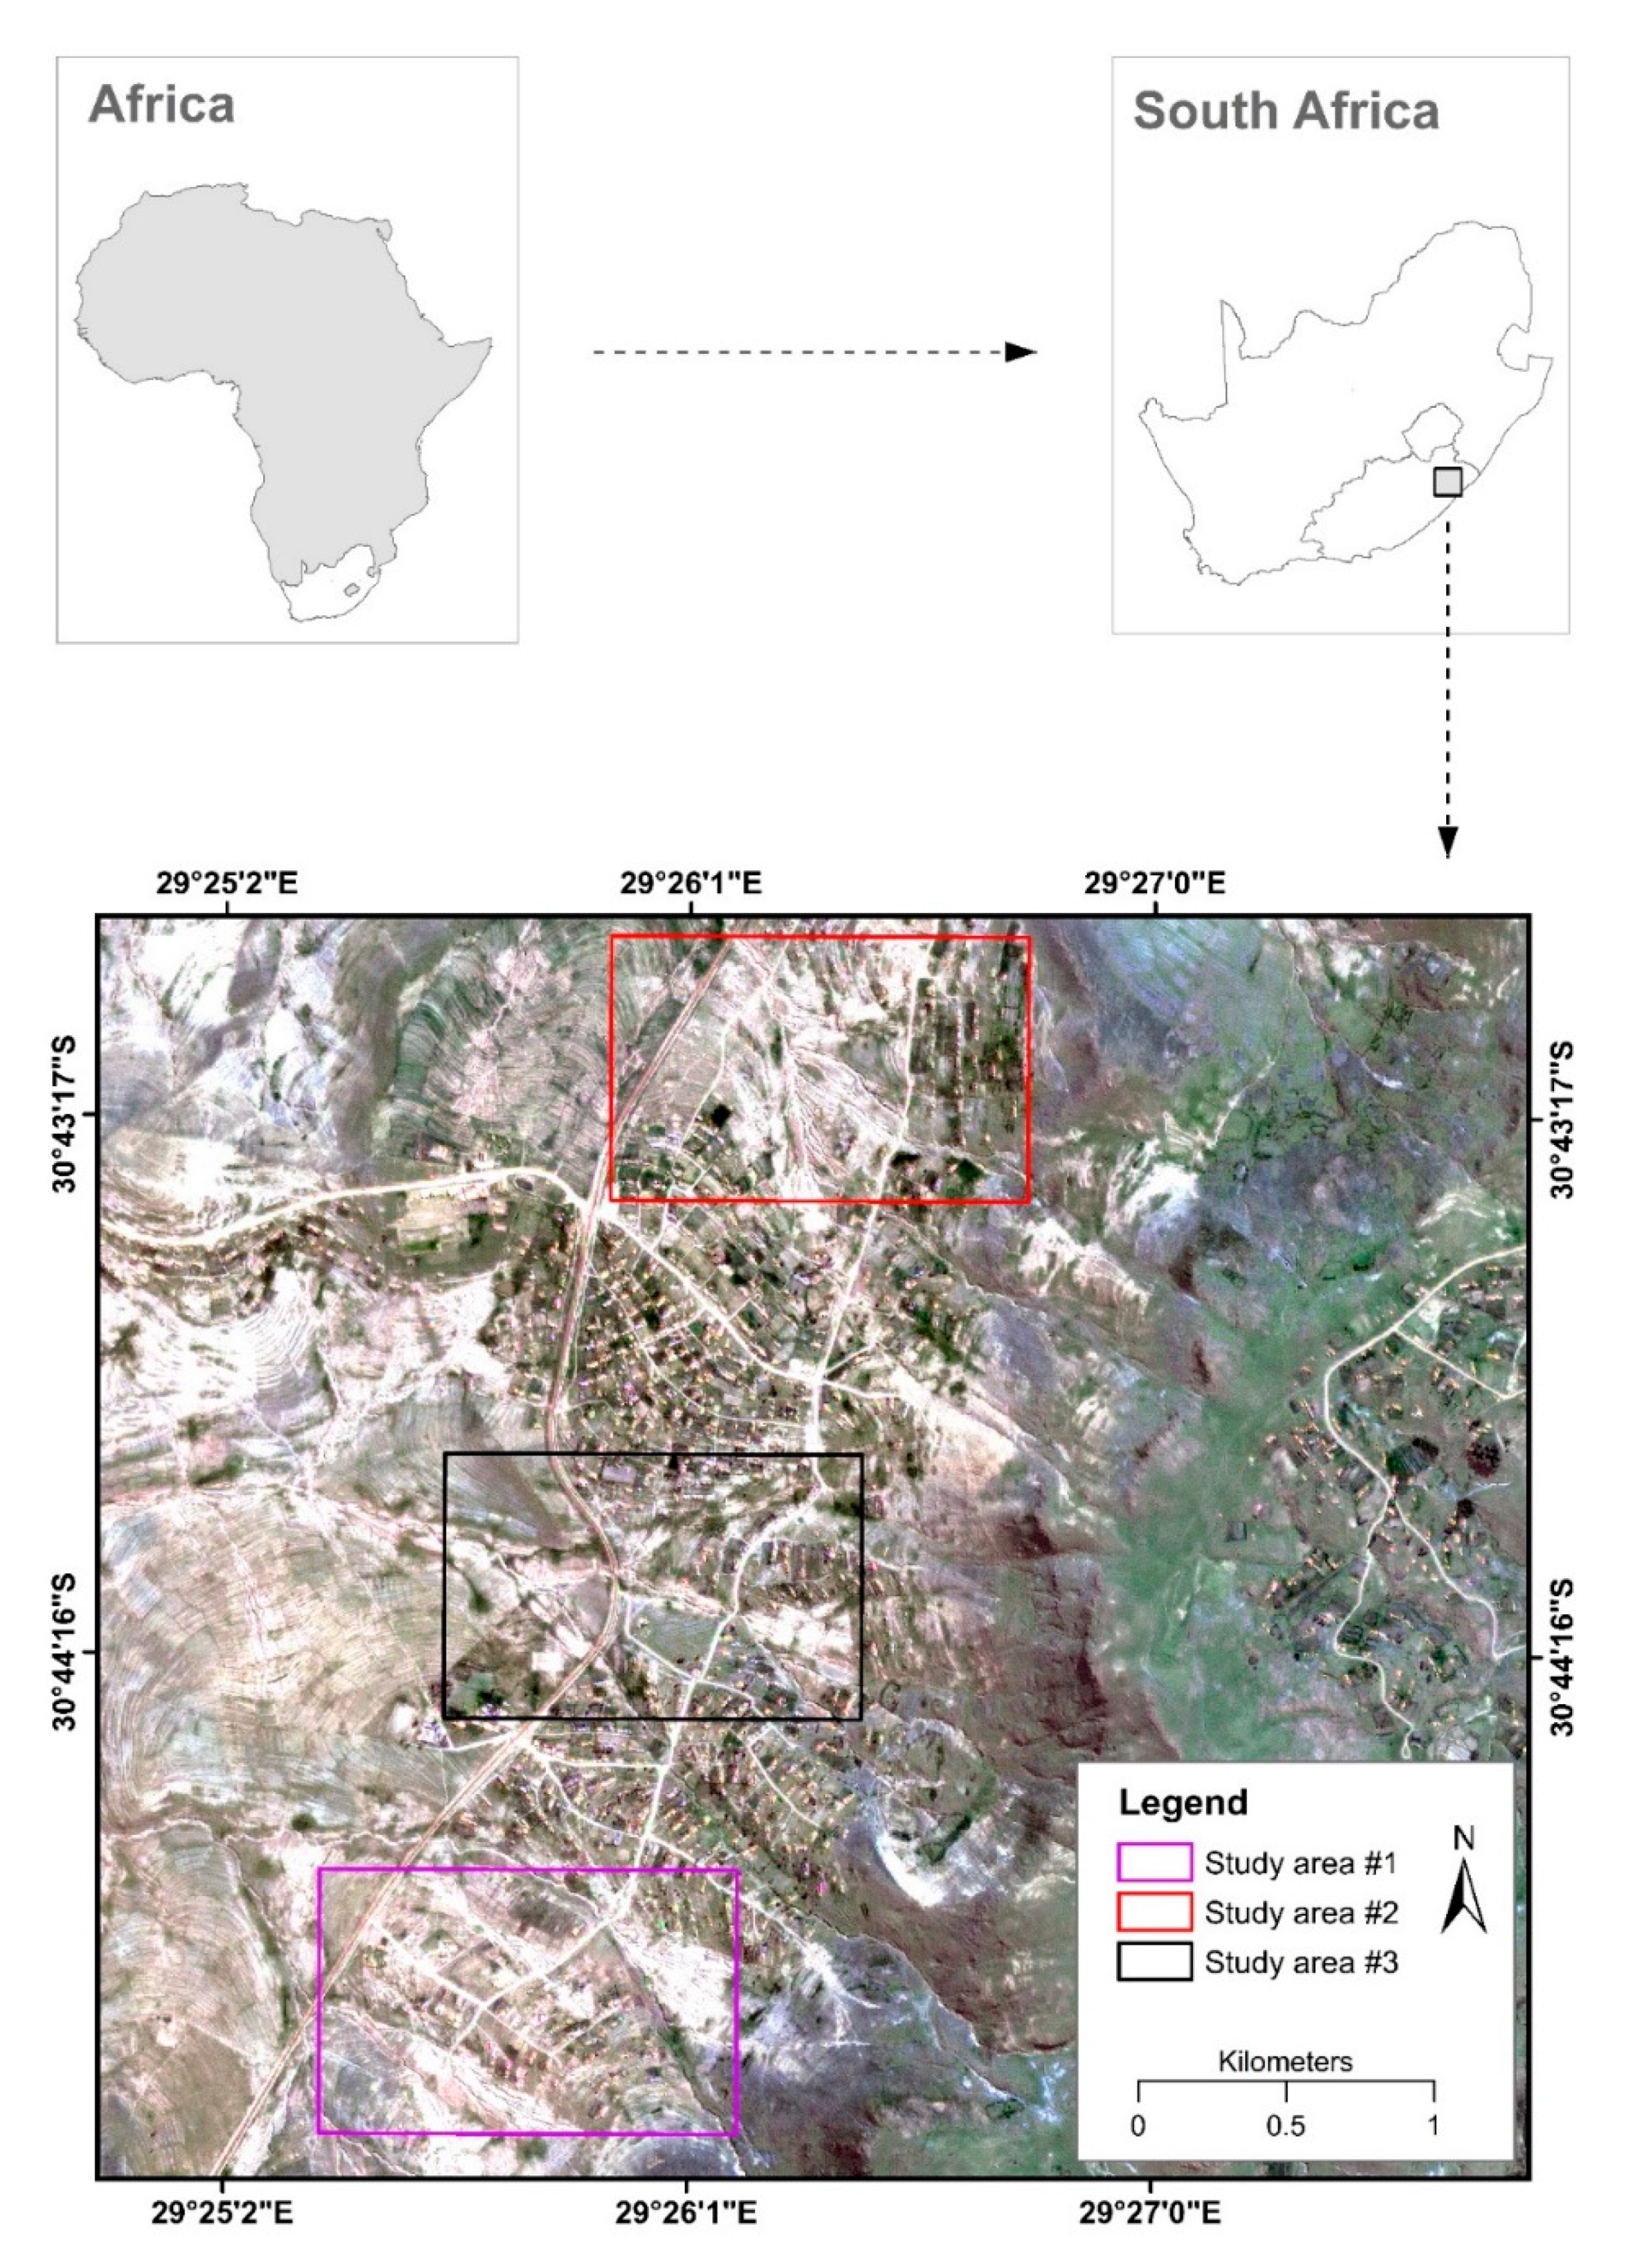
2.1. Study Area
2.2. Data Acquisition and Pre-Processing
2.3. Gully Feature Extraction from Satellite Image
2.3.1. Random Forest (RF)
2.3.2. Support Vector Machines (SVM)
2.3.3. Linear Discriminant Analysis (LDA)
2.4. Reference Data Collection and Accuracy Assessment
2.5. Statistical Evaluation
3. Results
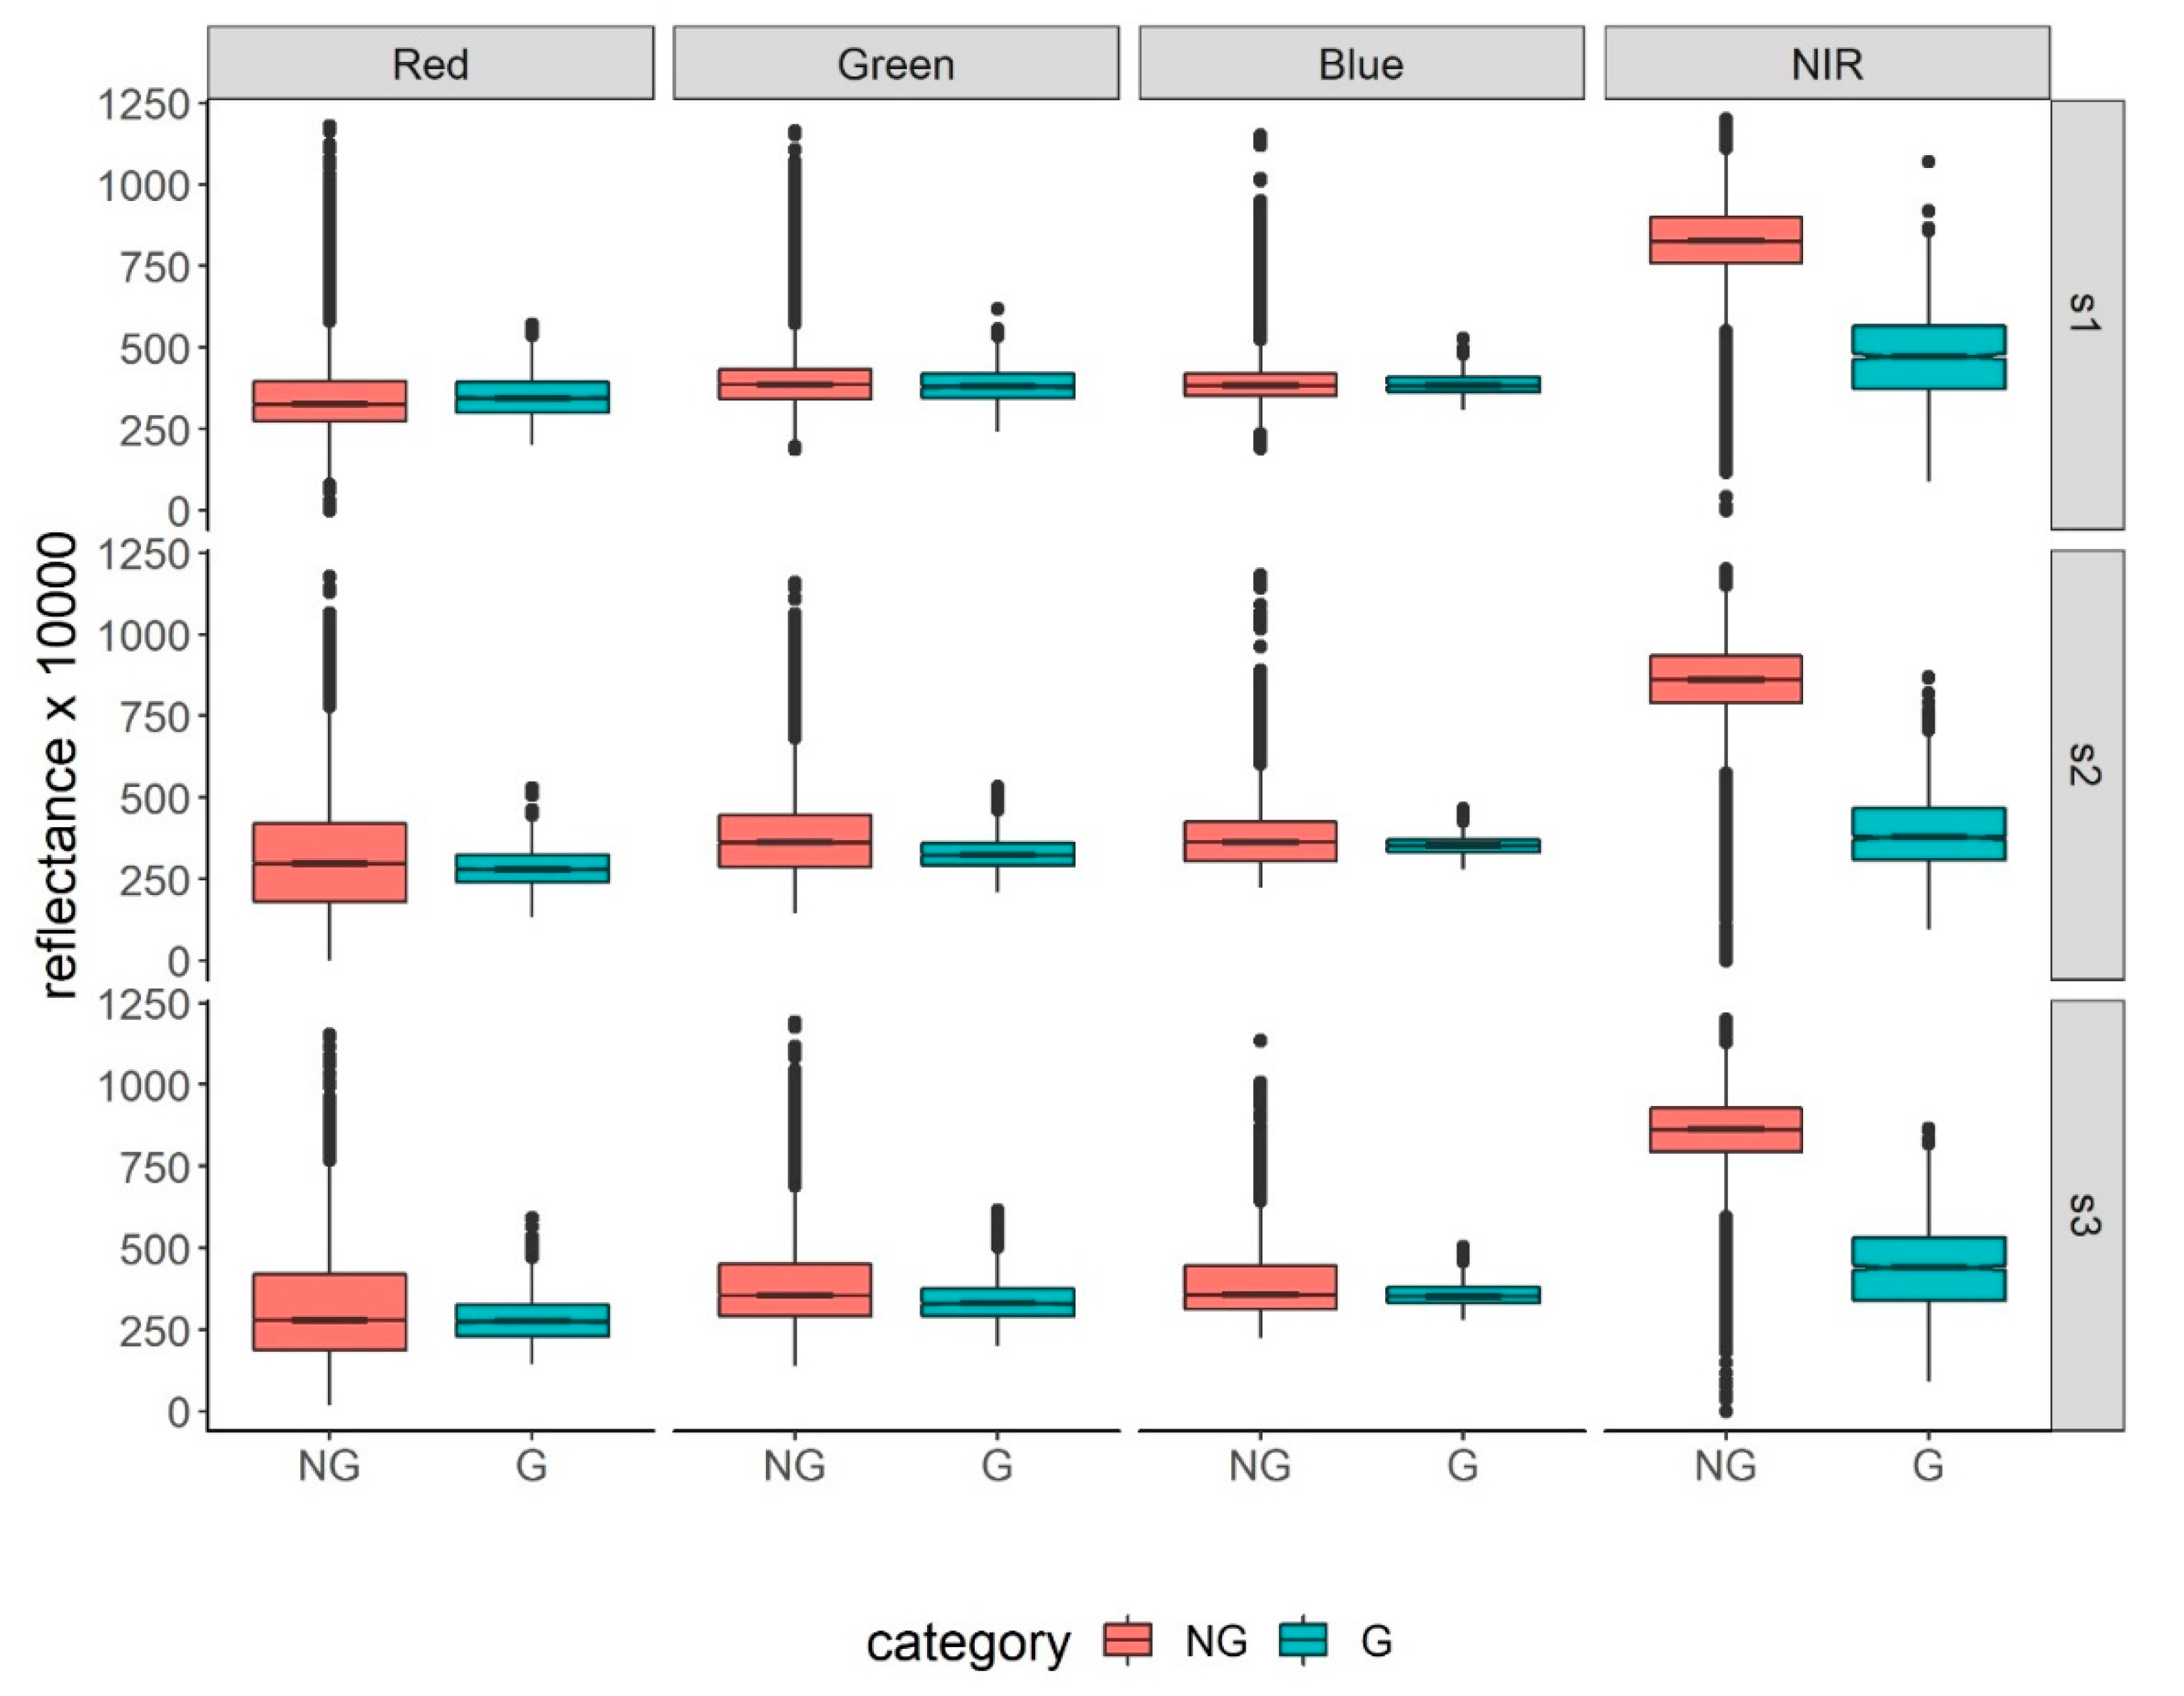
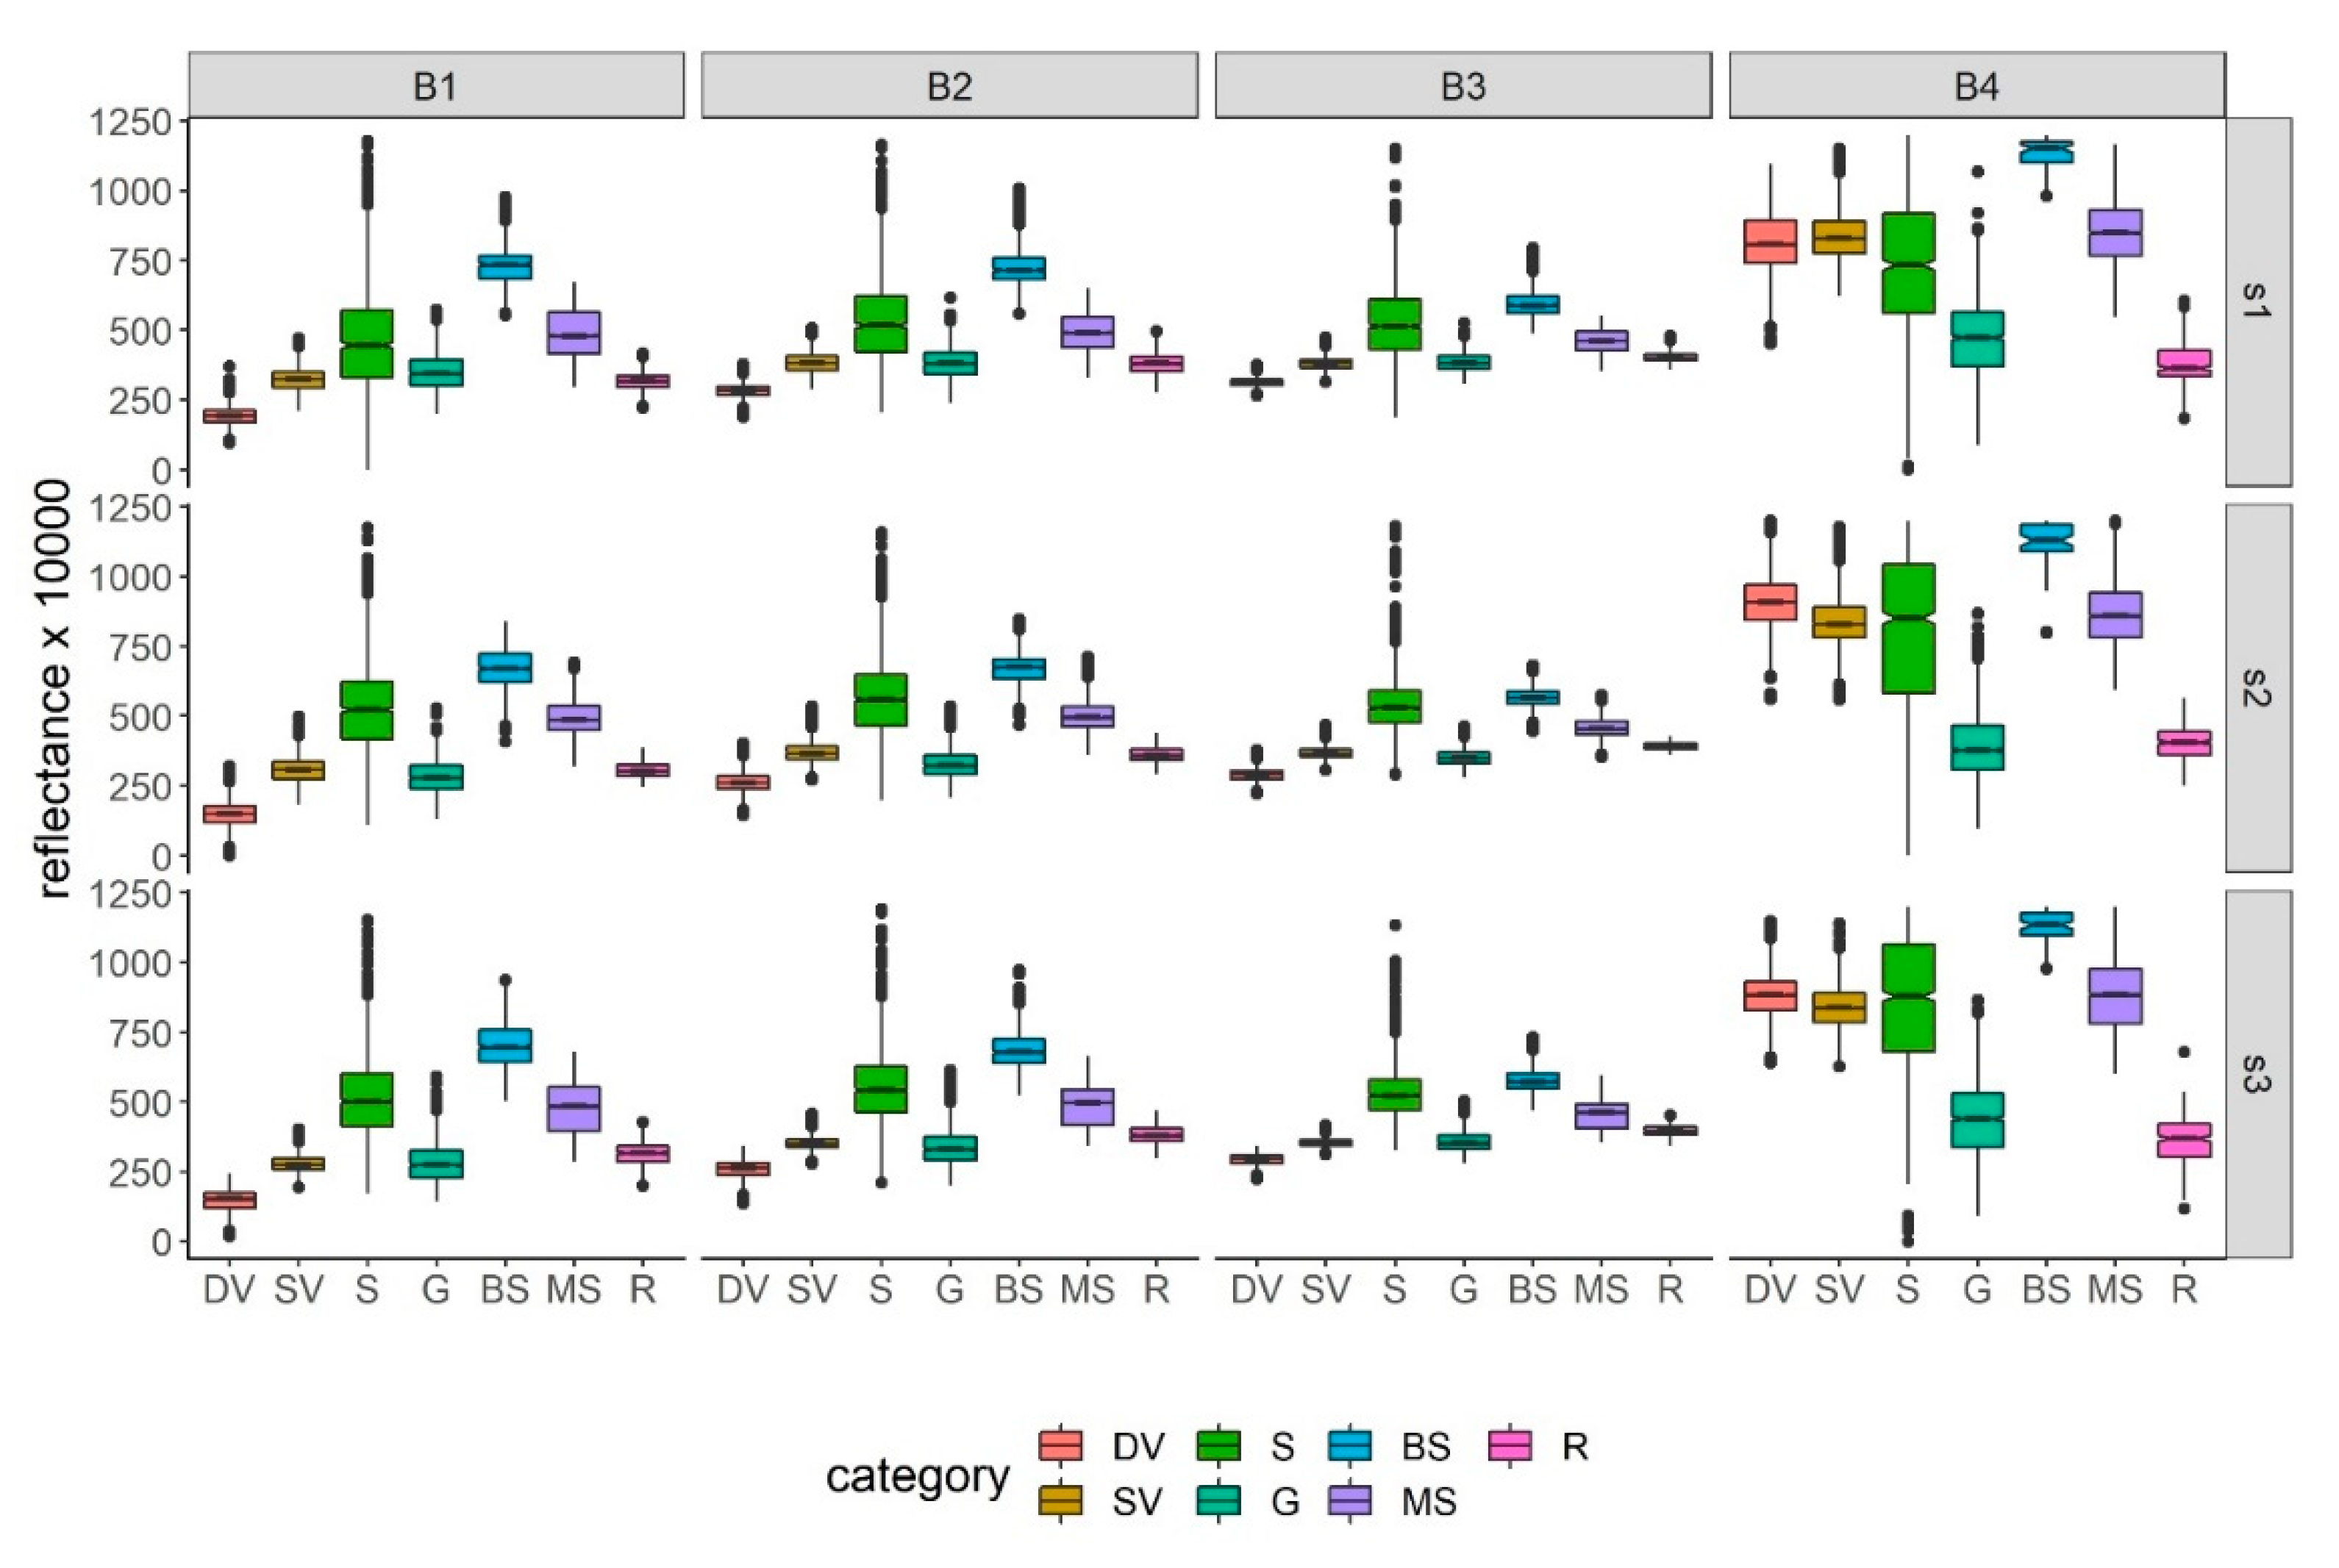
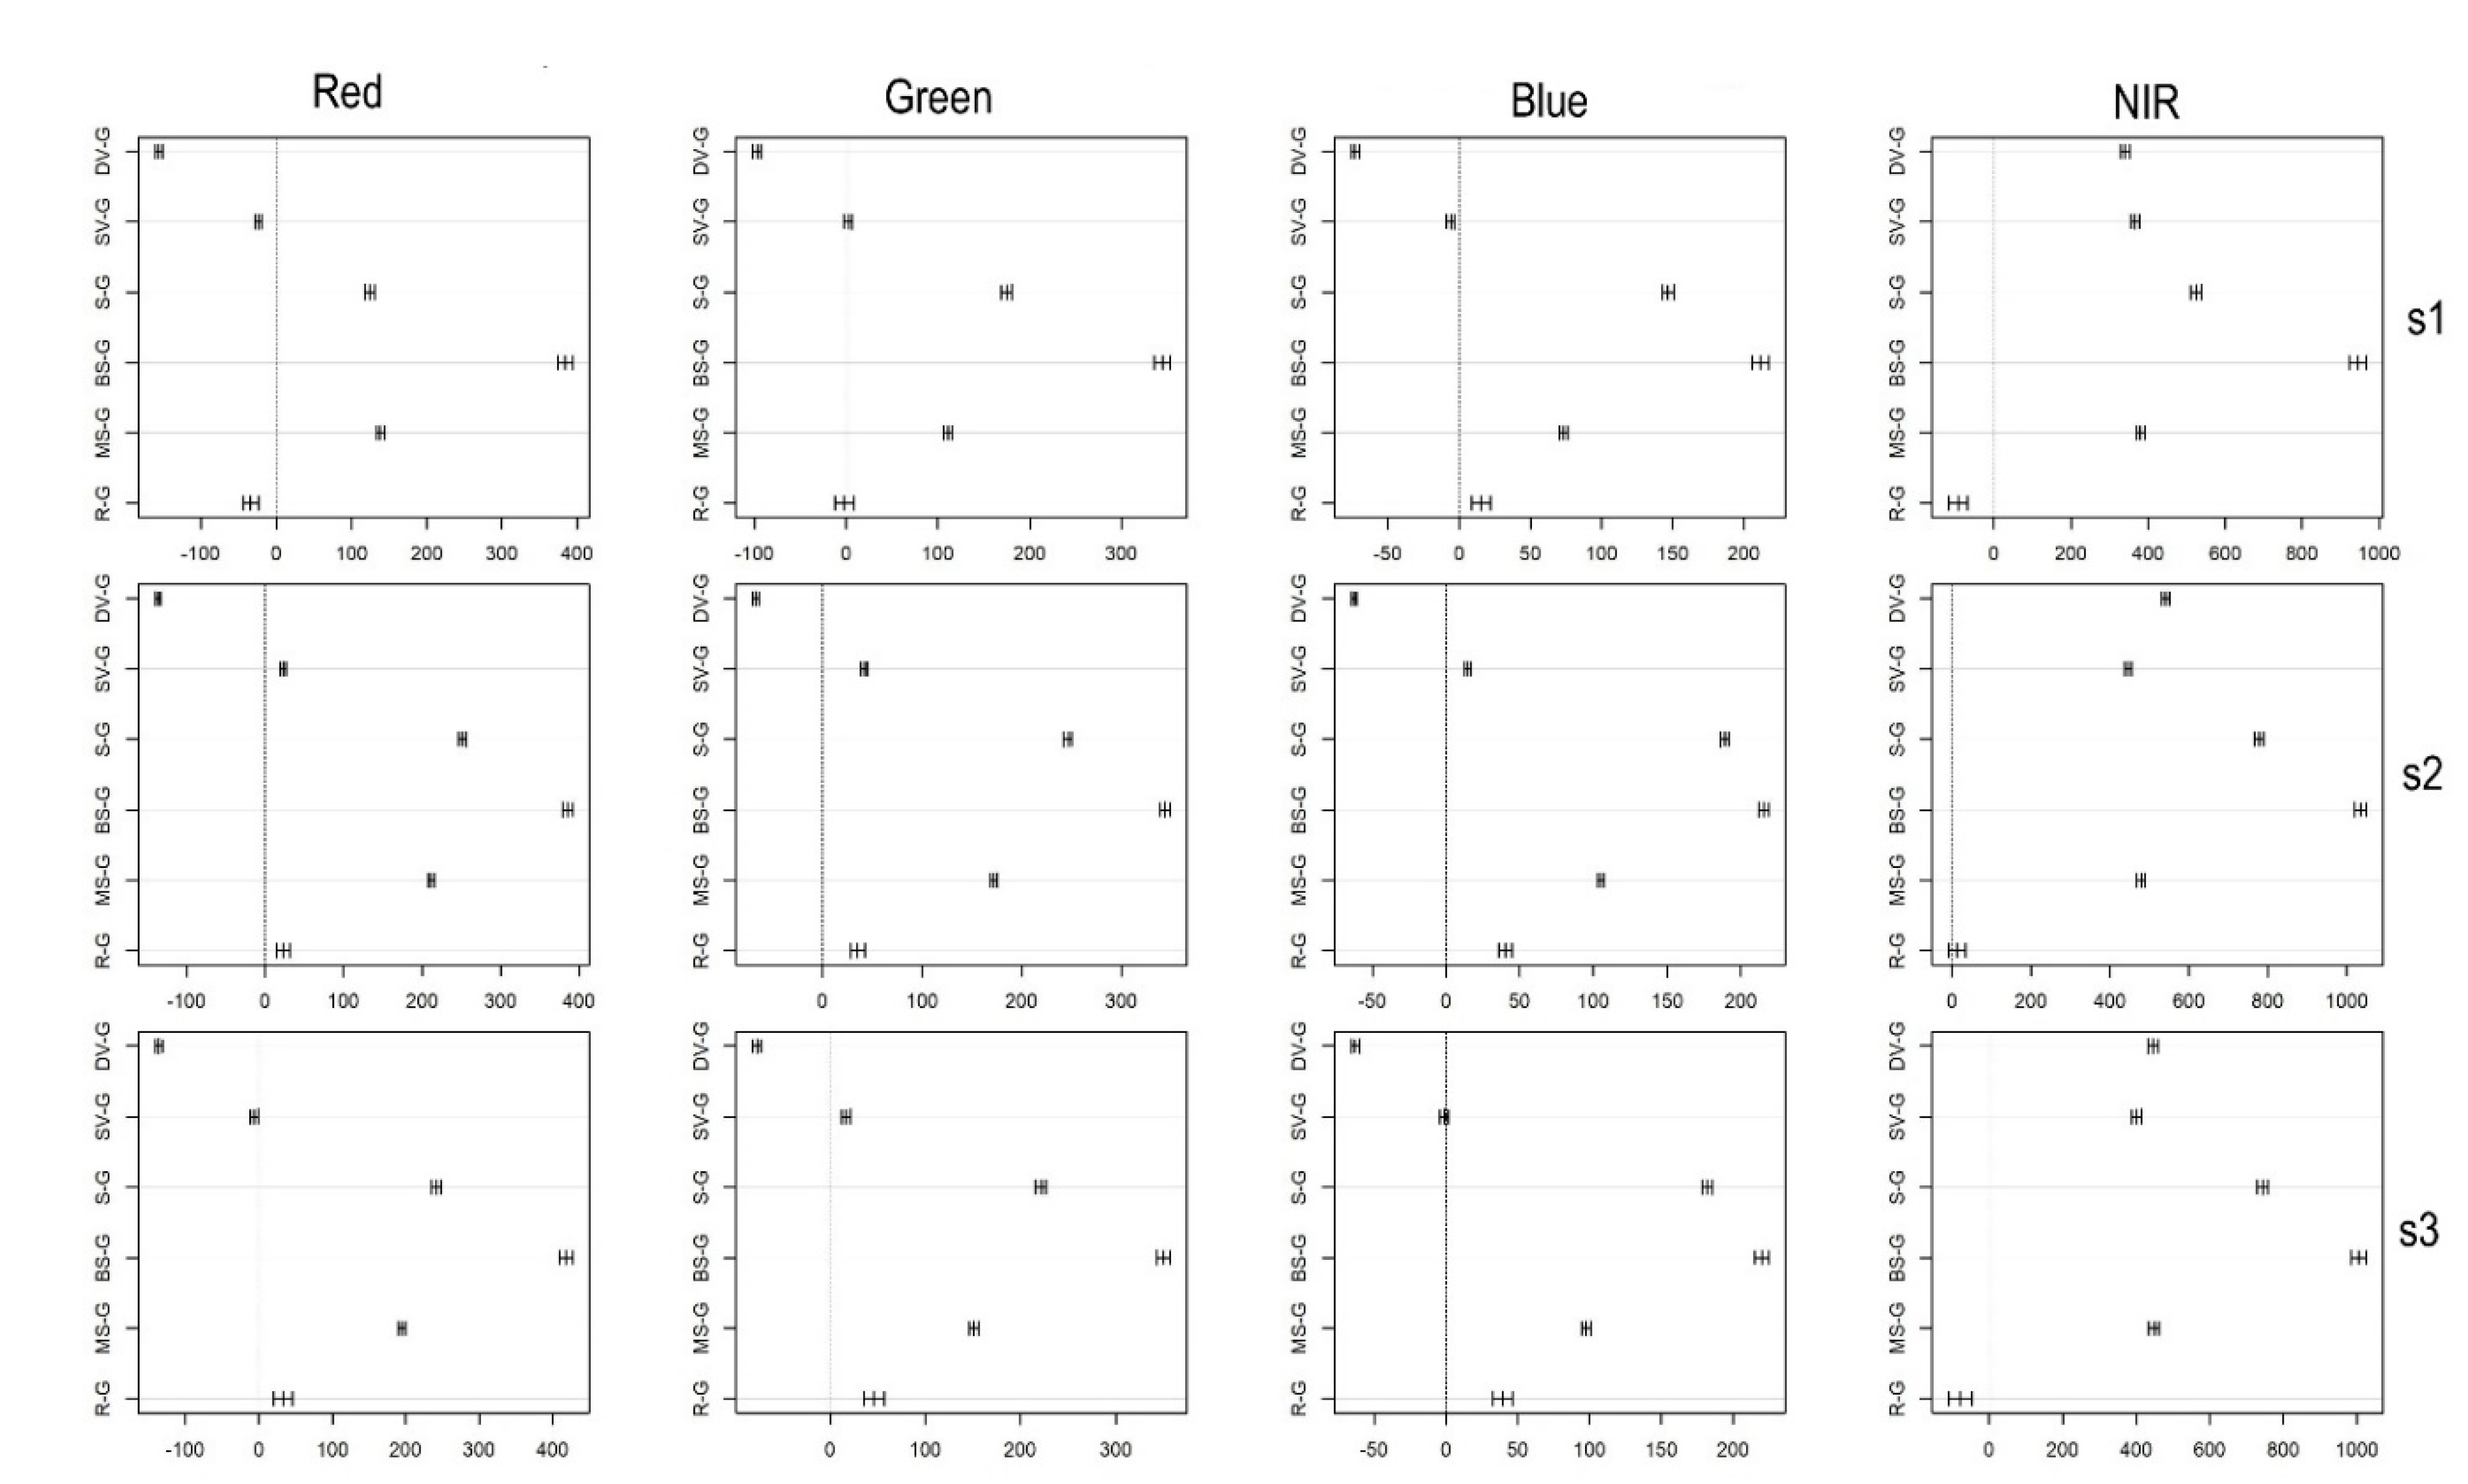
3.1. Differences in Reflectance Values
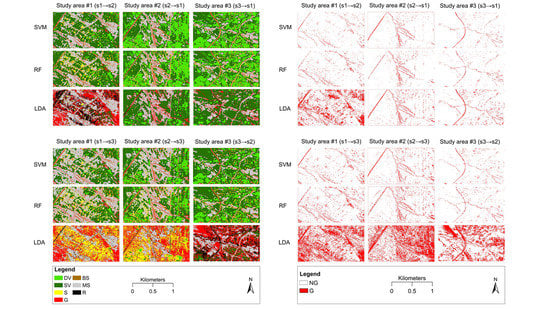
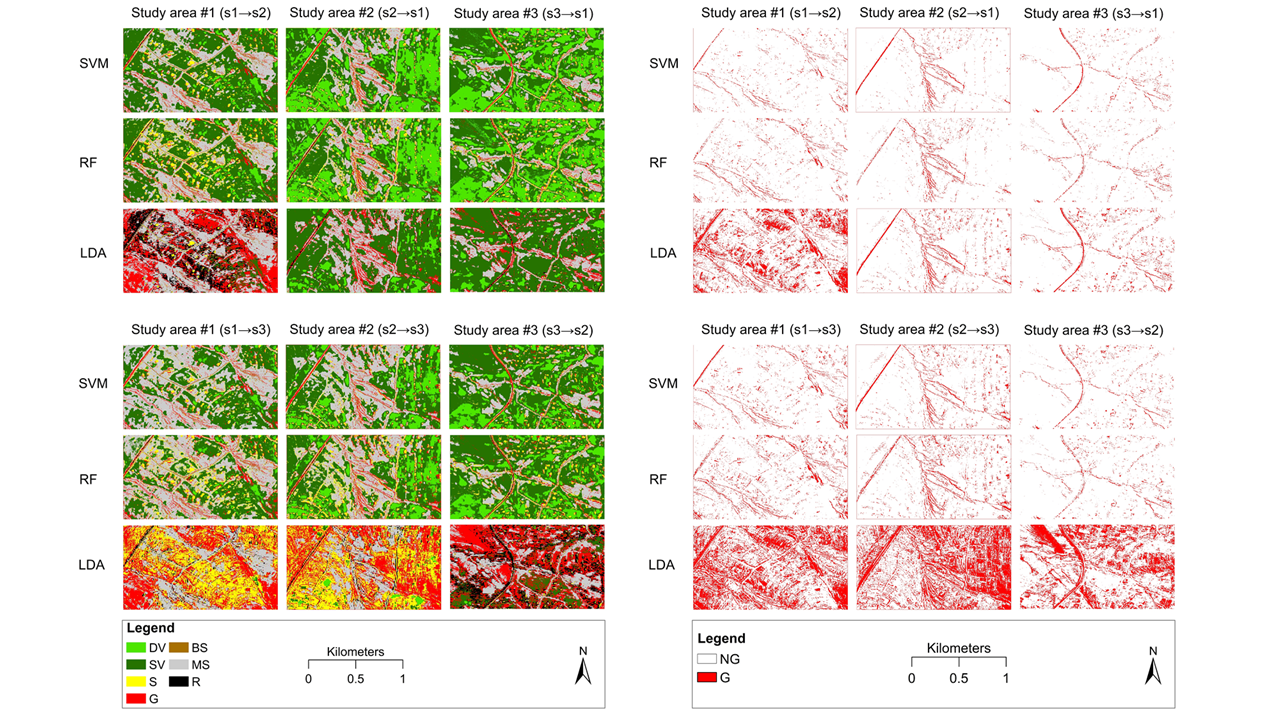
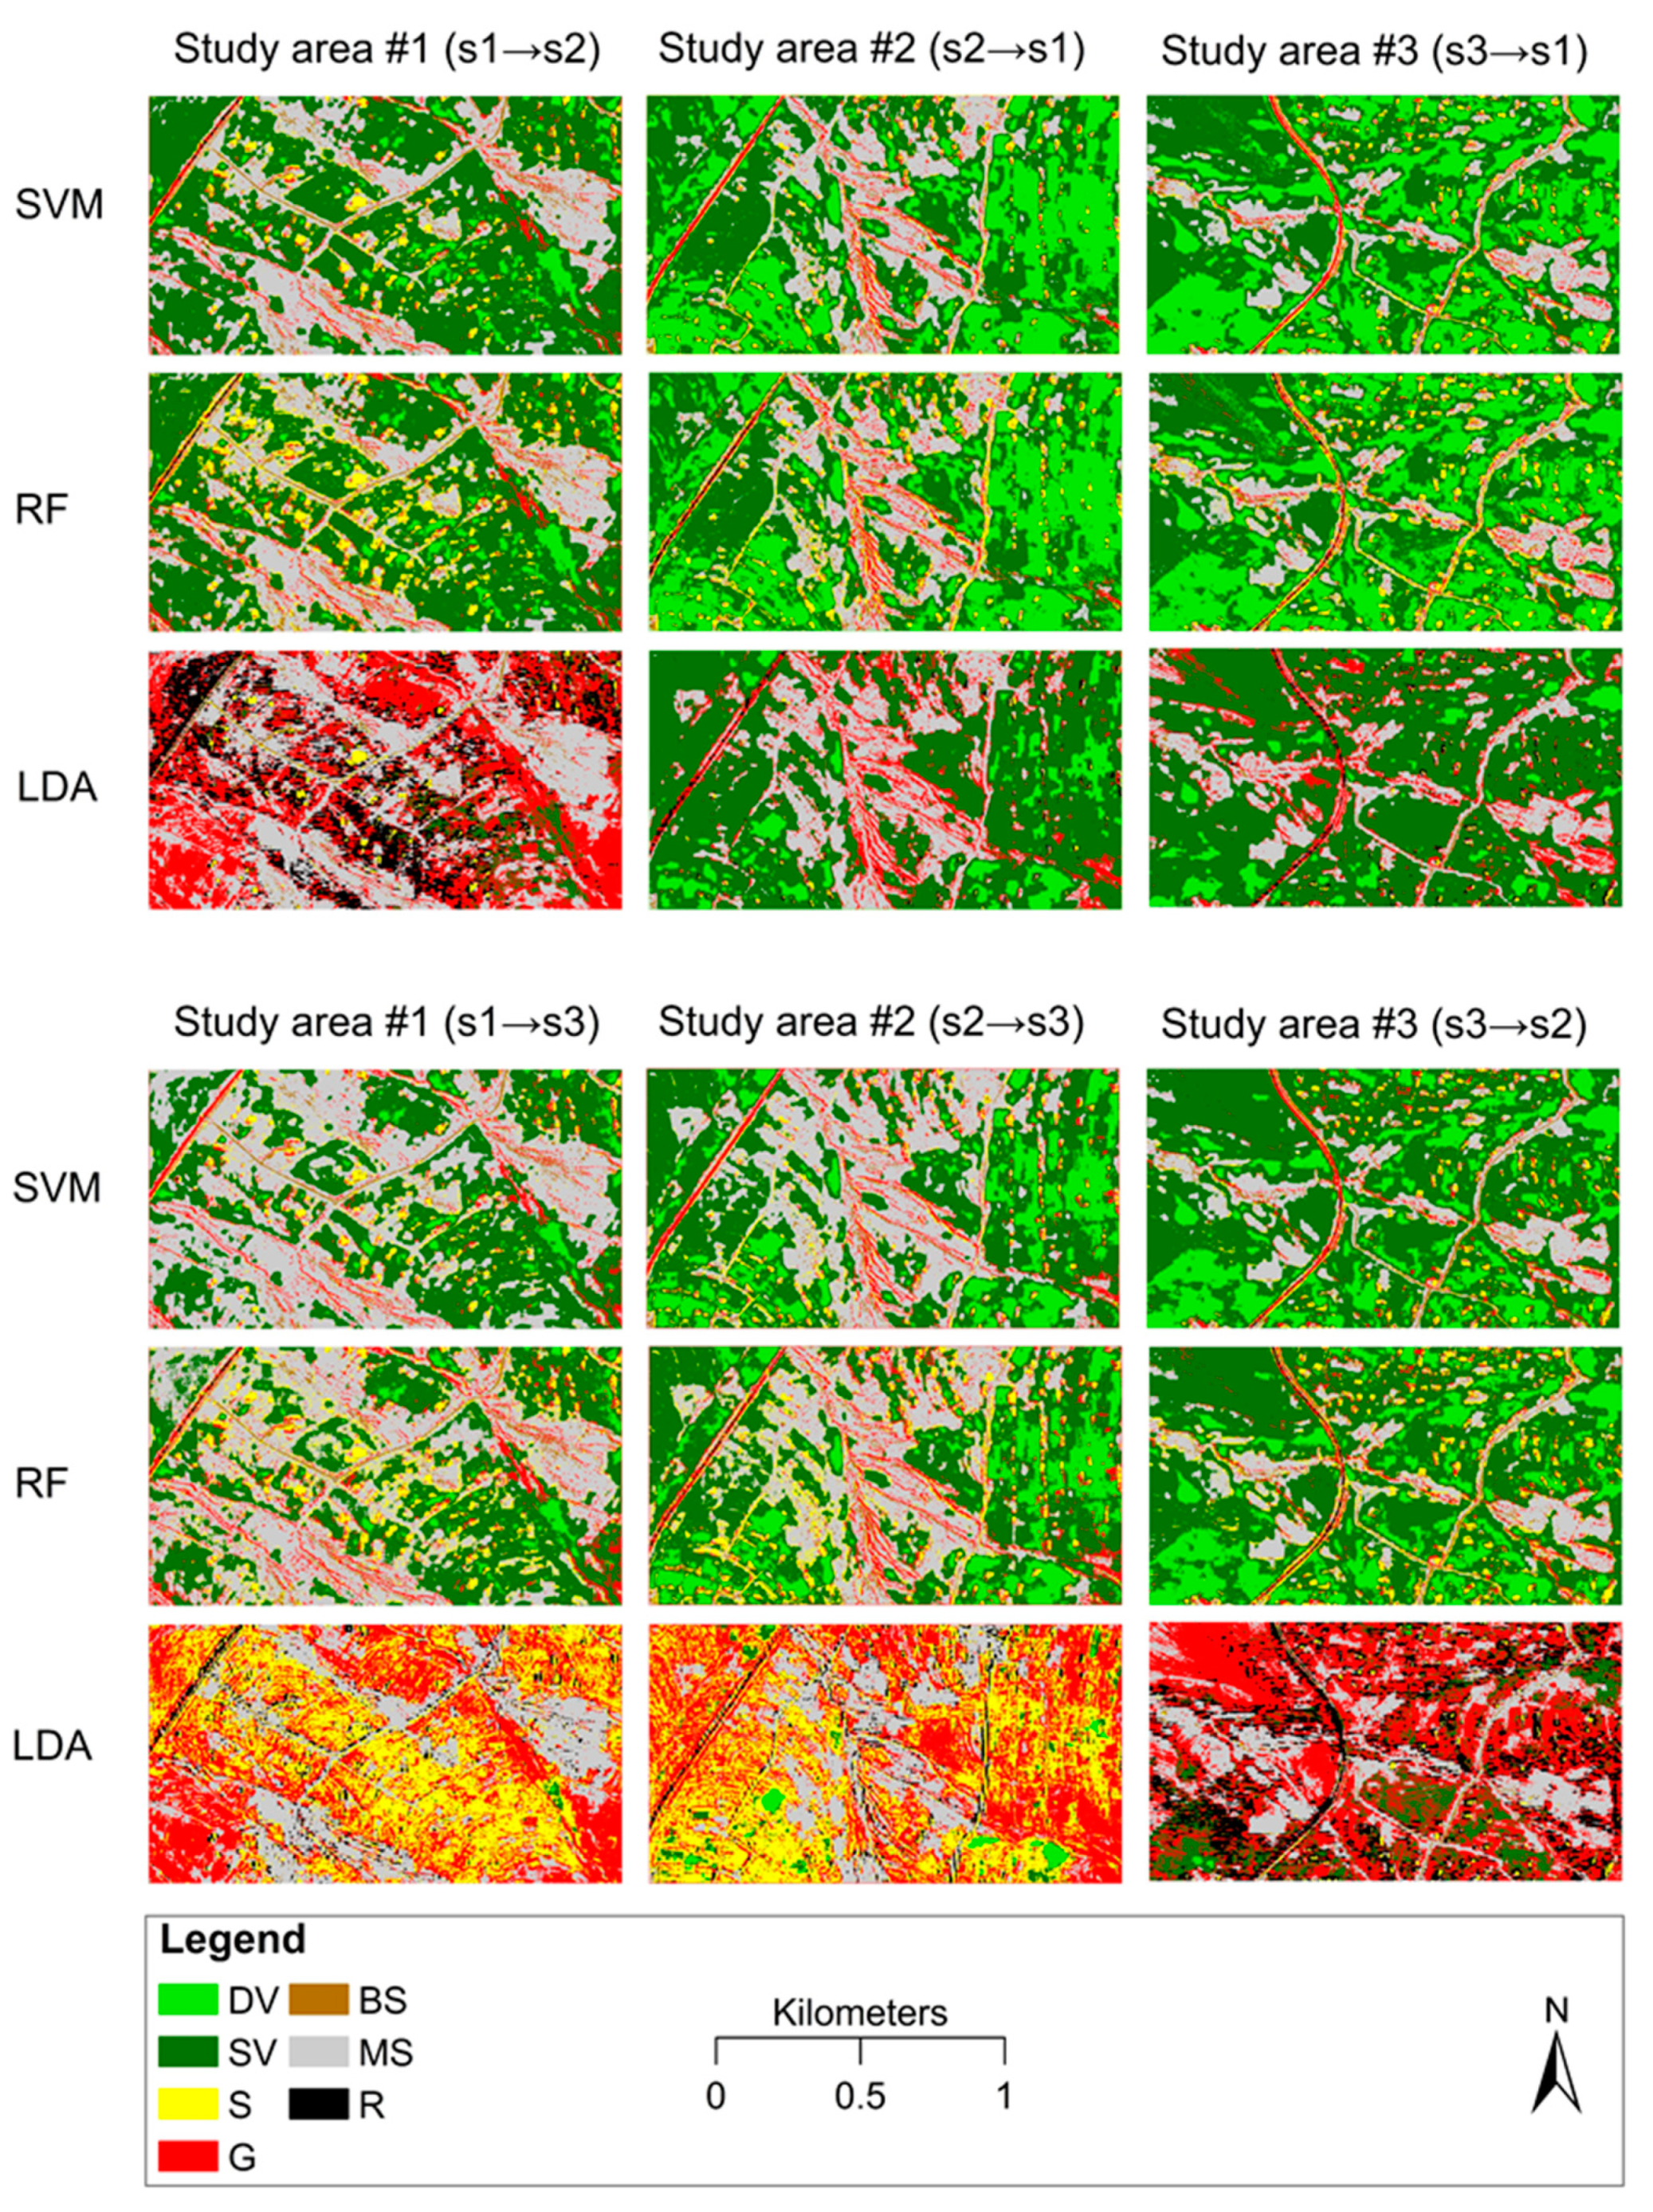
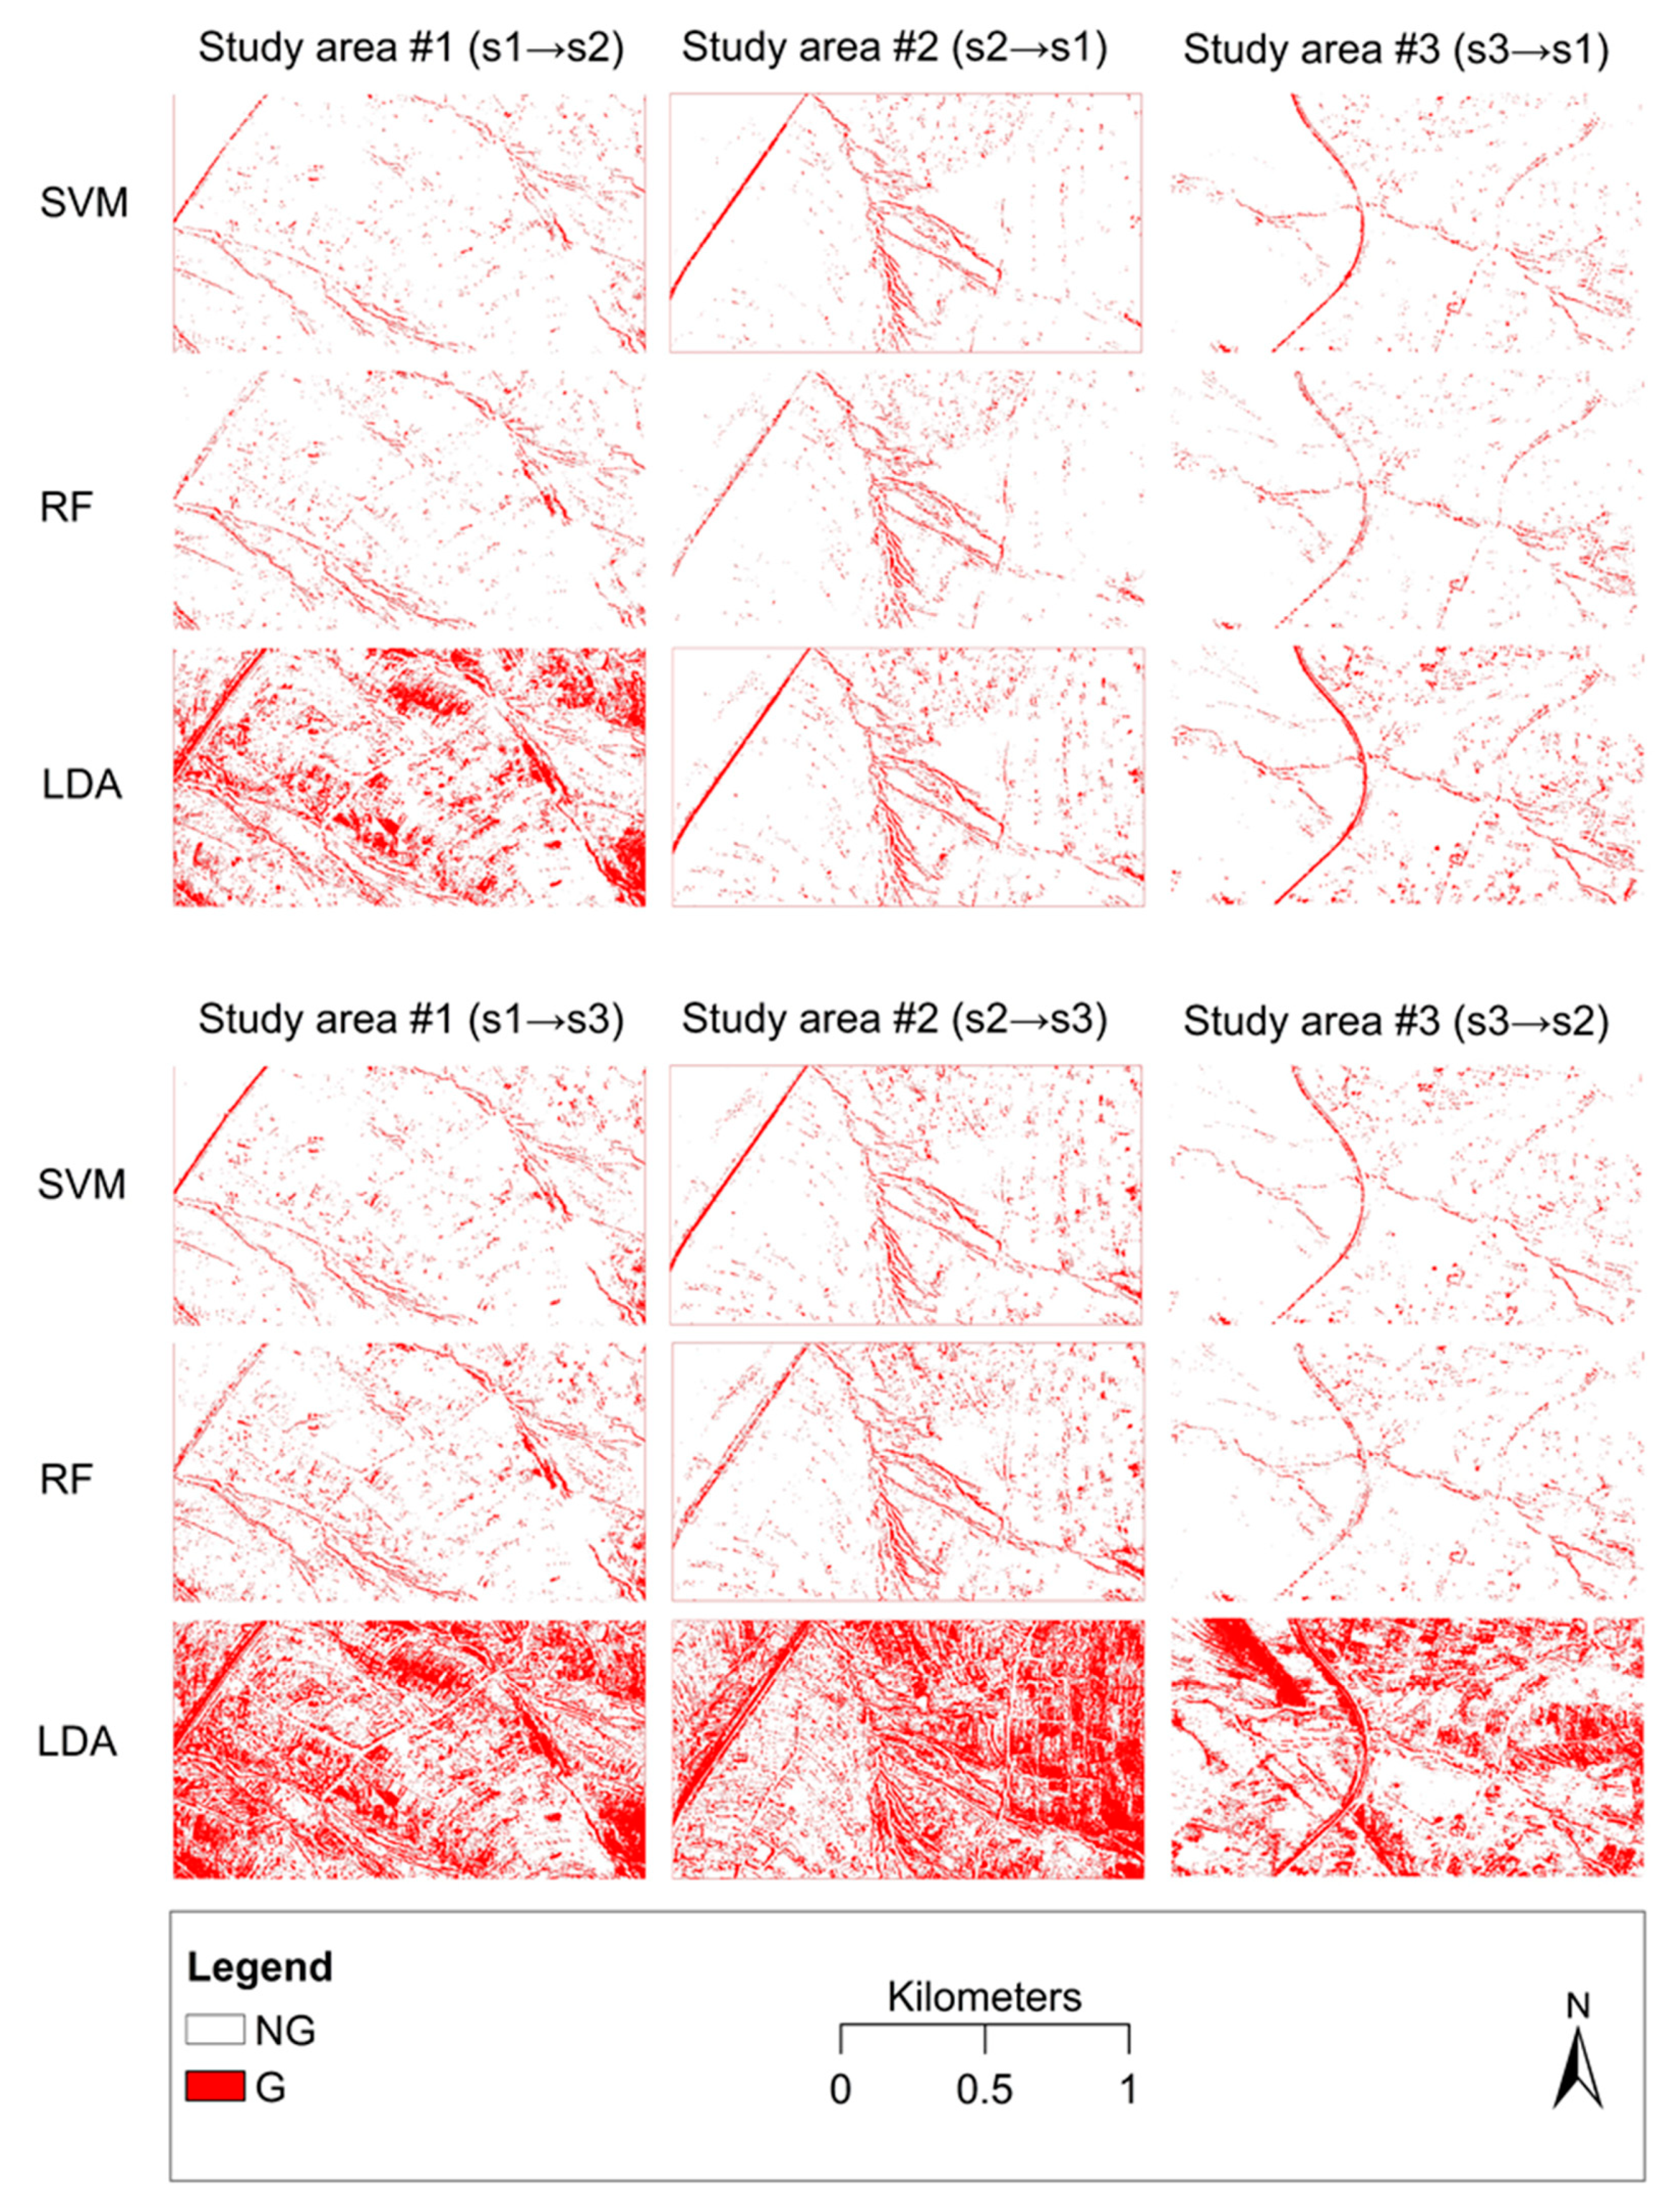
3.2. Gully Feature Extraction
3.3. Overall Model Performance Evaluation
3.4. Model Performance Evaluation on Class Level
3.5. Statistical Evaluation of Factors Biasing Class Level Performance
4. Discussion
5. Conclusions
- Despite having a small number of bands (RGB and NIR), the pan-sharpened product from SPOT-7 multispectral image successfully discriminated gullies (with OAs >95%).
- Repeated k-fold cross-validation was an efficient tool to analyze the representativeness of the reference data as reflected in different classification algorithms. It showed that the binary approach performed better (i.e., higher OAs with narrow interquartile ranges) with all classifiers than the multiclass approach.
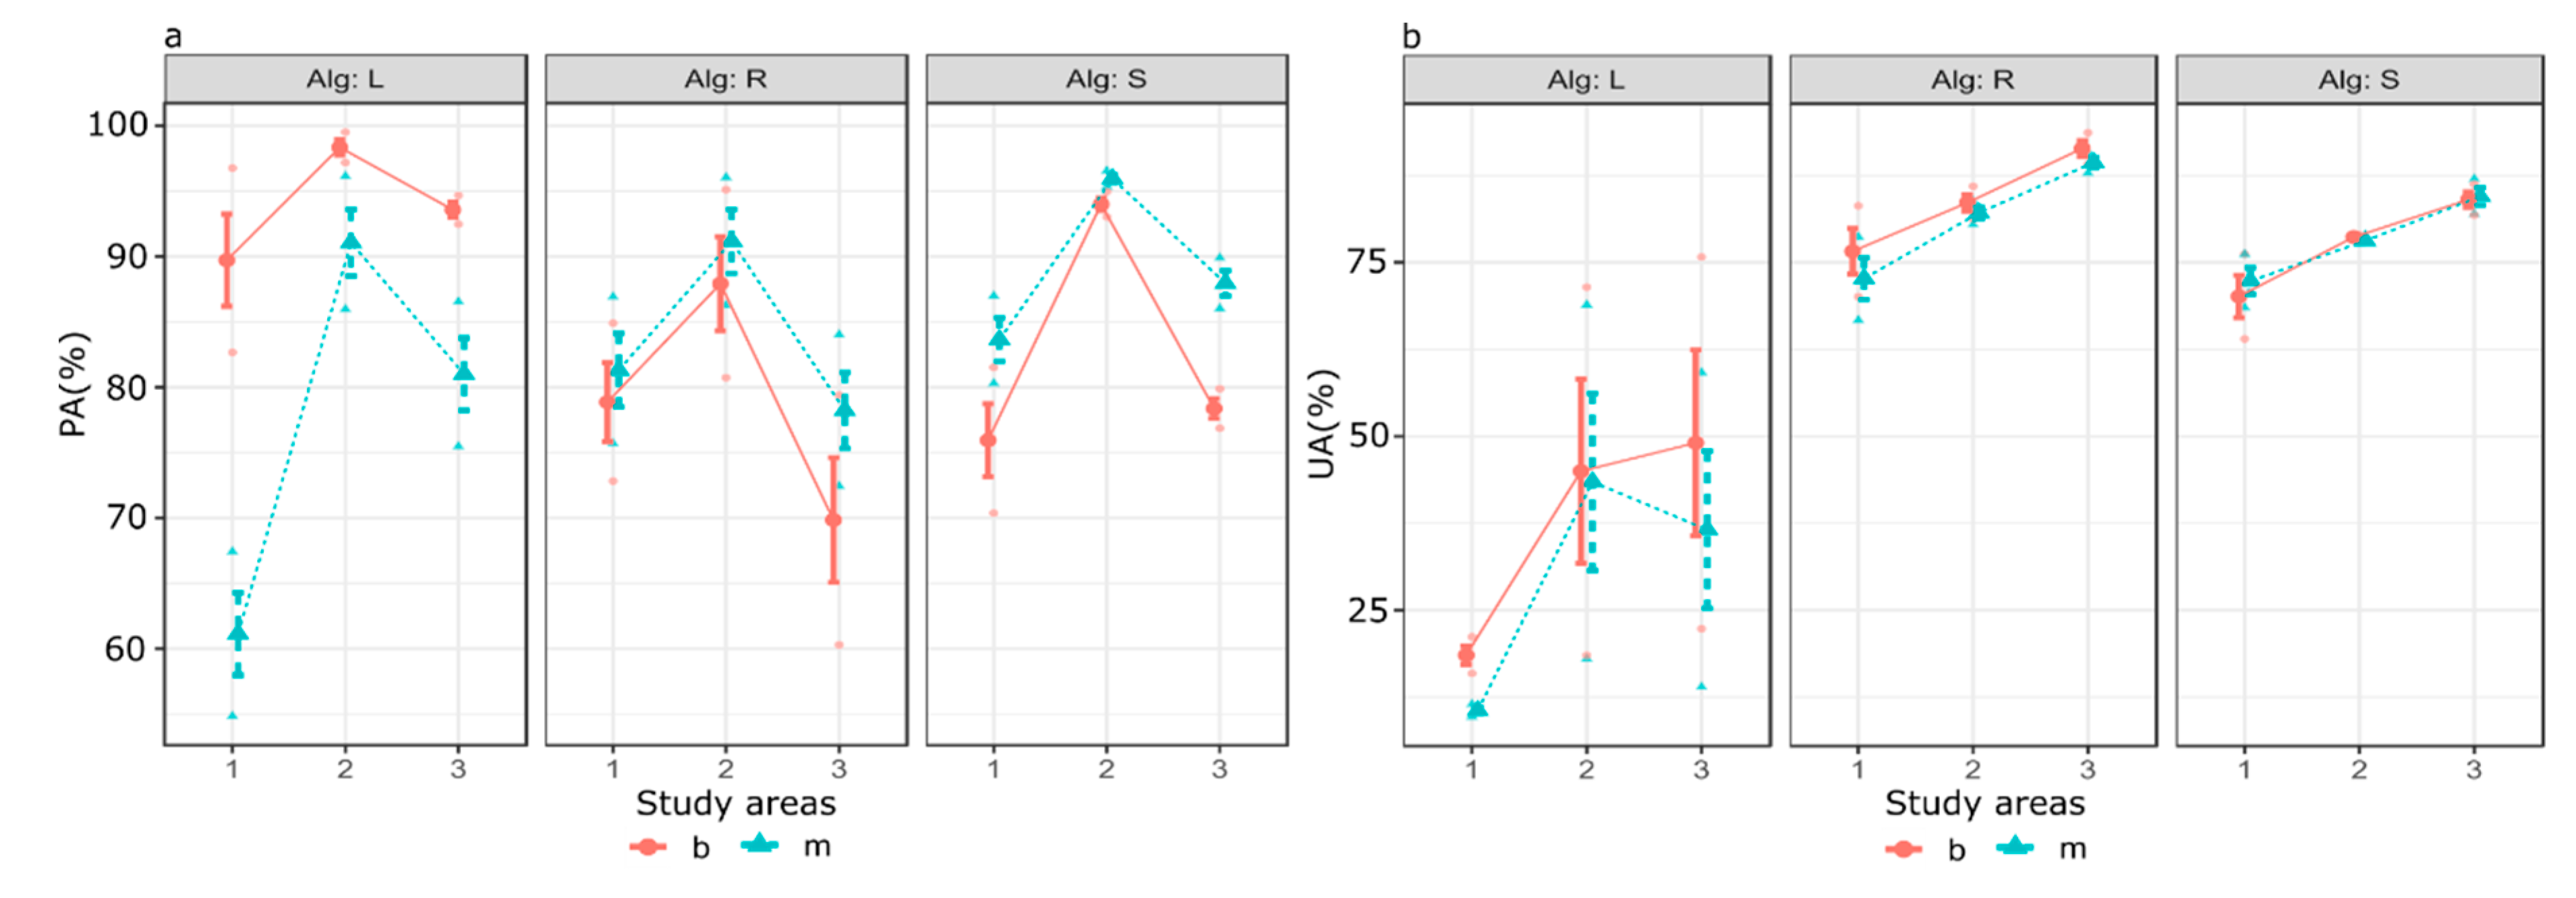
- GLM effectively identified the biasing factors of a given class, in this case gullies, accuracy metrics (PA and UA), with the option of statistical interaction Accordingly, we revealed that algorithms performed differently with the binary or multiclass approach in case of PA, while there was no interaction in case of UA, i.e., the number of classes did not influence UAs in the function of different classifiers.
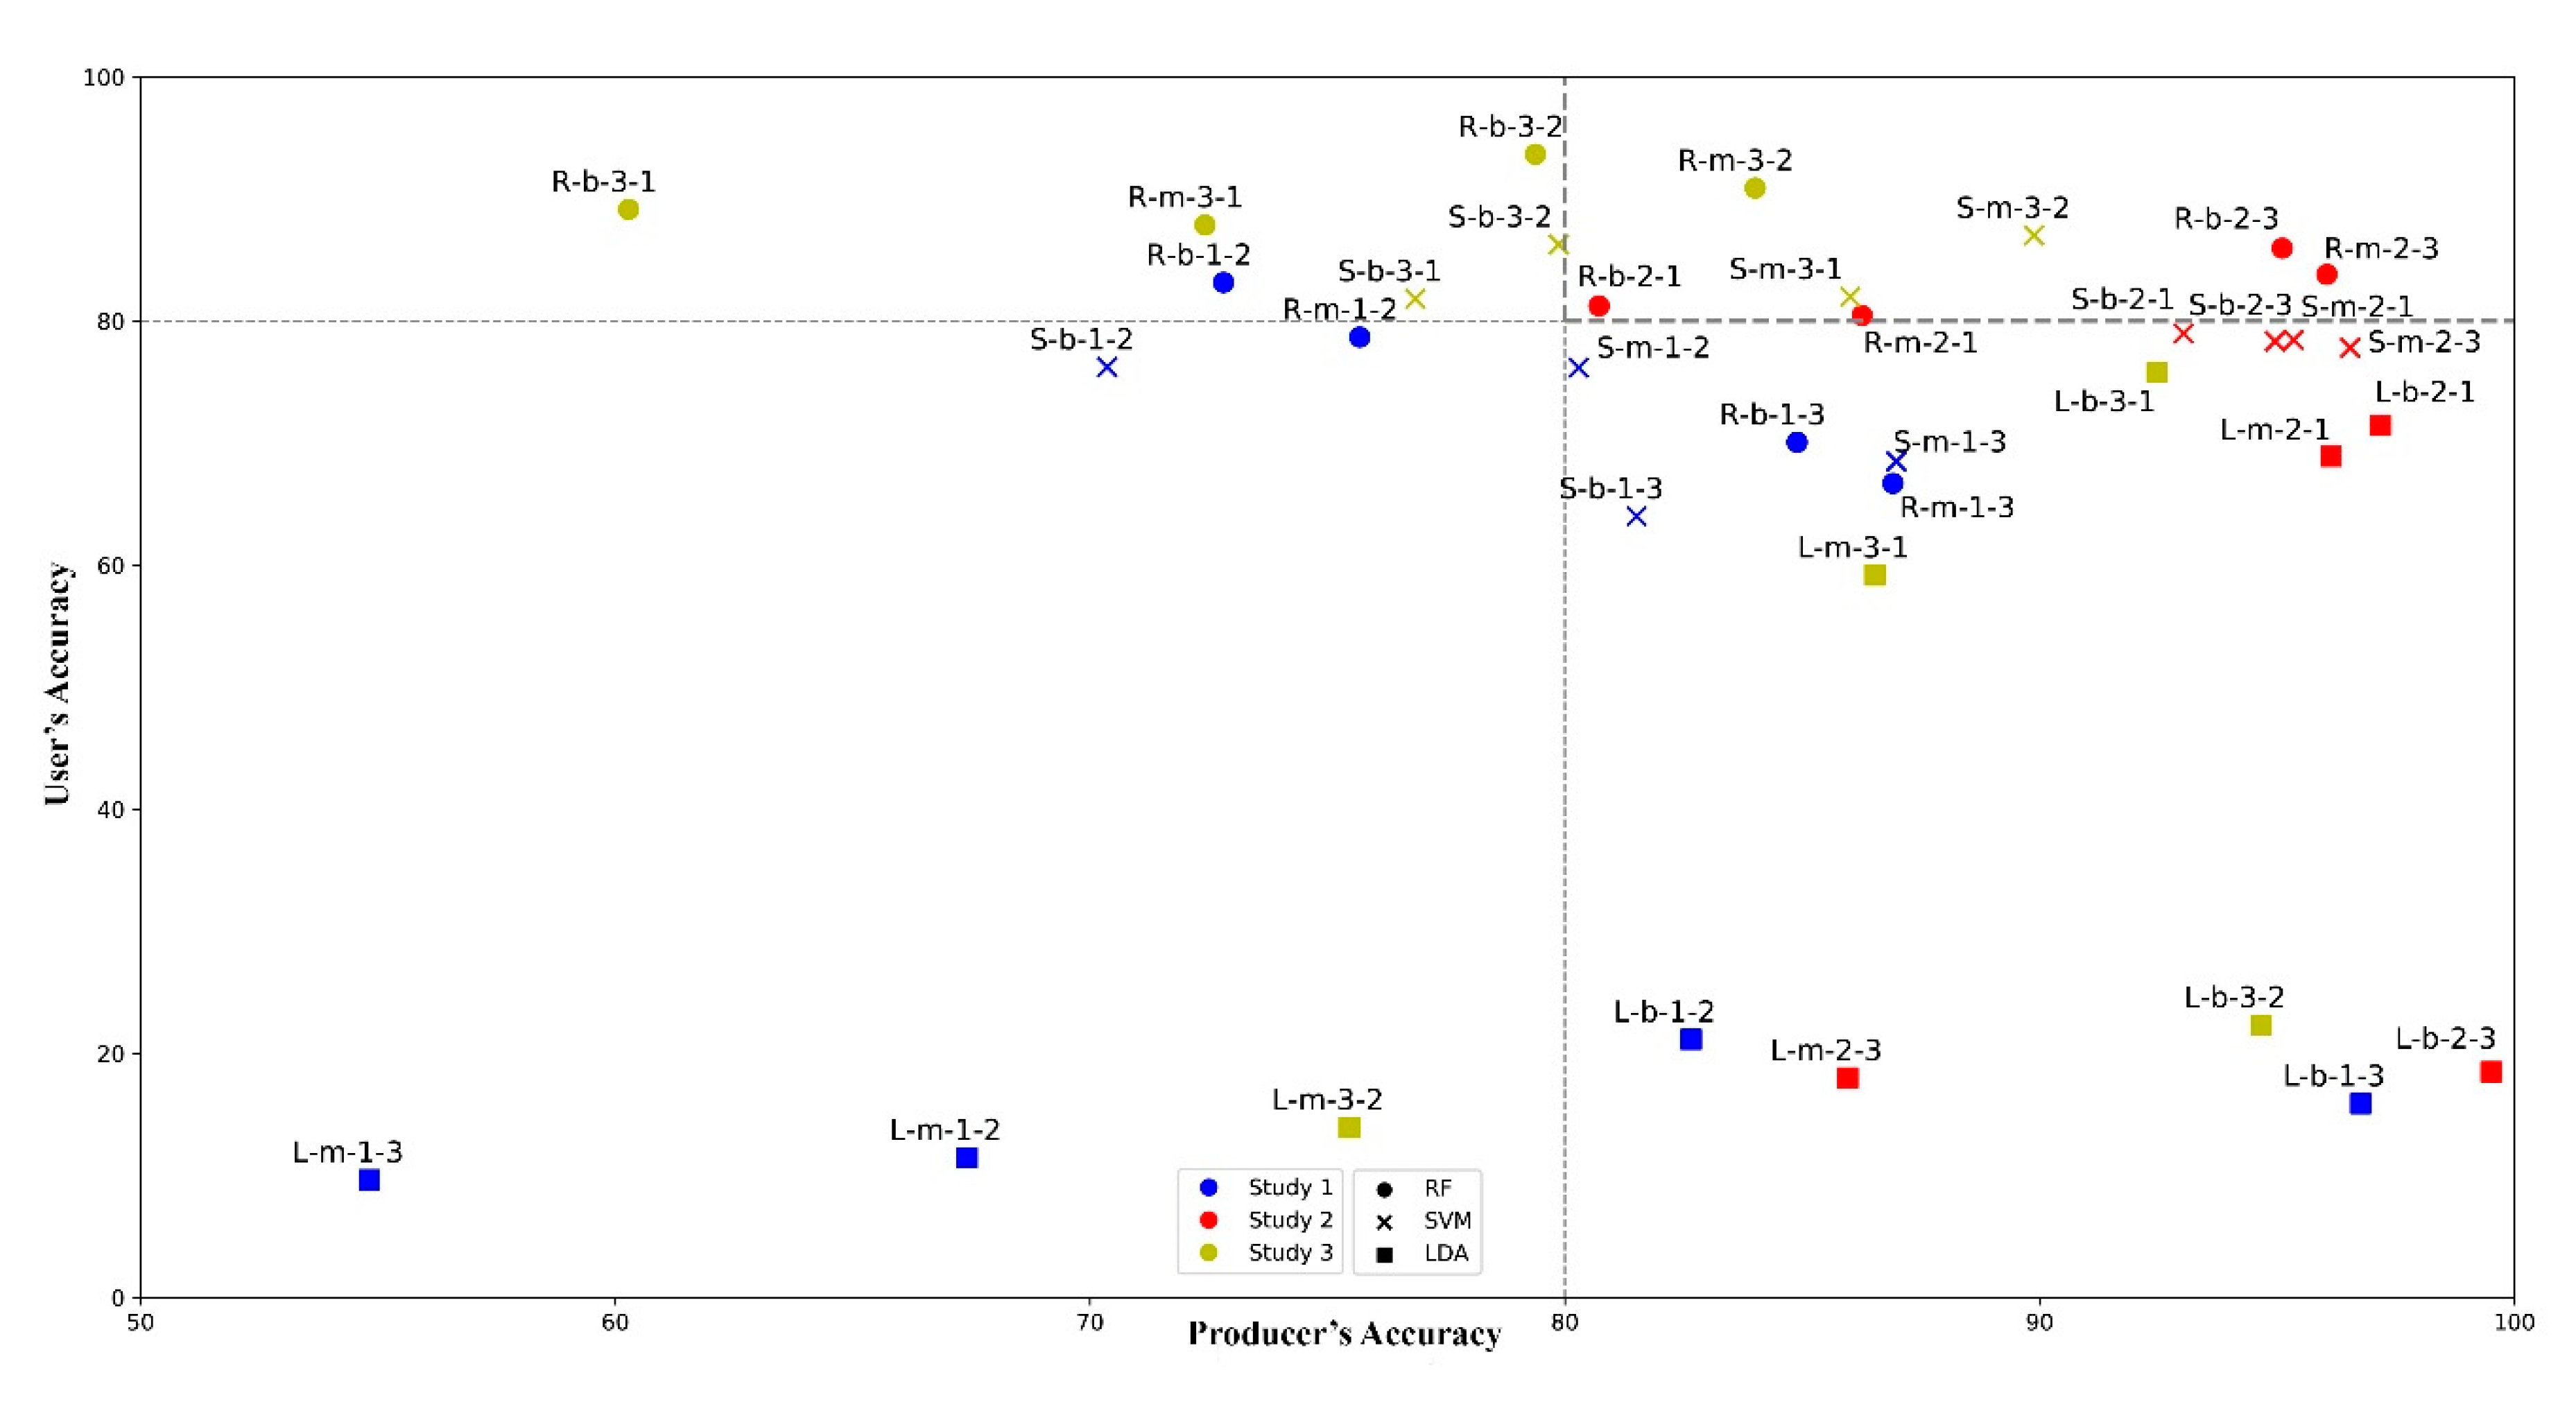
- LDA can accurately identify gullies at least from the PA’s perspective, but had usually low corresponding UA values.
- SVM and RF showed better performance compared to LDA in identifying gullies, usually with >80% of PA and UA in different areas.
Author Contributions
Funding
Acknowledgments
Conflicts of Interest
References
- FAO Soil Erosion: The Gratest Challenge for Sustainable Soil Management. Available online: http://www.fao.org/3/ca4395en/ca4395en.pdf (accessed on 13 January 2020).
- Valentin, C.; Poesen, J.; Li, Y. Gully erosion: Impacts, factors and control. Catena 2005, 63, 132–153. [Google Scholar] [CrossRef]
- Blake, W.H.; Rabinovich, A.; Wynants, M.; Kelly, C.; Nasseri, M.; Ngondya, I.; Patrick, A.; Mtei, K.; Munishi, L.; Boeckx, P.; et al. Soil erosion in East Africa: An interdisciplinary approach to realising pastoral land management change. Environ. Res. Lett. 2018, 13, 1–12. [Google Scholar] [CrossRef]
- Rodrigo-Comino, J.; Neumann, M.; Remke, A.; Ries, J.B. Assessing environmental changes in abandoned german vineyards. Understanding key issues for restoration management plans. Hung. Geogr. Bull. 2018, 67, 319–332. [Google Scholar] [CrossRef]
- Kakembo, V.; Rowntree, K.M. The relationship between land use and soil erosion in the communal lands near Peddie town, Eastern Cape, South Africa. L. Degrad. Dev. 2003, 14, 39–49. [Google Scholar] [CrossRef]
- Gholami, V. The influence of deforestation on runoff generation and soil erosion (Case study: Kasilian Watershed). J. For. Sci. 2013, 59, 272–278. [Google Scholar] [CrossRef]
- Kertész, A.; Křeček, J. Landscape degradation in the world and in Hungary. Hung. Geogr. Bull. 2019, 68, 201–221. [Google Scholar] [CrossRef]
- Phinzi, K.; Ngetar, N.S. Land use/land cover dynamics and soil erosion in the Umzintlava catchment (T32E), Eastern Cape, South Africa. Trans. R. Soc. S. Afr. 2019, 74, 223–237. [Google Scholar] [CrossRef]
- Jakab, G.; Szabó, J.; Szalai, Z. A review on sheet erosion measurements in Hungary. J. Landsc. Ecol. 2015, 13, 89–103. [Google Scholar]
- Arabameri, A.; Chen, W.; Loche, M.; Zhao, X.; Li, Y.; Lombardo, L.; Cerda, A.; Pradhan, B.; Bui, D.T. Comparison of machine learning models for gully erosion susceptibility mapping. Geosci. Front. 2019, 1–12. [Google Scholar] [CrossRef]
- Poesen, J.; Vandekerckhove, L.; Nachtergaele, J.; Oostwoud Wijdenes, D.; Verstraeten, G.; van Wesemael, B. Gully erosion in dryland environments. In Dryland Rivers: Hydrology and Geomorphology of Semi-Arid; Bull, L.J., Kirkby, M.J., Eds.; John Wiley & Sons Ltd.: Chichester, UK, 2002; pp. 229–262. [Google Scholar]
- Takken, I.; Croke, J.; Lane, P. Thresholds for channel initiation at road drain outlets. Catena 2008, 75, 257–267. [Google Scholar] [CrossRef]
- Zgłobicki, W.; Baran-Zgłobicka, B.; Gawrysiak, L.; Telecka, M. The impact of permanent gullies on present-day land use and agriculture in loess areas (E. Poland). Catena 2015, 126, 28–36. [Google Scholar] [CrossRef]
- Garland, G.G.; Hoffman, M.T.; Todd, S. Soil Degradation: A National Review of Land Degradation in South Africa; South African National Biodiversity Institute: Pretoria, South Africa, 2000; pp. 69–107. [Google Scholar]
- Hoffman, T.; Ashwell, A. Nature Divided: Land Degradation in South Africa; University of Cape Town Press: Lansdowne, South Africa, 2001; p. 179. [Google Scholar]
- De Villiers, M.C.; Nell, J.P.; Barnard, R.O.; Henning, A. Salt-Affected Soils: South Africa. Available online: https://www.researchgate.net/profile/Anoop_Srivastava7/post/I_am_looking_for_a_recent_soil_salinity_map_of_Africa/attachment/59d654de79197b80779ac3f2/AS:523166767423489@1501744085582/download/faosodicrza+%283%29.doc (accessed on 15 February 2020).
- Phinzi, K.; Ngetar, N.S. Mapping soil erosion in a quaternary catchment in Eastern Cape using geographic information system and remote sensing. S. Afr. J. Geomatics 2017, 6, 11–29. [Google Scholar] [CrossRef]
- Campbell, J.B.; Wynne, R.H. Introduction to Remote Sensing; Guilford Press: New York, NY, USA, 2011; p. 718. [Google Scholar]
- Lillesand, T.; Kiefer, R.W.; Chipman, J. Remote Sensing and Image Interpretation, 7th ed.; John Wiley & Sons: New York, NY, USA, 2015; p. 768. [Google Scholar]
- Richards, J.A.; Xiuping, J. Remote Sensing Digital Image Analysis: An Introduction, 4th ed.; Springer: Berlin, Germany, 2006; p. 494. [Google Scholar]
- Fulajtár, E. Identification of severely eroded soils from remote sensing data tested in rišňovce, Slovakia. In Proceedings of the 10th International Soil Conservation Meeting, Indianapolis, IN, USA, 24–29 May 1999. [Google Scholar]
- Vrieling, A.; Rodrigues, S.C.; Bartholomeus, H.; Sterk, G. Automatic identification of erosion gullies with ASTER imagery in the Brazilian Cerrados. Int. J. Remote Sens. 2007, 28, 2723–2738. [Google Scholar] [CrossRef]
- D’Oleire-Oltmanns, S.; Marzolff, I.; Tiede, D.; Blaschke, T. Detection of gully-affected areas by applying object-based image analysis (OBIA) in the region of Taroudannt, Morocco. Remote Sens. 2014, 6, 8287–8309. [Google Scholar] [CrossRef]
- Bertalan, L.; Túri, Z.; Szabó, G. UAS photogrammetry and object-based image analysis (GEOBIA): Erosion monitoring at the Kazár badland, Hungary. Landsc. Environ. 2016, 10, 169–178. [Google Scholar] [CrossRef]
- Pourghasemi, H.R.; Yousefi, S.; Kornejady, A.; Cerdà, A. Performance assessment of individual and ensemble data-mining techniques for gully erosion modeling. Sci. Total Environ. 2017, 609, 764–775. [Google Scholar] [CrossRef]
- Žížala, D.; Juřicová, A.; Zádorová, T.; Zelenková, K.; Minařík, R. Mapping soil degradation using remote sensing data and ancillary data: South-East Moravia, Czech Republic. Eur. J. Remote Sens. 2019, 52, 108–122. [Google Scholar] [CrossRef]
- Mararakanye, N.; Le Roux, J.J. Gully location mapping at a national scale for South Africa. S. Afr. Geogr. J. 2012, 94, 208–218. [Google Scholar] [CrossRef]
- Chen, Y.; Lin, Z.; Zhao, X.; Wang, G.; Gu, Y. Deep learning-based classification of hyperspectral data. IEEE J. Sel. Top. Appl. Earth Obs. Remote Sens. 2014, 7, 2094–2107. [Google Scholar] [CrossRef]
- Kussul, N.; Lavreniuk, M.; Skakun, S.; Shelestov, A. Deep learning classification of land cover and crop types using remote sensing data. IEEE Geosci. Remote Sens. Lett. 2017, 14, 778–782. [Google Scholar] [CrossRef]
- Vetrivel, A.; Gerke, M.; Kerle, N.; Nex, F.; Vosselman, G. Disaster damage detection through synergistic use of deep learning and 3D point cloud features derived from very high resolution oblique aerial images, and multiple-kernel-learning. ISPRS J. Photogramm. Remote Sens. 2018, 140, 45–59. [Google Scholar] [CrossRef]
- Ball, J.E.; Anderson, D.T.; Chan, C.S. Comprehensive survey of deep learning in remote sensing: Theories, tools, and challenges for the community. J. Appl. Remote Sens. 2017, 11, 1–54. [Google Scholar] [CrossRef]
- Zhang, L.; Xia, G.S.; Wu, T.; Lin, L.; Tai, X.C. Deep Learning for Remote Sensing Image Understanding. J. Sensors 2016, 4, 22–40. [Google Scholar] [CrossRef]
- Chen, G.; Zhang, X.; Wang, Q.; Dai, F.; Gong, Y.; Zhu, K. Symmetrical dense-shortcut deep fully convolutional networks for semantic segmentation of very-high-resolution remote sensing images. IEEE J. Sel. Top. Appl. Earth Obs. Remote Sens. 2018, 11, 1633–1644. [Google Scholar] [CrossRef]
- Ma, L.; Liu, Y.; Zhang, X.; Ye, Y.; Yin, G.; Johnson, B.A. Deep learning in remote sensing applications: A meta-analysis and review. ISPRS J. Photogramm. Remote Sens. 2019, 152, 166–177. [Google Scholar] [CrossRef]
- Szabó, L.; Burai, P.; Deák, B.; Dyke, G.J.; Szabó, S. Assessing the efficiency of multispectral satellite and airborne hyperspectral images for land cover mapping in an aquatic environment with emphasis on the water caltrop (Trapa natans). Int. J. Remote Sens. 2019, 40, 5192–5215. [Google Scholar] [CrossRef]
- Manandhar, S.; Dev, S.; Lee, Y.H.; Meng, Y.S.; Winkler, S. A Data-Driven Approach for Accurate Rainfall Prediction. IEEE Trans. Geosci. Remote Sens. 2019, 57, 9323–9331. [Google Scholar] [CrossRef]
- Kai, W.; Jinyi, G.; Nan, Z. Evaluation on Water Source Conservation Capacity of West Liaohe River Basin Based on Invest Model. In Proceedings of the 2019 International Conference on Smart Grid and Electrical Automation (ICSGEA), IEEE, Xiangtan, China, 10–11 August 2019; pp. 443–447. [Google Scholar]
- Drake, J.M.; Randin, C.; Guisan, A. Modelling ecological niches with support vector machines. J. Appl. Ecol. 2006, 43, 424–432. [Google Scholar] [CrossRef]
- Goldblatt, R.; You, W.; Hanson, G.; Khandelwal, A.K. Detecting the boundaries of urban areas in India: A dataset for pixel-based image classification in google earth engine. Remote Sens. 2016, 8, 634. [Google Scholar] [CrossRef]
- Gautam, R.; Panigrahi, S.; Franzen, D.; Sims, A. Residual soil nitrate prediction from imagery and non-imagery information using neural network technique. Biosyst. Eng. 2011, 110, 20–28. [Google Scholar] [CrossRef]
- Bui, D.T.; Shirzadi, A.; Shahabi, H.; Chapi, K.; Omidavr, E.; Pham, B.T.; Asl, D.T.; Khaledian, H.; Pradhan, B.; Panahi, M.; et al. A novel ensemble artificial intelligence approach for gully erosion mapping in a semi-arid watershed (Iran). Sensors 2019, 19, 2444. [Google Scholar]
- Chen, L.; Ren, C.; Li, L.; Wang, Y.; Zhang, B.; Wang, Z.; Li, L. A comparative assessment of geostatistical, machine learning, and hybrid approaches for mapping topsoil organic carbon content. ISPRS Int. J. Geo-Inf. 2019, 8, 174. [Google Scholar] [CrossRef]
- Hateffard, F.; Dolati, P.; Heidari, A.; Zolfaghari, A.A. Assessing the performance of decision tree and neural network models in mapping soil properties. J. Mt. Sci. 2019, 16, 1833–1847. [Google Scholar] [CrossRef]
- Adam, E.; Mutanga, O.; Odindi, J.; Abdel-Rahman, E.M. Land-use/cover classification in a heterogeneous coastal landscape using RapidEye imagery: Evaluating the performance of random forest and support vector machines classifiers. Int. J. Remote Sens. 2014, 35, 3440–3458. [Google Scholar] [CrossRef]
- Phinzi, K.; Ngetar, N.S. The assessment of water-borne erosion at catchment level using GIS-based RUSLE and remote sensing: A review. Int. Soil Water Conserv. Res. 2019, 7, 27–46. [Google Scholar] [CrossRef]
- Maxwell, A.E.; Warner, T.A.; Fang, F. Implementation of machine-learning classification in remote sensing: An applied review. Int. J. Remote Sens. 2018, 39, 2784–2817. [Google Scholar] [CrossRef]
- Enyedi, P.; Pap, M.; Kovács, Z.; Takács-Szilágyi, L.; Szabó, S. Efficiency of local minima and GLM techniques in sinkhole extraction from a LiDAR-based terrain model. Int. J. Digit. Earth 2019, 12, 1067–1082. [Google Scholar] [CrossRef]
- Shruthi, R.B.V.; Kerle, N.; Jetten, V. Object-based gully feature extraction using high spatial resolution imagery. Geomorphology 2011, 134, 260–268. [Google Scholar] [CrossRef]
- Wang, F.; Zhen, Z.; Wang, B.; Mi, Z. Comparative study on KNN and SVM based weather classification models for day ahead short term solar PV power forecasting. Appl. Sci. 2018, 8, 28. [Google Scholar] [CrossRef]
- Maurer, T. How to pan-sharpen images using the gram-schmidt pan-sharpen method—A recipe. In Proceedings of the ISPRS Hannover Workshop, Hannover, Germany, 21–24 May 2013. [Google Scholar]
- Abriha, D.; Kovács, Z.; Ninsawat, S.; Bertalan, L.; Balázs, B.; Szabó, S. Identification of roofing materials with discriminant function analyand random forest classifiers on pan-sharpened worldview-2 imagery—A comparison. Hung. Geogr. Bull. 2018, 67, 375–392. [Google Scholar] [CrossRef]
- Grochala, A.; Kedzierski, M. A method of panchromatic image modification for satellite imagery data fusion. Remote Sens. 2017, 9, 639. [Google Scholar] [CrossRef]
- Ge, W.; Cheng, Q.; Tang, Y.; Jing, L.; Gao, C. Lithological classification using Sentinel-2A data in the Shibanjing ophiolite complex in Inner Mongolia, China. Remote Sens. 2018, 10, 638. [Google Scholar] [CrossRef]
- Breiman, L. Random forests. Mach. Learn. 2001, 45, 5–32. [Google Scholar] [CrossRef]
- Rodriguez-Galiano, V.F.; Ghimire, B.; Rogan, J.; Chica-Olmo, M.; Rigol-Sanchez, J.P. An assessment of the effectiveness of a random forest classifier for land-cover classification. ISPRS J. Photogramm. Remote Sens. 2012, 67, 93–104. [Google Scholar] [CrossRef]
- Shahabi, H.; Jarihani, B.; Tavakkoli Piralilou, S.; Chittleborough, D.; Avand, M.; Ghorbanzadeh, O. A Semi-Automated Object-Based Gully Networks Detection Using Different Machine Learning Models: A Case Study of Bowen Catchment, Queensland, Australia. Sensors 2019, 19, 4893. [Google Scholar] [CrossRef]
- Burai, P.; Deák, B.; Valkó, O.; Tomor, T. Classification of herbaceous vegetation using airborne hyperspectral imagery. Remote Sens. 2015, 7, 2046–2066. [Google Scholar] [CrossRef]
- Sabat-tomala, A.; Raczko, E. Comparison of Support Vector Machine and Random Forest Algorithms for Invasive and Expansive Species Classification Using Airborne Hyperspectral Data. Remote Sens. 2020, 12, 516. [Google Scholar] [CrossRef]
- Shruthi, R.B.V.; Kerle, N.; Jetten, V.; Stein, A. Object-based gully system prediction from medium resolution imagery using Random Forests. Geomorphology 2014, 216, 283–294. [Google Scholar] [CrossRef]
- Phinzi, K.; Ngetar, N.S.; Ebhuoma, O. Soil erosion risk assessment in the Umzintlava catchment (T32E), Eastern Cape, South Africa, using RUSLE and random forest algorithm. S. Afr. Geogr. J. 2020, 1–24. [Google Scholar] [CrossRef]
- Szatmári, G.; Pásztor, L. Comparison of various uncertainty modelling approaches based on geostatistics and machine learning algorithms. Geoderma 2019, 337, 1329–1340. [Google Scholar] [CrossRef]
- Deng, S.; Katoh, M.; Yu, X.; Hyyppä, J.; Gao, T. Comparison of tree species classifications at the individual tree level by combining ALS data and RGB images using different algorithms. Remote Sens. 2016, 8, 1034. [Google Scholar] [CrossRef]
- Balázs, B.; Bíró, T.; Dyke, G.; Singh, S.K.; Szabó, S. Extracting water-related features using reflectance data and principal component analysis of Landsat images. Hydrol. Sci. J. 2018, 63, 269–284. [Google Scholar] [CrossRef]
- Vapnik, V. The Nature of Statistical Learning Theory, 2nd ed.; Springer: New York, NY, USA, 2013; p. 311. [Google Scholar]
- Brenning, A. Spatial prediction models for landslide hazards: Review, comparison and evaluation. Nat. Hazards Earth Syst. Sci. 2005, 5, 853–862. [Google Scholar] [CrossRef]
- Otukei, J.R.; Blaschke, T. Land cover change assessment using decision trees, support vector machines and maximum likelihood classification algorithms. Int. J. Appl. Earth Obs. Geoinf. 2010, 12, 27–31. [Google Scholar] [CrossRef]
- De Boissieu, F.; Sevin, B.; Cudahy, T.; Mangeas, M.; Chevrel, S.; Ong, C.; Rodger, A.; Maurizot, P.; Laukamp, C.; Lau, I.; et al. Regolith-geology mapping with support vector machine: A case study over weathered Ni-bearing peridotites, New Caledonia. Int. J. Appl. Earth Obs. Geoinf. 2018, 64, 377–385. [Google Scholar] [CrossRef]
- Wu, Y.; Zhang, X. Object-Based tree species classification using airborne hyperspectral images and LiDAR data. Forests 2020, 11, 32. [Google Scholar] [CrossRef]
- Gholizadeh, A.; Borůvka, L.; Saberioon, M.; Vašát, R. A memory-based learning approach as compared to other data mining algorithms for the prediction of soil texture using diffuse reflectance spectra. Remote Sens. 2016, 8, 341. [Google Scholar] [CrossRef]
- Lantz, B. Machine Learning with R: Expert Techniques for Predictive Modeling to Solve All your Data Analysis Problems, 3rd ed.; Packt Publishing Ltd: Birmingham, UK, 2015; p. 427. [Google Scholar]
- Harrell, F.E.; Lee, K.L. A comparison of the discrimination of discriminant analysis and logistic regression under multivariate normality. Biostat. Stat. Biomed. Public Heal. Environ. Sci. 1985, 1985, 333–343. [Google Scholar]
- Tharwat, A. Linear vs. quadratic discriminant analysis classifier: A tutorial. Int. J. Appl. Pattern Recognit. 2016, 3, 145–180. [Google Scholar] [CrossRef]
- Dube, T.; Mutanga, O.; Sibanda, M.; Seutloali, K.; Shoko, C. Use of Landsat series data to analyse the spatial and temporal variations of land degradation in a dispersive soil environment: A case of King Sabata Dalindyebo local municipality in the Eastern Cape Province, South Africa. Phys. Chem. Earth 2017, 100, 112–120. [Google Scholar] [CrossRef]
- Machine Learning Mastery. Available online: https://machinelearningmastery.com/ (accessed on 21 February 2020).
- Heckel, K.; Urban, M.; Schratz, P.; Mahecha, M.D.; Schmullius, C. Predicting Forest Cover in Distinct Ecosystems: The Potential of Multi-Source Sentinel-1 and -2 Data Fusion. Remote Sens. 2020, 12, 302. [Google Scholar] [CrossRef]
- Congalton, R.G. A review of assessing the accuracy of classifications of remotely sensed data. Remote Sens. Environ. 1991, 37, 35–46. [Google Scholar] [CrossRef]
- Singh, S.K.; Srivastava, P.K.; Szabó, S.; Petropoulos, G.P.; Gupta, M.; Islam, T. Landscape transform and spatial metrics for mapping spatiotemporal land cover dynamics using Earth Observation data-sets. Geocarto Int. 2017, 32, 113–127. [Google Scholar] [CrossRef]
- Lamine, S.; Petropoulos, G.P.; Singh, S.K.; Szabó, S.; Bachari, N.E.I.; Srivastava, P.K.; Suman, S. Quantifying land use/land cover spatio-temporal landscape pattern dynamics from Hyperion using SVMs classifier and FRAGSTATS®. Geocarto Int. 2018, 33, 862–878. [Google Scholar] [CrossRef]
- Congalton, R.G.; Green, K. Assessing the Accuracy of Remotely Sensed Data: Principles and Practices, 3rd ed.; CRC Press: Boca Raton, FL, USA, 2019; p. 319. [Google Scholar]
- Mohd Razali, N.; Bee Wah, Y. Power comparisons of Shapiro-Wilk, Kolmogorov-Smirnov, Lilliefors and Anderson-Darling tests. J. Stat. Model. Anal. 2011, 2, 21–33. [Google Scholar]
- Field, A.; Miles, J.; Field, Z. Discovering Statistics Using R; SAGE Publications: London, UK, 2012; p. 957. [Google Scholar]
- Tallarida, R.J.; Murray, R.B. Dunnett’s Test (Comparison with a Control). In Manual of Pharmacologic Calculations, 2nd ed.; Springer: New York, NY, USA, 1987; pp. 145–148. [Google Scholar]
- Levine, T.R.; Hullett, C.R. Eta Squared, Partial Eta Squared, and Misreporting of Effect Size in Communication Research. Hum. Commun. Res. 2002, 28, 612–625. [Google Scholar] [CrossRef]
- The R Project for Statistical Computing. Available online: https://www.r-project.org (accessed on 21 February 2020).
- Mair, P.; Wilcox, R. Robust statistical methods in R using the WRS2 package. Behav. Res. Methods 2019, 52, 1–25. [Google Scholar] [CrossRef]
- Jamovi. Available online: https://www.jamovi.org/about.html (accessed on 21 February 2020).
- Gallucci, M. GMLj: General Analysis for Linear Models. Available online: https://gamlj.github.io (accessed on 21 February 2020).
- Szabó, S.; Bertalan, L.; Kerekes, Á.; Novák, T.J. Possibilities of land use change analysis in a mountainous rural area: A methodological approach. Int. J. Geogr. Inf. Sci. 2016, 30, 708–726. [Google Scholar] [CrossRef]
- Belgiu, M.; Drăgu, L. Random forest in remote sensing: A review of applications and future directions. ISPRS J. Photogramm. Remote Sens. 2016, 114, 24–31. [Google Scholar] [CrossRef]
- Xiong, K.; Adhikari, B.R.; Stamatopoulos, C.A.; Zhan, Y.; Wu, S.; Dong, Z.; Di, B. Comparison of Different Machine Learning Methods for Debris Flow Susceptibility Mapping: A Case Study in the Sichuan Province, China. Remote Sens. 2020, 12, 1–20. [Google Scholar] [CrossRef]
- Beygelzimer, A.; Langford, J.; Zadrozny, B. Weighted One-Against-All. Am. Assoc. Artif. Intell. 2004, 2, 720–725. [Google Scholar]
- Allwein, E.L.; Schapire, R.E.; Singer, Y. Reducing multiclass to binary: A unifying approach for margin classifiers. J. Mach. Learn. Res. 2000, 1, 113–141. [Google Scholar]
- Karydas, C.; Panagos, P. Towards an Assessment of the Ephemeral Gully Erosion Potential in Greece Using Google Earth. Water 2020, 12, 603. [Google Scholar] [CrossRef]


| Accuracy | Equation | Description |
|---|---|---|
| Producer’s accuracy (PA) | Where is the number of pixels correctly classified in each class; and is the column total representing reference data. | |
| User’s Accuracy (UA) | Where is the row total representing predicted classes. | |
| Overall Accuracy (OA) | Where N is the total number of pixels in the confusion matrix, and r is the number of rows. |
| Bands | s1 | s2 | s3 | ||||||
|---|---|---|---|---|---|---|---|---|---|
| t | p | ξ | t | p | ξ | t | p | ξ | |
| Red | 8.3 | <0.001 | 0.159 | 9.55 | <0.001 | 0.14 | 6.74 | <0.001 | 0.11 |
| Green | 2.99 | 0.003 | 0.062 | 28.21 | <0.001 | 0.38 | 15.98 | <0.001 | 0.28 |
| Blue | 1.07 | 0.286 | 0.02 | 14.42 | <0.001 | 0.2 | 9.56 | <0.001 | 0.17 |
| NIR | 86.1 | <0.001 | 0.964 | 171.7 | <0.001 | 0.98 | 113.3 | <0.001 | 0.98 |
| Bands | s1 | s2 | s3 | |||
|---|---|---|---|---|---|---|
| F | p | F | p | F | p | |
| Red | 10105 | <0.001 | 25193 | <0.001 | 12660 | <0.001 |
| Green | 9309 | <0.001 | 21188 | <0.001 | 10571 | <0.001 |
| Blue | 9718 | <0.001 | 25694 | <0.001 | 13036 | <0.001 |
| NIR | 3590 | <0.001 | 10905 | <0.001 | 4317 | <0.001 |
| LC | s1 | s2 | s3 | |||||||||
|---|---|---|---|---|---|---|---|---|---|---|---|---|
| Red | Green | Blue | NIR | Red | Green | Blue | NIR | Red | Green | Blue | NIR | |
| G-DV | <0.001 | <0.001 | <0.001 | <0.001 | <0.001 | <0.001 | <0.001 | <0.001 | <0.001 | <0.001 | <0.001 | <0.001 |
| G-SV | <0.001 | 0.275 | <0.001 | <0.001 | <0.001 | <0.001 | <0.001 | <0.001 | 0.281 | 0.275 | 0.883 | <0.001 |
| G-S | <0.001 | <0.001 | <0.001 | <0.001 | <0.001 | <0.001 | <0.001 | <0.001 | <0.001 | <0.001 | <0.001 | <0.001 |
| G-BS | <0.001 | <0.001 | <0.001 | <0.001 | <0.001 | <0.001 | <0.001 | <0.001 | <0.001 | <0.001 | <0.001 | <0.001 |
| G-MS | <0.001 | <0.001 | <0.001 | <0.001 | <0.001 | <0.001 | <0.001 | <0.001 | <0.001 | <0.001 | <0.001 | <0.001 |
| G-R | <0.001 | 0.528 | <0.001 | <0.001 | 0.614 | <0.001 | <0.001 | <0.001 | <0.001 | <0.001 | <0.001 | <0.001 |
| Source | SS | df | F | p | ω² |
|---|---|---|---|---|---|
| Model | 3200.5 | 17 | 3.632 | 0.005 | 0.554 |
| Alg | 174.9 | 2 | 1.687 | 0.213 | 0.017 |
| type | 25.5 | 1 | 0.493 | 0.492 | 0.006 |
| stud | 1431.9 | 2 | 13.811 | <0.001 | 0.317 |
| Alg × type | 946.7 | 2 | 9.132 | 0.002 | 0.201 |
| Alg × stud | 323 | 4 | 1.558 | 0.228 | 0.028 |
| type × stud | 99.1 | 2 | 0.956 | 0.403 | 0.001 |
| Alg × type × stud | 199.4 | 4 | 0.962 | 0.452 | 0.002 |
| Residuals | 933.1 | 18 | |||
| Total | 4133.6 | 35 |
| Source | SS | df | F | p | ω² |
|---|---|---|---|---|---|
| Model | 20,720.3 | 17 | 4.0014 | 0.003 | 0.586 |
| Alg | 17,390.9 | 2 | 28.547 | <0.001 | 0.633 |
| type | 82.6 | 1 | 0.2711 | 0.609 | 0.008 |
| stud | 2413.4 | 2 | 3.9615 | 0.038 | 0.068 |
| Alg × type | 98.6 | 2 | 0.1618 | 0.852 | 0.019 |
| Alg × stud | 666.8 | 4 | 0.5473 | 0.703 | 0.021 |
| type × stud | 18.7 | 2 | 0.0307 | 0.97 | 0.022 |
| Alg × type × stud | 49.4 | 4 | 0.0405 | 0.997 | 0.044 |
| Residuals | 5482.8 | 18 | |||
| Total | 26203.1 | 35 |
© 2020 by the authors. Licensee MDPI, Basel, Switzerland. This article is an open access article distributed under the terms and conditions of the Creative Commons Attribution (CC BY) license (http://creativecommons.org/licenses/by/4.0/).
Share and Cite
Phinzi, K.; Abriha, D.; Bertalan, L.; Holb, I.; Szabó, S. Machine Learning for Gully Feature Extraction Based on a Pan-Sharpened Multispectral Image: Multiclass vs. Binary Approach. ISPRS Int. J. Geo-Inf. 2020, 9, 252. https://doi.org/10.3390/ijgi9040252
Phinzi K, Abriha D, Bertalan L, Holb I, Szabó S. Machine Learning for Gully Feature Extraction Based on a Pan-Sharpened Multispectral Image: Multiclass vs. Binary Approach. ISPRS International Journal of Geo-Information. 2020; 9(4):252. https://doi.org/10.3390/ijgi9040252
Chicago/Turabian StylePhinzi, Kwanele, Dávid Abriha, László Bertalan, Imre Holb, and Szilárd Szabó. 2020. "Machine Learning for Gully Feature Extraction Based on a Pan-Sharpened Multispectral Image: Multiclass vs. Binary Approach" ISPRS International Journal of Geo-Information 9, no. 4: 252. https://doi.org/10.3390/ijgi9040252
APA StylePhinzi, K., Abriha, D., Bertalan, L., Holb, I., & Szabó, S. (2020). Machine Learning for Gully Feature Extraction Based on a Pan-Sharpened Multispectral Image: Multiclass vs. Binary Approach. ISPRS International Journal of Geo-Information, 9(4), 252. https://doi.org/10.3390/ijgi9040252