1. Introduction
In Western Europe, the relationship between gender and politics became an important issue many decades ago, as reflected by extensive comparative research on the effects of different factors contributing to divergent levels of women’s political representation. In contrast, research on the topic in the post-communist region was, understandably, delayed in time. Thus, although there is a well-established and growing body of literature on the effects of various factors influencing women’s representation at the national level [
1,
2,
3,
4] and an increasing body of literature focussing on subnational levels of governance, both regional [
5,
6] and local [
7,
8,
9,
10,
11], only a limited number of studies have tried to expand this research agenda to the post-communist countries of Central and Eastern Europe [
12,
13,
14,
15,
16].
Furthermore, with some minor exceptions [
17], the majority of studies of women’s participation in politics omit space and spatial effects in their research design, although spatially or geographically referenced data are “special” [
18] as they are collected on the basis of, and biased by, identifiable locations or places [
19]. At the same time, ignorance of spatial characteristics may bear important consequences because spatial data exhibit a number of specific traits that make them difficult to analyse to the extent that, in extreme cases, standard statistical and econometric methods designed to analyse non-spatial data cannot be applied [
18,
20,
21].
Filling this research gap, to some extent at least, is the ambition of the present paper. We analyse the spatial dimensions of women’s descriptive representation in the local councils of Czech municipalities in a unique long-term time series based on data from seven local elections between 1994 and 2018. We examine female participation in local politics using data for all Czech municipalities, namely 6249 units. As an extensive, long-term empirical analysis of this territorial detail is still missing, our results bring new insights regarding the evolutionary tendencies of female participation in local politics in space and time. The data analysis includes spatial autocorrelation statistics based on global Moran’s I, a global spatial-correlation indicator, as well as local Moran’s I for the local spatial-correlation indicator (LISA) of the level of female representation in a particular municipality and nearby areas, using distance-based spatial weights based on Euclidean distances.
The importance of the topic is based on several facts. First, although women’s local-level representation in Czechia is higher than at the national or regional levels of governance, the situation continues to be far from satisfactory. Not even in Czech municipalities and cities has women’s descriptive representation attained the so-called critical mass—the threshold of success of women’s descriptive representation (typically set as 30%) under which women (or other minorities in politics) cannot assert their interests that are different from those of the (male) majority [
22]. As the representation and participation of women in politics is one of the indicators of quality of democracy [
23,
24] or quality of life [
16,
25,
26], a narrow involvement of women in the political process, as well as their very limited participation in the decision-making processes of local administrations may indicate insufficient quality of democracy. As such, issues of women’s political participation and representation pose an important topic across disciplines, including GIS and spatial methods.
Furthermore, previous studies demonstrate that women’s representation at the local level is a complex phenomenon that can be shaped by both local political context and institutional variables [
9], previous officeholder’s experience [
27], as well as by candidates’ personal characteristics that may express their political ambitions to run for (and win) a representative post. These are strongly influenced by the nature of political opportunity structure [
28,
29] or strategic context [
10], which may either prevent women from becoming candidates or, in contrast, encourage them to do so, and which consists of both institutional and contextual factors. Precisely such external contextual boundaries bring to the fore the need to focus on characteristics of places and the spatial relations among them (i.e., the structural/aggregate level of explanation) instead of the purely individual level of political behaviour underlying disparate levels of women’s representation [
17]. Nevertheless, such an approach requires detailed spatial (geographical) analysis of women’s descriptive representation at the least possible level of aggregation—here, the set of all Czech municipalities. Only such analysis can help us, with the use of complex spatial GIS methods, adequately describe and interpret spatial differences in political participation and representation at a microscale while at the same time providing insight into the dynamics of the changes in women’s representation in time and space.
Specifically, in this context, attention would be paid to the assumptions that voting for women for the first time is innovative political behaviour which, provided it appears to be a successful innovation, becomes routinised and diffused [
30]. The fact that the existing share of women officeholders can have a positive impact on the future representation of women was confirmed at the national level [
30], but also at the local level [
11,
28], as such a gendered electoral context can affect the emergence and success of women in local legislative contests, too [
10,
31].
Here, for instance, a higher number of parties provide women with more points of access to a potential councillor’s seat, and in the next step, the existence of more parties makes it more likely for one of them to nominate more women—and this strategy will subsequently be modelled by other parties as well [
32]. At the same time, this so-called contagion effect is stronger under proportional representation (which is also used in Czech local elections) than in majoritarian electoral systems [
33]. Hence, we may expect the spatial contagion (or neighbourhood) effect in which voters are influenced by the dominant political ethos of the area in which they live [
34,
35,
36] to also apply to female representation emerging in geographically clustered areas of high or low presence of women in Czech local councils.
Therefore, this study aims at analysing the spatial interaction effects of female representation patterns in Czech municipalities to verify whether there is some form of spatiotemporal (in)stability of female representation between elections and, at the same time, to what extent a given (low/high) level of women’s descriptive representation in a unit (municipality) in elections
t shifts (partly in the form of a contagion effect) into surrounding units (municipalities) in the following elections
t + 1. We present maps of female representation spatial distribution patterns to indicate these spatial processes. However, as spatial econometric methods have not yet been used in research of female participation in Czech politics, our study is methodologically linked to a spatial analysis of political behaviour, or electoral geography, in which the use of spatial econometric techniques has gradually gained importance worldwide [
37,
38,
39], with many recent works in the area of post-communist Central and Eastern Europe [
40,
41,
42,
43], including Czechia [
44,
45,
46].
Moreover, in contrast to the assumption that after its successful implementation and routinisation in one unit (municipality), voting for women could spread to surrounding units (municipalities) in the form of a contagion effect, the spatial autocorrelation maps demonstrate that the level of women’s descriptive representation attained in a municipality in a specific election reproduces at a similar or growing level in the following election (given the overall linear growth of women’s representation over the time period of observation) in the same municipality. Thus, this study has strong policy implications, suggesting that the level of women’s political representation is a highly endogenous phenomenon, as its reproduction is affected by hidden processes and actors that exist within the space of individual municipalities.
2. Materials and Methods
In this paper, we analyse data on women’s descriptive representation in Czech local elections in an extended time series between 1994 and 2018. We use municipal data, i.e., for all 6249 Czech municipalities, as former analyses of social–spatial differentiation [
47,
48,
49,
50] or electoral behaviour [
51,
52,
53] emphasised the need to work at the lowest scale possible, since analysis at higher levels of aggregation (regions, districts, etc.) may obscure substantial intra-regional differences, whereas similar spatial disparities can be expected in the case of women’s political representation as well. In this paper, women’s descriptive representation is defined as the share of female councillors in a given municipality. Data on the on women’s descriptive representation are available from the Czech Statistical Office election server.
We use several spatial techniques to study spatial effects and analyse the dynamics of women’s descriptive representation in Czech municipalities. First, our exploration of the spatial structure of women’s descriptive representation begins with the formal detection of spatial autocorrelation using Moran’s I statistic [
20]. However, Moran’s I is an overall measure of linear association, whose single value is valid for the entire study area. Since the aim of this paper is to identify potentially different patterns of female participation in local politics within larger units and their transformation between elections, a local indicator of spatial association (LISA) is used to obtain a more detailed insight into the ways female representation is clustered throughout Czechia’s territory [
54]. For instance, we prefer to use the local Moran’s statistic over the Getis–Ord Gi* (so-called hot spot analysis) [
55]. On one hand, the Getis–Ord Gi* is also an effective tool for finding hot and cold spots of a phenomenon under study, i.e., areas of very high or very low values occurring near one another [
56,
57], but on the other hand, only LISA indicators can be used for identifying statistically significant spatial outliers (see below).
Bearing in mind that our goal is to compare differences in the geographical clustering of women’s descriptive representation in local political decision-making, we use both univariate LISA indicators, which can show the clustering of support for women candidates in one election, and bivariate LISA indicators, which allow us to compare how female representation transformed between pairs of elections [
39]. Thus, bivariate autocorrelation extends the idea of the global Moran’s I statistic, but the fundamental difference is that in the bivariate case, the spatial lag pertains to a different variable, i.e., bivariate spatial correlation measures the degree to which the value for a given variable in one unit is correlated to a different variable in its neighbours. Furthermore, a special case of general bivariate spatial autocorrelation is represented by the spatio-temporal correlation when one variable is measured at two points in time. Thus, bivariate LISA indicators indicate the extent to which the value observed in a location at a given time
t is correlated with its value in neighbouring locations at a different point in time
t + 1 or
t − 1 [
58,
59].
In the case of bivariate correlation, we present maps of so-called outward diffusion indicating the ways women’s descriptive representation in a given unit in elections
t shifts towards women’s descriptive representation in surrounding units in elections
t + 1. Thus, we assess the extent to which the value at a location for the
x variable (women’s descriptive representation) is correlated with the weighted average of another variable (
y, women’s descriptive representation), namely the mean value of the neighbouring locations [
58,
59].
The coefficient of correlation based on Moran’s I ranges between −1 and +1. The value of −1 indicates perfect negative autocorrelation, +1 indicates perfect positive autocorrelation, and 0 indicates a random pattern of spatial clustering in the data. In other words, when high levels in one unit are accompanied by high levels in neighbouring units (or if there are neighbouring places with low levels), there is a positive spatial autocorrelation or spatial clustering. Conversely, when places with low levels are surrounded by places with high levels (or vice versa), there is a negative spatial autocorrelation, which helps us identify spatial outliers: cases where the observed phenomenon is spatially random [
21]. It should be noted that the level of Moran’s I itself does not indicate statistical significance. To reject the null hypothesis that there is no spatial autocorrelation, we verify the statistical significance of results using the permutation procedure in GeoDa software—a technique for testing significance between pairs of variables or, more generally, datasets [
54].
However, before calculating the spatial autocorrelation indicators, we must address one of the methodological issues of spatial data analysis. The problem is that different approaches to operationalising spatial proximity (in terms of defining neighbouring spatial units) may lead to highly divergent results [
60]. The crucial choice here concerns the spatial weighting function (
wij), or construction of the spatial weight matrix (
W), which operationalizes the position and proximity of spatial units [
18,
61]. There are generally two basic types of weight matrix (
W): discrete and continuous [
21,
60]. We opted for a spatial weighting scheme with a threshold distance of 10 km, which had been demonstrated as adequate for Czechia’s settlement structure by previous studies [
47,
50,
51,
53].
To analyse women’s descriptive representation in Czech municipalities using one variable, global Moran’s I is used [
59], as shown in Equation (1).
where
I is the spatial correlation based on global Moran’s I,
zi =
xi −
(where
is the mean of the variable
xi, i.e., female representation in unit
i),
zj =
xj −
(where
is the mean of the variable
xj, i.e., female representation in unit
j, which is adjacent to unit
i), and
wij is the element of the spatial weight matrix
W indicating the distance between the units’ central points.
To obtain more detailed insight into how female representation in Czech local councils is distributed across Czechia, a local indicator of spatial association (LISA), and in particular the local Moran statistic, is used [
59], as shown in Equation (2).
where
Ii consists of the component in the double sum that corresponds to each observation
i and the inference is based upon a conditional randomisation method. Local Moran’s I illustrates the patterns of female representation in Czech municipalities in four classes of clusters: high–high (H–H), low–low (L–L), high–low (H–L), and low–high (L–H).
3. Results
The analysis of women’s descriptive representation in Czech municipalities shows a linear rise in women’s successful participation in local decision-making from 17.70% in the local elections of 1994 to 27.99% in 2018. More importantly, the analysis of the distribution of women’s descriptive representation using spatial correlation based on global Moran’s I (with a distance-based spatial weight matrix and a threshold distance of 10 km) for the same period yielded a positive global Moran’s I value (
p < 0.05) for every election year (
Table 1). This indicated that areas with a similar density (high or low) were clustered. However, while there was a rise of the value of global Moran’s I between 1994 and 2002, the following local elections witnessed generally rather a decrease of female representation clustering.
However, only a combination of the local Moran’s I with a Moran scatterplot can serve as a diagnostic tool for visualisation of local instability [
38,
54], which determines whether cases of positive local spatial autocorrelation indicate clusters of female representation values above or below the national mean and whether cases of negative local spatial autocorrelation indicate low female representation values surrounded by higher values.
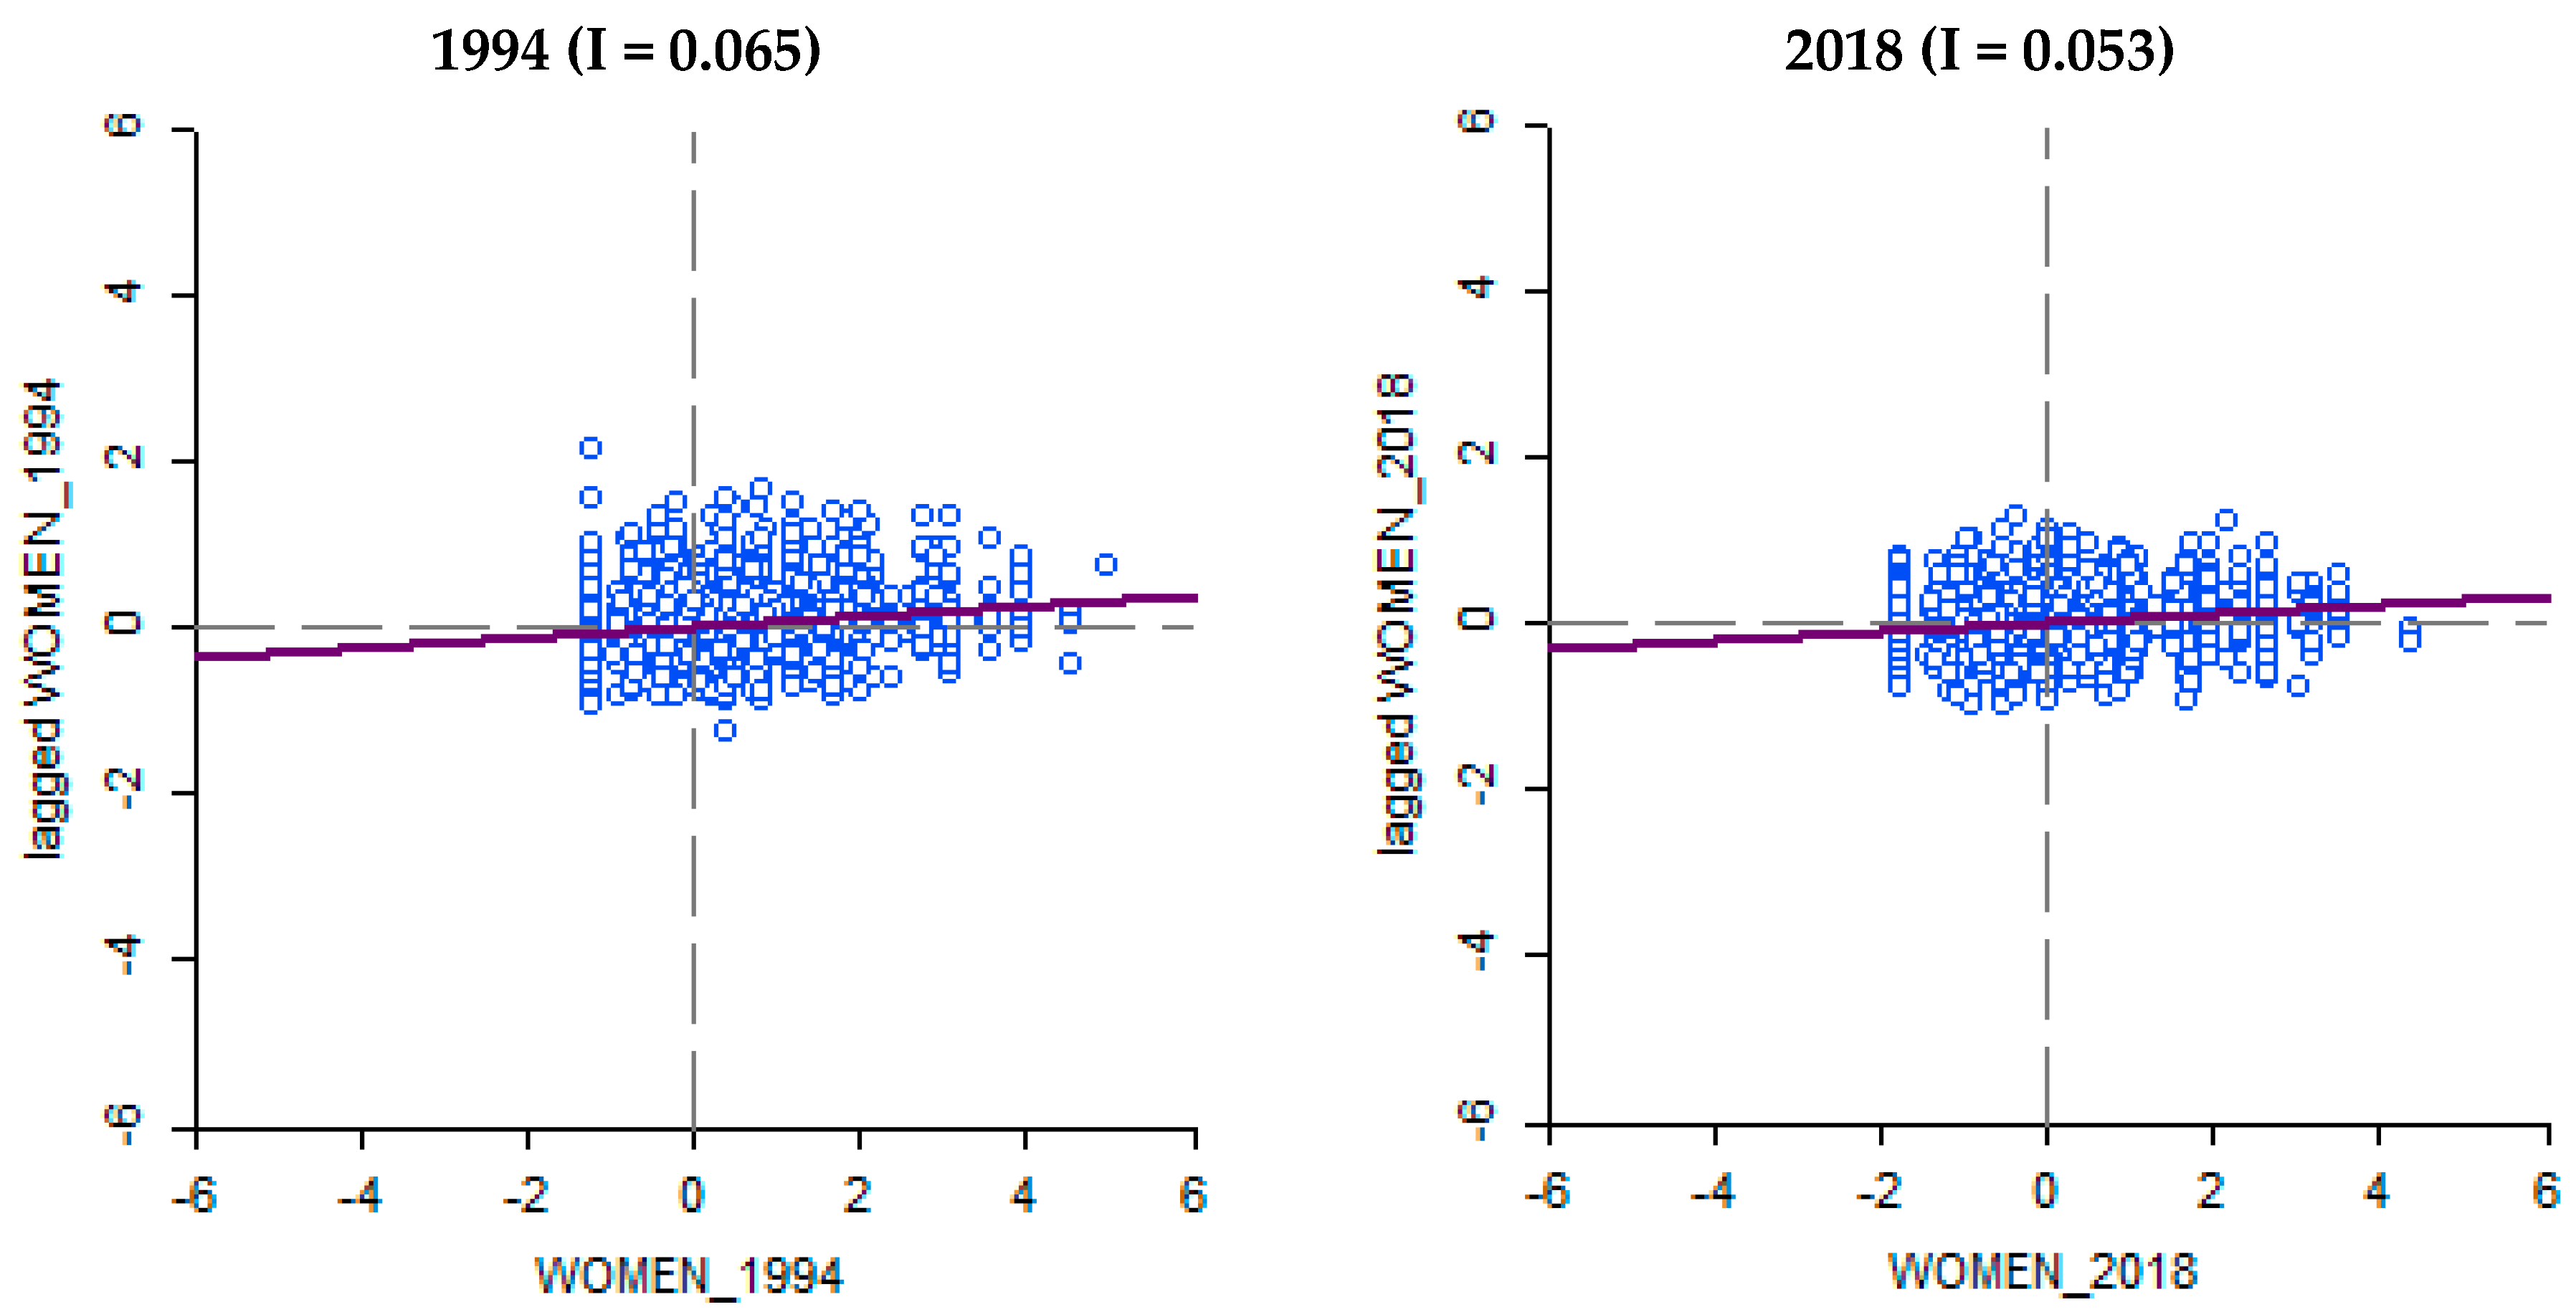
Figure 1 presents an example of the Moran scatterplot for the 1994 and 2018 local elections (with regard to the scope of the paper, we present Moran scatterplots only for these two elections; however, the Moran scatterplots for the remaining spatial patterns do offer a very similar picture), with the municipality level of women’s descriptive representation in that election plotted along the
x-axis (as standard deviations from the mean) and the weighted averages of the rates of women’s descriptive representation for each of the municipality’s neighbours plotted along the
y-axis (again in standardised form).
As expected, given the relatively low positive global Moran’s I both in 1994 and 2018, there is a tight clustering of female representation values along the 0° line, indicating that only a limited number of municipalities shared similar values of women’s descriptive representation with their neighbours. Municipalities with significant positive local Moran’s I in the upper-right quadrant shared above-average women’s descriptive representation rates with their neighbours; municipalities with significant positive local Moran’s I in the lower-left quadrant shared below-average women’s descriptive representation rates with their neighbours. Municipalities with significant negative local Moran’s I in the upper-left quadrant had lower women’s descriptive representation rates than their neighbours; and municipalities with significant negative local Moran’s I in the lower-right quadrant had higher women’s descriptive representation rates than their neighbours.
Furthermore, we can use the local Moran’s I in conjunction with the information from the Moran scatterplots to decompose the global Moran’s I and identify where and how macro female representation has been spatially structured at the municipality level in local elections.
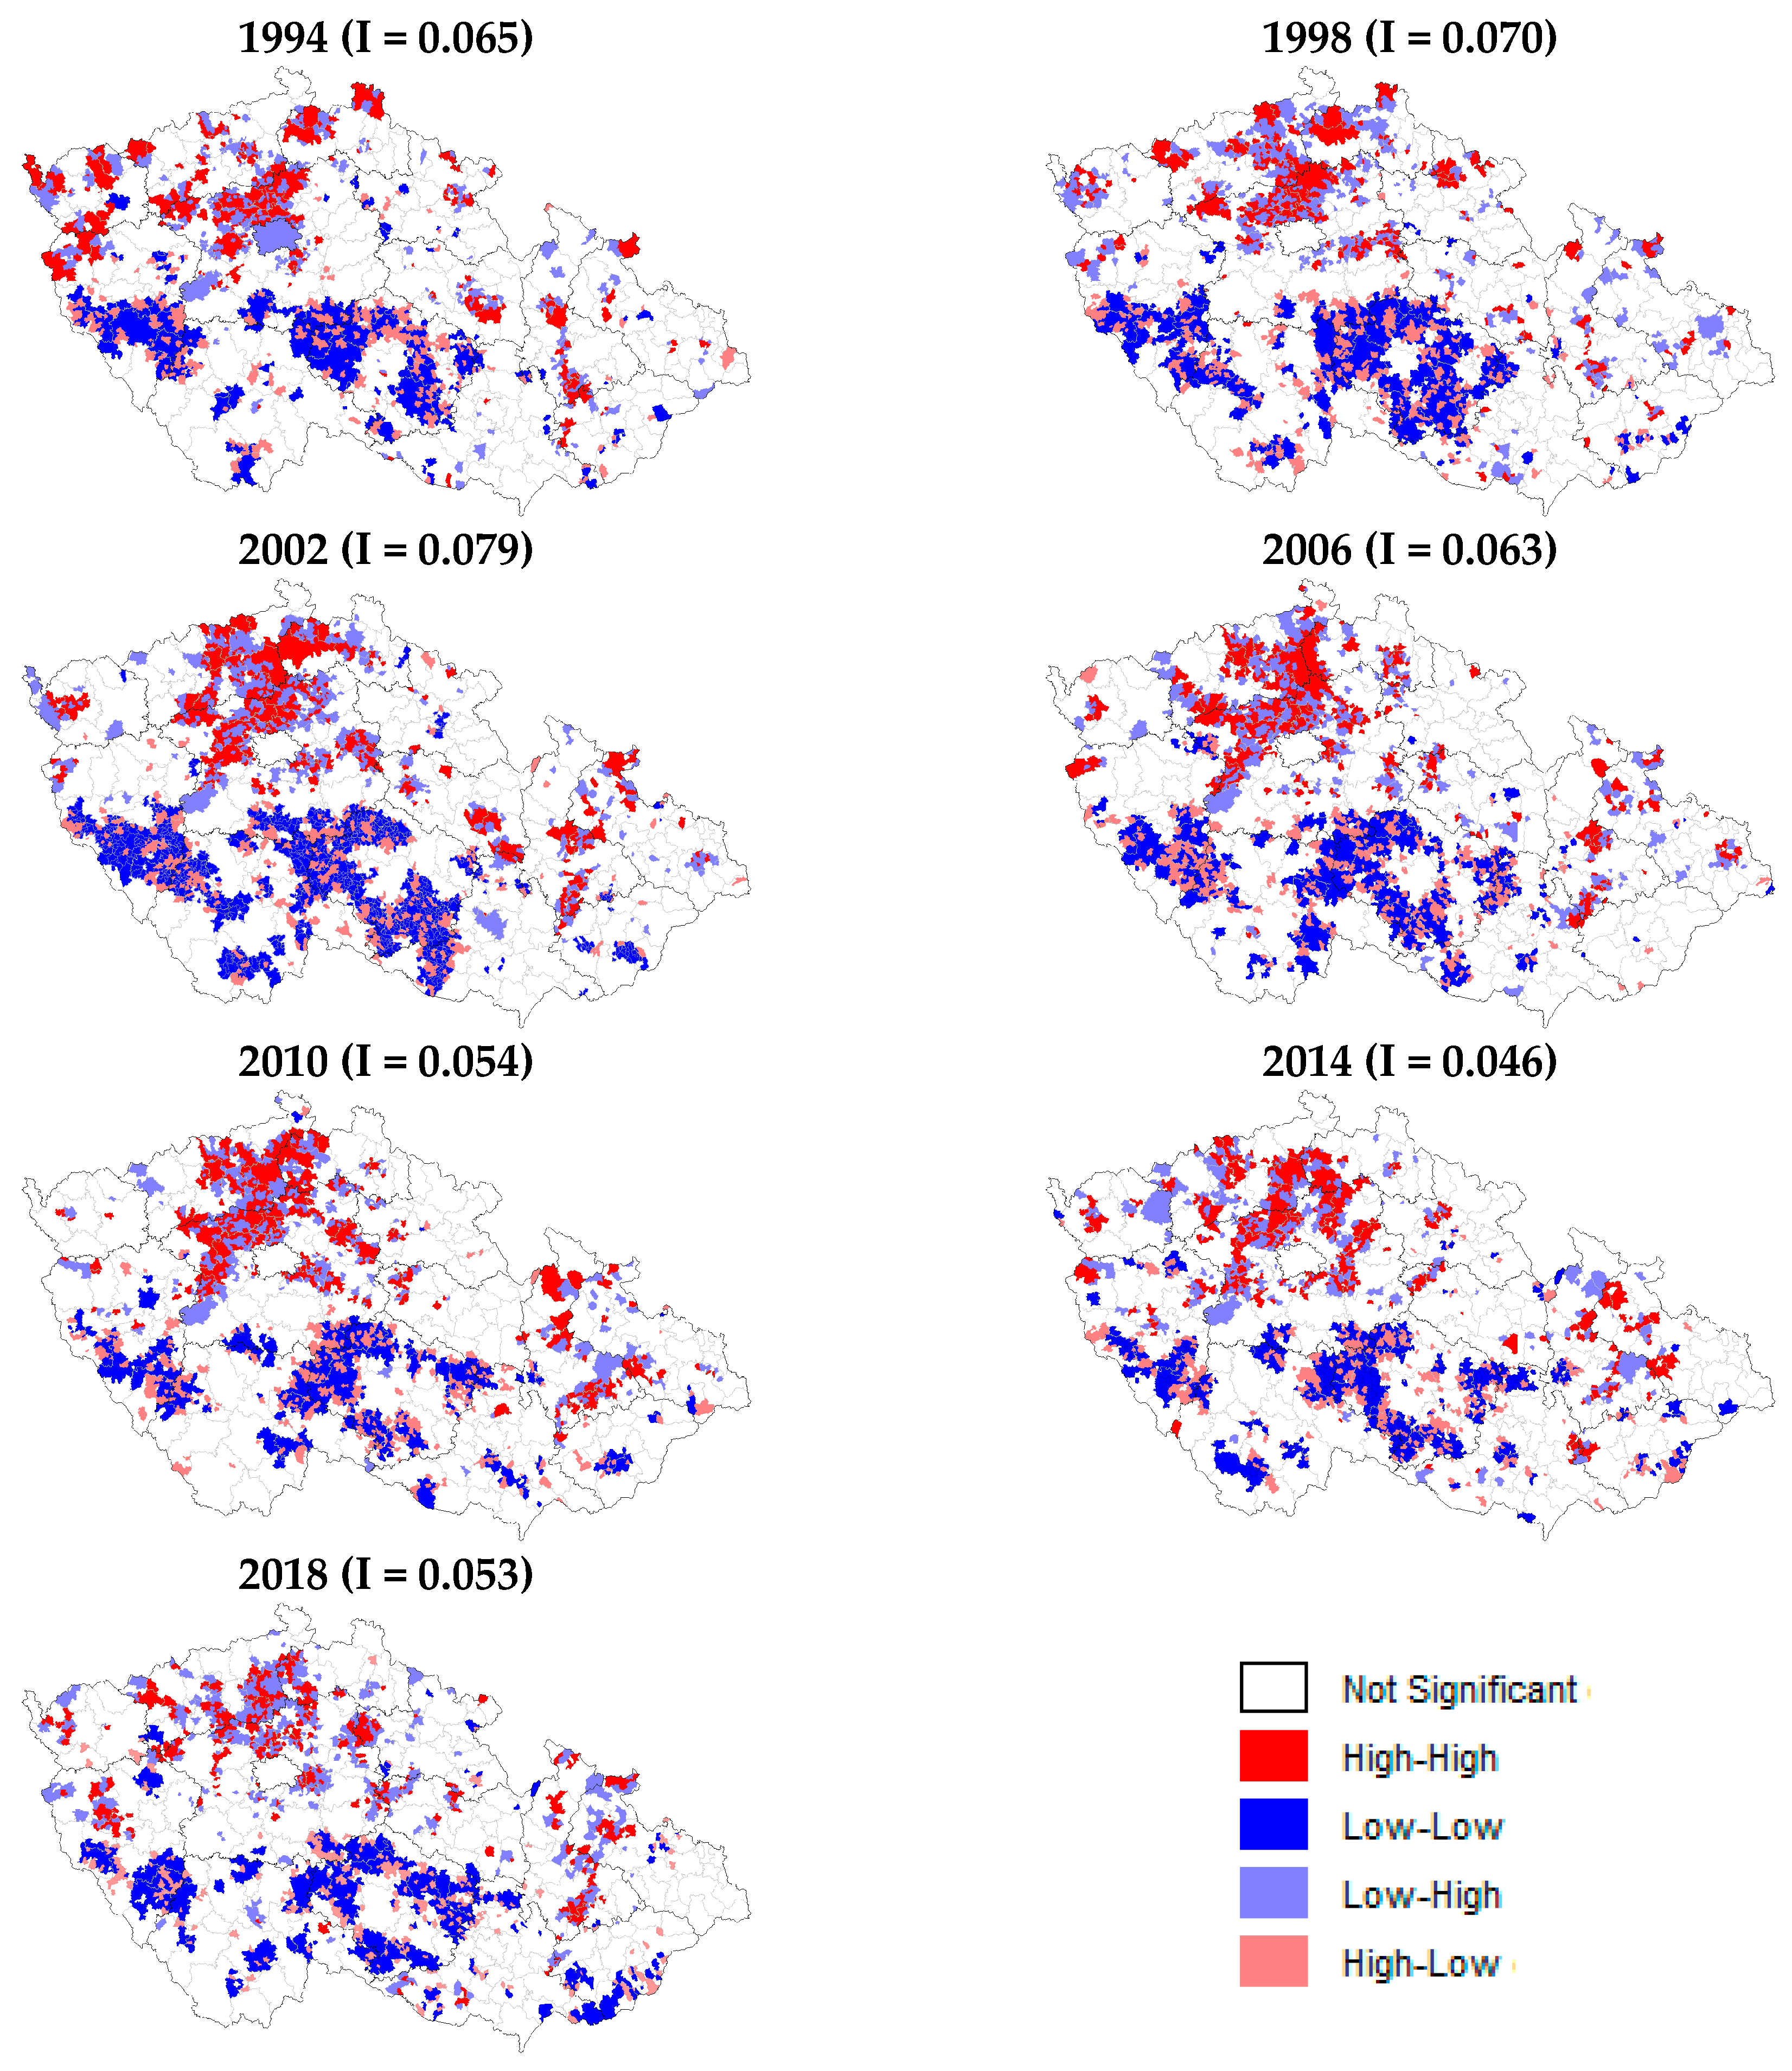
Table 2 shows the municipality-level structure of women’s descriptive representation in local elections from 1994 through 2018. Municipalities with significant local Moran’s I are divided into four categories based on their locations in the Moran scatterplots, while municipalities with spatially random female representation (rates of women’s descriptive representation uncorrelated with those in neighbouring municipalities) are not included in the table.
The spatial autocorrelation analysis of female representation based on local Moran’s I showed that in all elections, most areas had no correlation (between 64.7% in 2002 and 72.6% in 1994). Among the areas that were correlated (p < 0.05), with the exception of 2010, most featured the L–L pattern (between 8.5% and 13.5%, with a mean value of 10.9%) followed by the H–H pattern (between 6.5% and 9.7%, with a mean value of 8.3%), the L–H pattern (between 4.9% and 7.0%, with a mean value of 6.0%), and the H–L pattern (between 4.2% and 6.2%, with a mean value of 5.2%); the percentages of municipalities in given quadrants are calculated from Czechia’s total number of municipalities, i.e., 6249.
In addition, from 1994 to 2002, the area with the L–L pattern increased every time, as well as the area with the H–H pattern. This indicated an increase in clustered municipalities with both high and low female participation in local politics. However, while in the case of the H–H pattern, there was a permanent decline of the clustering of municipalities with the highest level of women’s descriptive representation since the 2002 local elections, the clusters of municipalities with a low presence of women in their local councils (the L–L pattern) indicate some reversal to much more clustering in the latest local elections of 2018. Generally, while the share of female councillors showed an increase of almost 11 percentage points between the local elections of 1994 and 2018, the share of municipalities in both categories (H–H and L–L) underwent several oscillations only to reach, in the year 2018, a situation almost identical to that of 1994.
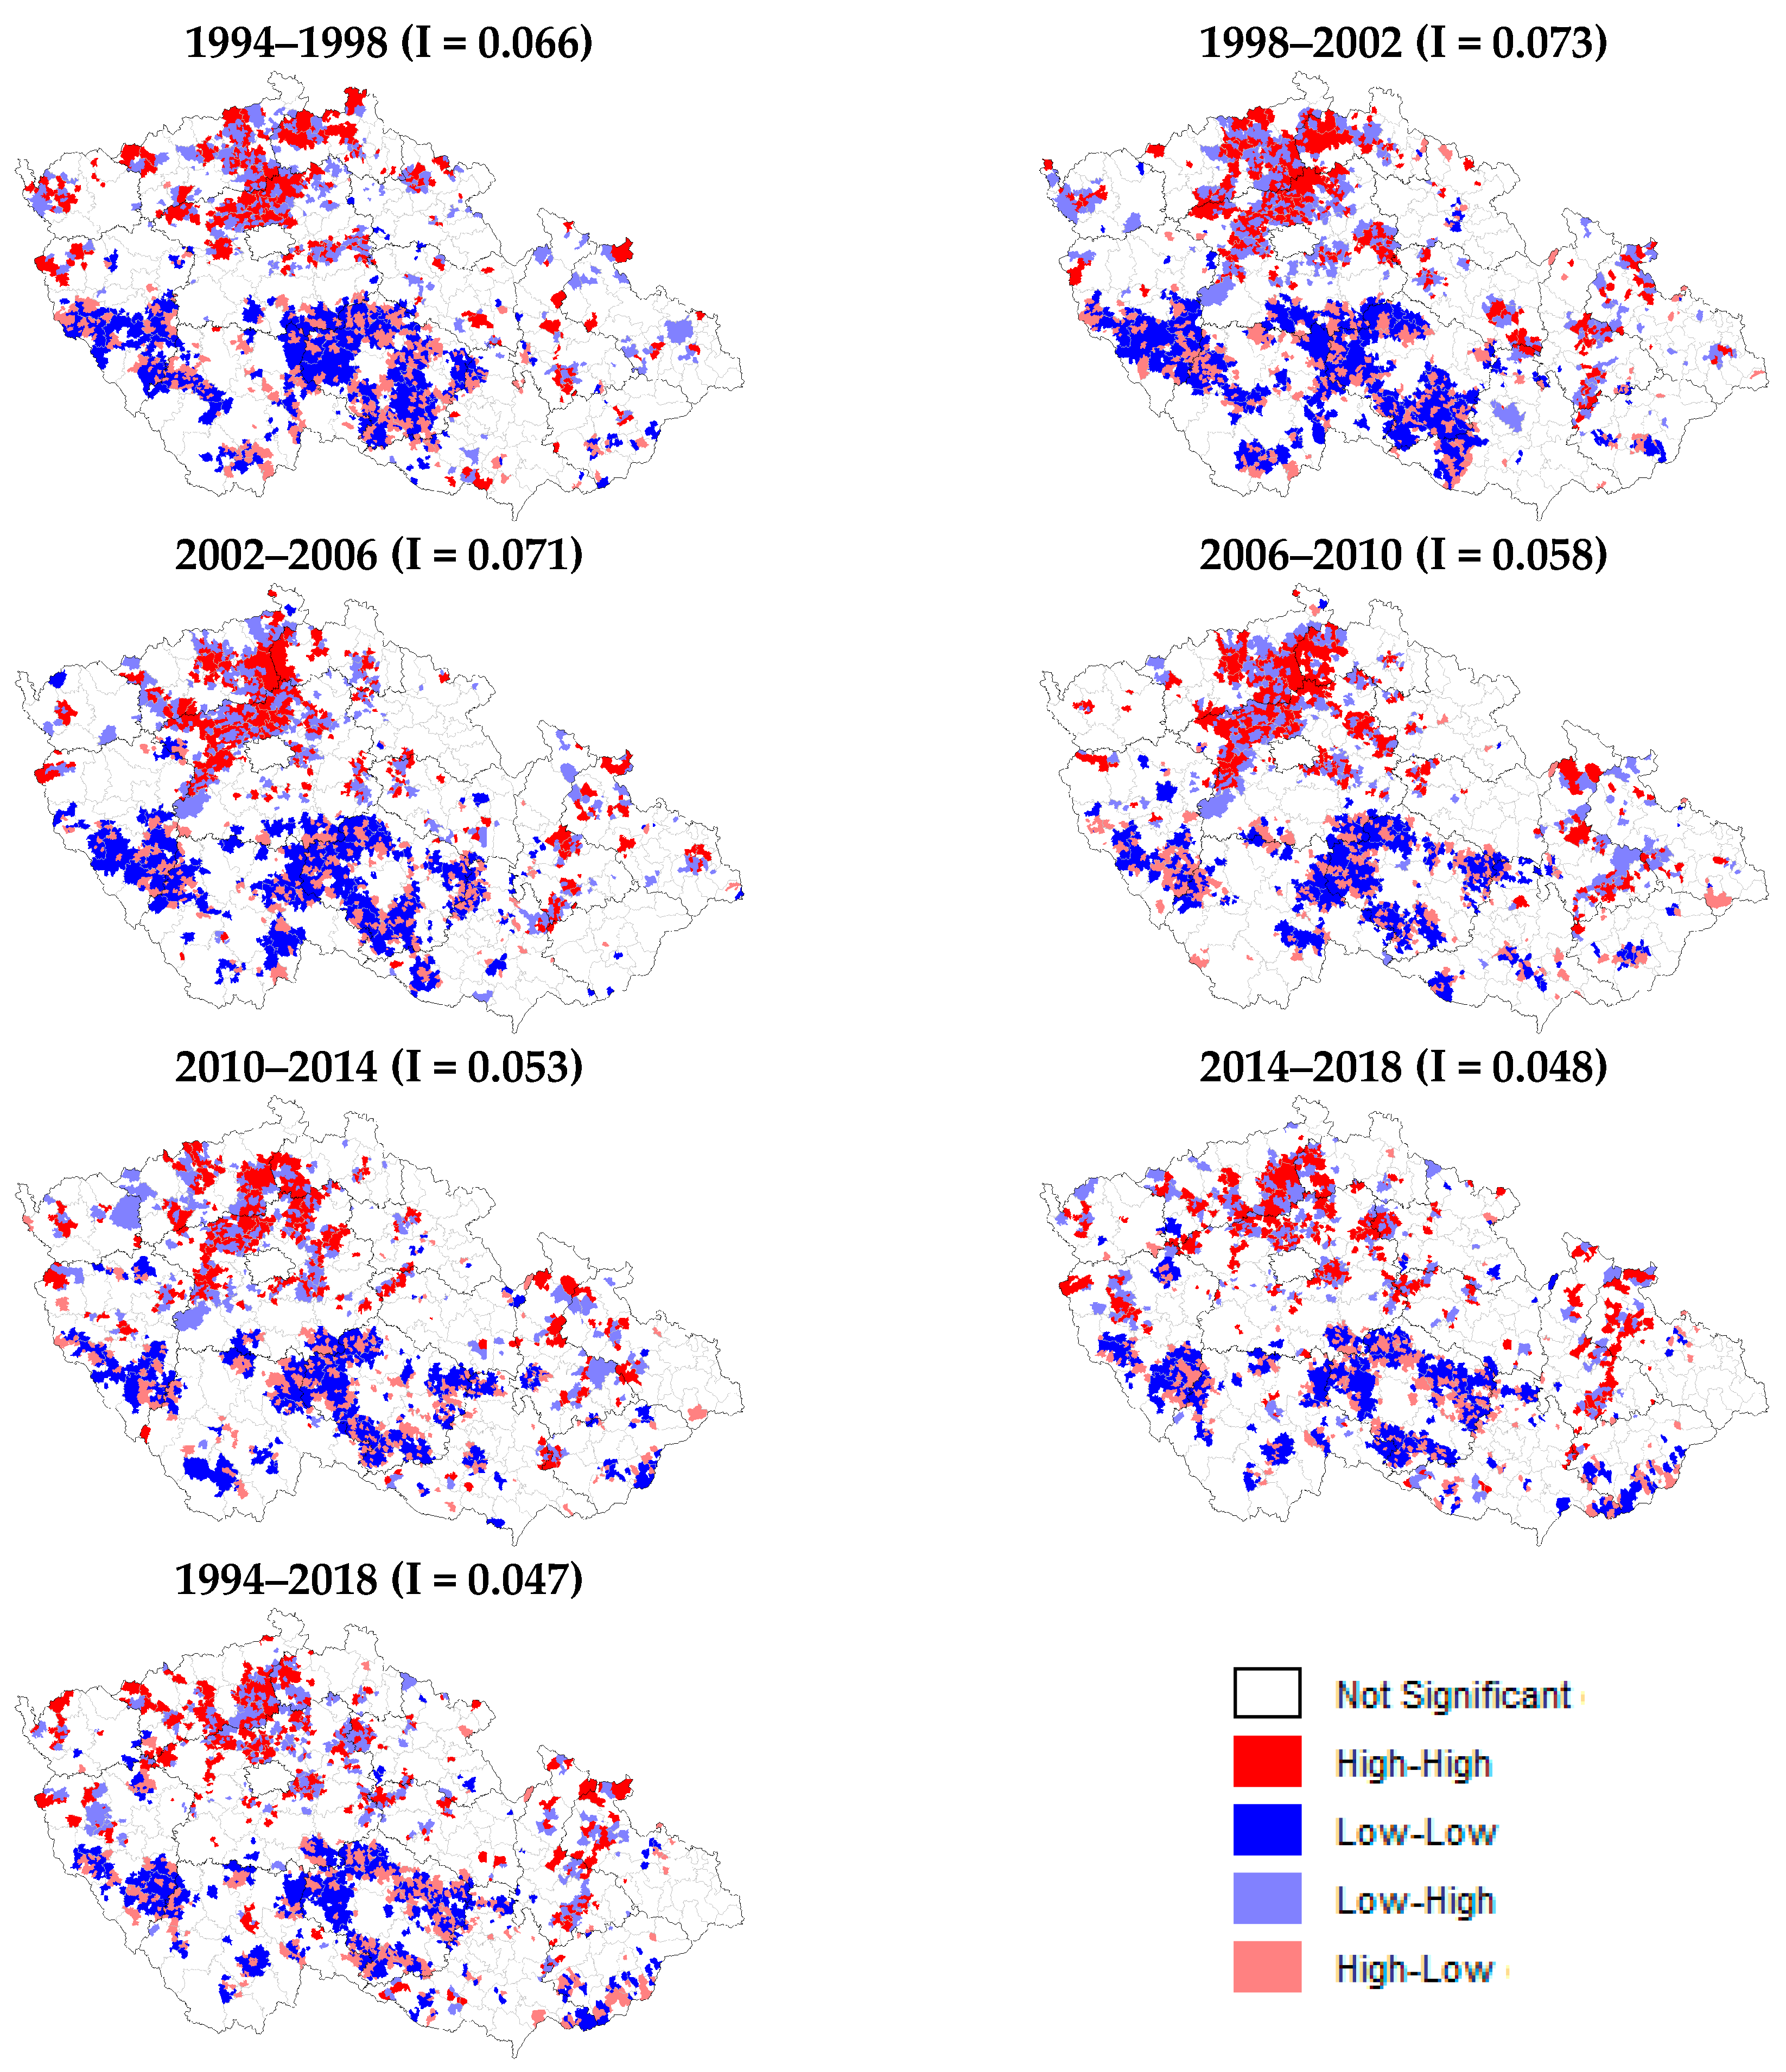
Furthermore, to systematically test the change in Moran’s I over time, we calculated bivariate Moran’s I, as bivariate spatial autocorrelation can help quantify the assumption of spatio-temporal (in)stability of female representation in the long term. In
Table 3, the diagonal values represent the level of Moran’s I in specific elections, whereas the other values in the matrix represent the correlation of Moran’s I between various elections in time. Here again, we can see an initial rise of clustering in subsequent elections, with the highest value of bivariate Moran’s I between the elections of 1998 and 2002 (0.073), followed by a continued decline of the level of inter-electoral clustering of women’s descriptive representation, with the lowest value between the elections of 2014 and 2018 (0.048). However, when we compared the value of bivariate spatial autocorrelation in the entire time period observed, the differences were relatively low, suggesting that the spatial patterns of female representation have been relatively stable over time at the level of Czechia as a whole.
To capture the general stability of the spatial patterns of women’s descriptive representation in Czech local councils, we compared spatial clustering in the local elections of 2002 (the highest level of the local Moran’s I statistic) with the latest local elections of 2018. However, the remaining spatial patterns do offer a very similar picture. Thus, consistently with the low values of Moran’s I, the values of local Moran’s I at the local level of all Czech municipalities, too, indicate only lower levels of spatial clustering between positive or negative values of women’s political representation; at best, there were 23.2% of municipalities with positive (2002) or 12.5% of municipalities with negative autocorrelation (2006), respectively. Then, the LISA cluster maps visualise the areas with significant spatial clustering of municipalities with above-average (below-average) values of female representation in their local councils as high–high (low–low) clusters, whereas municipalities that differ in their level of female representation from their neighbourhood are high–low or low–high spatial outliers.
On one hand, the results of LISA analysis shown in the maps (
Figure 2) demonstrate the divergent character of the spatial autocorrelation of women’s political representation across the territory. On the other hand, the maps for individual election years do not indicate any substantial change or transformation in inter-municipal women’s representation between elections. This conclusion suggests a high stability of women’s representation between election years, which is nevertheless consistent with the Pearson correlation coefficient values indicating the inter-electoral stability (uniformity) of the spatial patterns of women’s descriptive representation (
Table 4).
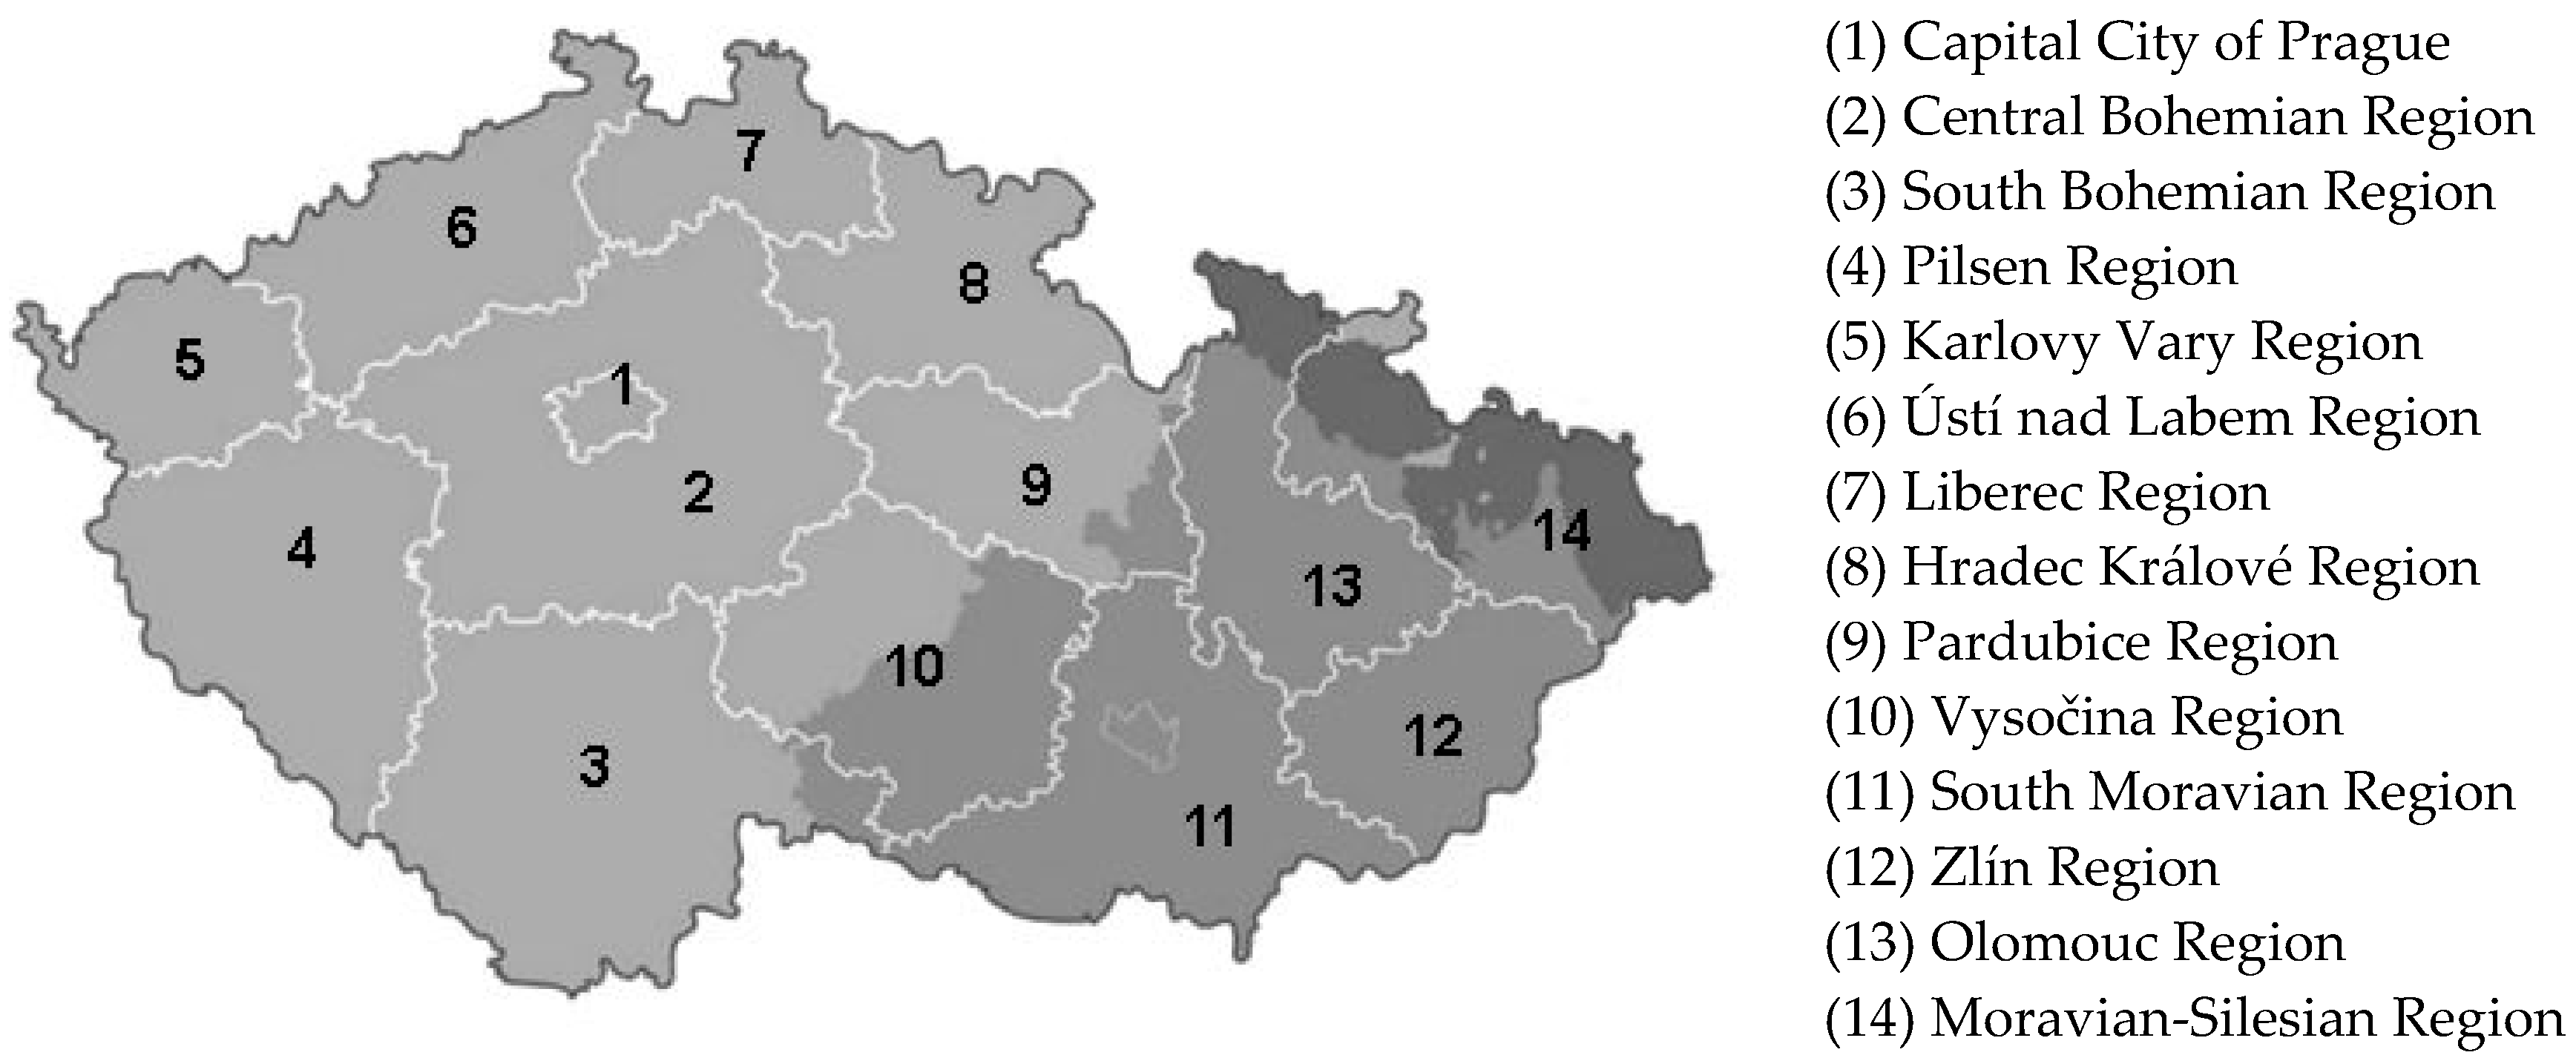
Generally, in 2002, municipalities with high levels of women’s representation in their local councils were concentrated especially in the extensive area covering parts of north-western, north-eastern, and central Bohemia (Ústí nad Labem Region, Liberec Region, Central Bohemian Region), in the latter case mostly encircling the capital city of Prague from the west and the north (for a map of administrative division of Czechia, see
Appendix A,
Figure A1 below). Furthermore, most areas with the H–H pattern were found in Bohemia, while there were only sporadic occurrences of the H–H pattern throughout the territory of Moravia, which was especially the case of southern Moravia.
No substantial regionalisation of female representation was once again found in the case of the L–L pattern. The clustering of municipalities with low levels of women’s participation in local politics was limited to a minor contiguous cluster in western Bohemia (Pilsen Region) with some overlap in southern Bohemia (South Bohemian Region). Then, the second larger area of the L–L pattern lies on the border of southern Bohemia and Vysočina (Vysočina Region) and extends across the latter region to the borderland municipalities of southern Moravia (South Moravian Region). Furthermore, while we found only sporadic occurrence of the H–H pattern in Moravia, the opposite was the case of the L–L pattern, whose presence is only limited to Bohemia, with the above-mentioned exception of some areas in western and southern Bohemia.
After a long time, the latest Czech local elections of 2018 saw a rise of Moran’s I value, albeit only a slight one. However, that rise was not significantly reflected at the local level; rather, it was the reverse. Especially in the case of the H–H pattern, the 2018 elections almost erased the large cluster of municipalities with high levels of women’s representation in their local councils north of Prague, in the borderland of central, north-western, and north-eastern Bohemia (i.e., of the Ústí nad Labem and Liberec Regions). In contrast, no major changes occurred in Moravia, which was nevertheless caused by the previous limited extent of homogeneous clusters of municipalities with higher female representation. Thus, the rise of the global level of spatial autocorrelation was rather caused by the growing number of municipalities with low levels of women’s success (the L–L pattern), albeit it did not reach the same extent or compactness as in 2002, when the level of local Moran’s I was the highest.
So far, all results of bivariate Moran’s I have identified very low levels of global spatial clustering of women’s political representation between local elections, similarly to its spatial representation in the form of bivariate local clusters (LISA cluster maps), which confirms only limited levels of regionalisation of municipalities with low or high levels of women’s representation lasting (or shifting) between elections. More importantly, the identified clusters of bivariate local indicators of spatial autocorrelation are largely identical with the maps of univariate LISA indicators for the different municipal elections presented above.
A comparison of selected election years at the beginning and end of the observed time period, but also temporally distant pairs of elections, confirms a high level of spatio-temporal stability of women’s representation in the different municipalities—despite their, once again, limited number. In both the pair of municipal elections of 1994/1998 and that of 2014/2018 (
Figure 3), the clusters of municipalities characterised by positive spatial autocorrelation of municipalities with high levels of success among women (the H–H pattern) in both elections, were primarily found in the area north of Prague, in the borderland between central, north-western, and north-eastern Bohemia.
Nevertheless, a comparison of the maps for both these pairs of elections, too, demonstrates receding clustering in all of the above-mentioned regions with the previously highest occurrence of the H–H pattern (especially in north-eastern Bohemia), which is accompanied by a slight growth of clustering in northern Moravia. Similarly, the clusters of municipalities with low representation of women in their local councils (the L–L pattern) are primarily found in the area of western Bohemia and Vysočina, again with a consistently decreasing level of spatial autocorrelation of women’s descriptive representation in Czech municipalities.
While some continuity in the level of female political representation can be expected from one election to the subsequent one, such an expectation is not entirely automatic in the case of more distant pairs of elections. Yet, a comparison of pairs of local elections divided by longer time periods leads to basically the same conclusions as the mapping of bivariate LISA indicators for pairs of subsequent elections. Even when comparing women’s descriptive representation in local elections divided by more than a decade (2006 and 2018) or almost a quarter century (1994 and 2018), the territorial mapping of bivariate LISA indicators does not provide diametrically different information.
As in the previous cases, it is apparent that municipalities in which women have better opportunities to participate in decision-making on the workings on local politics are consistently clustered primarily in the area north of the country’s capital, albeit the presence of the phenomenon weakens with growing distance between elections—yet the presence of this set of municipalities continues to be visible despite that weakening trend. To a much lesser extent, the inter-electoral H–H pattern is present in northern Moravia, covering primarily peripheral borderland municipalities.
In contrast, the regionalisation of municipalities with low proportions of women (the L–L pattern) is consistently typical of western and southern Bohemia (to a much lesser extent), from where it extends eastward to cover a considerable part of the Vysočina Region as well. In both cases of positive spatial autocorrelation of women’s political representation (i.e., municipalities with high or, conversely, low levels of success of female candidates), though, the compactness of the clusters of municipalities with similar values is broken by a large number of municipalities with the exact opposite proportion of women on their local councils, i.e., examples of negative spatial autocorrelation.
5. Conclusions
Thus, the empirical findings may have substantial local policy implications, as our results suggest that the levels of women’s political representation and participation in local political decision-making processes are highly endogenous phenomena. Furthermore, as the level of female representation and its reproduction is affected by hidden processes and actors that exist within the space of the specific municipalities, where a role is played—for instance, factors such as the selectorate effect, the nomination process, or the incumbency effect [
62]—it is precisely the effect of the selectorate and the nomination process that may represent the key factor in party list formation and the key obstacle to increasing women’s representation, hindering the possible positive influence of contagion. Finally, the fact that municipalities with higher shares of women in their local councils are only limited role models for their neighbours can at least partially be explained by the settlement structure of Czechia. As the structure of settlements in Czechia is extremely fragmented (for example, municipalities with a population under 1000 account for more than 77% of the country’s 6249 municipalities but only approximately 17% of the country’s total population), the mere presence of a large number of small unintegrated municipalities is reproduced not only in the equally fragmented structure of the local system of government [
63] but also in the fact that the local politics of a specific municipality has little to do with the politics of the surrounding municipalities [
64,
65,
66,
67,
68], which hinders the role-modelling effect on neighbouring municipalities and gradual diffusion of higher women’s representation into larger compact areas.
Future research will necessarily aim to identify the ways women’s presence on local councils is reproduced, in the long term, in municipalities where female candidates are more or less successful, both vis-à-vis voters and political parties—especially whether it is also the case in the Czech context that success can be greater in areas undergoing intensive economic transformation that provide women with new high-status job opportunities, making them economically independent and politically active [
17]. Nevertheless, answers to these important topics of future analyses will have to rely more on qualitative methods and on closer examination of electoral actors themselves (women as candidates), or of the parties they come from, of their previous political experience, ideological orientations, etc., all of which might help us clarify the different levels of women’s descriptive representation. As the above-mentioned results showed that women’s (above- or under-average) representation reproduces at similar levels between elections, the incorporation of a four-stage recruitment model (a ladder of recruitment) [
69] or an extended ladder of recruitment model [
70] would be one the of important tasks, because even a national-level analysis in Czechia confirmed that the selectorate and the nomination process may represent the key factors in party list formation and the key obstacles to increasing women’s representation [
71].
On the other hand, it is a very difficult task to analyse the nomination process (using the recruitment model) on thousands of municipalities over two decades of Czech local politics. Therefore, it will probably be necessary to perform a more qualitative analysis of the recruitment model on a selected sample of municipalities characterised by traditionally high or, in contrast, low levels of women’s representation. However, also this research direction may have its spatial dimensions, as well as a more detailed focus on geographical aspects of incumbency, namely the question of whether women who win a council seat assume, in the following election term, a role similar to male party gatekeepers, effectively limiting the further growth of the number of women both running and elected. Thus, women’s higher presence in some territorially clustered local councils might not indicate the openness of the local political environment to women but rather a process of denying political opportunities to other women.


