Near Relation-Based Indoor Positioning Method under Sparse Wi-Fi Fingerprints

Abstract
1. Introduction
- (1)
- We identify the opportunity for a near relation for resolving fingerprint ambiguity. To the best of our knowledge, this is the first work combining spatial relationships in locality descriptions with fingerprints.
- (2)
- A near relation-based indoor positioning under a sparse Wi-Fi fingerprinting scheme is provided, which is a new interactive indoor positioning method. Some interpolation methods are adopted to encrypt sparse Wi-Fi fingerprinting. A near relation region is provided to narrow the searching space of fingerprinting and resolve fingerprinting ambiguity.
- (3)
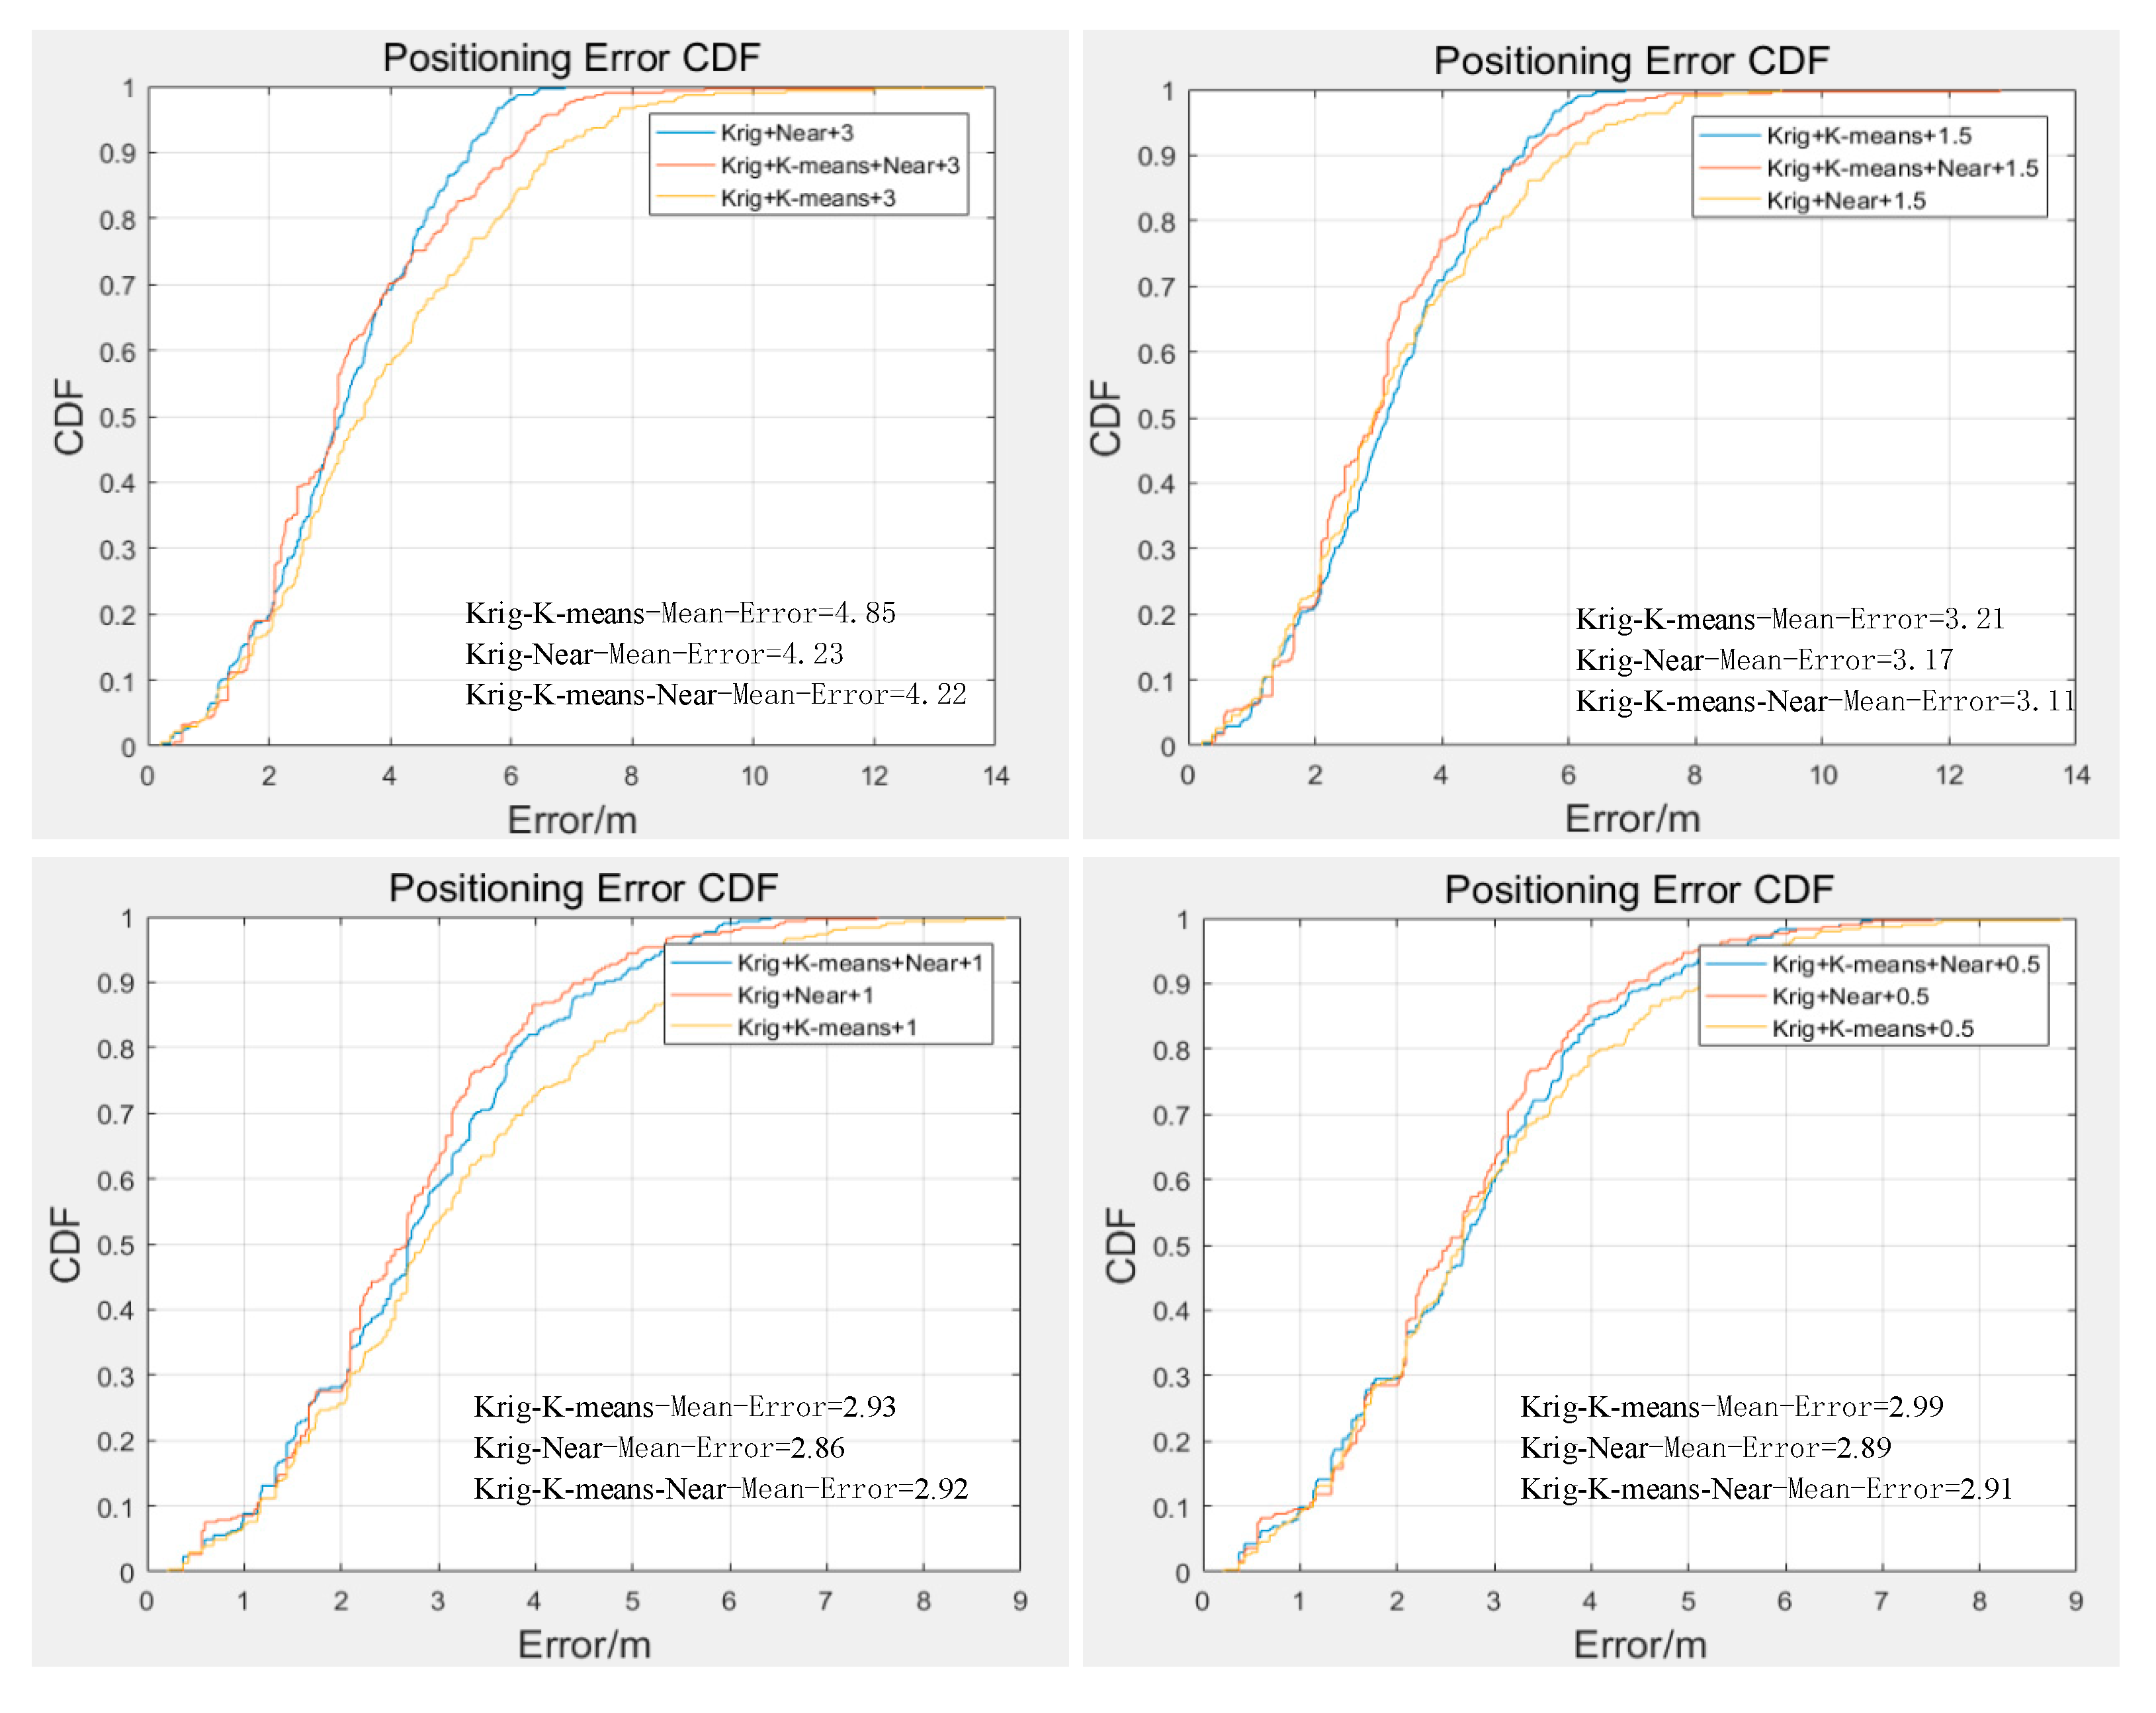
- To evaluate our method, extensive experiments are conducted. The results demonstrate that the kriging interpolation method performs better than other interpolation methods, and a positioning accuracy of 3.8 m is achievable with a near relation constraint under a 1 m interpolation density.
2. Related Works
3. System Overview and Method
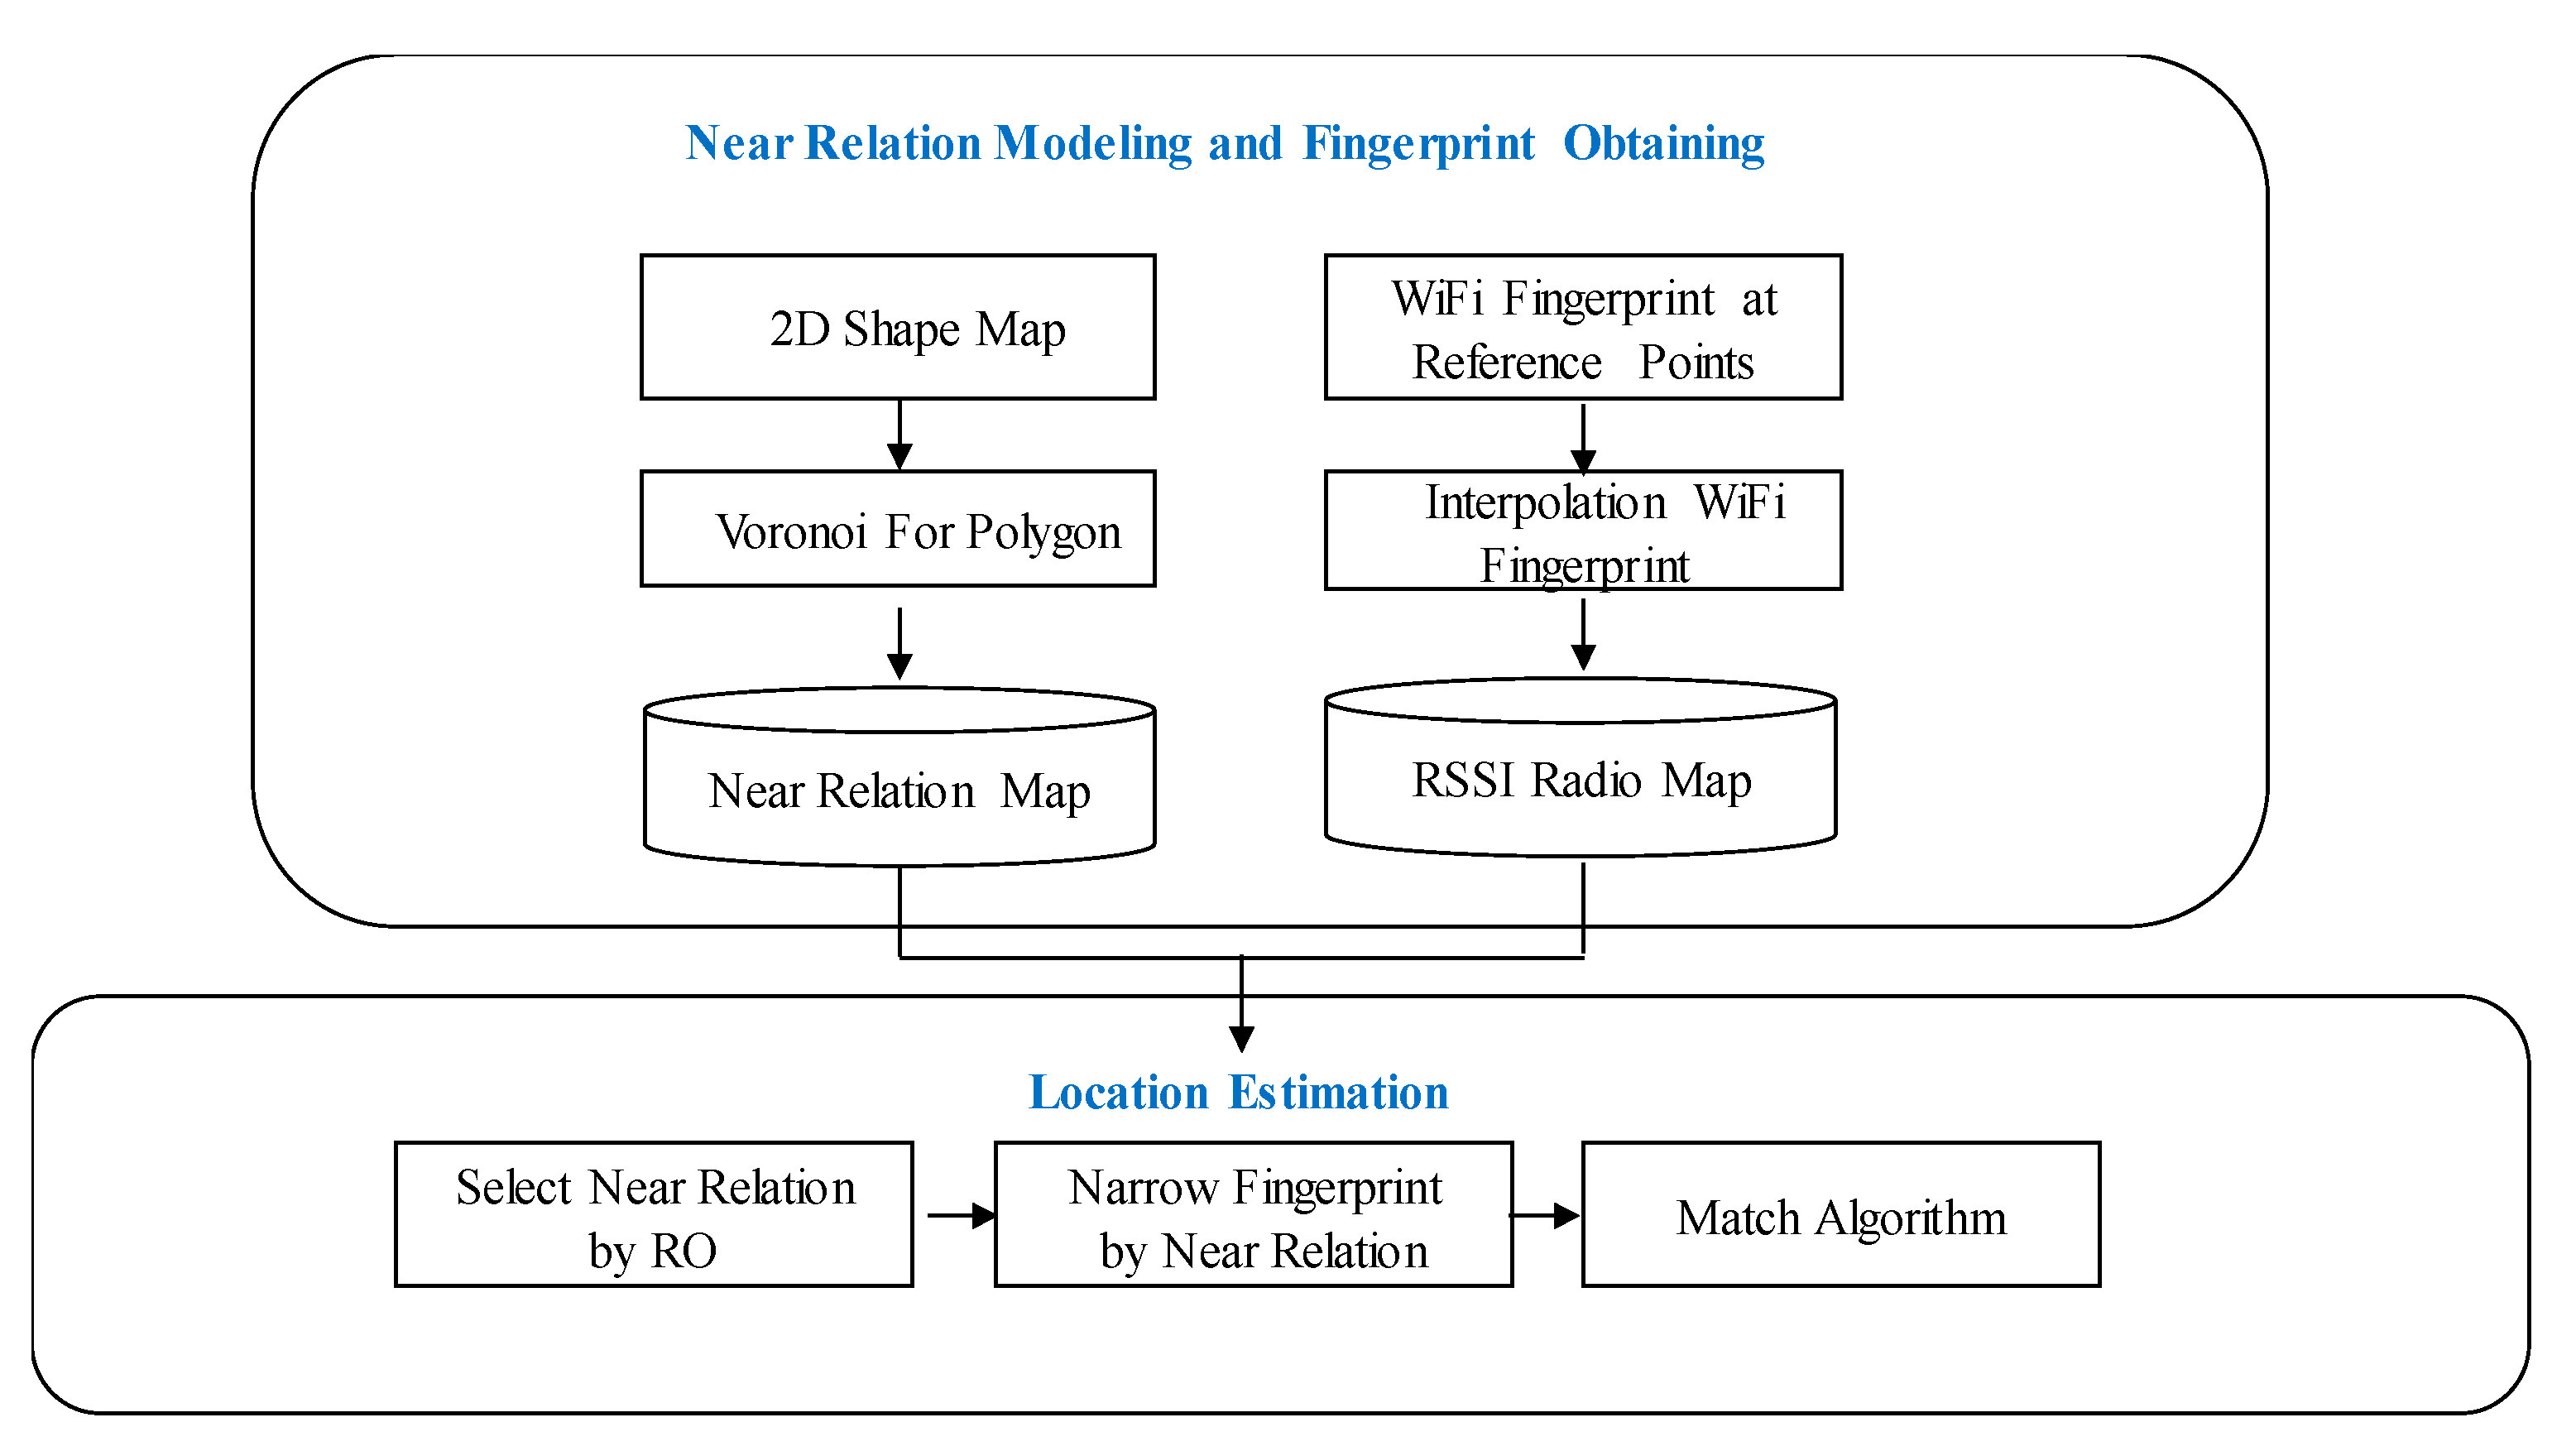
3.1. System Overview
3.2. Method
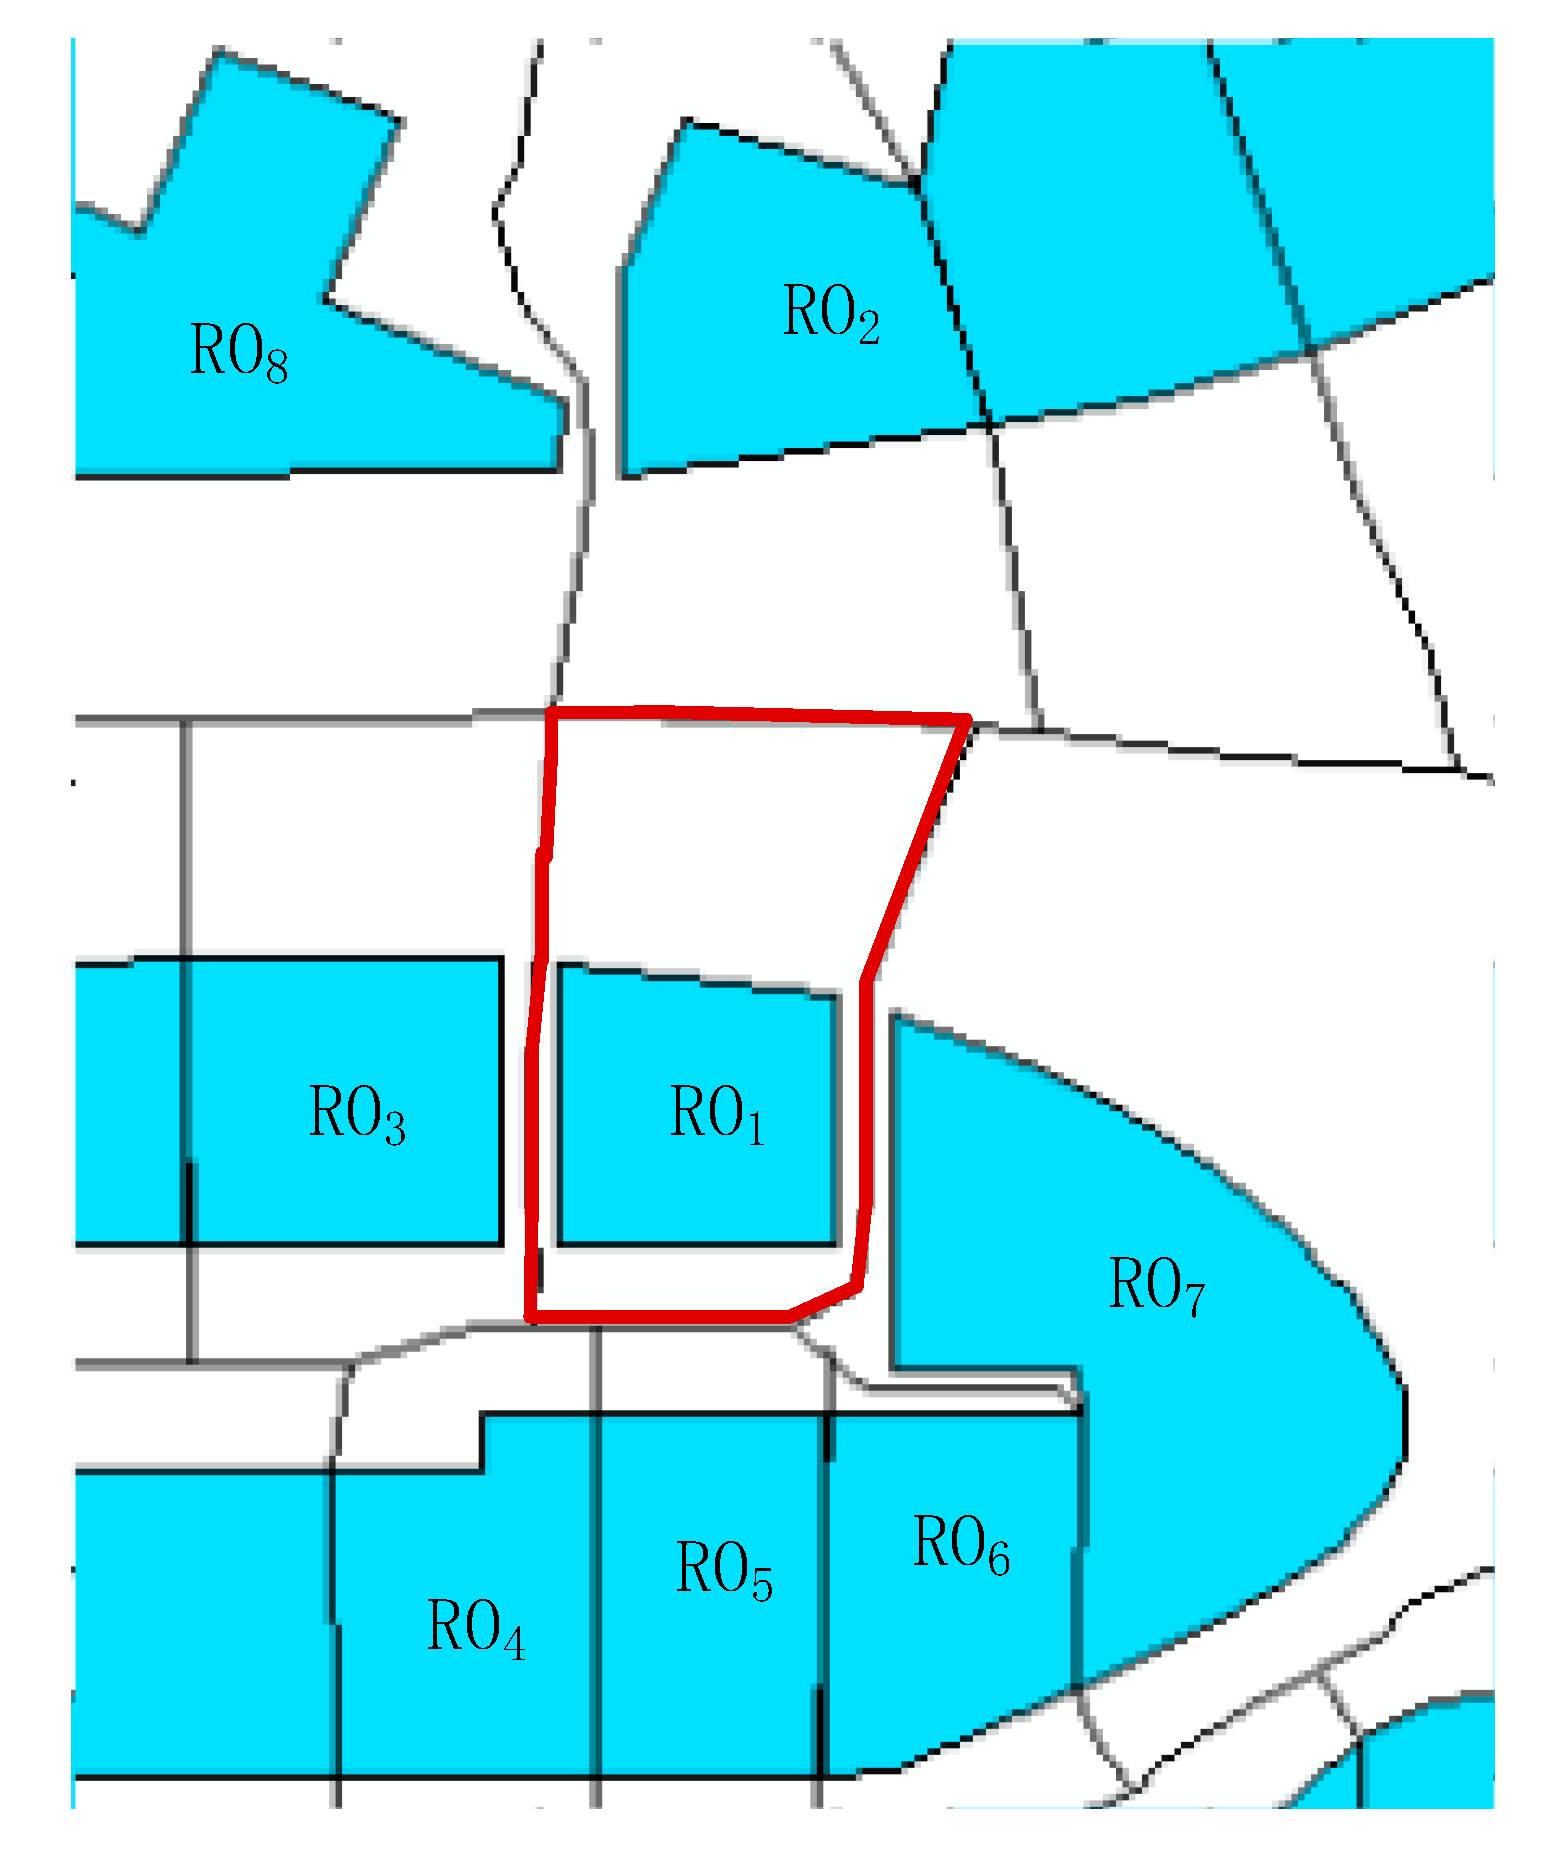
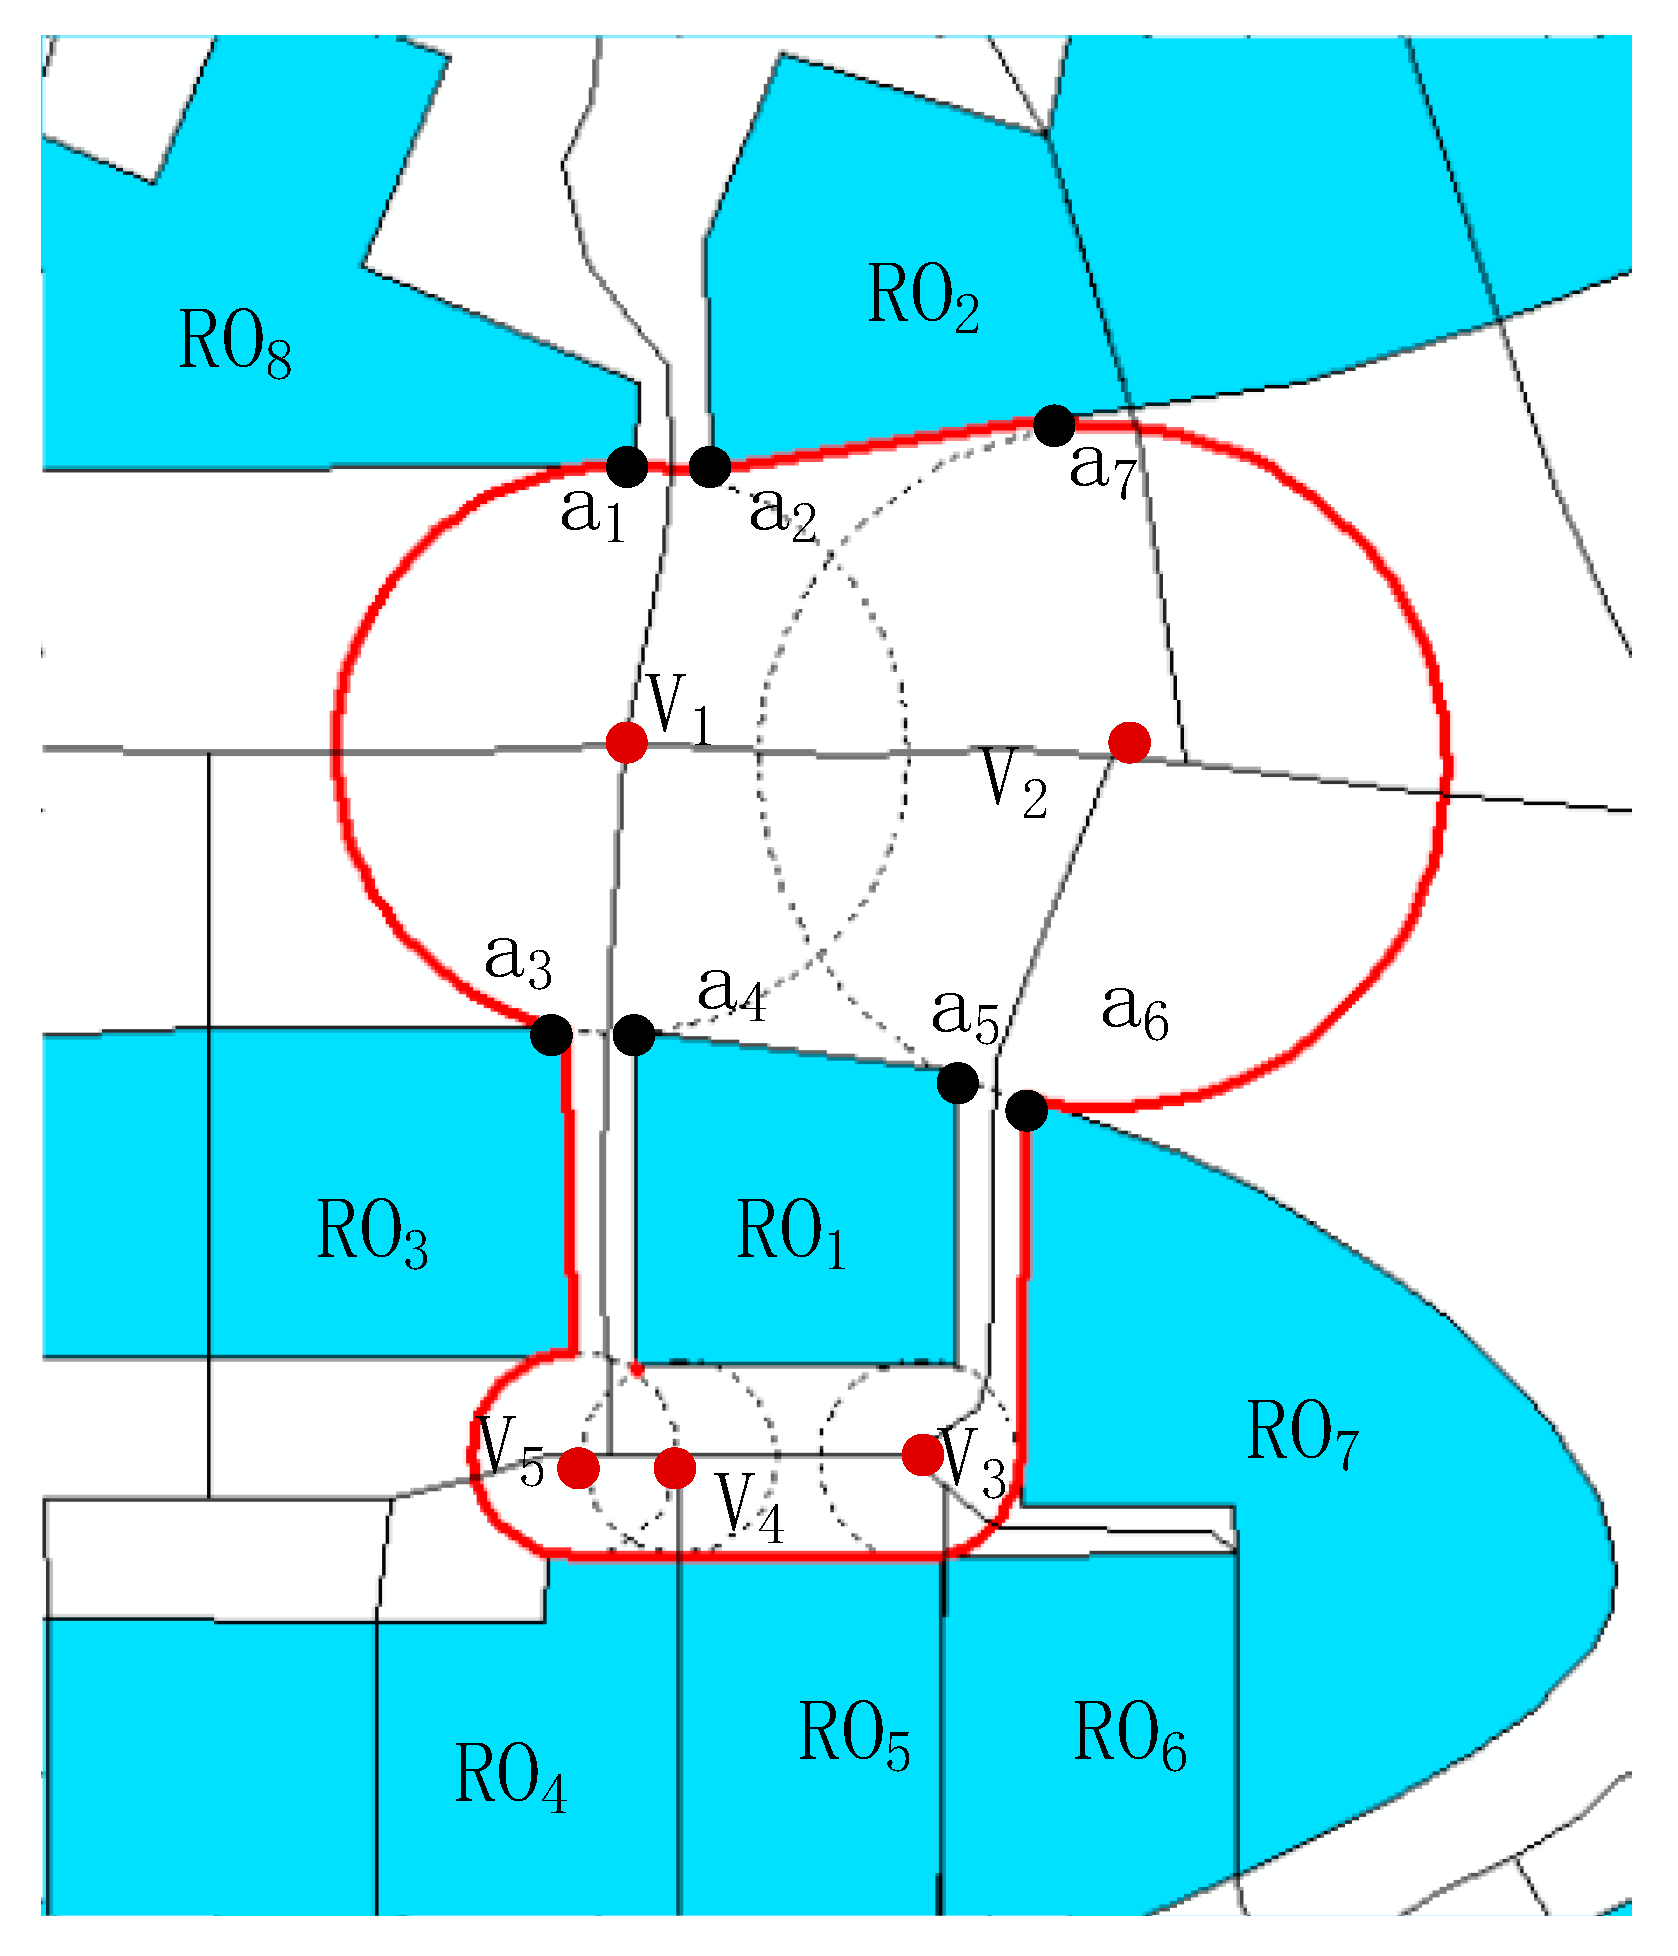
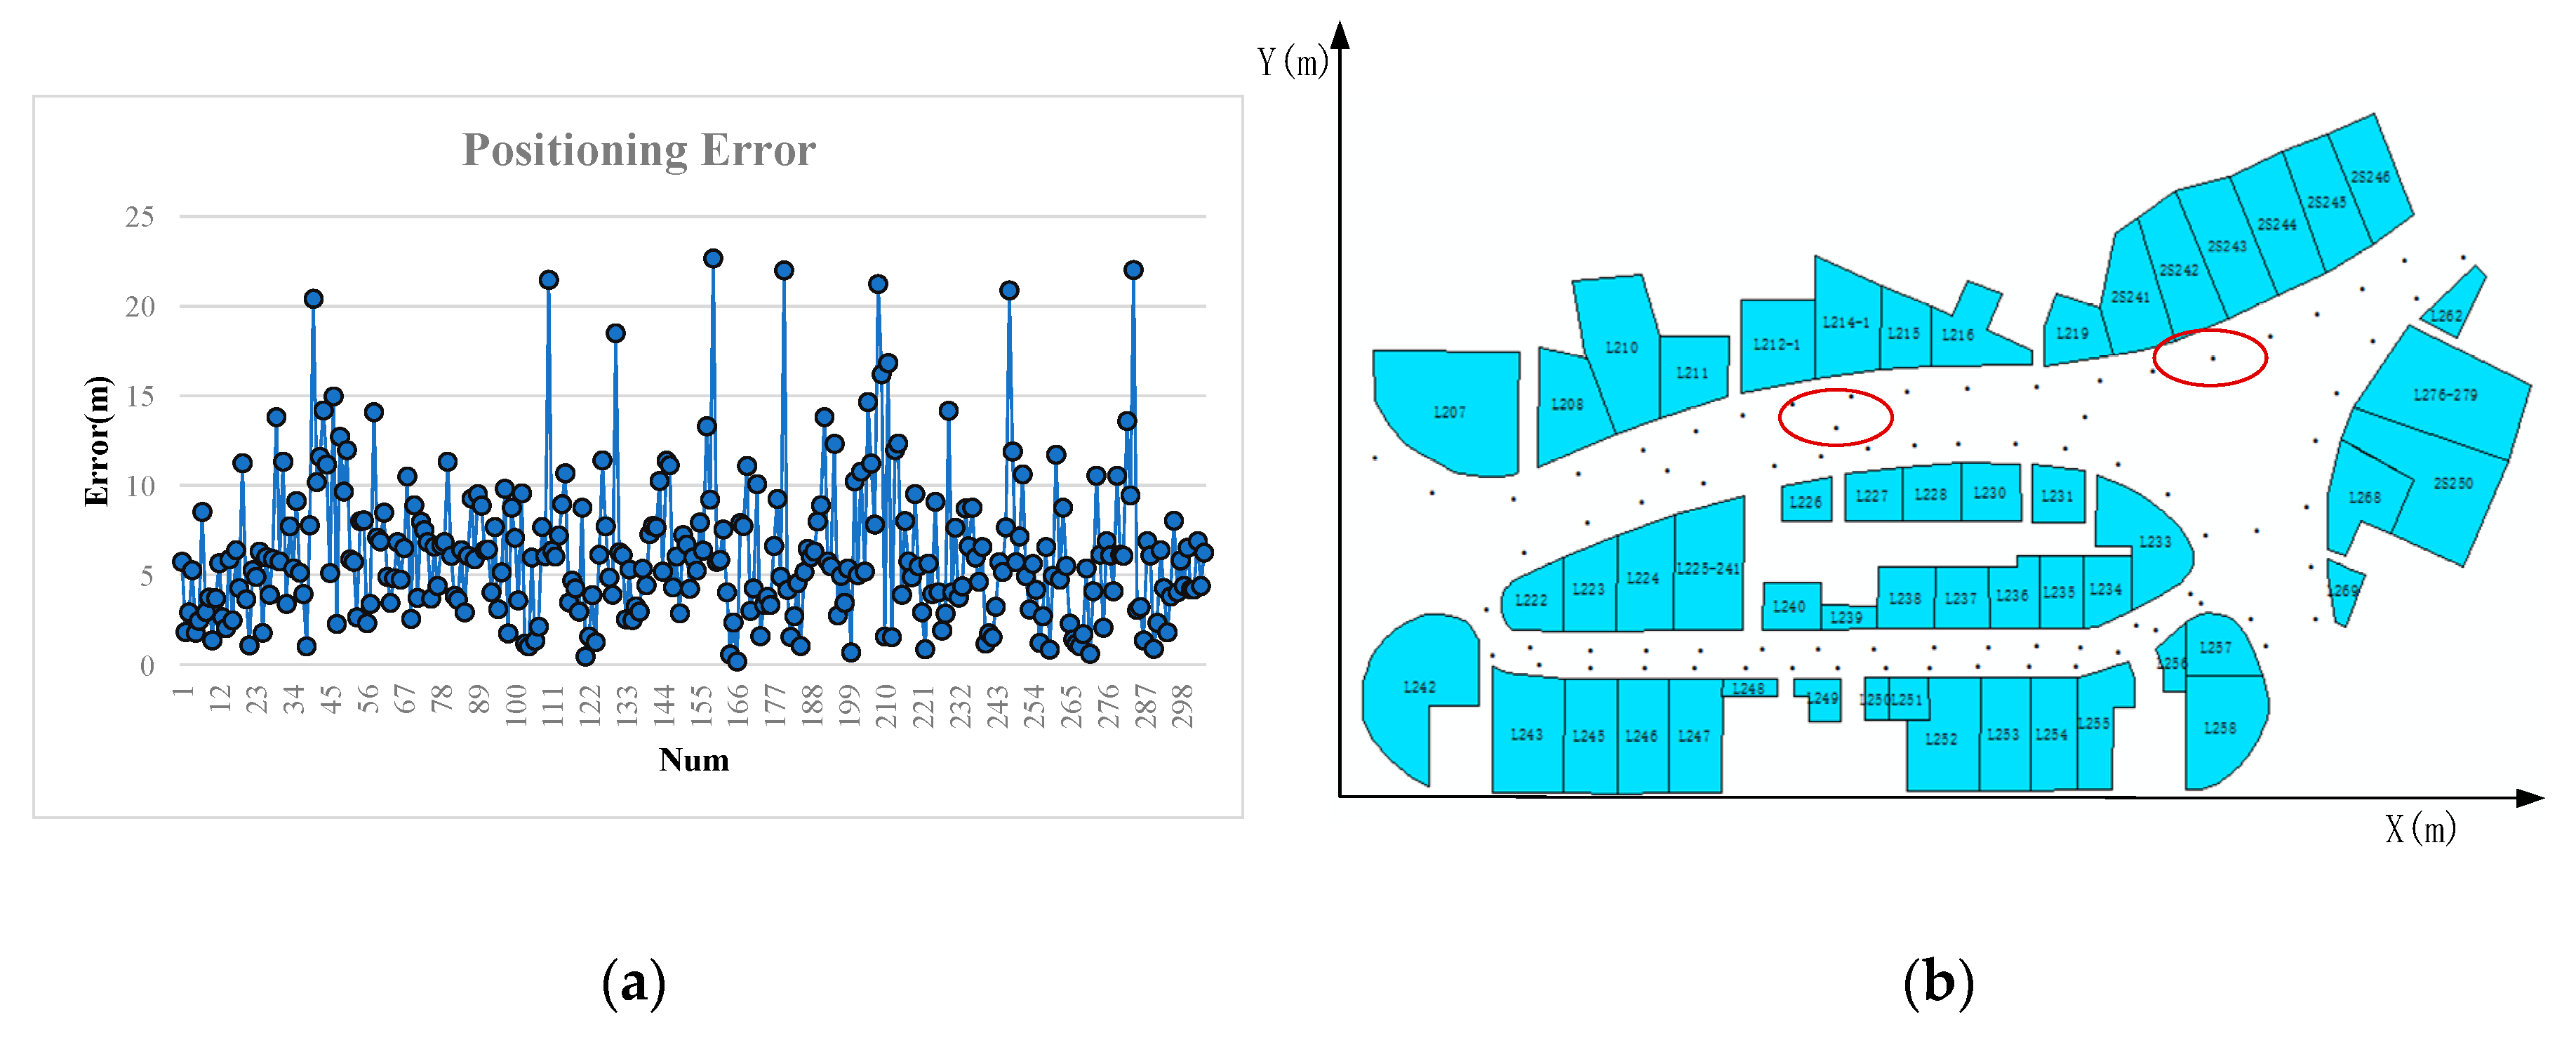
3.2.1. Near Relation Boundary
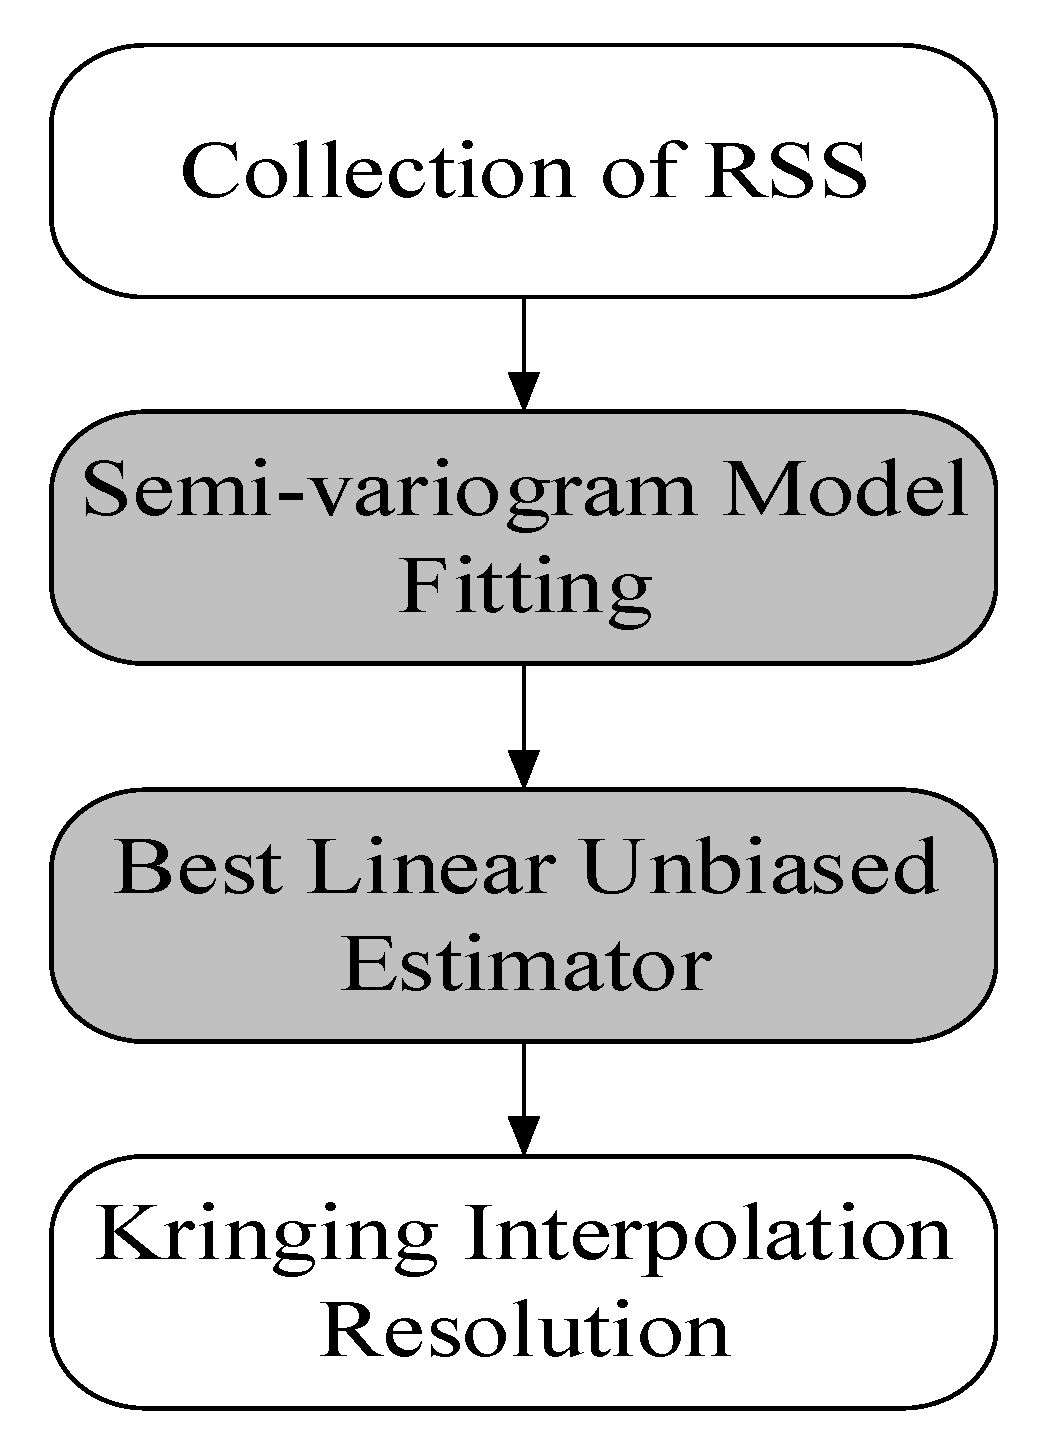
3.2.2. Kriging Interpolation Method
- (1)
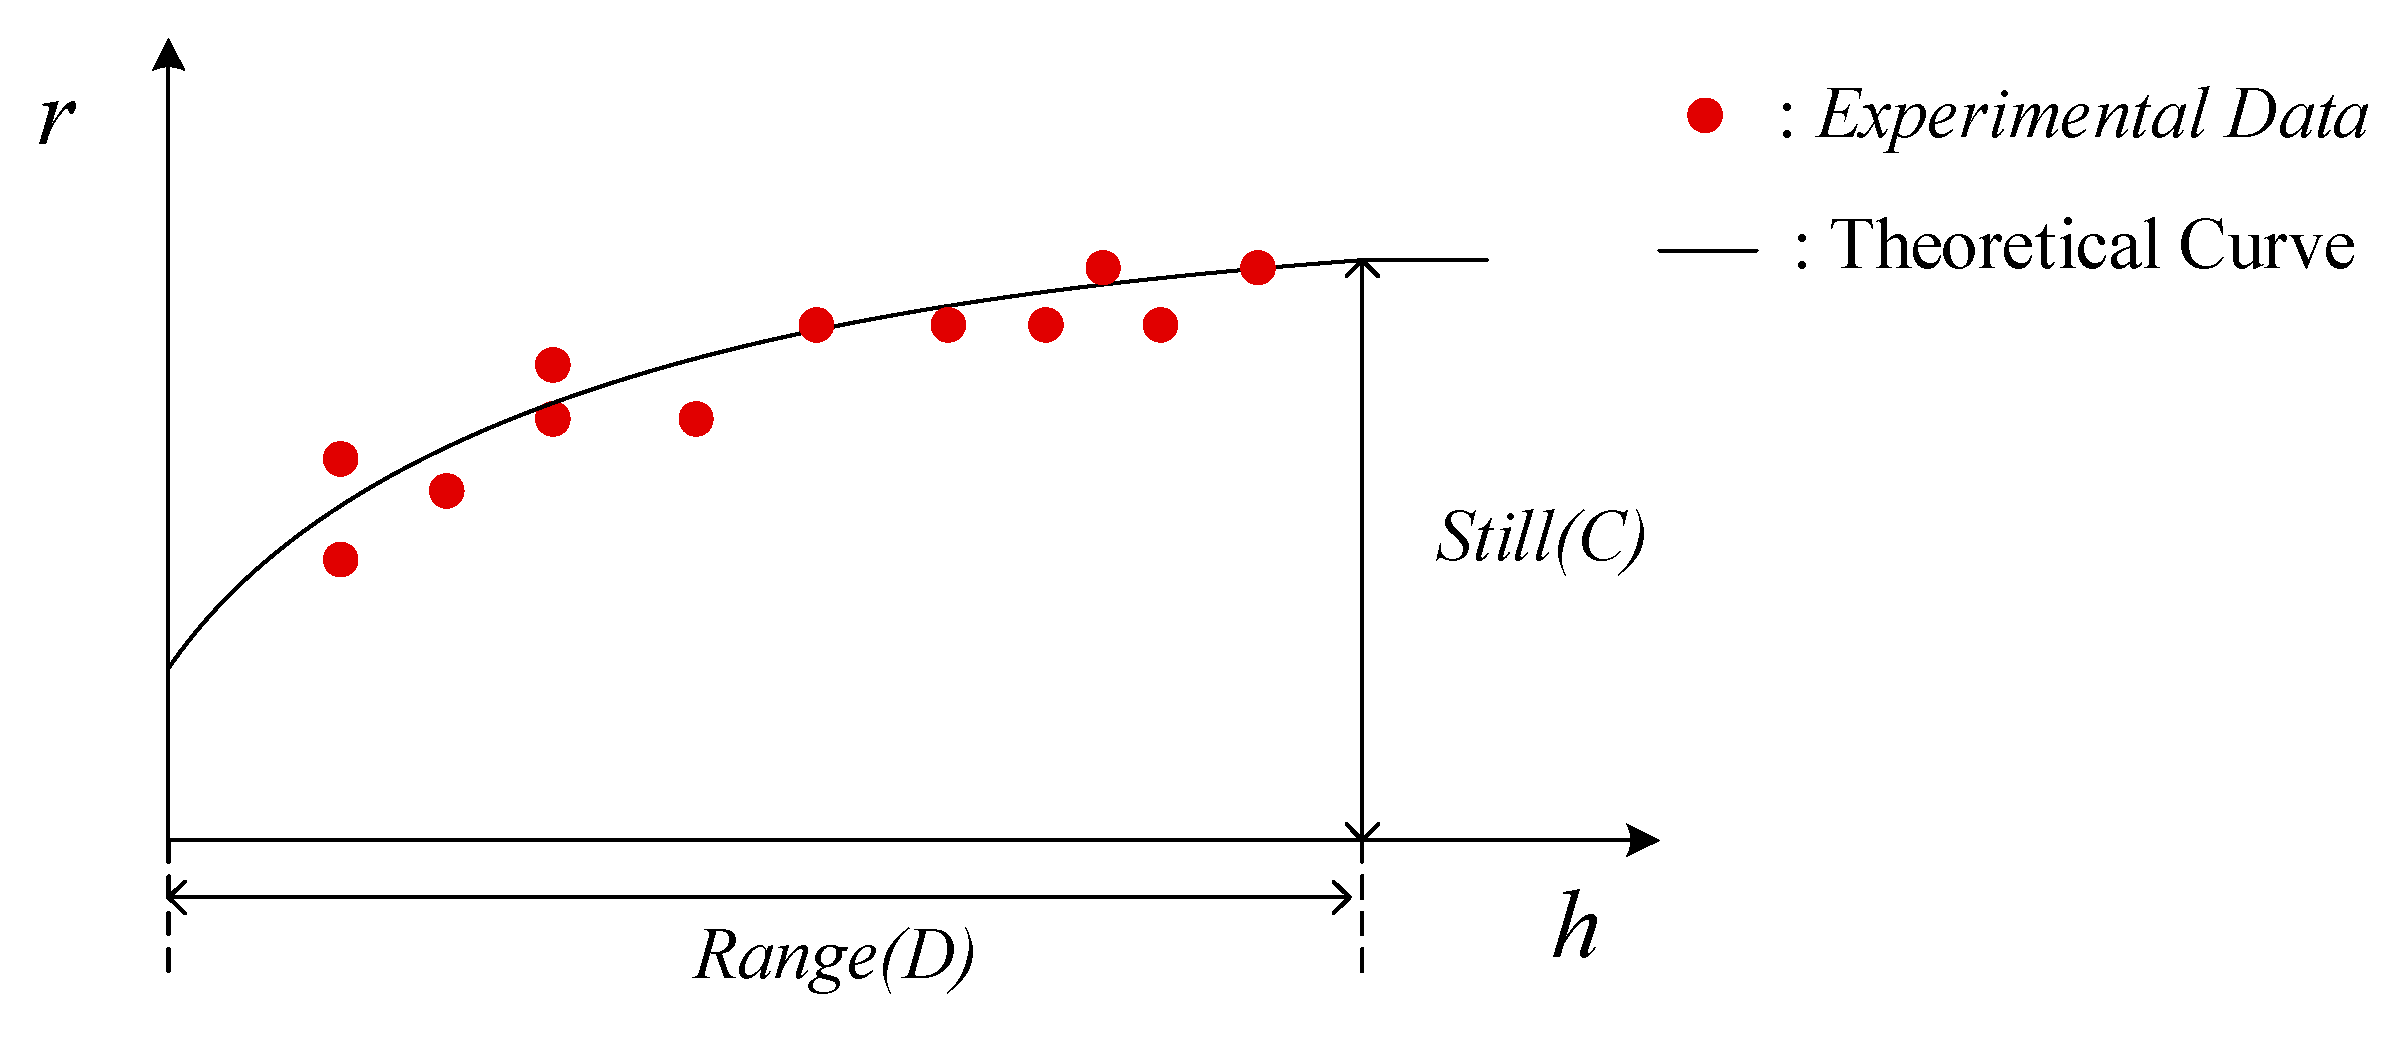
- Semi-variogram model fitting
- (2)
- Best linear unbiased estimate
3.2.3. Match Algorithm
4. Experiment and Evaluation
4.1. Experiment Steps
4.2. Localization Results and Evaluation
5. Conclusions
Author Contributions
Funding
Acknowledgments
Conflicts of Interest
References
- Xia, S.; Liu, Y.; Yuan, G.; Zhu, M.; Wang, Z. Indoor Fingerprint Positioning Based on Wi-Fi: An Overview. ISPRS Int. J. Geo-Inf. 2017, 6, 135. [Google Scholar] [CrossRef]
- Hu, J.; Liu, D.; Yan, Z.; Liu, H. Experimental analysis on weight K-nearest neighbor indoor fingerprint positioning. IEEE Internet Things J. 2018, 6, 891–897. [Google Scholar] [CrossRef]
- Mainetti, L.; Patrono, L.; Sergi, I. A survey on indoor positioning systems. In Proceedings of the 2014 22nd International Conference on Software, Telecommunications and Computer Networks (SoftCOM), Split, Croatia, 17–19 September 2014; pp. 111–120. [Google Scholar]
- Tang, H.; Xue, F.; Liu, T.; Zhao, M.; Dong, C. Indoor Positioning Algorithm Fusing Multi-Source Information. Wireless Pers. Commun. 2019, 109, 2541–2560. [Google Scholar] [CrossRef]
- Ren, J.; Wang, Y.; Niu, C.; Song, W.; Huang, S. A Novel Clustering Algorithm for Wi-Fi Indoor Positioning. IEEE Access 2019, 7, 122428–122434. [Google Scholar] [CrossRef]
- Leca, C.L.; Nicolaescu, I.; Ciotirnae, P. Crowdsensing Influences and Error Sources in Urban Outdoor Wi-Fi Fingerprinting Positioning. Sensors 2020, 20, 427. [Google Scholar] [CrossRef]
- Brena, R.F.; García-Vázquez, J.P.; Galván-Tejada, C.E.; Muñoz-Rodriguez, D.; Vargas-Rosales, C.; Fangmeyer, J. Evolution of indoor positioning technologies: A survey. J. Sens. 2017, 4, 25–37. [Google Scholar] [CrossRef]
- Zafari, F.; Gkelias, A.; Leung, K.K. A Survey of Indoor Localization Systems and Technologies. arXiv 2017, arXiv:1709.01015. [Google Scholar] [CrossRef]
- Ge, X.; Qu, Z. Optimization WI-FI indoor positioning KNN algorithm location-based fingerprint. In Proceedings of the 2016 7th IEEE International Conference on Software Engineering and Service Science (ICSESS), Beijing, China, 26–28 August 2016; pp. 135–137. [Google Scholar]
- Chen, X.; Zou, S. Improved Wi-Fi indoor positioning based on particle swarm optimization. IEEE Sens. J. 2017, 17, 7143–7148. [Google Scholar] [CrossRef]
- Han, S.; Li, Y.; Meng, W.; Li, C.; Liu, T.; Zhang, Y. Indoor Localization with a Single Wi-Fi Access Point Based on OFDM-MIMO. IEEE Syst. J. 2019, 13, 964–972. [Google Scholar] [CrossRef]
- Du, X.; Yang, K. A map-assisted Wi-Fi AP placement algorithm enabling mobile device’s indoor positioning. IEEE Syst. J. 2017, 11, 1467–1475. [Google Scholar] [CrossRef]
- Subedi, S.; Gang, H.S.; Ko, N.Y.; Hwang, S.S.; Pyun, J.Y. Improving indoor fingerprinting positioning with affinity propagation clustering and weighted centroid fingerprint. IEEE Access 2019, 7, 31738–31750. [Google Scholar] [CrossRef]
- Huang, B.; Xu, Z.; Jia, B.; Mao, G. An online radio map update scheme for Wi-Fi fingerprint-based localization. IEEE Internet Things J. 2019, 6, 6909–6918. [Google Scholar] [CrossRef]
- Li, Y.; Zhuang, Y.; Lan, H.; Niu, X.; El-Sheimy, N. A profile-matching method for wireless positioning. IEEE Commun. Lett. 2016, 20, 2514–2517. [Google Scholar] [CrossRef]
- Liu, M.; Chen, R.; Li, D.; Chen, Y.; Guo, G.; Cao, Z.; Pan, Y. Scene Recognition for Indoor Localization Using a Multi-Sensor Fusion Approach. Sensors 2017, 17, 2847. [Google Scholar] [CrossRef]
- Chen, G.; Meng, X.; Wang, Y.; Zhang, Y.; Tian, P.; Yang, H. Integrated WiFi/PDR/Smartphone Using an Unscented Kalman Filter Algorithm for 3D Indoor Localization. Sensors 2015, 15, 24595–24614. [Google Scholar] [CrossRef]
- Altintas, B.; Serif, T. Improving RSS-Based Indoor Positioning Algorithm via K-Means Clustering. In Proceedings of the 17th European Wireless 2011-Sustainable Wireless Technologies, Vienna, Austria, 27–29 April 2011; IEEE: New York, NY, USA, 2011; pp. 681–685. [Google Scholar]
- Hu, X.; Shang, J.; Gu, F.; Han, Q. Improving Wi-Fi Indoor Positioning via AP Sets Similarity and Semi-Supervised Affinity Propagation Clustering. Int. J. Distrib. Sens. Netw. 2015, 2015, 1–11. [Google Scholar] [CrossRef]
- Lee, C.W.; Lin, T.N.; Fang, S.H.; Chou, Y.C. A novel clustering-based approach of indoor location fingerprinting. In Proceedings of the IEEE 24th International Symposium on Personal, Indoor and Mobile Radio Communications, London, UK, 8–11 September 2013; IEEE: New York, NY, USA, 2013; pp. 71–82. [Google Scholar]
- Tang, J.; Chen, Y.; Chen, L.; Liu, J.; Hyyppä, J.; Kukko, A.; Kaartinen, H.; Hyyppä, H.; Chen, R. Fast Fingerprint Database Maintenance for Indoor Positioning Based on UGV SLAM. Sensors 2015, 15, 5311–5330. [Google Scholar] [CrossRef]
- Chen, W.; Wang, W.; Li, Q.; Chang, Q.; Hou, H. A Crowd-Sourcing Indoor Localization Algorithm via Optical Camera on a Smartphone Assisted by Wi-Fi Fingerprint RSSI. Sensors 2016, 16, 410. [Google Scholar] [CrossRef]
- Wang, X.; Wei, X.; Liu, Y. Received signal strength-based localization for large space indoor environments. Int. J. Distrib. Sens. Netw. 2017, 13, 1–12. [Google Scholar] [CrossRef]
- Shen, G.; Han, D.; Liu, P. A Sparse Manifold Learning Approach to Robust Indoor Positioning Based on Wi-Fi RSS Fingerprinting. IEEE Access 2019, 7, 130791–130803. [Google Scholar] [CrossRef]
- Lee, M.; Han, D. Voronoi Tessellation Based Interpolation Method for Wi-Fi Radio Map Construction. IEEE Comm. Lett. 2012, 16, 404–407. [Google Scholar] [CrossRef]
- Zuo, J.; Liu, S.; Xia, H.; Qiao, Y. Multi-Phase Fingerprint Map Based on Interpolation for Indoor Localization Using iBeacons. IEEE Sens. J. 2018, 1, 3351–3359. [Google Scholar] [CrossRef]
- Li, G.; Geng, E.; Ye, Z.; Xu, Y.; Lin, J.; Pang, Y. Indoor Positioning Algorithm Based on the Improved RSSI Distance Model. Sensors 2018, 18, 2820. [Google Scholar] [CrossRef] [PubMed]
- Jan, S.S.; Yeh, S.J.; Liu, Y.W. Received Signal Strength Database Interpolation by Kriging for a Wi-Fi Indoor Positioning System. Sensors 2015, 15, 21377–21393. [Google Scholar] [CrossRef] [PubMed]
- Moghtadaiee, V.; Ghorashi, S.A.; Ghavami, M. New Reconstructed Database for Cost Reduction in Indoor Fingerprinting Localization. IEEE Access 2019, 7, 104462–104477. [Google Scholar] [CrossRef]
- Talvitie, J.; Renfors, M.; Lohan, E.S. Distance-based interpolation and extrapolation methods for RSS-based localization with indoor wireless signals. IEEE Trans. Veh. Technol. 2015, 64, 1340–1353. [Google Scholar] [CrossRef]
- Bi, J.X.; Wang, Y.J.; Li, Z.K.; Xu, S.L.; Zhou, J.P.; Sun, M.; Si, M.H. Fast Radio Map Construction by using Adaptive Path Loss Model Interpolation in Large-Scale Building. Sensors 2019, 19, 712. [Google Scholar] [CrossRef] [PubMed]
- Kram, S.; Nickel, C.; Seitz, J.; Patino-Studencka, L.; Thielecke, J. Spatial interpolation of Wi-Fi RSS fingerprints using model-based universal kriging. In Proceedings of the 2017 Sensor Data Fusion: Trends, Solutions, Applications (SDF), Bonn, Germany, 10–12 October 2017; pp. 1–6. [Google Scholar] [CrossRef]
- Dinh, T.M.T.; Duong, N.S.; Sandrasegaran, K. Smartphone-Based Indoor Positioning Using BLE iBeacon and Reliable Lightweight Fingerprint Map. IEEE Sens. J. 2020, 20, 10283–10294. [Google Scholar] [CrossRef]
- Brennan, J.; Martin, E. Foundations for a formalism of nearness. In Australian Joint Conference on Artificial Intelligence; Springer: Berlin/Heidelberg, Germany, 2002; pp. 71–82. [Google Scholar]
- Wang, Y.; Fan, H.; Chen, R. Indoors Locality Positioning Using Cognitive Distances and Directions. Sensors 2017, 17, 2828. [Google Scholar] [CrossRef] [PubMed]
- Jiang, B.; Yao, X. Location-based services and GIS in perspective. Comput. Environ. Urban Syst. 2006, 30, 712–725. [Google Scholar] [CrossRef]
- Liu, Y.; Guo, Q.H.; Wieczorek, J.; Goodchild, M.F. Positioning localities based on spatial assertions. Int. J. Geogr. Inf. Sci. 2009, 23, 1471–1501. [Google Scholar] [CrossRef]
- Gong, Y.; Wu, L.; Lin, Y.; Liu, Y. Probability issues in locality descriptions based on Voronoi neighbor relationship. J. Vis. Lang. Comput. 2012, 23, 213–222. [Google Scholar] [CrossRef]
- Gong, Y.; Li, G.; Tian, Y.; Lin, Y.; Liu, Y. A vector-based algorithm to generate and update multiplicatively weighted Voronoi diagrams for points, polylines, and polygons. Comput. Geosci. 2012, 42, 118–125. [Google Scholar] [CrossRef]
- Wang, Y.; Fan, H.; Chen, R.; Li, H.; Wang, L.; Zhao, K.; Du, W. Positioning Locality Using Cognitive Directions Based on Indoor Landmark Reference System. Sensors 2018, 18, 1049. [Google Scholar] [CrossRef]
- Wang, Y.; Fan, H.; Wang, L.; Guo, R.; Li, X.; Wang, W.; Tang, S.; Li, Y.; Zhang, X.; Xiu, W. Indoors Positioning Based on Spatial Relationships in Locality Description. IEEE Access 2020, 8, 34794–34809. [Google Scholar] [CrossRef]


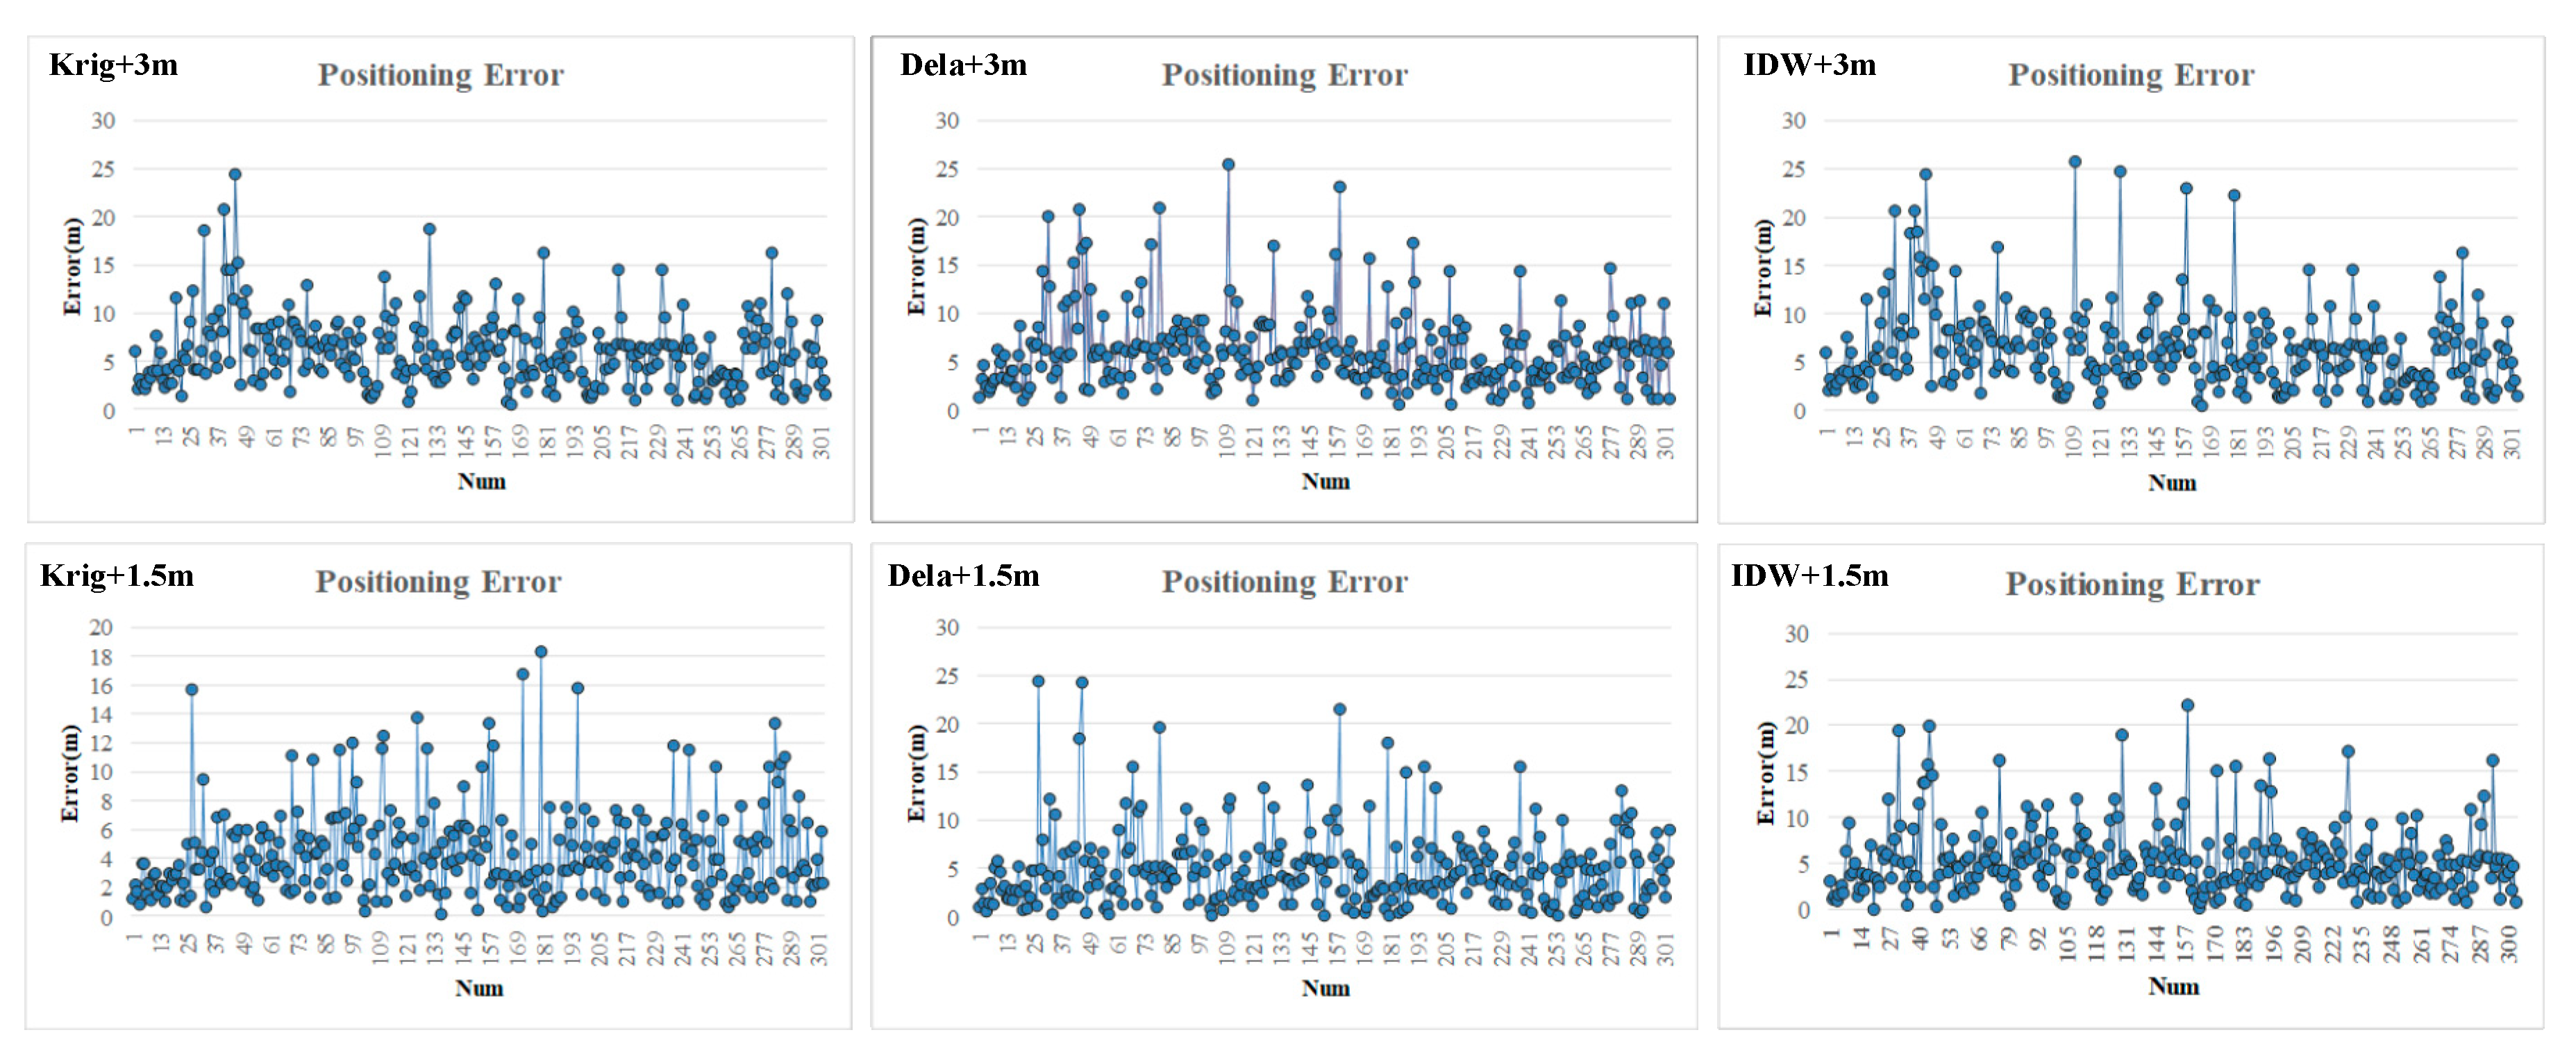
| Max-Error | Min-Error | Mean-Error | |
|---|---|---|---|
| IDW + 3 m | 25.76 | 0.46 | 6.38 |
| IDW + 1.5 m | 22.25 | 0.16 | 5.31 |
| Dela + 3 m | 25.36 | 0.51 | 6.06 |
| Dela + 1.5 m | 24.36 | 0.4 | 4.81 |
| Krig + 3 m | 24.4 | 0.46 | 5.94 |
| Krig + 1.5 m | 18.31 | 0.18 | 4.31 |
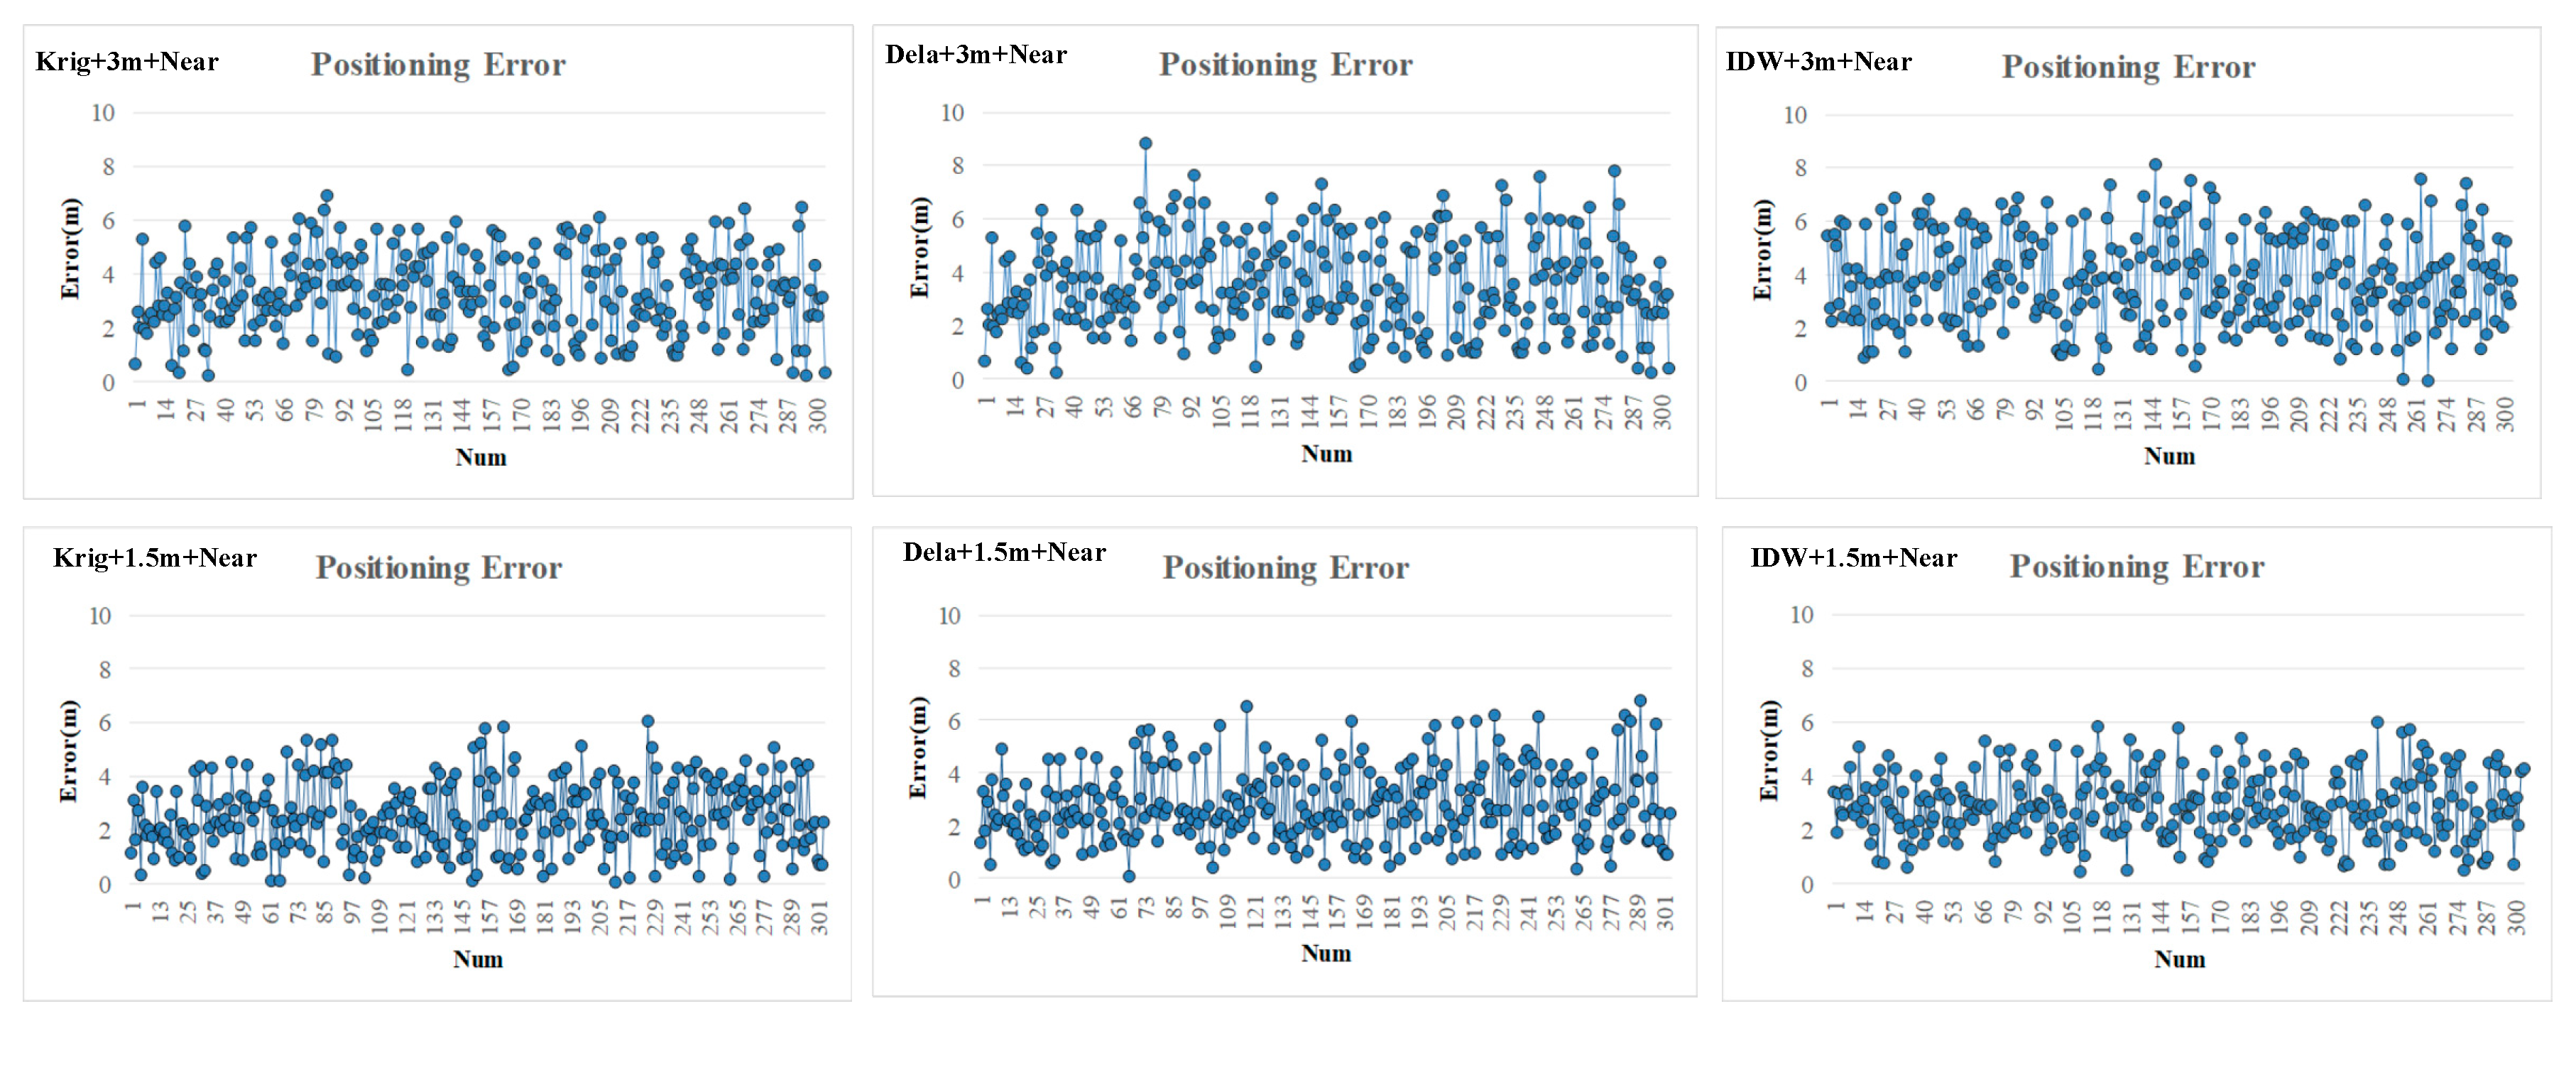
| Max-Error | Min-Error | Mean-Error | |
|---|---|---|---|
| Near + IDW + 3 m | 8.15 | 0.19 | 4.81 |
| Near + IDW + 1.5 m | 5.97 | 0.42 | 3.85 |
| Near + Dela + 3 m | 8.8 | 0.22 | 4.49 |
| Near + Dela + 1.5 m | 6.72 | 0.07 | 3.68 |
| Near + Krig + 3 m | 6.89 | 0.22 | 4.23 |
| Near + Krig + 1.5 m | 6.03 | 0.26 | 3.17 |
| K | Mean-Error(m) | Min-Error(m) | Max-Error(m) |
|---|---|---|---|
| 3 | 2.86 | 0.46 | 4.86 |
| 4 | 2.89 | 0.56 | 4.91 |
| 5 | 3.12 | 0.91 | 5.21 |
| 6 | 3.34 | 0.83 | 5.13 |
| 7 | 3.41 | 0.77 | 5.43 |
| 8 | 3.76 | 0.81 | 4.91 |
| 9 | 3.69 | 0.69 | 4.88 |
| 10 | 3.71 | 0.57 | 4.97 |
Publisher’s Note: MDPI stays neutral with regard to jurisdictional claims in published maps and institutional affiliations. |
© 2020 by the authors. Licensee MDPI, Basel, Switzerland. This article is an open access article distributed under the terms and conditions of the Creative Commons Attribution (CC BY) license (http://creativecommons.org/licenses/by/4.0/).
Share and Cite
Wang, Y.; Guo, R.; Wang, W.; Li, X.; Tang, S.; Zhang, W.; Wang, L.; Chen, L.; Li, Y.; Xiu, W. Near Relation-Based Indoor Positioning Method under Sparse Wi-Fi Fingerprints. ISPRS Int. J. Geo-Inf. 2020, 9, 714. https://doi.org/10.3390/ijgi9120714
Wang Y, Guo R, Wang W, Li X, Tang S, Zhang W, Wang L, Chen L, Li Y, Xiu W. Near Relation-Based Indoor Positioning Method under Sparse Wi-Fi Fingerprints. ISPRS International Journal of Geo-Information. 2020; 9(12):714. https://doi.org/10.3390/ijgi9120714
Chicago/Turabian StyleWang, Yankun, Renzhong Guo, Weixi Wang, Xiaoming Li, Shengjun Tang, Wei Zhang, Luyao Wang, Liang Chen, You Li, and Wenqun Xiu. 2020. "Near Relation-Based Indoor Positioning Method under Sparse Wi-Fi Fingerprints" ISPRS International Journal of Geo-Information 9, no. 12: 714. https://doi.org/10.3390/ijgi9120714
APA StyleWang, Y., Guo, R., Wang, W., Li, X., Tang, S., Zhang, W., Wang, L., Chen, L., Li, Y., & Xiu, W. (2020). Near Relation-Based Indoor Positioning Method under Sparse Wi-Fi Fingerprints. ISPRS International Journal of Geo-Information, 9(12), 714. https://doi.org/10.3390/ijgi9120714