Article

What Went Wrong for Bad Solvers during Thematic Map Analysis? Lessons Learned from an Eye-Tracking Study

by
Lenka Havelková
1,* and
Izabela Małgorzata Gołębiowska
2
1
Centre for Geographical and Environmental Education, Department of Social Geography and Regional Development, Faculty of Science, Charles University, Albertov 6, 128 00 Praha 2, Czech Republic
2
Department of Geoinformatics, Cartography and Remote Sensing, Faculty of Geography and Regional Studies, University of Warsaw, Krakowskie Przedmiescie 30, 00-927 Warsaw, Poland
*
Author to whom correspondence should be addressed.
ISPRS Int. J. Geo-Inf. 2020, 9(1), 9; https://doi.org/10.3390/ijgi9010009
Submission received: 30 November 2019 / Revised: 16 December 2019 / Accepted: 18 December 2019 / Published: 20 December 2019

Abstract

:
Thematic map analysis is a complex and challenging task that might result in map user failure for many reasons. In the study reported here, we wanted to search for differences between successful and unsuccessful map users, focusing—unlike many similar studies—on strategies applied by users who give incorrect answers. In the eye-tracking study, followed by a questionnaire survey, we collected data from 39 participants. The eye-tracking data were analyzed both qualitatively and quantitatively to compare participants’ strategies from various perspectives. Unlike the results of some other studies, it turned out that unsuccessful participants show some similarities that are consistent across most analyzed tasks. The main issues that characterize bad solvers relate to improper use of the thematic legend, the inability to focus on relevant map layout elements, as well as on adequate map content. Moreover, they differed in the general problem-solving approach used as they, for example, tended to choose fast, less cautious, strategies. Based on the collected results, we developed tips that could help prevent unsuccessful participants ending with an incorrect answer and therefore be beneficial in map use education.

1. Introduction

Maps are an important and powerful tool for data visualization. However, this power depends largely on the user [1,2,3]. Depending on their competencies and abilities, maps can be used in a proper and in-depth manner [4].
Map users apply various ways of map-reading and analysis. Their strategy may be different depending on various factors, e.g. level of experience [5,6,7,8] or educational background [9,10,11,12], resulting in a better or worse result in acquiring information from maps. In the course of education, it is valuable to learn the most effective and efficient strategies. In many empirical studies, authors, in fact, focused on the best strategies of map usage applied by ‘good solvers’ (e.g., [6,13,14,15]). However, it is equally important to learn what ‘wrong’ strategies look like in order to improve them and emphasize the omission of ‘wrong steps’ taken when working with a map.
The aim of the study reported here is thus to explore the less successful strategies of users working with maps. We want to learn if less successful users display distinct behavior when compared to more successful users. Even though some studies suggested it was not possible to generally characterize the behavior of less successful users [13,16], we aim to verify if some similarities may be identifiable. Ultimately, we want to develop a list of tips that may be valuable in map usage education and training in order to indicate possible sources of confusion for users and inappropriate strategies.
Working with a map can be conducted on different levels of complexity. In many studies, authors refer to primitives [17] and simple tasks (e.g., [5,18,19,20,21]), often relying on one of the developed taxonomies (e.g., [12,13]). However, it is often emphasized that a map is also a tool for analysis and general pattern exploration [4,22,23]. In this case, map users refer to different (thematic) map layers, compare them, and conduct a series of mental operations to reach an ultimate answer. This is also more prone to mistakes and inappropriate strategies than simple map-reading tasks. We thus want to focus on more complex map analysis tasks to explore more challenging scenarios of map usage.
Unlike many previous studies, we propose the approach of searching for the reasons for incorrect responses and examining the strategies that lead to incorrect tasks solutions. We thus aim to answer the following questions:
1
What distinguishes less successful and more successful users when solving map analysis tasks?
2
Do strategies applied by less successful map users feature some similarities?
3
Are outliers from the perspective of task-solving strategies among the less successful users only?
With the empirical study conducted, we want to refine our understanding of how less and more efficient users work when solving map analysis tasks. We thus want to define how strategies resulting in incorrect solutions can be improved.

1.1. Searching for Group Differences among Map Users

When addressing the problem of map-reading and analysis, authors often characterize map users’ work, mainly focusing on more successful map use processes. The data collected are analyzed in order to find similarities within subgroups of participants, searching for patterns of users’ behavior when conducting given tasks. Authors applied various criteria to divide users into such subgroups.
A frequently employed factor when examining visual attention is the level of expertise; not only in cartography but in many other domains (e.g., [24,25,26,27]). The focus on this factor is grounded in the novice–expert paradigm which assumes a different approach by an expert and a novice in solving tasks, and also independent variables influencing it [28,29]. There are several theories closely related to the novice–expert differences, e.g., theory of memory and knowledge representation, theory of cognitive load, theory of information reduction, and theory of the holistic model of image perception [30,31,32,33,34]. Regarding the research into map use strategies, the most important differences that can be identified are as follows:
  • experts are able to solve tasks faster than novices by recalling the necessary information from long-term memory more easily and quickly and, therefore, also solving them more effectively;
  • experts link information based on its similarity to the task being solved, while novices tend to link information based on its visual similarity; therefore, it is more difficult for them to distinguish non-essential from essential information;
  • experts are able to process a greater part of the stimulus at a certain time than novices as they are able to extract information from widely distanced and parafoveal regions;
  • experts consider various possibilities when solving a task, they verify the solution obtained and, based on that, they adjust their strategy for other task solving.
There are various ways of defining novices and experts. For instance, when analyzing wayfinding strategies [35], expert participants in the sport of orienteering were selected. Whereas Ooms et al. [5], when examining visual searching on dynamic and interactive maps, included employees from the Department of Geography, who held at least a master’s degree in geography or geomatics, in the group of experts; hence they referred to their educational background and professional work (see also [7,12,19,36,37,38]). In general, this type of expertise can be called ‘top-down’ expertise as it refers to the participants’ previous related knowledge and experience that can be of use to them when solving testing tasks.
There is also a possible opposite way of defining expertise. Some authors find the (results of) collected data useful for defining participants’ proficiency. Çöltekin et al. [13] chose answer time as a criterion for division into groups and their further comparison (see also [39]) in terms of sequence analysis of viewing delimited AOIs (areas of interest), whereas Opach et al. [14] relied on answer correctness in order to distinguish more and less effective solvers (see also [16]) when comparing visual behavior when viewing a multi-component animated map.
Both general approaches described above are appropriate. Selecting how to distinguish the subgroups for further comparison depends on the aim of the study. What is common to most approaches is the focus on discussing what constitutes expert participants, paying less attention to the less experienced participants [5,6,7]. Authors mainly wanted to characterize more successful approaches and strategies, as an ultimate pattern of behavior to be achieved.

1.2. Methods of Gaining Insight into Map-Reading and Analysis

When empirically studying how users work with maps, various methods of data collection can be taken into account. Usability performance metrics [40] are most commonly employed (e.g., [41]), such as satisfaction, efficiency, and effectiveness. These metrics refer to users’ opinions and preferences (satisfaction), time taken to answer a given task (efficiency), and correctness of answers (effectiveness).
However, the metrics mainly provide information on the effects of map usage and do not allow an in-depth insight into the process of task solving. The process of map-reading and analysis can be thus examined using additional data collection techniques. The data may be collected after the execution of tasks, as well as concurrently, while solving the given tasks. When applying the first approach questionnaires can be used [42,43]. The other possible choice is retrospective think-aloud (RTA), in which participants verbalize the reasoning they applied during a test that has already been completed [44,45]. RTA is often stimulated by using a visual reminder such as a video replay. However, this method, although it does not affect working memory while solving the task, has an important drawback, as many details may be forgotten [46].
Thinking aloud may also be applied upon task completion [47]. This method helps to collect valuable qualitative data on the map-reading process (e.g., [35,37,48]); however, it may also result in cognitive overload [49]. Another commonly applied method is eye-tracking that enables direct data collection and does not distract visual behavior during performance [50]. Eye-tracking allows the locations of an individual’s points of regard (PORs), i.e. the points a user is looking at, to be recorded [51]. Visual behavior can be retrieved from the analysis of locations of PORs, since, according to the ‘mind-eye hypothesis’ [52], people tend to look at things they are thinking about. Eye-tracking has been applied to various GIS empirical studies: to evaluate enhanced imagery evaluation [53], size and color of text on maps [54], comparison of 3D maps and 2D maps [55], features of flow maps [18], etc. The combination of eye-tracking and other methods has been used in recent studies with confirmed effectiveness [37,56,57,58]. For instance, Çöltekin [41] integrated eye-tracking and a traditional usability assessment into map-reading research. It is worth mentioning that GIS researchers keep searching for new methods and techniques of empirical data collection, often referring to the methods already grounded in other scientific disciplines, as EEG method that can be also integrated with eye-tracking (see e.g., [59]).

2. Materials and Methods

The main aim of this study was to identify users’ strategies during the execution of thematic map analysis tasks. Specifically, we wanted to find out if a chosen strategy was related to participants’ expertise. The user’s success in task solving was chosen as an indicator of their expertise, as applied by [13,14].

2.1. Methods and Materials

Eye-tracking and follow-up questionnaire were chosen as data collection methods. Because the eye-tracking data, despite the advantages mentioned, cannot clarify the causes of the bottlenecks during task solving and the reasoning behind the strategy selection, both quantitative and qualitative methods of data collection were applied. Thanks to applying different methods we refer to the strategy in a visual context (captured by eye tracking) as well as participant’s overall problem-solving strategy (investigated also through a questionnaire).
The achievement test (see [60]) was modified for the purpose of the study reported here. The test, modified based on the pilot study results [57], consists of 12 tasks that focus on thematic map analysis (Table 1). Four frequently used mapping methods—namely area-shading, line symbols, choropleth, and diagram mapping—were chosen based on the conducted content analysis of school geography atlases and textbooks [60] Each of the twelve tasks was presented as a separate stimulus with three possible answers while only one was correct and the rest two were distractors. To eliminate the influence of familiarity with the area depicted on task-solving process and its efficiency, fictional maps were created (see Figure 1). Similarly, the stimuli layout was set identically for all maps to eliminate its different influence on participants’ accuracy, efficiency, and mainly on their strategy between tasks (Figure 1).
Even though the maps chosen and tasks were already used in other studies [57,60], the study reported here involves a different set of empirical data, collected for other purposes. The study reported in [60] focused primarily on the impact of the map type on the map skill level, and the data used were collected among high school pupils and undergraduates in Czechia using paper achievement tests. The pilot eye-tracking study [57] involved nine first-year undergraduates in Czechia and discussed various methodological approaches (their advantages and limits) that can be used when visualizing and analyzing the eye-tracking data to identify users’ strategies.
In total, there are 12 map analysis tasks for four map types, i.e., three tasks per map type. Specifically, the first task given for each map require participants to analyze the spatial distribution of phenomena. The second tasks are focused on distances, and therefore involve the use of the map scale bar (Table 1). The third tasks require participants to describe spatial distribution by means of cardinal points indicated by a north arrow.
The follow-up questionnaire consists of both closed-ended and open-ended questions, all of them related to eye-tracking testing. First, the participants are asked about their perceived difficulty in taking the test and its individual parts. Secondly, participants report on the usage of individual task elements (e.g., task formulation, map, thematic legend, map title, etc.) during task execution. Subsequently, questions related to the applied task-solving strategy are stated. Finally, participants are asked to describe their reasoning regarding their incorrect answers to the test tasks.

2.2. Participants

A total of 41 participants voluntarily took part in the study. The participants represented two groups of differing ‘top-down’ expertise levels—intermediates and experts. Intermediates (25) were undergraduate students in their first and second year of university, majoring in geography. Experts (16) were PhD candidates and employees of departments specialized in cartography. To increase the external validity of the study, both intermediates and experts were recruited from two universities— Charles University in Czechia (12 intermediates and 6 experts) and University of Warsaw in Poland (13 intermediates and 10 experts).
All of the participants had normal or corrected-to-normal vision and completed the experiment independently. The participants did not receive any reward for participation and all of them provided their written informed consent to participate in the experiment.

2.3. Apparatus

The SMI RED250 system with a sampling rate of 250 Hz and a 15.6-inch monitor (1920 × 1080) was used in the eye-tracking experiment. The experiment at both universities was conducted in a dedicated room with appropriate lighting and no disruptions. The experiment was prepared in SMI Experiment Center and recorded data were analyzed in the open-source application OGAMA [61]. For data conversion between SMI and OGAMA, the SMI2OGAMA convertor (http://eyetracking.upol.cz/smi2ogama) was used. The fixation threshold was set at 80 ms (duration) and 50 pixels (dispersion radius; i.e., approximately 0.8° of visual angle given the average viewing distance of participants) based on the general recommendations of Popelka [62]. Apart from the OGAMA application, MS Excel, and SPSS software were used for the data analyses. ArcGIS software was used to produce attention maps. Scangraph (www.eyetracking.upol.cz/scangraph; [63]) was applied for the calculation of similarity between strings of hit AOIs, and graphs visualizing similarity values were created using Gephi software.

2.4. Procedure

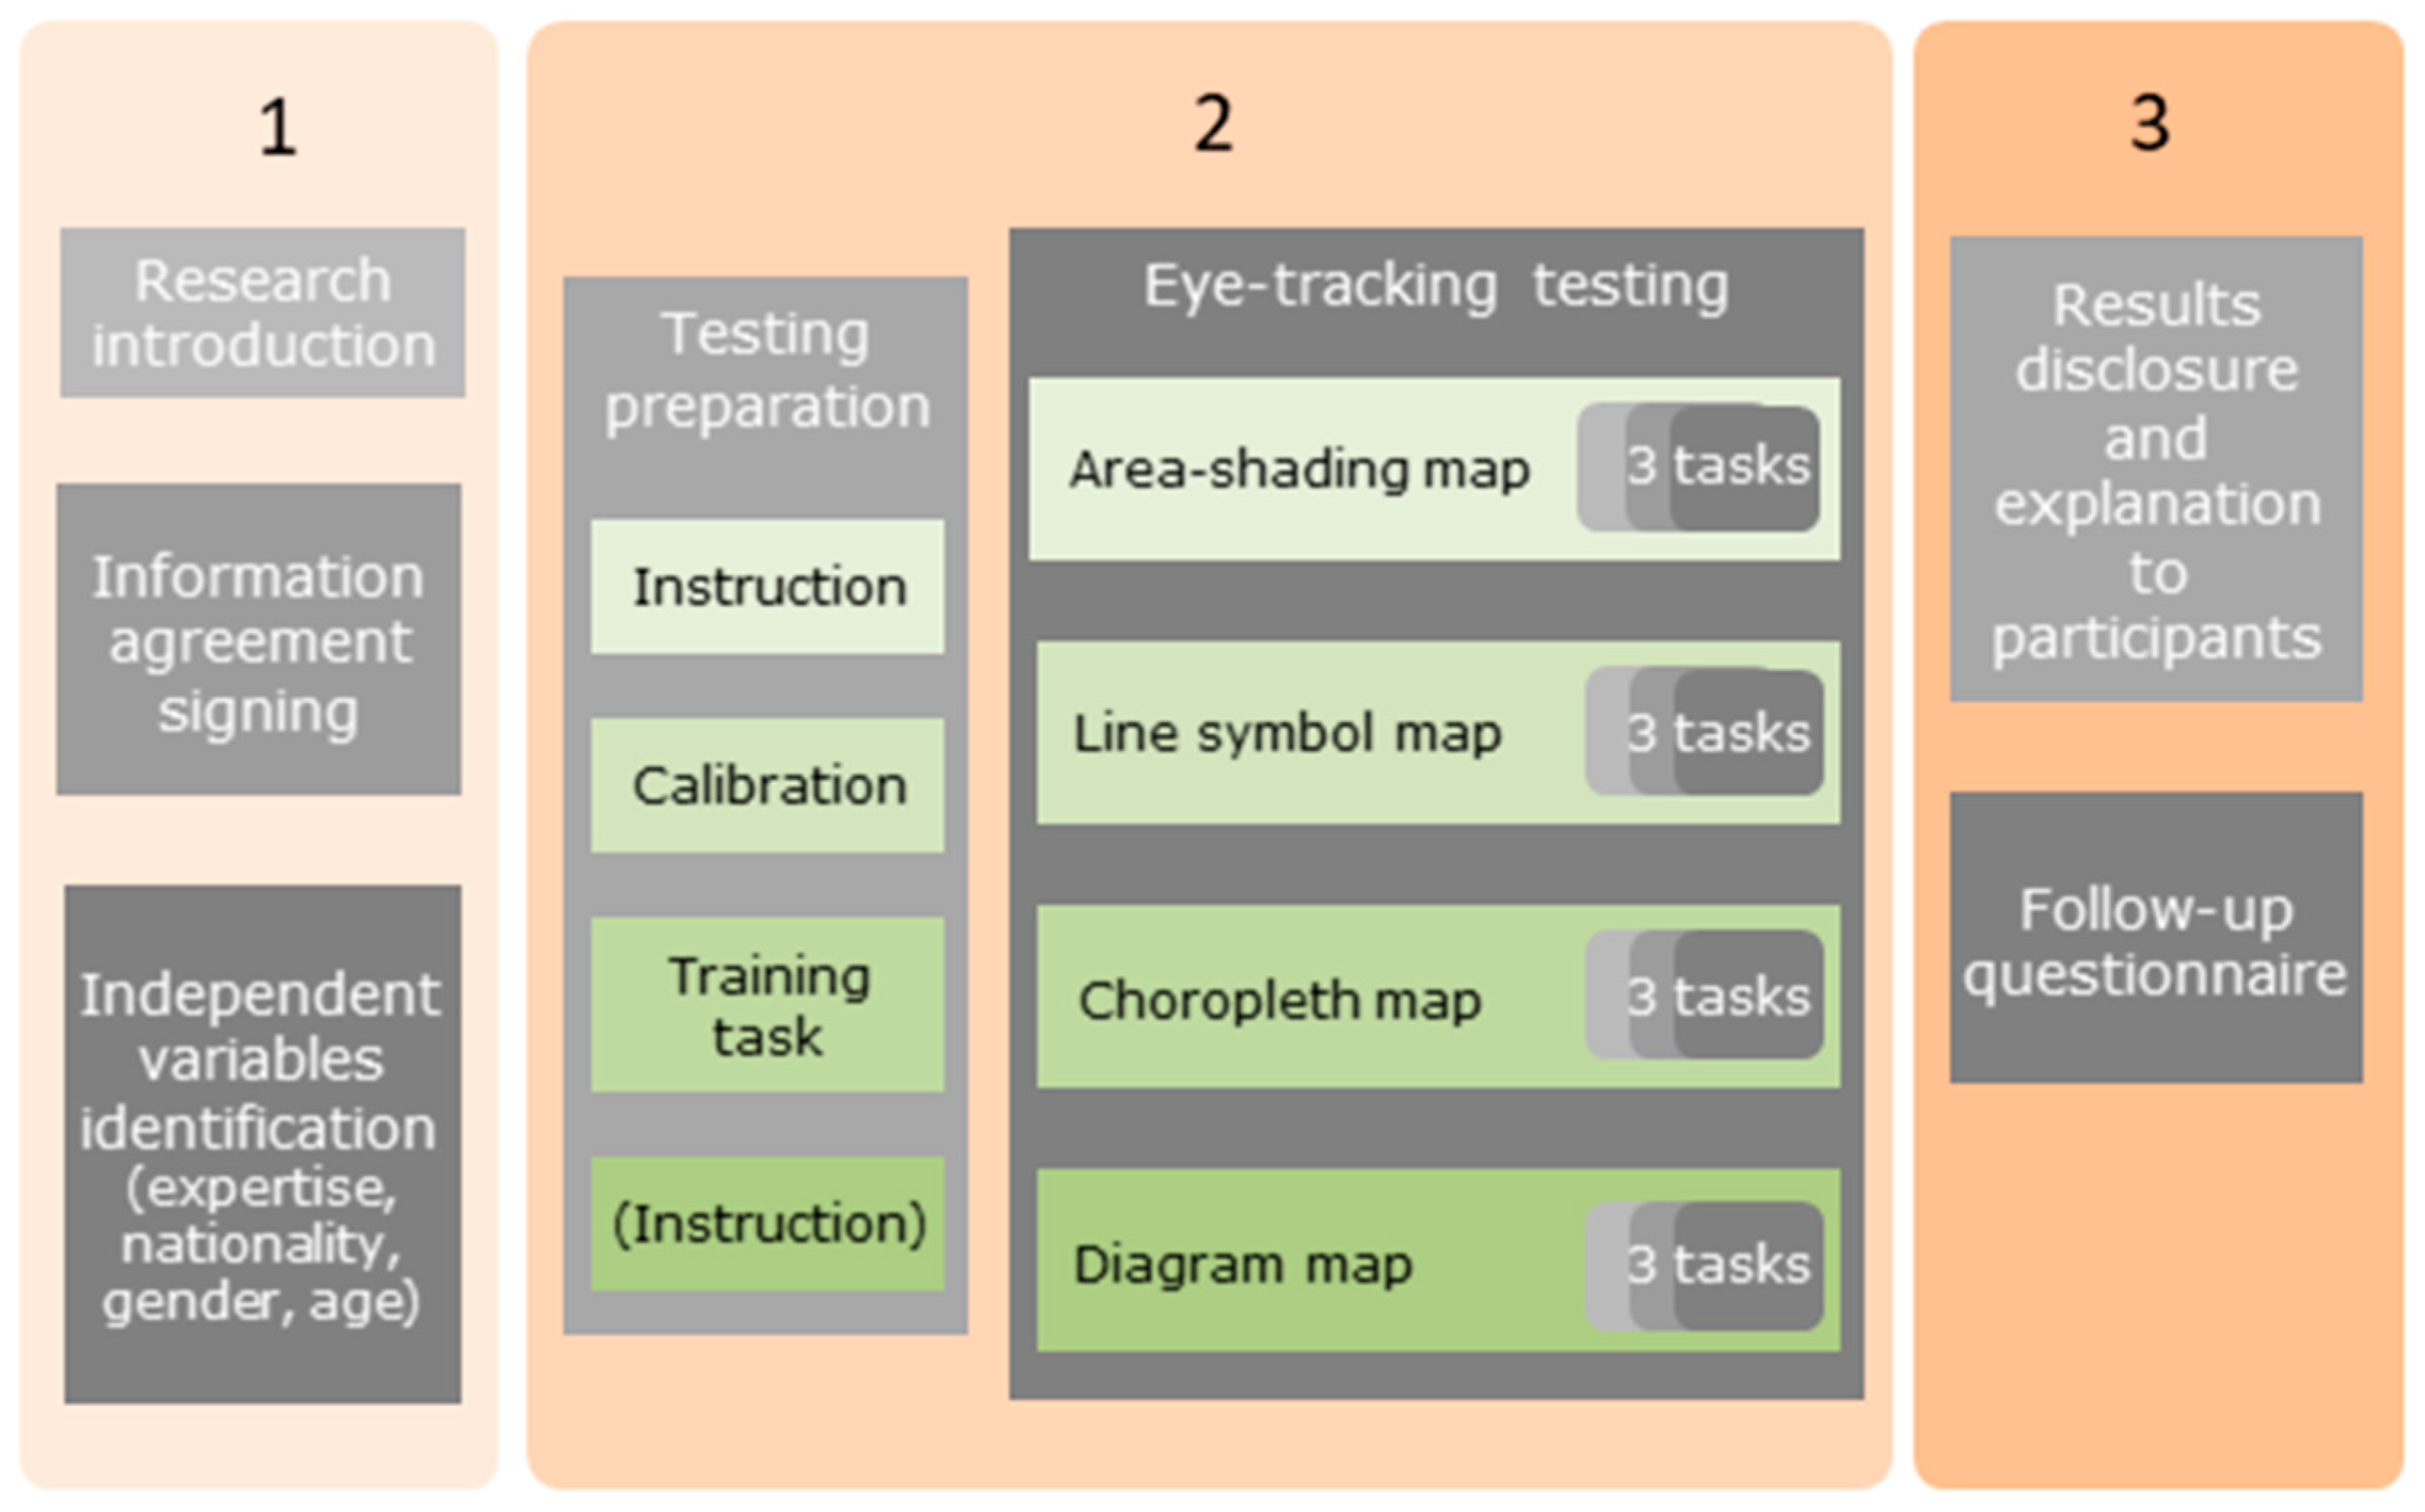
The participants were first welcomed and briefly acquainted with the study design (see Figure 2). After the introduction, instructions regarding eye-tracking testing were provided and they were asked to fill out the informed consent form and to provide some personal information. Once the participants understood the instructions and were seated appropriately (at the viewing distance: 65 ± 5 cm), the experimental session began.
A calibration threshold was set at 1° of visual angle [51]. Participant eyes were calibrated with a 9-point, full-screen calibration before the experiment began (see Figure 2). Due to persistent higher values, some participants (two persons) did not participate in the experiment, and were therefore excluded from the research sample.
Prior to the designed test, the participants were given a training task to verify their comprehension of the given instructions. The experiment had a within-subject design as all participants answered all tasks. Due to the learning effect identified in the pilot study [57] that substantially influenced participants’ strategies, the option of rotating the tasks was not chosen. Therefore, the relatively objective between-participant comparison of strategies was enabled. Subsequent to test solving, the participants were informed about the tasks that they solved incorrectly to find out correct answers.
The eye-tracking experiment duration ranged from 5.1 to 18.8 minutes (mean duration = 10.5 min). In total, all study phases lasted approximately 35 minutes for each participant. The study was conducted in the participants’ native language (i.e., in Czech or Polish). Due to the kinship of these languages, the task and possible answer formulations were almost identical from the point of view of their length and sentence structure (which resulted in almost the same size AOIs being applied in further eye-tracking data analysis).

2.5. Data Analysis

The participants for whom data loss calculated in OGAMA was higher than 15% for whole eye-tracking experiment or higher than 40% for a single task were excluded from the study sample. Subsequently, for participants with single task data loss between 10% and 40% the sufficient data quality was verified qualitatively using GazeReplay. Overall, five participants were excluded from the sample (four intermediates and one expert). Thus, further data analysis covered recordings from 34 participants. For the analysis of fixation spatial distribution and participants’ strategies, AOIs were designated around the elements of presented thematic maps in OGAMA (see Figure 1).

2.5.1. Attention Distribution on Map AOI

To find out if the participants who solved the tasks incorrectly distributed their visual attention differently comparing to successful participants, attention maps were created. The attention maps were specifically created only for the map AOI itself. Given that the map is the main element from which participants were expected to get information essential for task solving and coming to the right solution. For each of the analyzed tasks two attention maps were created, i.e., for all participants solving the task correctly and for all participants solving the task incorrectly.
To enable objective visual comparison of the attention maps created based on a different number of participants for whom the task duration also varied, relative gaze duration attention maps were created. More specifically, first the grid was placed over the map AOI and the accumulated time a participant spent fixating on spots in a certain square cell was relativized compared to the total time the participant spent fixating on the map. Secondly, the attention maps created for each of the participants were summed up over individual cells and divided by the number of participants represented to create a single relativized attention map for all participants solving the task correctly/incorrectly. Moreover, to enable inter-task comparison the same color scale was used for all the attention maps created (see Section 3.2.1 in Results). An equivalent method of attention map creation was used by [7].
As this type of attention map is not supported either by SMI BeGaze or OGAMA software, the ArcGIS Desktop software, specifically the ArcMap application, was used. The type of attention maps chosen and the method of development enabled limits of attention maps mentioned recently by [64,65] to be avoided. Namely, the resulting attention maps are not biased towards participants with a long task duration, tasks with higher mean answer time, or a higher number of participants for which the attention map was created. Moreover, biased map comparison is prevented by using the same settings (e.g., fixation detection, cell size) and design (e.g., set thresholds and color scheme).

2.5.2. Cluster Analysis of Relative Fixation Duration Distribution

Subsequently, to identify the differences in participants’ visual behavior in general, cluster analysis of the distribution of fixation duration among AOIs was conducted. Cluster analysis is an exploratory analysis that enables a partitioning of collected data into meaningful subgroups (called clusters) when the number of the subgroups and the specific characteristics distinguishing them might be unknown to the researcher. Therefore, the general aim of this method is to group the data so that the ones in the same subgroup would be more similar to each other than to data in other identified subgroups [66].
The relativized fixation duration was chosen as a variable upon which the identification of clusters was based to eliminate the influence of variance in participants’ task solving duration and, similarly, to enable inter-task comparison. The share of relative fixation duration in several AOIs (map title, north arrow, and topographic legend) was low across all participants and tasks and would therefore not contribute to the identification of different behavior. As a consequence, they were excluded from the cluster analysis.
As the categorization of visual behavior was data-driven, hierarchical cluster analysis was selected. This method enables any hidden structure in the data to be understood and, subsequently, based on the dendrogram created, a suitable number of clusters into which the data should be divided to be chosen. This will therefore provide results that can be easily interpreted and, eventually, generalized. Consequently, square Euclidean distance was chosen as a distance measure as the data clustered were ratio scale. Finally, a between-groups linkage was set as the cluster method. This agglomerative method starts with combining two cases (i.e., two participants) with the smallest distance (i.e., highest similarity) into one cluster. Then it continues either with iteratively adding a case to an existing cluster that is the most similar to the cluster average similarity value or with the creation of a new cluster from two unclustered cases with the highest similarity. This single linkage method is helpful in identifying the outliers which was one of the aims of the study.
Based on the arrangements of the clusters (i.e., dendrograms) produced by the primary cluster analysis, five clusters were set as a required solution during the final cluster analysis. This setting represented a balance between using too many clusters that would hinder the identification of the main differences among participants’ strategies and too few clusters that would link together participants with substantially different approaches. Given the number of participants (34 persons), a group with four and more participants was considered as a cluster.

2.5.3. Data-Driven Analysis of Task Solving Similarity

To identify participants’ spatio-temporal strategies, quantitative, data-driven, analysis was first conducted. String edit distance, one of the most frequently used methods of scanpath comparison in related studies [13,37,67,68,69], was chosen. Recorded scanpaths of individual participants for each task were therefore replaced with strings of AOI labels (see Figure 1) in the order in which a participant fixated on them.
Since the deviation in single task solving duration among participants was quite substantial, collapsed strings were selected for the identification of similarity in strategies. In the collapsed strings any consecutive hits in the same AOI (e.g., ‘TTTTTT’) are represented by only one character (e.g., ‘T’). Therefore, the collapsed strings are less influenced by the different attention durations. Calculation of string similarity was carried out using the Scangraph [63]. The Needleman–Wunsch algorithm [70] was chosen. The algorithm is based on the identification of the number of concordant characters between two strings. Compared to the commonly used Levenshtein algorithm [71], the Needleman–Wunsch algorithm is more likely to not identify two strings in which the order of two AOI visits is frequently switched (e.g., TMALT and TAMTL) as similar, based on its definition (for relevant experimental testing see [72]).
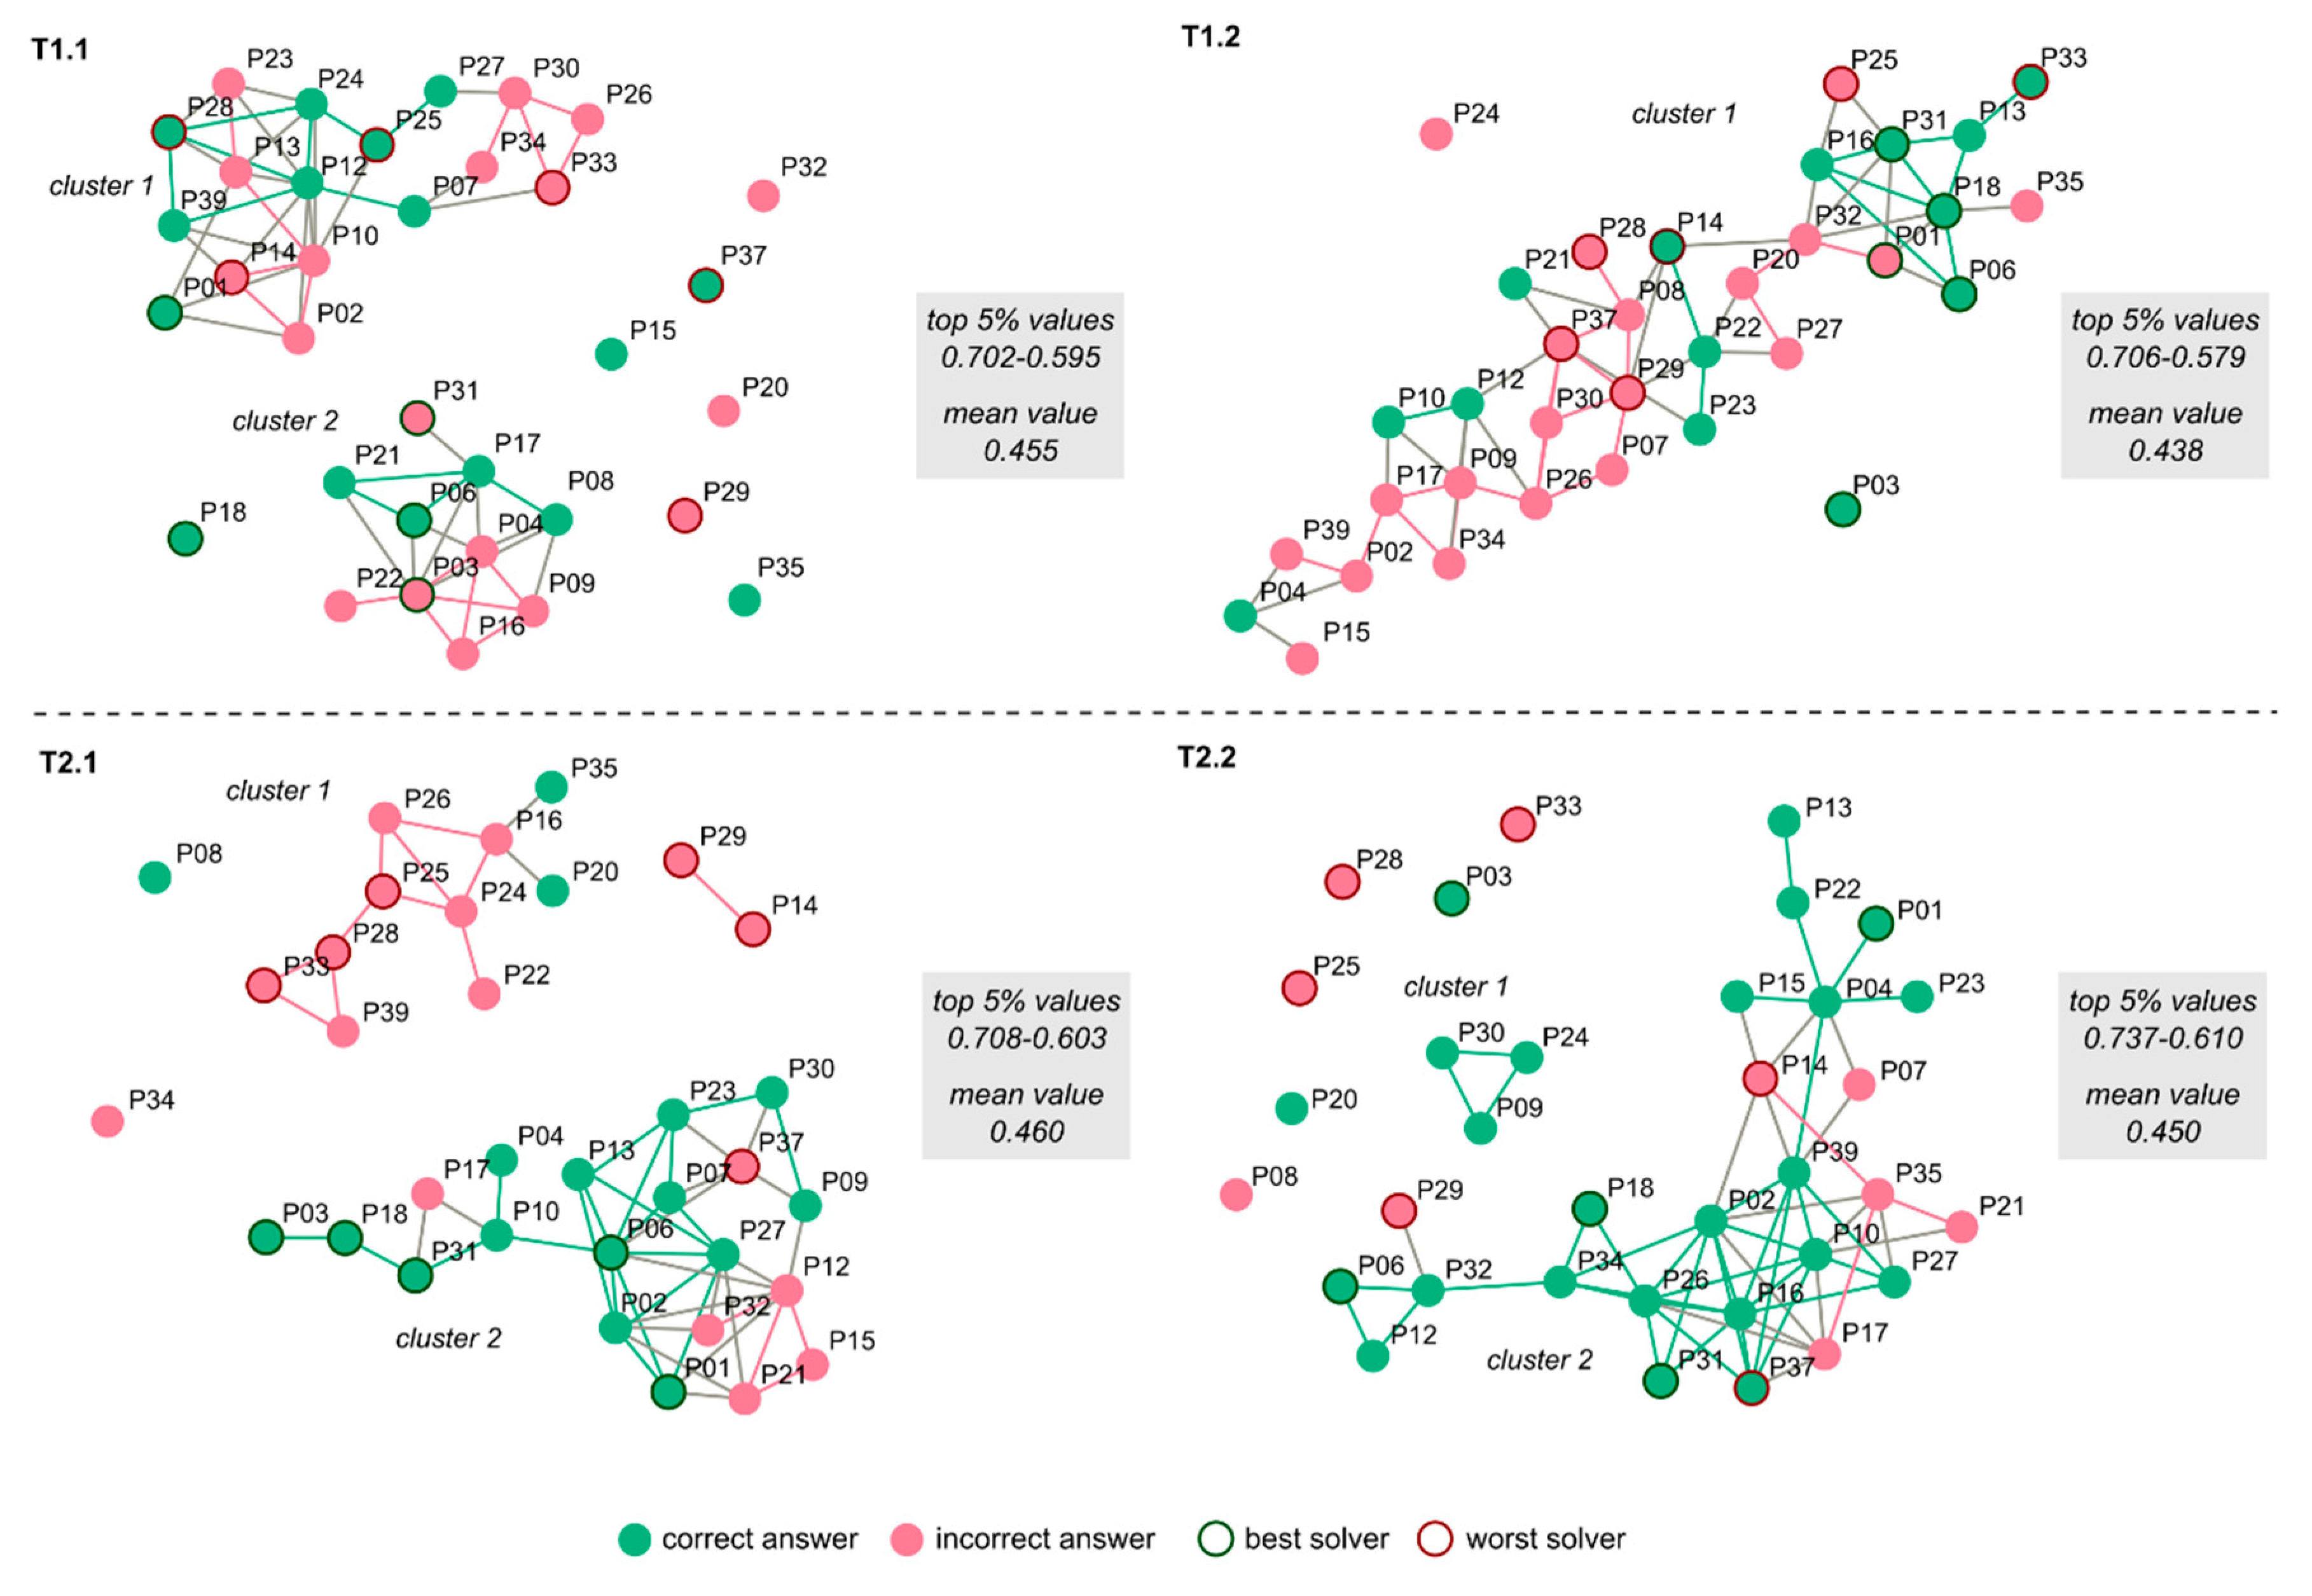
Based on the Scangraph outcomes, graphs visualizing the top 5% of similarity values (i.e., the highest values) were created. The 5% of similarity values represent 10% of all potential edges between nodes, i.e., links between participants. Therefore, the density of the graph was set twice as high as is recommended by [63]. This aspect of data analysis was particularly important since one of the aims was to identify outliers that solved given tasks differently to the rest of the participants (see Section 3.3.1. in Results).

2.5.4. Theory-Driven Analysis of Similarity in Task Solving

In addition to the data-driven analysis, a theory-driven analysis was realized. Based on a cognitive walk-through with experts and theories related to problem-solving [30,73,74], four possible ways of how to generally approach a problem for the task type used in this study were identified:
  • getting familiar with the problem » solving the problem » comparing the solution found with given possible solutions (Task » Map » Answer, i.e., TMA; the approach expressed using the abbreviations for the key AOIs representing individual task-solving phases);
  • getting familiar with the problem » checking given possible solutions to the problem » solving the problem (finding which of the possible solutions is the correct one) (TAM);
  • getting familiar with the problem » starting to solve the problem » checking given possible solutions to the problem » continuing to solve the problem (TMAM);
  • getting familiar with the problem » solving the problem (TM).
As the stage of ‘solving the problem’ usually requires using and combining information from more than one element, the solving approaches described above can be further divided into sub-approaches based on the elements used and the order of usage:
  • map;
  • map » map layout element(s) (i.e., map title, thematic and topographic legend, map scale, north arrow);
  • map layout element(s) » map;
  • map layout element(s) » map » (an)other map layout element(s).
Based on these theoretical assumptions, a list of all strategies that would be potentially used was created (similarly in [13,57]). Subsequently, the strategies that participants actually used during task solving were assigned to these theoretically set strategies. This was done by means of a repeated detailed study of the eye-tracking recordings (GazeReplay) in OGAMA. The recordings of each participant’s task solving were divided into individual solving cycles (starting with getting familiar with the problem) and each cycle was studied and coded separately. The analyses resulted in a table that included strategy codes for each participant and each task (see Section 3.3.2. in Results).

3. Results

3.1. Comparing Intermediates and Experts

Prior to the identification and comparison of participants’ strategies, the correctness of answers was analyzed. The overall success rate was 79.9%. More specifically, the best solvers were able to solve the test without any mistakes (see Table A1). On the other end of the scale, two participants gave only seven correct answers (out of 12). As shown in Table A1, the majority of incorrect answers was given in the first half of the testing tasks.
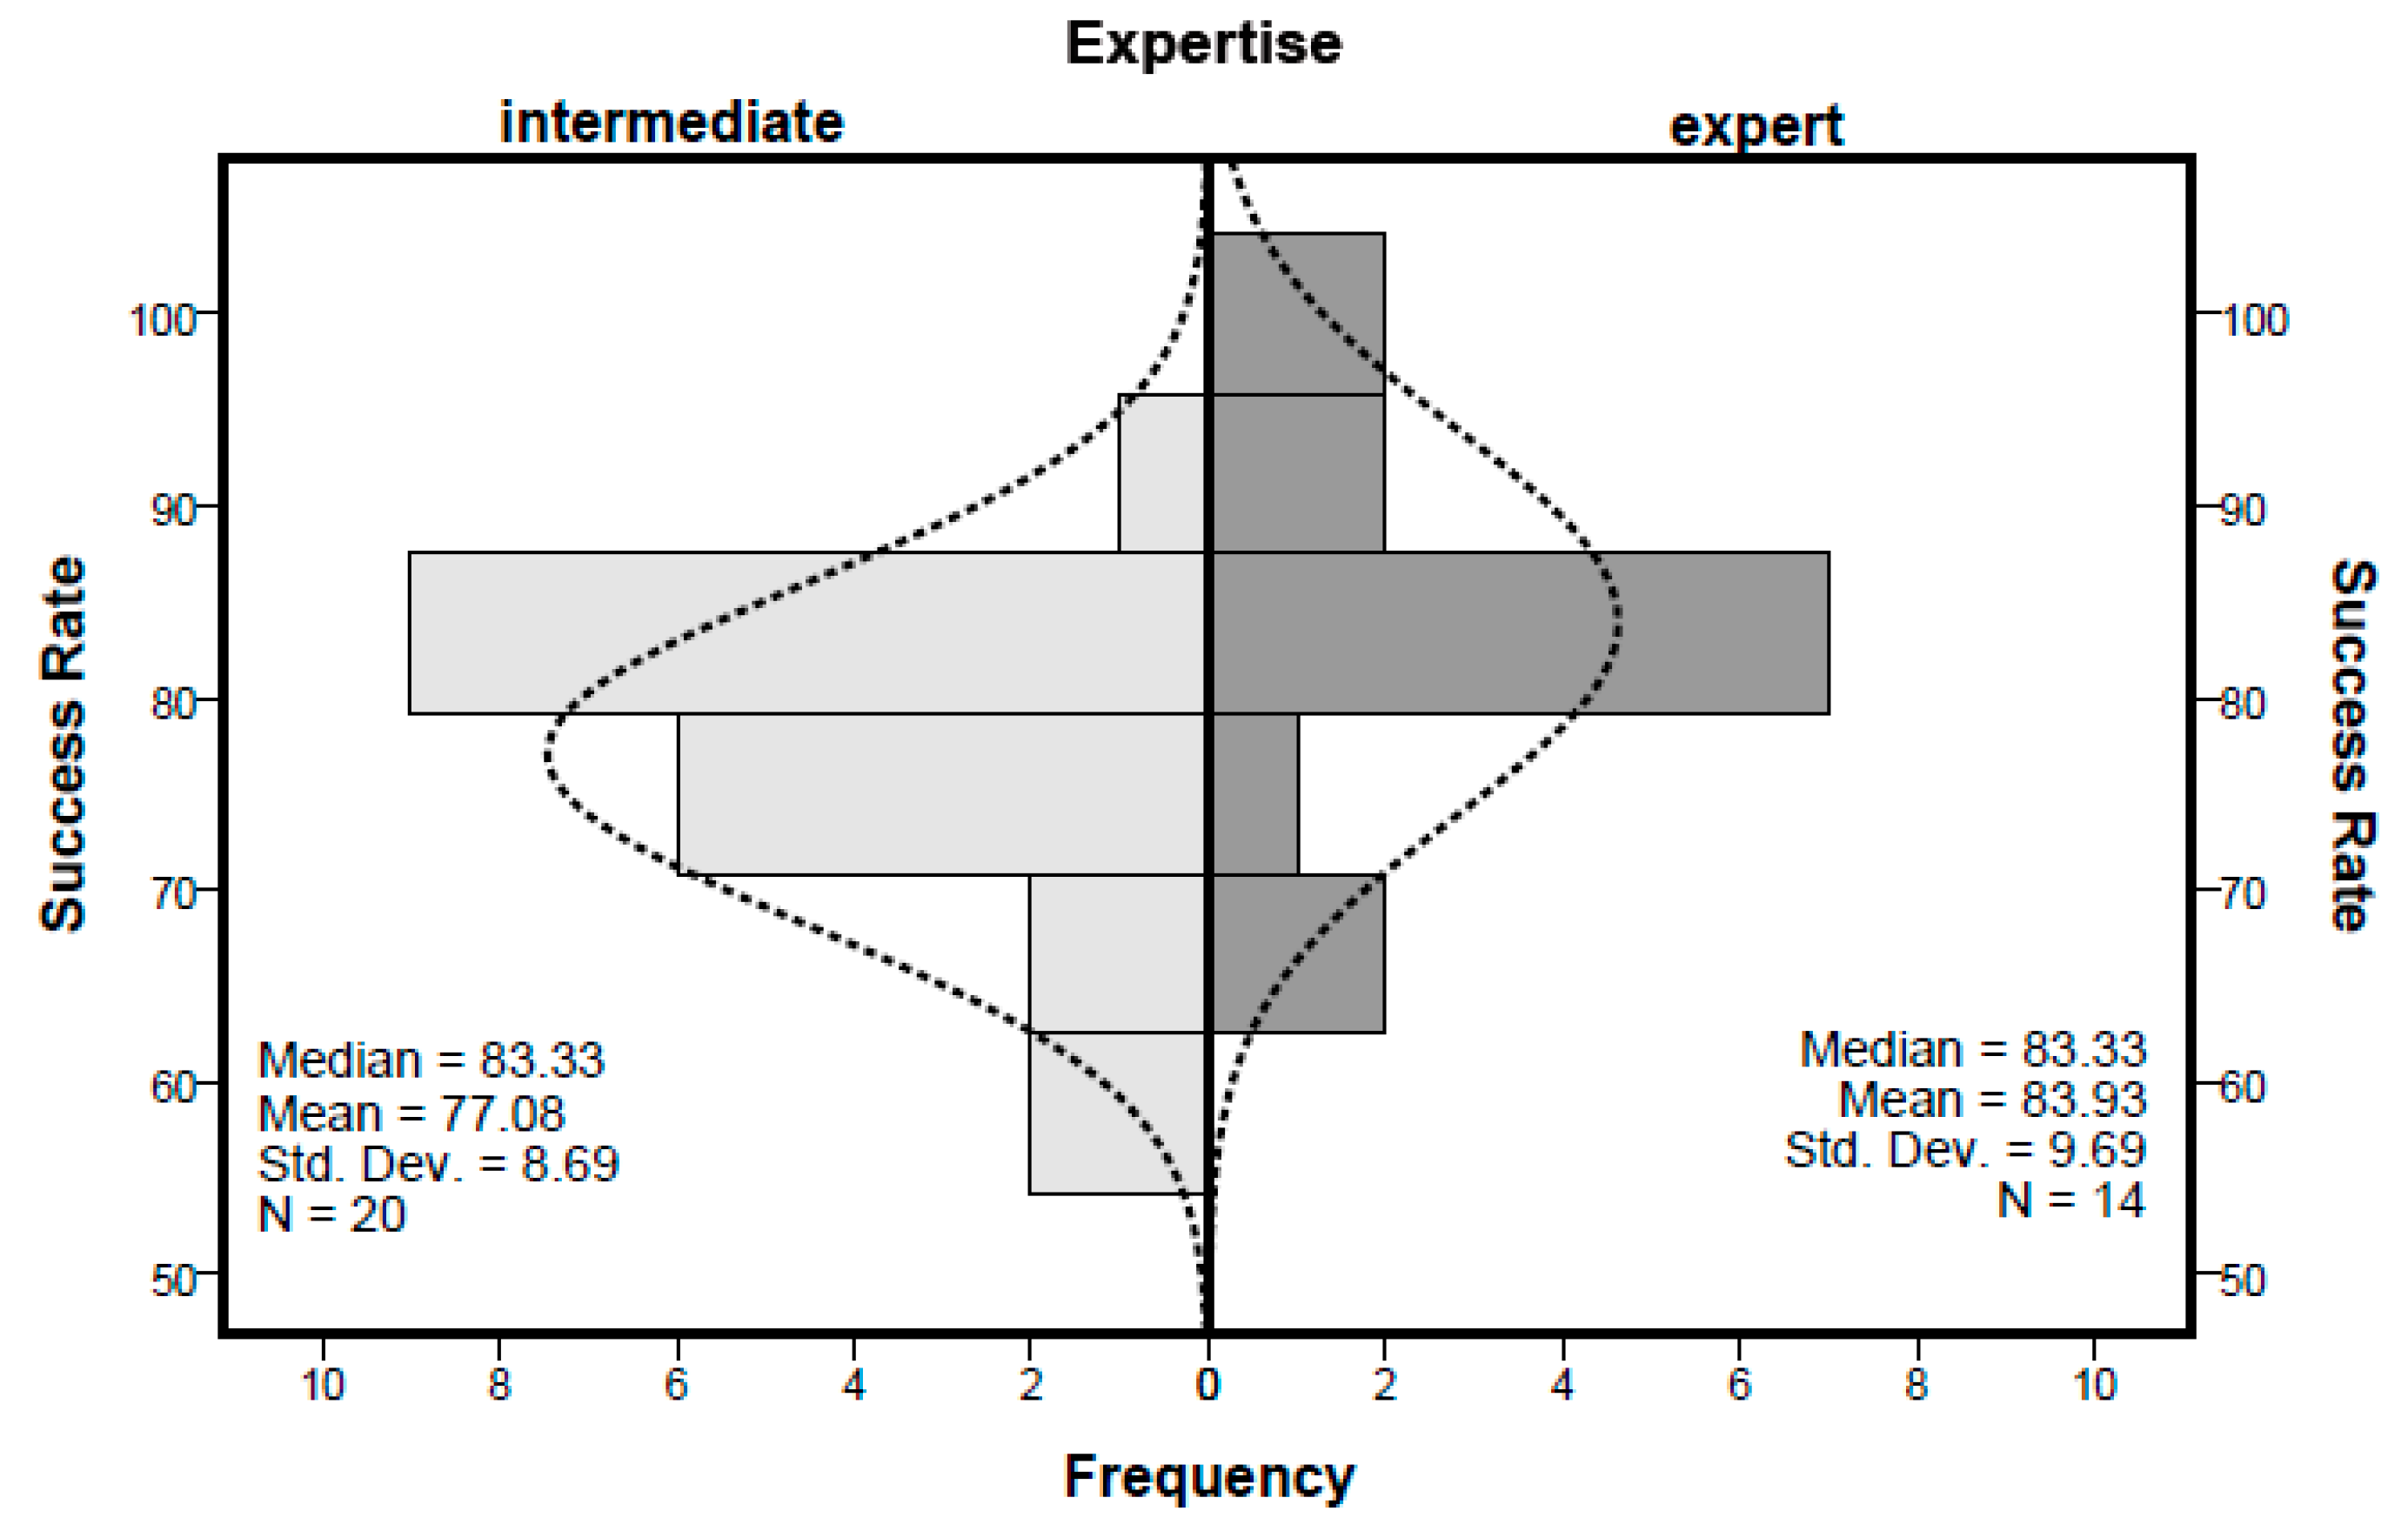
Subsequently, the differences between intermediates (undergraduate students in geography) and experts (cartographers) were verified. On average, intermediates had a lower success rate than experts (see Figure 3). Notwithstanding, the difference in the overall accuracy was not proven to be statistically significant (Mann–Whitney U (34) = 87, p = 0.061).
Additionally, the participants’ ‘top-down’ expertise did not have a statistically significant influence on other parameters of task solving and commonly analyzed eye-tracking metrics. Specifically, the intermediates (Mi = 10.4 min) did not differ significantly from the experts (Me = 9.0 min) in time needed for solving the test (U (34) = 164, p = 0.416). Similarly, participants’ expertise did not significantly influence the average fixation count per task (Mi = 193.5 vs. Me = 176.9; U (34) = 148, p = 0.796). In terms of other eye-tracking metrics, the intermediates did not differ significantly from the experts in average fixation duration (Mi = 190.3 msec vs. Me = 190.6 msec; U (34) = 132, p = 0.796), average saccade length (Mi = 213.5 px vs. Me = 227.0 px; U (34) = 90, p = 0.083), and average saccade velocity (Mi = 5.8 px/s vs. Me = 6.5 px/s; U (34) = 91, p = 0.090).
Based on these results, we assume that the influence of the ‘top-down’ expertise in solving tasks requiring thematic map analysis is not substantial in either effectiveness or eye-tracking metrics. Therefore, the research sample can be considered as sufficiently homogenous for further analyses of participants’ strategies focusing on identifying the influence of expertise in solving given test. For this purpose, four tasks with a substantially higher share of incorrect answers (i.e., the success rates lower than 75%) were selected (Table A1; see Table 1 for the formulation of the selected tasks). Given the similar (and sufficient) number of participants solving the task correctly and incorrectly, analysis of these tasks enabled similarities among participants solving the tasks correctly/incorrectly to be identified and characterized.

3.2. Visual Attention Distribution

To comprehend the distribution of participants’ attention among key elements during task solving, the participants’ strategies were first explored from the spatial perspective only.

3.2.1. Attention Spread on the Map

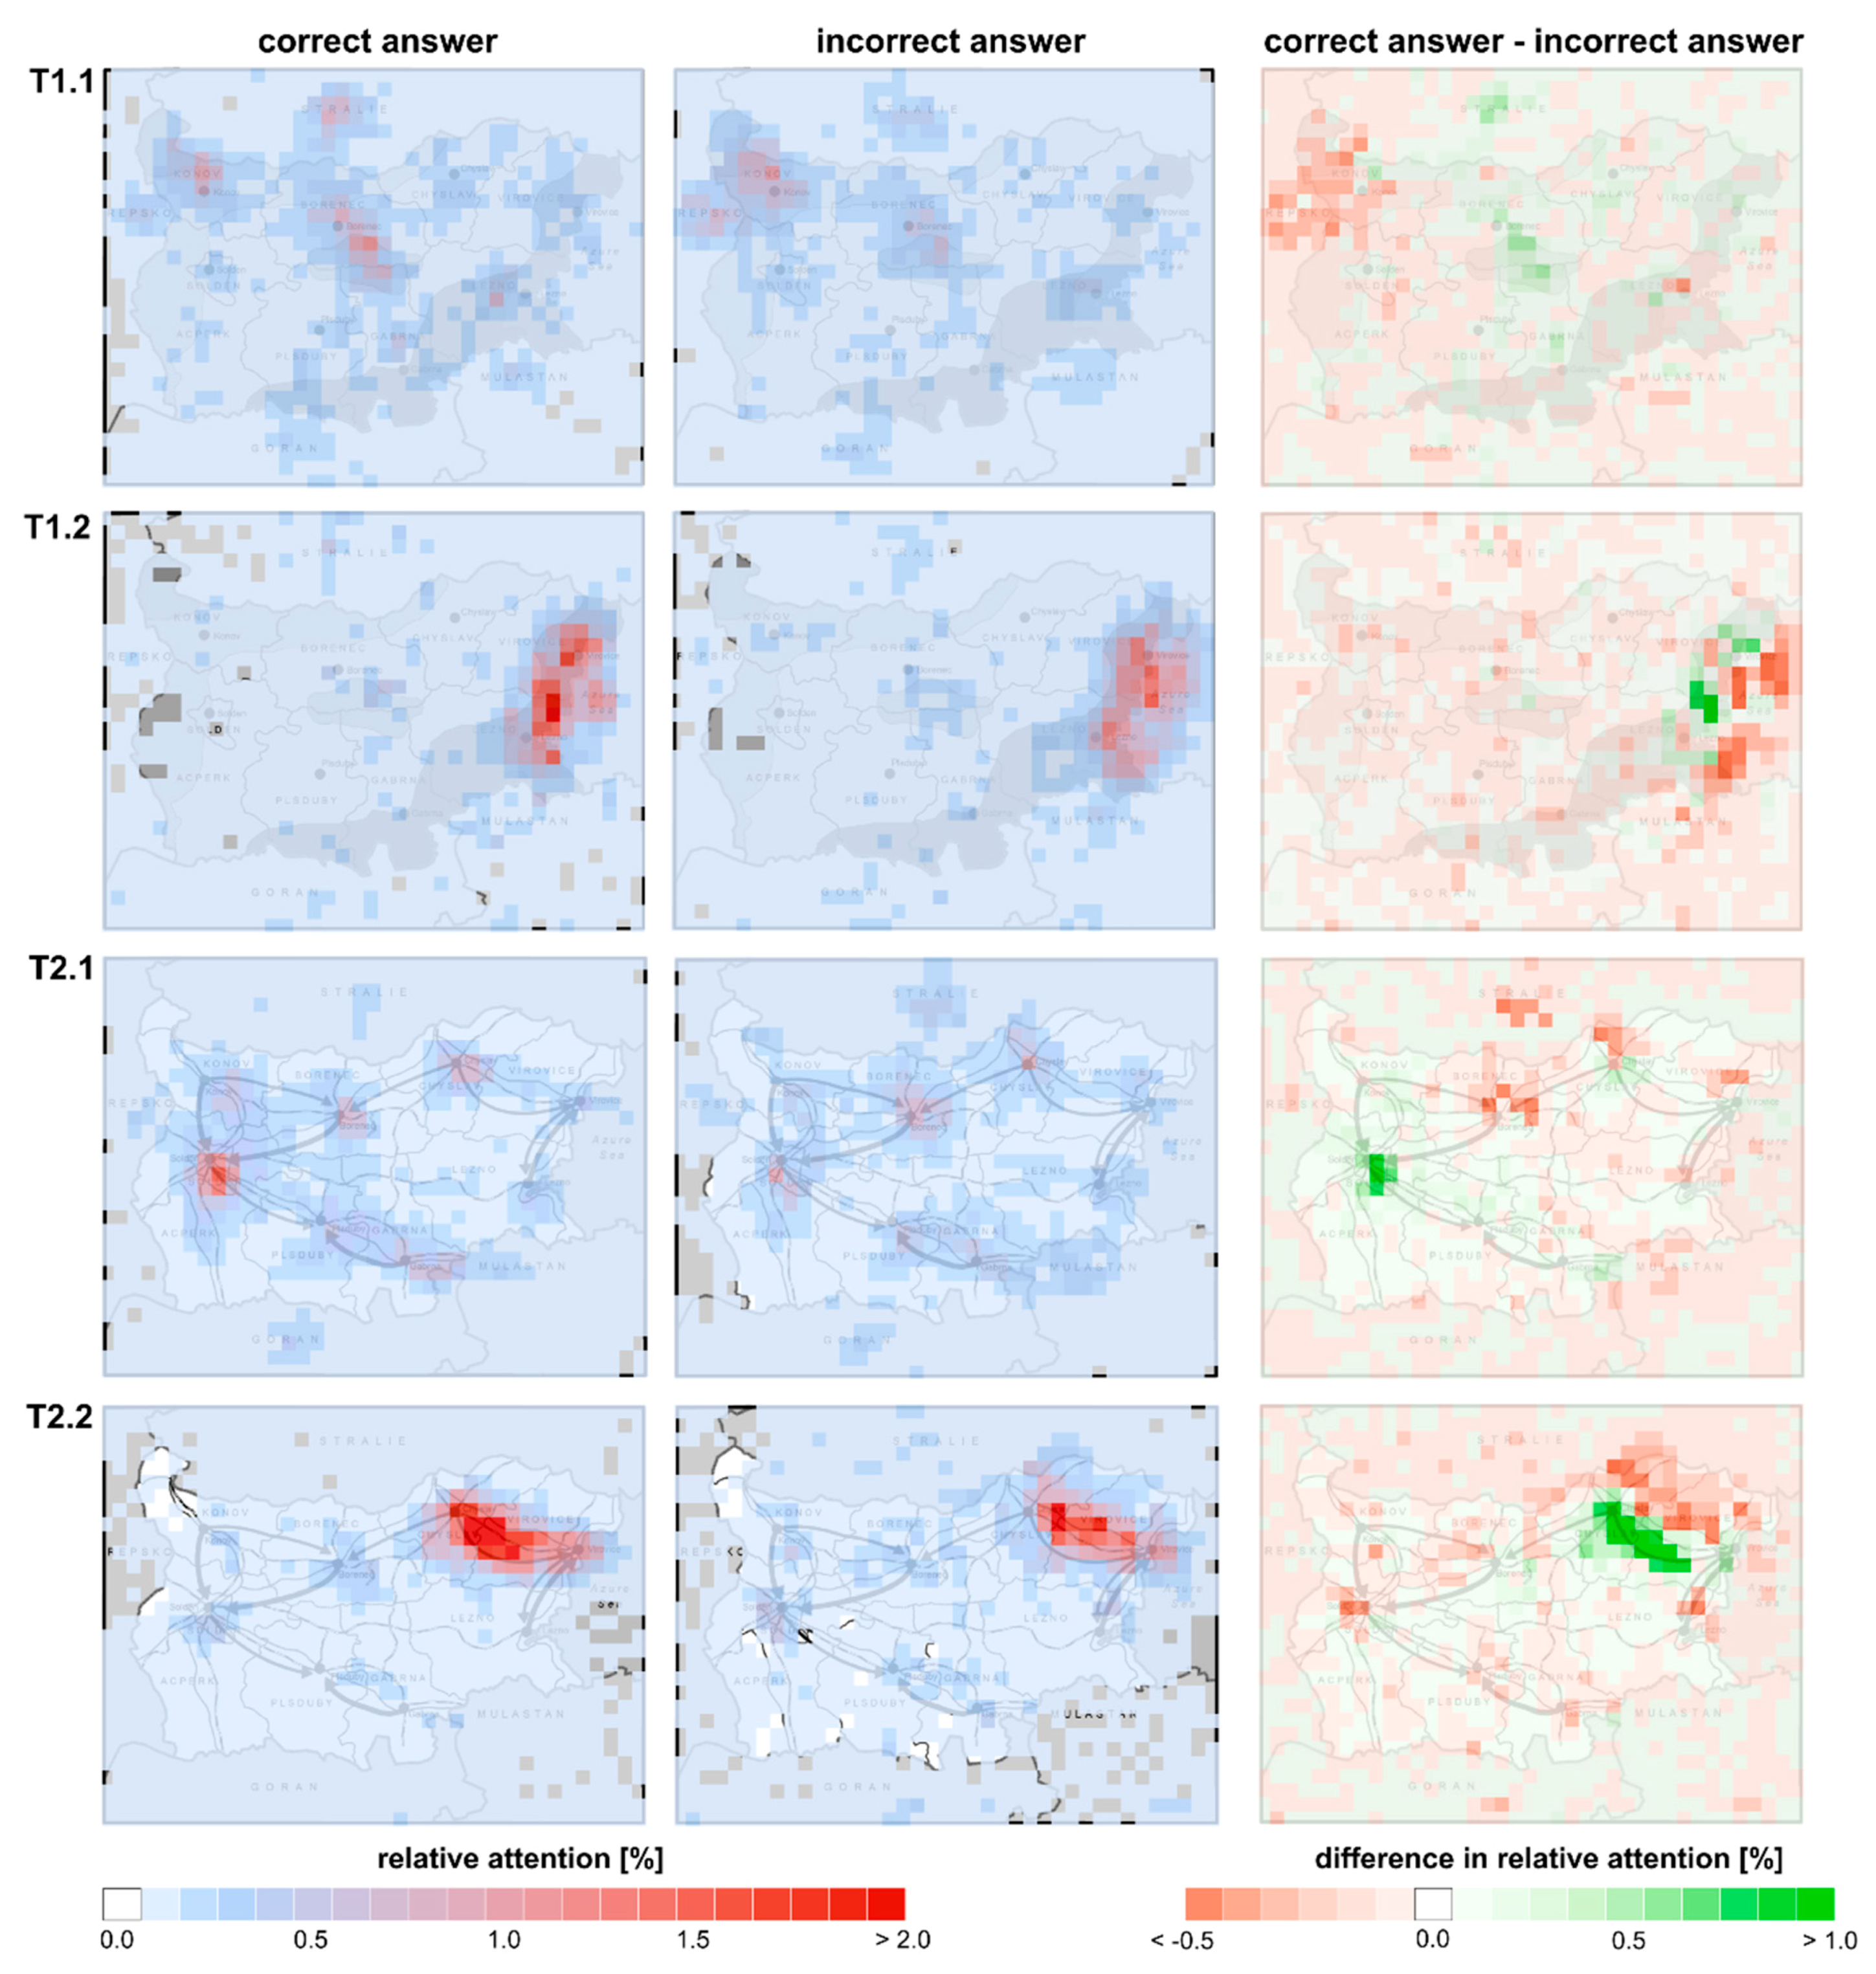
First, to get an overview of visual behavior during map analysis and to see its patterns and their differences between successful and unsuccessful participants, relative attention maps were compared (see Figure 4).
Generally, differences were identified for the tasks focusing on extracting the spatial distribution of phenomena: T1.1 and T2.1, given that each of the three stated possible solutions indicated a different area on the map. It is possible to see that participants solving the task incorrectly devoted more of their attention to both regions and labels that were irrelevant for finding the correct solution compared to successful participants (see hot spots of negative values, i.e., red spots, in difference attention maps in Figure 4). Similarly, the opposite pattern is visible, i.e., the successful participants focused more on relevant parts of the map than the unsuccessful participants (hot spots of positive values, i.e., green spots, in difference attention maps in Figure 4).
Furthermore, the attention maps visualizing the relative gaze duration of participants who gave incorrect answers are more scattered. Therefore, they devoted equivalent attention to more areas on the map, contrary to the successful participants, who were able to concentrate more only on the areas relevant to solving the task correctly. This pattern is also visible for the tasks requiring the use of a scale bar for distance estimation, i.e., T1.2 and T2.2 (Figure 4).

3.2.2. Attention Distribution among Layout Elements

To identify the reasons behind the differences in attention spread on the map, it is necessary to analyze the overall distribution of attention among individual task elements that was conducted in the next step of data analysis.
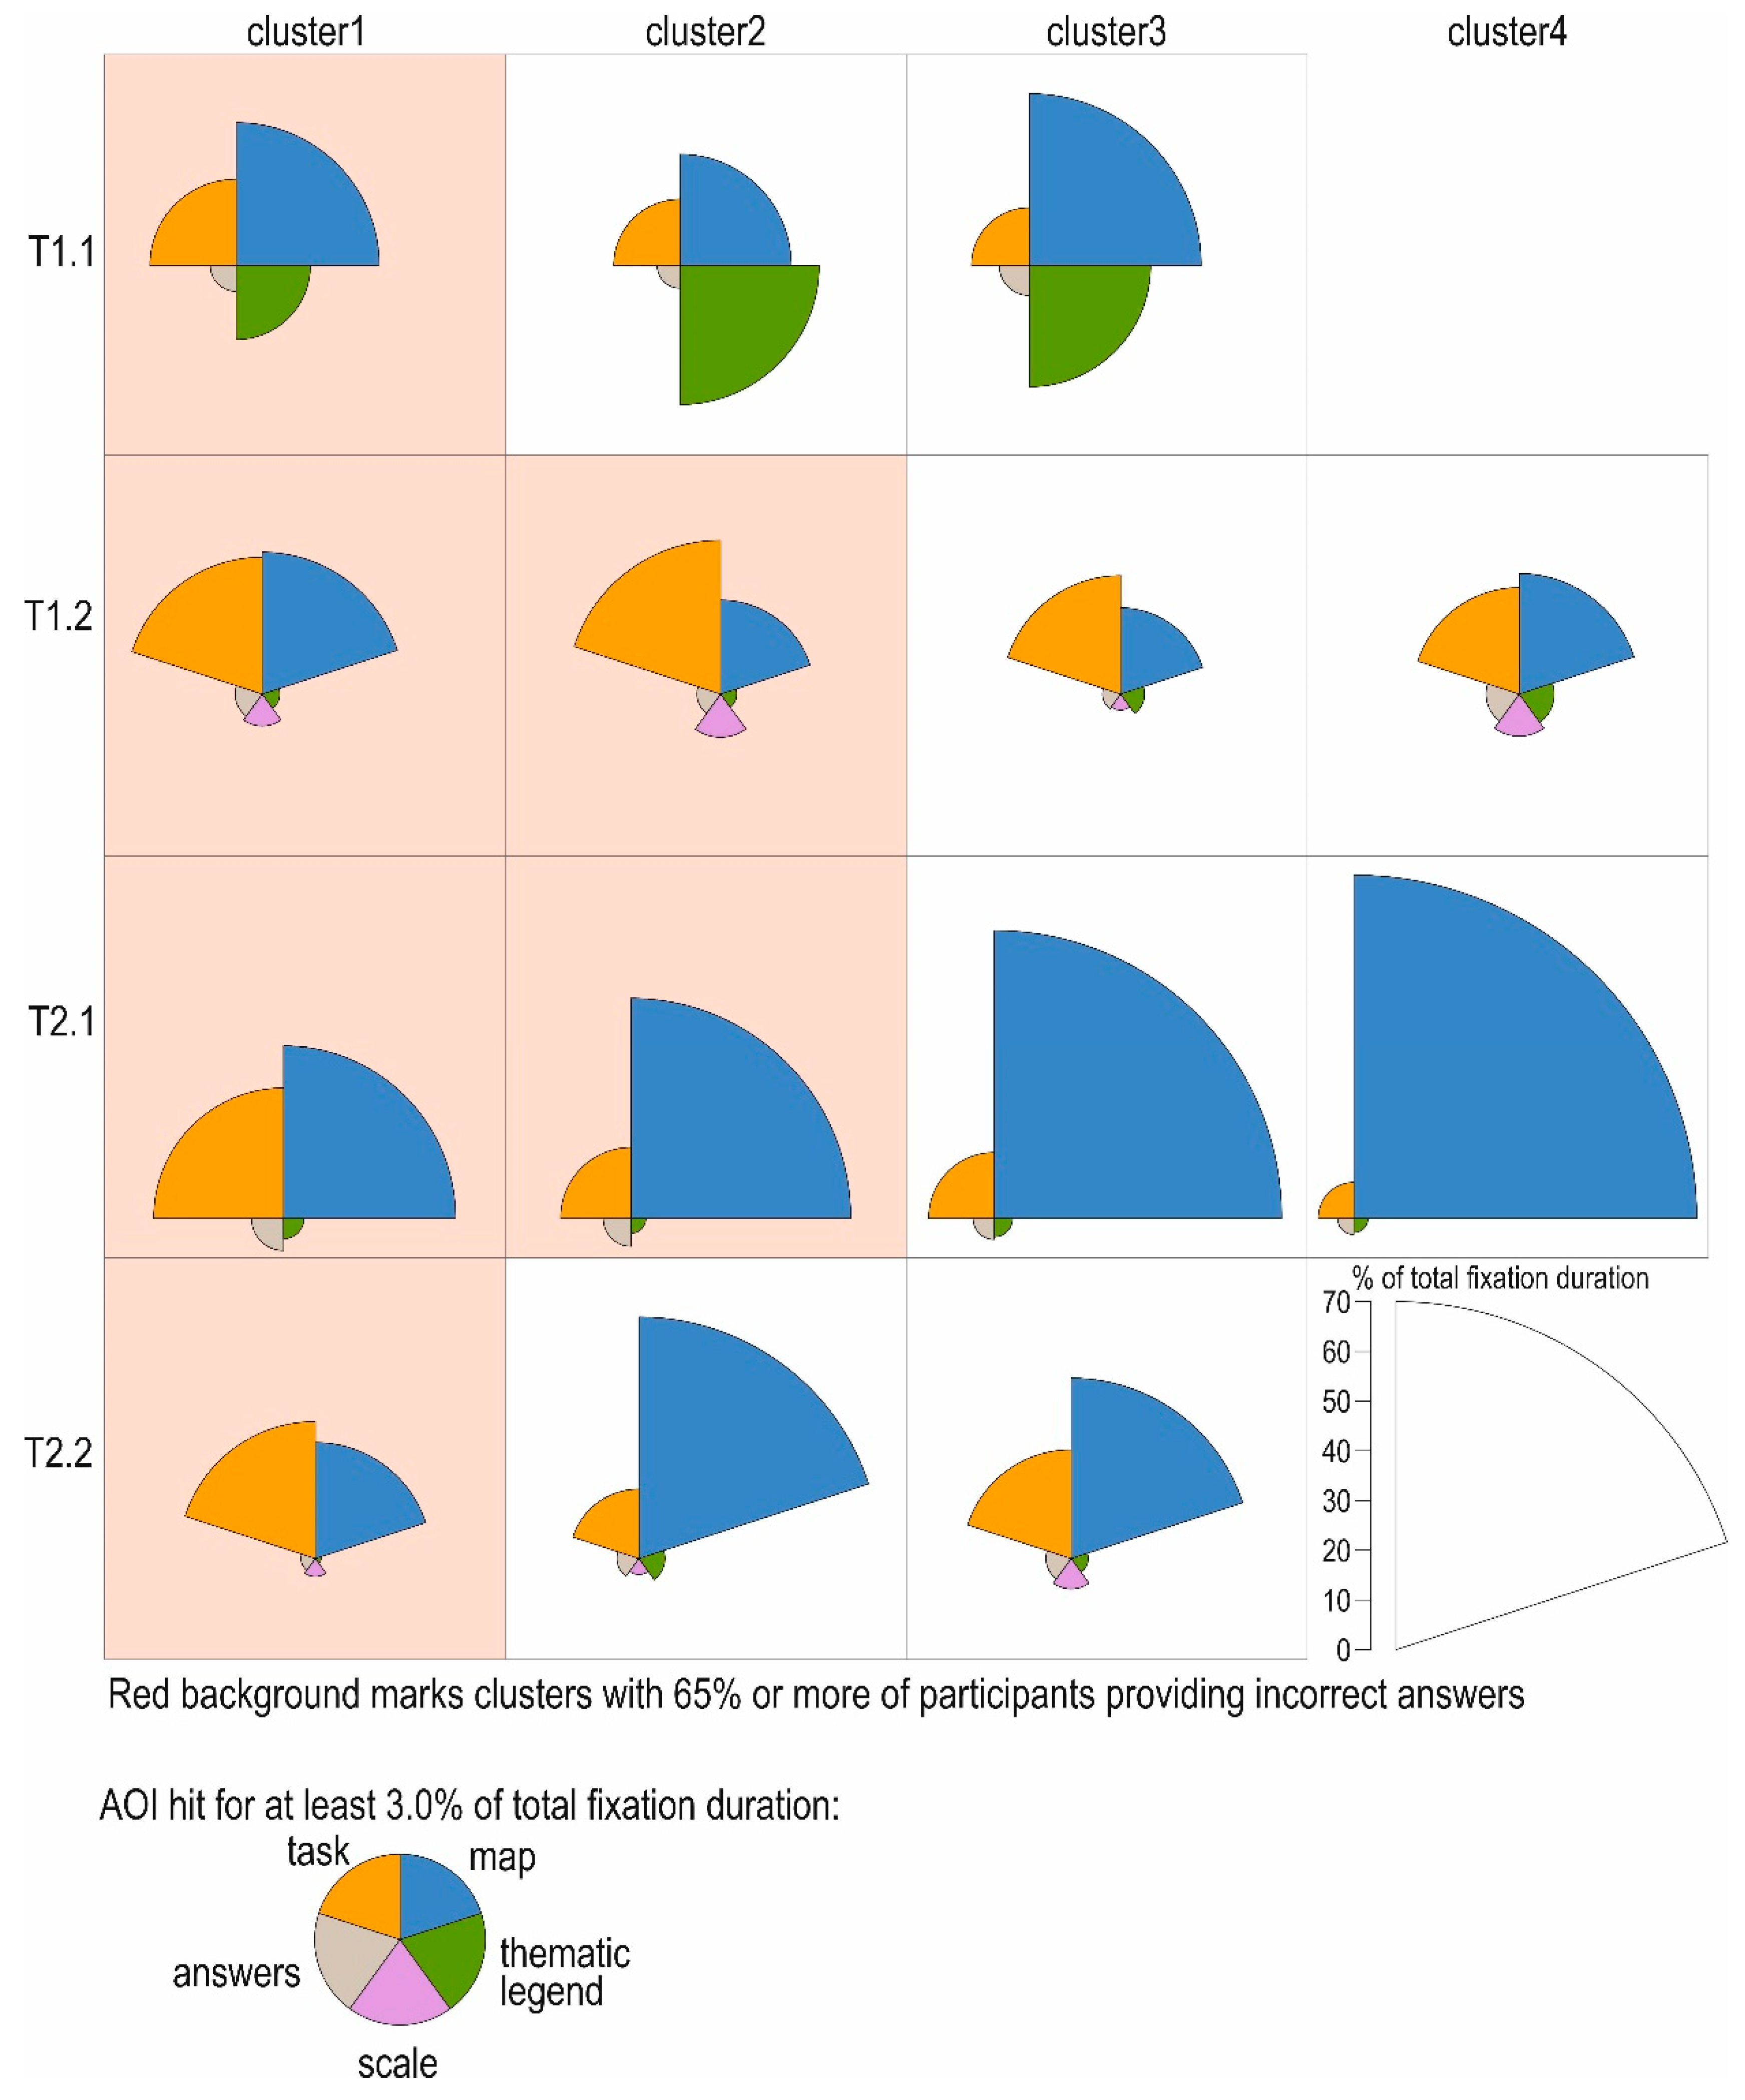
In general, the AOI crucial for solving the tasks was not only the map itself but also the task formulation (Figure 5). The majority of participants read the task a few times in a row and many of them repeatedly returned their attention to it during the whole task-solving process. On the contrary, the importance of basic thematic map layout elements—i.e., thematic legend and map scale—differed substantially among tasks. The difference partially resulted from their specific focus (see Table 1 for task formulation). On the contrary, participants generally paid almost no attention to the possible answers presented (see Figure 5), as some of the participants stated it was more natural for them to solve the task and then just match it to the given answers, i.e., verify if their own solution is among the possible answers.
Nevertheless, the relative distribution of attention differed substantially among individual participants. Therefore, the hierarchical cluster analysis was conducted to group participants based on their attentive behavior (see Figure 5). Moreover, it was found that these differences can also be, at least partially, attributed to the correctness of participants’ answers.
As for the first task (T1.1), the participants’ attention was relatively evenly distributed among the three AOIs: task, map, and thematic legend. The clusters mainly differ in relative attention given to reading and comprehending the thematic legend (see Figure 5), i.e., discriminating and decoding colors. It was the lack of attention paid to the thematic legend that distinguished the majority of participants who solved the task incorrectly from successful participants.
On the contrary, the second task that focused on the analysis of the area-shading map (T1.2) did not require the thematic legend to be used; instead, the participants had to use the map scale. However, attention was primarily distributed between the task and the map only. Moreover, no substantial differences among the identified clusters were found. This resulted from identifying only one main cluster and several outliers in the first phase of the hierarchical cluster analysis. For that reason, this cluster, consisting of almost all participants, was subsequently further divided into four clusters based on the dendrogram (see Figure 5). Therefore, even though the clusters specific for participants solving T1.2 task incorrectly were identified, it is not possible to clearly describe the difference between them and the participants who solved the task correctly. This indistinguishability resulted from the specific cause of incorrect task solving. It is likely that the majority of participants who gave the wrong answer did not correctly comprehend the term used in the task question, as several participants directly stated in the follow-up questionnaire (P7, P15, P17, P20, P24, P27, P37). Moreover, they did not sufficiently reflect on their task solution as none of the possible answers stated could be correct from the point of view of their task comprehension.
Similarly, the unsuccessful solution of the T2.1 task was also partially caused by not verifying if the task solution found was certainly the correct one. Given that the significantly shorter answer time is specific to the clusters (cluster 1 and cluster 2) with the majority of participants solving the task incorrectly (Mcluster1 = 40.8 s, Mcluster2 = 81.5 s vs. Mcluster3 = 99.4 s, Mcluster4 = 158.3 s). The influence of the answer correctness on the answer time was proven to be generally significant (regardless of the identified clusters) using the Mann–Whitney U Test (U (34) = 240, p = 0.001). Some participants were aware that their task solving was fast at the expense of accuracy (P15, P16, P22, P24, and P28) since they stated in the questionnaire that they did not devote sufficient time to reading the thematic legend and to checking if their solution was correct.
Identically, the difference among the clusters identified for the T2.2 task could be attributed to hasty task solving, as the average task duration differs (Mcluster1 = 26.8 s vs. Mcluster2 = 57.7 s, Mcluster3 = 36.2 s). However, a more essential and specific characteristic that distinguishes the participants providing incorrect answers from participants solving the task correctly is the lack of attention paid to the thematic legend (similar to the case of the T1.1 task; see Figure 5). The majority of unsuccessful participants did not look at the thematic legend while solving this task.
Finally, yet importantly, it is necessary to describe the participants identified as outliers, based on their visual behavior. The outliers’ behavior differed across the tasks and, therefore, does not allow for general characterization. Moreover, only one participant (P34) was identified as an outlier for more than one of the analyzed tasks (T1.2, T2.1). Furthermore, it is not possible to generalize outliers either from the perspective of correctness of their answers (seven participants solving a task incorrectly vs. seven participants solving it correctly) or ‘top-down’ expertise (eight intermediates vs. six experts).

3.3. Spatio-Temporal Pattern Discovery

To understand the differences in map analysis between the successful and unsuccessful task solvers it is equally important to explore their strategies from a spatio-temporal point of view.

3.3.1. Sequence Similarity Analysis

First, the similarity of strings of AOIs visited (e.g., TMTMTMTMSDSMADMSDA and TIMTMTMTMSMA) was calculated. Despite using the collapsed strings, their average length was about 50 characters for the four selected tasks (MT1.1 = 72, MT1.2 = 46, MT2.1 = 47, MT2.2 = 46). The mean value of the calculated string similarity was also almost identical across the task (Figure 6). Hence, the participants’ strategies were not generally getting more and more similar during the testing as could be expected. Therefore, the participants’ task-solving process was concordant on 45% on average. However, the similarity values between pairs of participants differ substantially as both the values higher than 0.70 (70%) and lower than 0.15 (15%) were identified.
For that reason, graphs visualizing the top 5% of similarity values were created (see Figure 6). These graphs enable groups of participants using a particularly similar approach to map analyzing to be identified, as well as participants whose strategies differed substantially from the rest. In general, the majority of the participants were connected in a way that only one or two large cluster(s) was/were identified for each of the four tasks based on the top 5% similarity value (Figure 6). Nevertheless, not all of the participants used highly similar strategies to the rest of the participants classified in the same cluster (e.g., for the task T1.1 the participant P31 is in the same cluster as, for example, participants P04, P16, P17, and P21; however, their strategy was identified as being highly similar only with the strategy of the participant P17; see Figure 6). Therefore, the sub-clusters, with at least four participants, where all the participants are interconnected were subsequently identified. Due to the interconnectedness and their size, this/these sub-cluster(s) can be considered the core(s) of the identified large cluster(s).
As for the first task (T1.1), where the difference in the number of string characters is the highest (Mcluster1 = 51, Mcluster2 = 100), the identified clusters can also be distinguished based on the number of stages in which a participant worked mainly with two or three AOIs. For cluster 1, the beginning of task solving cannot be generalized, as some participants mainly paid attention to the task and the thematic legend, and some, on the other hand, focused mainly on the task and the map. Nevertheless, their strategies were gradually getting more similar after they became familiar with the task, as they were trying to get familiar and to remember the chosen colors. Therefore, they frequently moved from the map to the legend and vice versa. The stage when they compared their find solution with the given possible solutions followed. At the end of the task-solving, the individual participants differed only in the frequency in which they went back to the map and the thematic legend.
As for the second cluster identified in the task T1.1, the two middle stages of task solving are similar. However, the participants in cluster 2 repeated these stages (e.g., ML and MDA) three times or even four times consecutively. Moreover, the participants paid more attention to the task elements that were not necessary for solving the task correctly (mainly to topographic legend and map title). Nevertheless, it cannot be unequivocally said that this less efficient strategy is typical for participants who were not able to solve the task correctly.
Similarly, it is not possible to state that the task-solving strategy has a substantial impact on task-solving accuracy for the task T1.2, as only one cluster was identified (see Figure 6). Notwithstanding, this cluster 1 is relatively diverse, based on the length of the strings of hit AOIs. While both identified sub-clusters (P01, P18, P31, P32; and P16, P18, P31, P32) are characterized by short strings (M = 27), the participants localized on the other side of the cluster (e.g., P04, P17) more frequently went back to individual task elements. For that reason, the average length of their strings is approximately 74 characters. In addition, the share of incorrect answers is higher among these participants.
Nevertheless, the difference between the sub-clusters and the participants on the other end of cluster 1 is not only in the string length, as it is possible to distinguish only two main stages of task solving for the identified sub-clusters. First, the participants devoted their attention to the task and the map. For the rest of the task solving, they transitioned among three main task elements—the map scale, map, and possible answers. On the contrary, the participants with longer sequences (and more frequent incorrect answers) flitted both between the task and map as well as between the task and thematic legend in the first stage, even though the work with the legend was not essential for finding the task solution. Furthermore, the participants had more transitions between the map scale and the map. As some unsuccessful participants (e.g., P02, P28, P39) justified in the post-test questionnaire, they found it challenging to correctly estimate the required distance solely based on its visual comparison with the scale bar.
While there were typically longer strings for the unsuccessful participants in the previous task, in the task T2.1 the participants solving the task incorrectly hit fewer AOIs on average (Mi = 38 vs. Mc = 56). Above that, this difference was proven to be statistically significant (U(34) = 223, p = 0.006), which is in concordance with the found significant difference in answer time (see Section 3.2.2). The results again proved that the task-solving process of, at least some, unsuccessful participants was hasty in comparison with the majority of successful participants, for the reason that participants in cluster 1, where the share of incorrect answers was high, did not bring their attention back to the task formulation after working mainly with the map and possible answers. This was in contrast to the participants in cluster 2 who not only went back to the task but subsequently verified, working with the map and possible answers, that their solution was correct.
The strategies identified for the task T2.2 strongly resembles the strategies identified for the T1.2. Therefore, the participants adjusted their strategies to the specific task type and did not substantially change it during the testing. The only thing that changed was the number of participants who needed (cluster 1)/did not need (cluster 2) to frequently move their attention between the map and the scale bar. The majority of the participants were able to solve this task more efficiently, similar to T1.1; the higher number of transitions between the map and the scale bar was not characteristic for the unsuccessful participants.
In general, the highest number of sub-clusters (6), where all participants were connected based on the top 5% string similarity values, was identified for this task. Therefore, despite the almost unchanging mean similarity value across the tasks, it is possible to state that one commonly used strategy was more and more clearly formed as these sub-clusters are partially overlapping (see also the thresholds for the top 5% similarity values in Figure 6).
Hence, the questions arise if also the outliers were also defined more clearly and who are the outliers from the spatio-temporal point of view? Outliers, based on strategy similarities, can be defined in two ways: by the low maximal similarity value of their strategy with another strategy (i.e., by no connection with other participants when top x% value is visualized) and by the low mean similarity value of their strategy with the rest of the strategies. Outliers defined based on the maximal value are clearly distinguished in the graphs depicted in Figure 6.
Similar to the case of relative attention distribution, it is not feasible to generalize the characteristics of the outliers. Both successful and unsuccessful participants can have a unique strategy from the spatio-temporal point of view based on the results (see Figure 6). Additionally, some participants were identified as outliers both from the spatial and spatio-temporal point of view (specifically, P20 and P29 for the task T1.1; P34 for T2.1). Moreover, some participants were also identified as outliers for more than one task (P03, P08, P20, and P25; Figure 6).
In contrast, only three participants were identified as outliers based on their mean similarity value. Specifically, two of these participants, i.e., P03 (for T1.2 and T2.2) and P18 (for T1.1), not only solved these tasks correctly using their atypical strategy but they were among the best solvers in this study in general (see Table A1). On the contrary, the last outlier, i.e., P25 for the task T2.2, solved this task incorrectly and, in addition, he/she was generally among the worst solvers.
However, from the point of view of the sequence length, the sequence of P18 was more similar to the sequence of P25 than of P03. Both of them were among the shortest sequences in general, while the sequences of P03 were by far the longest. The strategy of participant P18 differed substantially as he/she started solving the task by getting familiar with the possible solutions. Similarly, the strategy of P25 is distinguishable as he/she did not use the map scale when solving the task requiring its use.

3.3.2. Theory-Driven Identification of Task-Solving Strategies

Despite taking into account the collapsed simplified strings, the quantitative analysis of strategies and their similarities has several limits for complex tasks such as map analysis. Despite being identified as similar, the strings of individual participants can differ considerably. Moreover, the influence of string length on the calculated value of similarity, and therefore on strategies not identified/identified as highly similar, is apparent. However, the general strategy of participants of short and long strings of AOIs hit can be in concordance and only the number of consequent transitions between two AOIs can differ.
Even more importantly, in the quantitative analysis of string similarity, all differences in AOI order are treated equally. However, from the perspective of problem-solving, the sequence map–legend is more similar to the sequence map–scale than to the sequence map–answer. This is because, in the first two cases, the sequences describe solely the phase of solving a problem while the third one describes two different phases, i.e., solving a problem and subsequently comparing the solution found with given possible solutions.
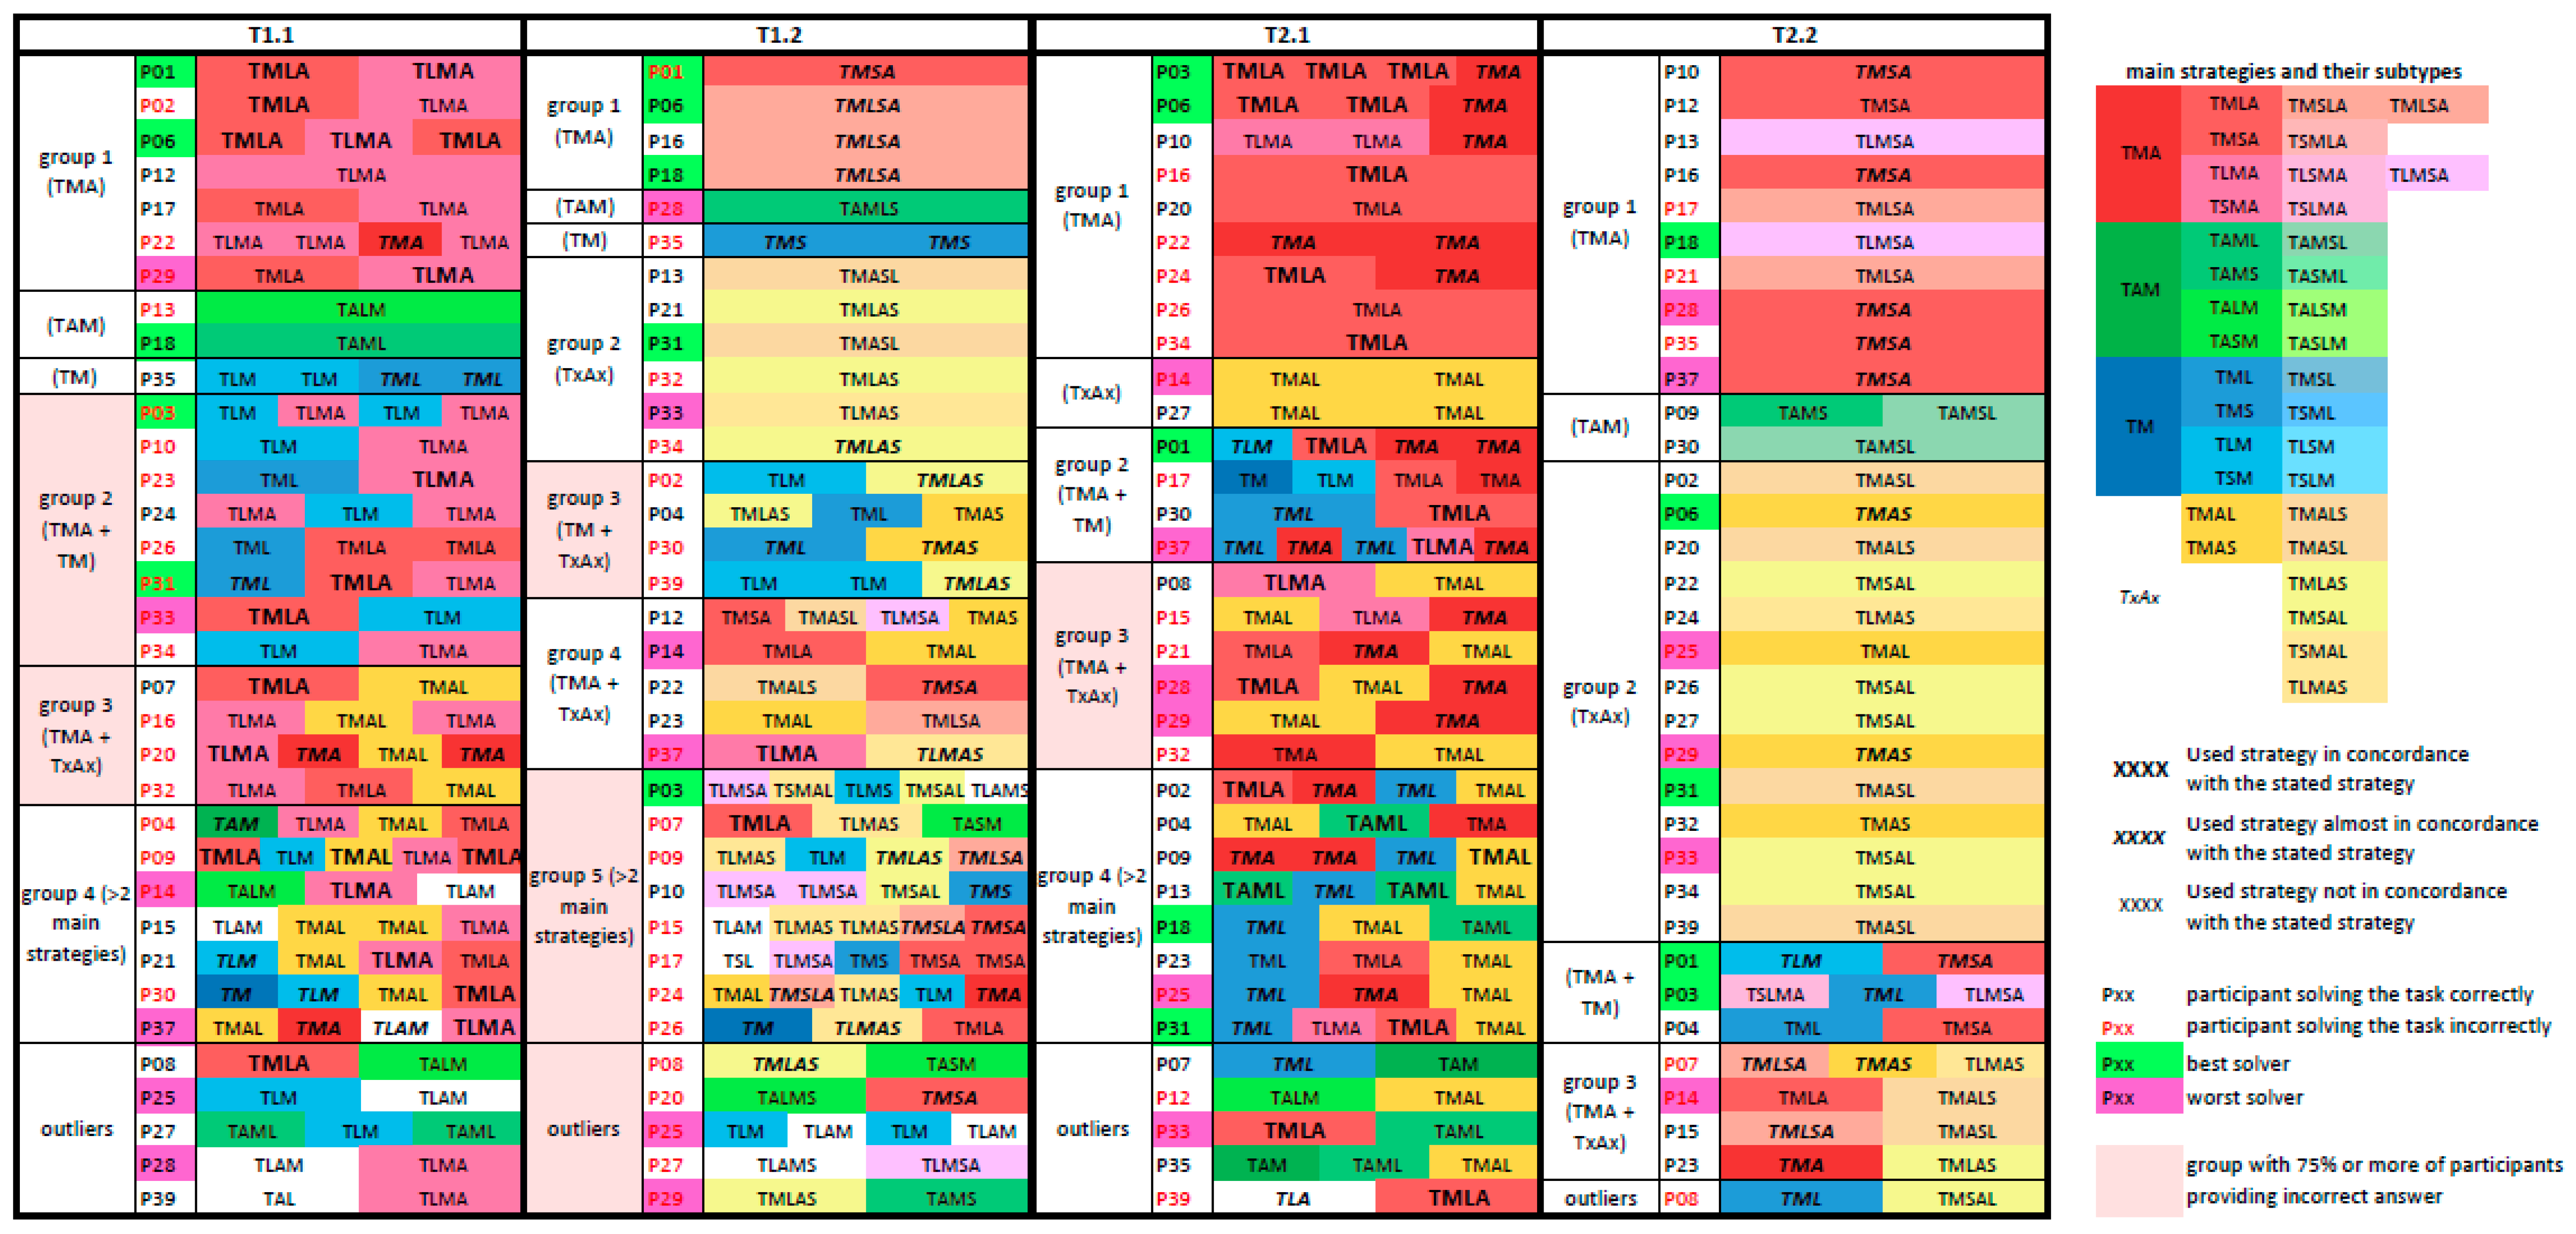
To eliminate these limits, the qualitative analysis of strategies and their similarities was consequently conducted. The sequence simplifications during the detailed study of participants eye-movements enabled the strategies used to be assigned to the ones theoretically set (see Section 2.5.4). It was possible to group the participants based on these strategies and their combinations (see Figure 7). This categorization enabled the strategies, even across all analyzed tasks, to be generally characterized and compared.
Due to testing a relatively complex skill, the task-solving process of many participants was composed of more than one solving cycle. Specifically, the participant went back to the task formulation, i.e., to the phase of getting familiar with a problem. For example, P26’s strategy used during the second task solving (T1.2) was coded as TMTLMASTMLA. This code can be decoded as TM (first solving cycle, directly corresponding to the third solving approach stated in Figure 7) | TLMAS (second solving cycle, corresponding to a sub-approach of the fourth solving approach stated, i.e., TxAx) | TMLA (third solving cycle, corresponding to a sub-approach of the first solving approach stated, i.e., TMA).
Generally, the most widely used solving approach by the participants was the first one (TMA) which covers getting familiar with a problem, followed by solving a problem and ends with comparing the solution found with given possible solutions (Figure 7). This approach was used frequently both alone and together with other approaches. Specifically, the approach was largely combined with the fourth stated approach (TxAx) that differs only in the last phase as, after paying attention to possible solutions, a participant continues solving a given problem. This approach was used particularly frequently during the task requiring the use of the map scale (T1.1, T2.1), i.e., an additional key task element (see Figure 7). Moreover, several participants used the third approach (TM) in combination with other approaches, where the phase involving working with possible solutions is omitted. This applies particularly for the first three tasks where they needed more solving cycles to solve the task. Therefore, the only task-solving approach that was hardly ever used was the second one (TAM) in which prior to solving a problem a participant checks given possible solutions to the problem.
Notwithstanding, the size of the groups representing individual problem-solving approaches and their combinations partially varies across the task—partially, given that any of the participants used the same strategy or combination of strategies in all four tasks analyzed (see Figure 7). Contrary to the data collected, many participants declared in the questionnaire that their strategy remained the same throughout the testing and was not influenced by the task or the map type. However, several participants used the same problem-solving approach in all these tasks and modified only its combination with other approaches. Both the best solvers (P01 and P03) and the worst solver (P37) were among them. Nevertheless, only the worst solvers (P28 and P29) were among the 11 participants who used different solving approaches in every analyzed task (Figure 7).
Partially for that reason, the problem-solving approaches identified resulting in many incorrect answers differ between tasks. Specifically, for the first two testing tasks—i.e., T1.1 and T1.2—it turned out to be ineffective to omit working with given possible solutions directly in the first solving cycle (see group 2 for T1.1 and group 3 for T1.2 in Figure 7). Moreover, for the tasks T1.1 and T2.1, another common ineffective strategy was identified (group 3 in both tasks, Figure 7). Specifically, the majority of participants who did not directly compare information depicted on the map with the thematic legend did not solve these tasks correctly. In contrast, the combination of these two solving approaches (TMA and TxAx) was relatively successful for solving T1.2 and T2.2, i.e., the tasks where the use of the scale bar was more fundamental than the thematic legend.
Furthermore, for the task T1.2 other ineffective strategies were identified (see group 5 and outliers in Figure 7), partially due to the fact that they generally differ from the strategies identified for the rest of the tasks. The participants in group 5 are especially characteristic, both in using more than two main solving approaches and in the high number of solving cycles necessary to solve the task (M = 4.3). At the same time, some participants from this group as well as outliers used atypical solving approaches (not colored in Figure 7).
For the last task analyzed, T2.2, none of the solving approaches used was identified as resulting mainly in incorrect answers (see Figure 7). The higher similarity of participants’ strategies is therefore consistent with the results of analysis based on string edit distance.
Similar to the results of the previous data analyses, the outliers cannot be generally described as successful or unsuccessful participants. Nevertheless, some common features of their strategies can be identified, partially thanks to participants who were identified as outliers for more than one task (e.g., P08, P25, P27, P35, and P39). Outliers often used atypical solving approaches or combined two approaches that almost no other participant chose to use together (see Figure 7). Specifically, they often used the second solving approach during their task solving (TAM).

4. Discussion

4.1. What Less Successful and More Successful Map Users Do Differently, and Do Strategies Applied by Less Successful Users Feature Some Similarities?

Based on the outcomes of the data analyses conducted, we wanted to answer if less successful and more successful map users behaved differently when solving map analysis tasks (RQ1) and if the strategies applied by less successful users showed any similarities (RQ2). We found that map users solving a task incorrectly differed in some aspects of their strategies from participants providing a correct answer and most of these differences were consistent across the majority of unsuccessful participants for a given task. Therefore, unlike what has been suggested in the previous study [16], we cannot conclude that all good map users are the same, but every low-skilled user is different.
One of the fundamental characteristics that distinguished the participants solving tasks incorrectly from the participants finding the correct solution was the lack of attention paid to relevant elements. Contrary to that, they devoted too much attention to irrelevant elements. Specifically, this inappropriate distribution of attention was caused by a lack of attention paid to the thematic legend in most of the tasks. However, it was sometimes also caused by not focusing on relevant parts of the map itself. In addition, even participants who did not work with the scale bar during tasks related to distance estimation can be identified. This outcome is consistent with the results of previous empirical studies (e.g., [16,38,75,76]). Moreover, it is grounded in the novice–expert paradigm as this difference is an implication of the theory of information reduction [33].
Related to this, it was identified that the attention of unsuccessful participants was more scattered that the attention of successful participants (see Figure 4), as the unsuccessful participants did not concentrate specifically on one or two areas only where the correct solution could be found. This can be caused, apart from the theory of information reduction, by their inability to quickly find a location they are searching for as previous studies suggest [13,16,38,75]. This inability can be a result of inefficient or no searching strategy [30,38], the limited amount of information they can process at once [30,34], and inability to extract information from widely distanced areas [5,32].
Nevertheless, it does not mean that all unsuccessful participants always used less efficient strategies than successful participants. In particular, during the first task, several participants, both successful and unsuccessful, worked with the layout elements (topographic legend and map title) that were not necessary for finding the correct solution. However, in the case of the successful participants, it could be the result of their need to verify the meaning of all cartographic signs used when they encounter unfamiliar maps and their habit of integrating all map layout elements to gain a wider meaning of the map [6]. On the other hand, in the case of the unsuccessful participants, it can be caused by the previously mentioned inability to distinguish relevant from irrelevant information or, simply, difficulties in understanding the map.
Moreover, contrary to some of the previous studies (e.g., [5,38]) it was found that on average successful participants needed more time to solve some of the analyzed tasks. Notwithstanding, this slow task solving is not a feature of inexperienced behavior or inefficient strategy, as it is attributable to their endeavor to solve the task correctly. It is characteristic to go back to the task formulation and the phase of solving the problem after already comparing the solution found with the possible solutions given, i.e., by verifying that the solution obtained is correct, even when a different problem-solving strategy was used. Therefore, this result is consistent with the characterization of experts’ problem-solving strategies described in [31,77].
The short answer times of unsuccessful participants can be thus described as hasty. Besides the lack of attention given to the crucial map layout elements, they did not sufficiently reflect upon the solution reached. Which definitely does not have to be a feature of the wrong strategy when the map user easily remembers complex tasks and is able to create a sequence of relevant sub-goals which need to be achieved to solve them. Nevertheless, to create this sequence and maintain it in the working memory is difficult for less experienced solvers [30]. The fast, less cautious, strategy can be also explained by lower motivation [16,78]. Nevertheless, there are no statements in the follow-up questionnaires that would indicate that.
Furthermore, according to the theories related to the novice–expert paradigm [30,31], less experienced problem-solvers use a limited number of strategies or only a single strategy to solve even considerably different tasks. Moreover, novices do not aptly adjust their strategies based on the tasks previously solved in contrast with experts. Nevertheless, the results of this study do not conclusively support these theses. Both more and less successful participants adjusted or changed their strategy during the test. Moreover, the majority of participants used more than one solving approach during the single task solving in the first three tasks analyzed. Above that, for one of the analyzed tasks most of the participants who used more than two main solving approaches were unsuccessful in finding the correct solution. Furthermore, the worst solvers were both among the participants who kept at least one problem-solving approach throughout the analyzed tasks and among the participants who used different solving approaches and their combinations in each of the tasks.
Therefore, the question arises as to whether these adjustments/changes of the strategies used were efficient and can be considered as a feature of expert problem-solving behavior. A positive answer is not supported by the data presented and by the theory of [30], given that solvers are able to appropriately adjust their strategies only when they are aware of the success of their previously used strategy. Given that the participants did not know if their answers were correct prior to finishing the whole test, the adjustments of strategies were caused by their inability to recognize the identical structure of the given task types [30,79]. Moreover, based on the follow-up questionnaires the identified changes in strategies in several less successful participants were unintentional and were partially influenced by the map type. Therefore, their task-solving behavior was more data-driven than theory-driven (consistent with [7,13,38,80]).
Of interest to us was also whether outliers in task-solving strategies are distinguished among less successful users only (RQ3). It turned out that both successful and unsuccessful participants were among participants with atypical visual behavior and unique task-solving strategies. This result was supported across all the appropriate methods of data analysis applied (see Section 3.2.2, Section 3.3.1, and Section 3.3.2).

4.2. What Enables/Hinders Identifying Features of Strategies that Characterise Unsuccessful Participants?

Based on the differences discussed above, it is apparent that our results partially contrast with the results of previous related studies indicating that experienced (i.e., successful) solvers apply more unified strategies than less successful ones. While the spatio-temporal strategy of novices/less successful solvers cannot be characterized as it differentiates a solver from a solver substantially [13,16].
It is true that novices/unsuccessful solvers are not one homogenous group; however, it is possible to categorize them into subgroups. For this purpose, it can be beneficial to use additional methods of eye-tracking data analysis and to supplement eye-tracking technology with some of the qualitative methods of data collection (as successfully proven by [36,37,57,81]).
Besides that, in cases where the features of strategies characteristic for unsuccessful participants (or generally for a specific group of participants) were not identified for some tasks, it certainly does not mean they do not exist. However, it is necessary to explore participants’ strategies from all their possible perspectives and preferably by using various methods as well (see the results for the task T1.2).
Moreover, in some cases, the chosen method of strategy comparison itself predetermines that less similarity will be found in a group of less experienced/successful participants, in particular, if these participants are characterized by a substantially slower task-solving process and the similarity of their strategies is analyzed by using some of the string-comparison methods. Given that there is a lower probability that these longer strings will match, respectively tthe behavior will stay the same throughout the whole task solving phase. In addition, the difference in string length of slower participants is larger than that of fast participants. Despite the current efforts to modify the algorithms used so that they are less dependent on string length (see e.g., [63]), the results of this study show that the influence is still evident. Therefore, it is necessary to take this limit into account and use these methods and interpret their outcomes cautiously when the length of strings differ considerably.
Nevertheless, it is similarly important to be cautious when the subgroups of novices/unsuccessful solvers are identified. Namely, when the cluster analysis is applied to explore similarities among participants’ spatial strategies it is fundamental to choose appropriate method of clustering and method of distance measures. Given that, different approaches to clustering might result in different clusters of participants identified. Moreover, it is key to be aware that the cluster analysis always enable to split the data into clusters even though there are no meaningful differences among them [66].

5. Conclusions

In the study presented here, we explored how map users solve tasks requiring the analysis of thematic maps. The research attention devoted to this more complex map skill and strategies chosen during its use is insufficient. Given that the increasing popularity of thematic maps led also to a considerable share of maps that contain serious (cartographic) insufficiencies or that intentionally distort the displayed data [2,3]. For that reason, the study specifically aimed to identify the differences between less and more successful map users during an analysis of thematic maps. Unlike the many closely related studies [5,6,7], attention was mostly given to less successful users, since our goal was to find the similarities in their visual behavior. Having found the unsuccessful strategies, we wanted to provide general recommendations which would lead to improvement of the map skills of less experienced users.
To fulfil the above-mentioned aim, various methods of eye-tracking data visualization and analysis were applied, providing some improvements and adding new modifications to the approaches also, e.g., hierarchical cluster analysis for categorization of relative spatial distribution of attention, theoretically-driven analysis and categorization of participants’ spatio-temporal strategies. These methods and their combination can be of use for researchers not only in the cartography field but generally to those aiming to understand the visual behavior and strategies during task solving of any kind (e.g., tasks requiring web search, tasks focusing on information remembering and recall).
Our study showed that less successful map users differ in some aspects of their strategies from more successful users. Most of these differences are consistent across the majority of participants who provide an incorrect answer for a given task. Nevertheless, outliers from the perspective of their task-solving behavior can also be identified among unsuccessful participants. However, equally, they can be identified among the successful participants.
Many studies focusing on the strategy differences caused by different levels of expertise highlight the differences identified that are difficult to change directly, e.g., a difference in fixation/saccade count, in fixation count per second, in saccade amplitude between less and more successful participants (see, e.g., [7,16,36,38]). Our aim was thus to provide practical tips based mainly on the results of the study presented here that could help unsuccessful participants to avoid ending up with an incorrect answer (see Table 2). These tips can be divided into tips specific to the analysis of thematic maps or to working with maps in general and even more generally helpful tips that can be useful during the solving of any task, as some of the identified incorrect solutions were not caused by insufficiently developed map skills. Furthermore, it can be noted that the clues refer to map use process, but may be of value for map makers as well as they indirectly point to map design improvements that can help map users to solve map task (more) efficiently.
We are aware that the suggested clues are developed on data collected from one particular empirical study. However, we believe it is of value to draw conclusions that are both possible to be implement by practitioners (in this case in cartographic education) and tested by other researchers in different conditions. The clues thus may be treated as a starting point for further discussion on the important, in our opinion, topic.
Notwithstanding, several considerable differences in the strategies used by the participants were identified that could not be explained by various levels of ‘top-down’ expertise of the participants and by the correctness of their task solving. Therefore, future studies could focus on identifying other independent variables that substantially influence the map user’s choice of strategy, thus enabling these unexplained differences to be clarified or even enabling all the differences identified to be better understood. The potentially appropriate variables can be derived from the results of studies similarly focusing on the characterization of solvers’ strategies, and not only in the field of cartography (e.g., [82,83,84,85]). From their perspective, the influence of gender, IQ, and cognitive (thinking) style should be explored in future studies.

Author Contributions

Conceptualization and Methodology, Lenka Havelková and Izabela Małgorzata Gołębiowska; Validation and Formal Analysis, Lenka Havelková; Investigation, Resources, and Visualization, Lenka Havelková and Izabela Małgorzata Gołębiowska; Data Curation, Lenka Havelková; Writing—Original Draft Preparation and Writing—Review and Editing, Lenka Havelková and Izabela Małgorzata Gołębiowska; Supervision, Izabela Małgorzata Gołębiowska; Funding Acquisition, Lenka Havelková and Izabela Małgorzata Gołębiowska. All authors have read and agreed to the published version of the manuscript.

Funding

This research was funded by the CHARLES UNIVERSITY GRANT AGENCY, grant number 42217, and by National Science Centre, Poland, grant number UMO-2018/31/D/HS6/02770. The APC was funded by National Science Centre, Poland, grant number UMO-2018/31/D/HS6/02770.

Acknowledgments

We would like to thank all students and colleagues who participated in this study for their time and efforts. Moreover, we express our thanks to Lukáš Brůha and Jakub Lysák for their useful ideas with regard to the development of the methodology of attention map creation.

Conflicts of Interest

The authors declare no conflict of interest.

Appendix A

Table A1. Correctness of answers given by the participants for individual tasks. Tasks chosen for further analyses are in bold.
Participant IDExpertiseT1.1T1.2T1.3T2.1T2.2T2.3T3.1T3.2T3.3T4.1T4.2T4.3Success Rate (%)
P01e 91.7
P02i 83.3
P03i 91.7
P04e 83.3
P06e 100.0
P07i 83.3
P08i 75.0
P09i 83.3
P10i 83.3
P12i 83.3
P13e 83.3
P14i 66.7
P15i 83.3
P16e 83.3
P17i 75.0
P18e 100.0
P20e 83.3
P21e 83.3
P22i 75.0
P23i 83.3
P24i 83.3
P25i 66.7
P26i 75.0
P27i 75.0
P28i 58.3
P29i 58.3
P30i 83.3
P31e 91.7
P32e 75.0
P33e 66.7
P34i 75.0
P35e 83.3
P37e 66.7
P39e 83.3
Share of correct answers (%)47419450719410085911009194
e = expert, i = intermediate, green colored cell = correct answer, red colored cell = incorrect answer, green bold letters = the best solvers, red bold letters = the worst solvers.

References

  1. Wood, D. The Power of Maps; The Guilford Press: New York, NY, USA, 1992. [Google Scholar]
  2. Cinnamon, S.A. Map as Weapon. Constructing Knowledge: Curriculum Studies in Action. In Through a Distorted Lens: Media as Curricula and Pedagogy in the 21st Century; Nicosia, L.M., Goldstein, R.A., Eds.; Sense Publishers: Rotterdam, The Netherlands, 2017; pp. 99–114. [Google Scholar]
  3. Monmonier, M. How to Lie with Maps; University of Chicago Press: Chicago, IL, USA, 2014. [Google Scholar]
  4. Havelková, L.; Hanus, M. Map skills in education: A systematic review of terminology, methodology, and influencing factors. Rev. Int. Geogr. Educ. Online 2019, 9, 361–401. [Google Scholar]
  5. Ooms, K.; De Maeyer, P.; Fack, V.; Van Assche, E.; Witlox, F. Interpreting maps through the eyes of expert and novice users. Int. J. Geogr. Inf. Sci. 2012, 26, 1773–1788. [Google Scholar] [CrossRef]
  6. Gerber, R.; Lidstone, J.; Nason, R. Modelling expertise in map reading: Beginnings. Int. Res. Geogr. Environ. Educ. 1992, 1, 31–43. [Google Scholar] [CrossRef]
  7. Ooms, K.; De Maeyer, P.; Fack, V. Study of the attentive behavior of novice and expert map users using eye tracking. Cartogr. Geogr. Inf. Sci. 2014, 41, 37–54. [Google Scholar] [CrossRef] [Green Version]
  8. Postigo, Y.; Pozo, J.I. The Learning of a Geographical Map by Experts and Novices. Educ. Psychol. 1998, 18, 65–80. [Google Scholar] [CrossRef]
  9. Dong, W.; Ying, Q.; Yang, Y.; Tang, S.; Zhan, Z.; Liu, B.; Meng, L. Using Eye Tracking to Explore the Impacts of Geography Courses on Map-based Spatial Ability. Sustainability 2018, 11, 76. [Google Scholar] [CrossRef] [Green Version]
  10. Clark, D.; Reynolds, S.; Lemanowski, V.; Stiles, T.; Yasar, S.; Proctor, S.; Lewis, E.; Stromfors, C.; Corkins, J. University Students’ Conceptualization and Interpretation of Topographic Maps. Int. J. Sci. Educ. 2008, 30, 377–408. [Google Scholar] [CrossRef] [Green Version]
  11. Logan, T.; Lowrie, T.; Diezmann, C.M. Co-thought gestures: Supporting students to successfully navigate map tasks. Educ. Stud. Math. 2014, 87, 87–102. [Google Scholar] [CrossRef]
  12. Çöltekin, A.; Brychtová, A.; Griffin, A.L.; Robinson, A.C.; Imhof, M.; Pettit, C. Perceptual complexity of soil-landscape maps: A user evaluation of color organization in legend designs using eye tracking. Int. J. Digit. Earth 2017, 10, 560–581. [Google Scholar] [CrossRef]
  13. Çöltekin, A.; Fabrikant, S.I.; Lacayo, M. Exploring the efficiency of users’ visual analytics strategies based on sequence analysis of eye movement recordings. Int. J. Geogr. Inf. Sci. 2010, 24, 1559–1575. [Google Scholar] [CrossRef]
  14. Opach, T.; Gołębiowska, I.; Fabrikant, S.I. How Do People View Multi-Component Animated Maps? Cartogr. J. 2014, 51, 330–342. [Google Scholar] [CrossRef]
  15. Baker, K.M.; Petcovic, H.; Wisniewska, M.; Libarkin, J.C. Spatial signatures of mapping expertise among field geologists. Cartogr. Geogr. Inf. Sci. 2012, 39, 119–132. [Google Scholar] [CrossRef]
  16. Krstić, K.; Šoškić, A.; Ković, V.; Holmqvist, K. All good readers are the same, but every low-skilled reader is different: An eye-tracking study using PISA data. Eur. J. Psychol. Educ. 2018, 33, 521–541. [Google Scholar] [CrossRef]
  17. Roth, R.E. Cartographic Interaction Primitives: Framework and Synthesis. Cartogr. J. 2012, 49, 376–395. [Google Scholar] [CrossRef]
  18. Dong, W.; Wang, S.; Chen, Y.; Meng, L. Using Eye Tracking to Evaluate the Usability of Flow Maps. ISPRS Int. J. Geo-Inf. 2018, 7, 281. [Google Scholar] [CrossRef] [Green Version]
  19. Burian, J.; Popelka, S.; Beitlova, M. Evaluation of the Cartographical Quality of Urban Plans by Eye-Tracking. ISPRS Int. J. Geo-Inf. 2018, 7, 192. [Google Scholar] [CrossRef] [Green Version]
  20. Wehrend, S.; Lewis, C. A Problem-oriented Classification of Visualization Techniques. In Proceedings of the 1st Conference on Visualization ’90, San Francisco, CA, USA, 23–26 October 1990. [Google Scholar]
  21. Amar, R.; Eagan, J.; Stasko, J. Low-Level Components of Analytic Activity in Information Visualization. In Proceedings of the 2005 IEEE Symposium on Information Visualization, Minneapolis, MN, USA, 23–25 October 2005; p. 15. [Google Scholar]
  22. Kimerling, A.J.; Buckley, A.R.; Muehrcke, P.C.; Muehrcke, J.O. Map Use: Reading and Analysis; ESRI Press Academic: Redlands, CA, USA, 2009. [Google Scholar]
  23. Michaelidou, E.; Nakos, B.; Filippakopoulou, V. The Ability of Elementary School Children to Analyse General Reference and Thematic Maps. Cartographica 2004, 39, 65–88. [Google Scholar] [CrossRef] [Green Version]
  24. Carmichael, A.; Larson, A.; Gire, E.; Loschky, L.; Rebello, N.S. How Does Visual Attention Differ Between Experts and Novices on Physics Problems? In 2010 Physics Education Research Conference; Singh, C., Sabella, M., Rebello, S., Eds.; Amer Inst Physics: Melville, NY, USA, 2010; p. 93. [Google Scholar]
  25. Bednarik, R. Expertise-dependent visual attention strategies develop over time during debugging with multiple code representations. Int. J. Hum. Comput. Stud. 2012, 70, 143–155. [Google Scholar] [CrossRef]
  26. Li, W.-C.; Chiu, F.-C.; Kuo, Y.; Wu, K.-J. The Investigation of Visual Attention and Workload by Experts and Novices in the Cockpit. In Proceedings of the Engineering Psychology and Cognitive Ergonomics. Applications and Services; Harris, D., Ed.; Springer: Berlin, Germany, 2013; pp. 167–176. [Google Scholar]
  27. Warren, A.L.; Donnon, T.L.; Wagg, C.R.; Priest, H.; Fernandez, N.J. Quantifying Novice and Expert Differences in Visual Diagnostic Reasoning in Veterinary Pathology Using Eye-Tracking Technology. J. Vet. Med. Educ. 2018, 45, 295–306. [Google Scholar] [CrossRef]
  28. Moser-Mercer, B. The expert-novice paradigm in interpreting research. In Translationsdidaktik; Gunter Narr Verlag: Tübingen, Germany, 1997; pp. 255–261. [Google Scholar]
  29. Ooms, K.; De Maeyer, P.; Fack, V. Listen to the Map User: Cognition, Memory, and Expertise. Cartogr. J. 2015, 52, 3–19. [Google Scholar] [CrossRef] [Green Version]
  30. Anderson, J.R. The Architecture of Cognition; Harvard University Press: Cambridge, UK, 1983. [Google Scholar]
  31. Gerace, W.J. Problem Solving and Conceptual Understanding. In Proceedings of the 2001 Physics Education Research Conference; Franklin, S., Marx, J., Cummings, K., Eds.; PERC Publishing: New York, NY, USA, 2001; pp. 33–45. [Google Scholar]
  32. Gegenfurtner, A.; Lehtinen, E.; Säljö, R. Expertise Differences in the Comprehension of Visualizations: A Meta-Analysis of Eye-Tracking Research in Professional Domains. Educ. Psychol. Rev. 2011, 23, 523–552. [Google Scholar] [CrossRef]
  33. Haider, H.; Frensch, P.A. The Role of Information Reduction in Skill Acquisition. Cogn. Psychol. 1996, 30, 304–337. [Google Scholar] [CrossRef] [Green Version]
  34. Paas, F.; Renkl, A.; Sweller, J. Cognitive Load Theory and Instructional Design: Recent Developments. Educ. Psychol. 2003, 38, 1–4. [Google Scholar] [CrossRef]
  35. Crampton, J. A Cognitive Analysis of Wayfinding Expertise. Cartographica 1992, 29, 46–65. [Google Scholar] [CrossRef]
  36. Stofer, K.; Che, X. Comparing Experts and Novices on Scaffolded Data Visualizations using Eye-tracking. J. Eye Mov. Res. 2014, 7, 1–15. [Google Scholar]
  37. Popelka, S.; Vondráková, A.; Hujňáková, P. Eye-tracking Evaluation of Weather Web Maps. ISPRS Int. J. Geo-Inf. 2019, 8, 256. [Google Scholar] [CrossRef] [Green Version]
  38. Dong, W.; Zheng, L.; Liu, B.; Meng, L. Using Eye Tracking to Explore Differences in Map-Based Spatial Ability between Geographers and Non-Geographers. ISPRS Int. J. Geo-Inf. 2018, 7, 337. [Google Scholar] [CrossRef] [Green Version]
  39. McArdle, G.; Tahir, A.; Bertolotto, M. Interpreting map usage patterns using geovisual analytics and spatio-temporal clustering. Int. J. Digit. Earth 2015, 8, 599–622. [Google Scholar] [CrossRef] [Green Version]
  40. Nielsen, J. Usability Engineering; Morgan Kaufmann: San Francisco, CA, USA, 1994. [Google Scholar]
  41. Çöltekin, A.; Heil, B.; Garlandini, S.; Fabrikant, S.I. Evaluating the Effectiveness of Interactive Map Interface Designs: A Case Study Integrating Usability Metrics with Eye-Movement Analysis. Cartogr. Geogr. Inf. Sci. 2009, 36, 5–17. [Google Scholar] [CrossRef]
  42. Kerkovits, K.; Szigeti, C. Relationship between The Distortions in Map Projections and The Usability of Small-Scale Maps. In Proceedings of 7th International Conference on Cartography and GIS; Bandrova, T., Konečný, M., Eds.; Bulgarian Cartographic Association: Sozopol, Bulgaria, 2018; pp. 236–245. [Google Scholar]
  43. Šavrič, B.; Jenny, B.; White, D.; Strebe, D.R. User preferences for world map projections. Cartogr. Geogr. Inf. Sci. 2015, 42, 398–409. [Google Scholar] [CrossRef]
  44. Kastens, K.A.; Liben, L.S. Children’s Strategies and Difficulties while Using a Map to Record Locations in an Outdoor Environment. Int. Res. Geogr. Environ. Educ. 2010, 19, 315–340. [Google Scholar] [CrossRef]
  45. Lee, J.; Bednarz, R.S. Video Analysis of Map-Drawing Strategies. J. Geogr. 2005, 104, 211–221. [Google Scholar] [CrossRef]
  46. van Gog, T.; Paas, F.; van Merriënboer, J.J.G.; Witte, P. Uncovering the Problem-Solving Process: Cued Retrospective Reporting Versus Concurrent and Retrospective Reporting. J. Exp. Psychol. Appl. 2005, 11, 237–244. [Google Scholar] [CrossRef] [Green Version]
  47. Ericsson, K.A.; Simon, H.A. Protocol Analysis: Verbal Reports as Data; MIT Press: Cambridge, MA, USA, 1993. [Google Scholar]
  48. Gołębiowska, I. Legend Layouts for Thematic Maps: A Case Study Integrating Usability Metrics with the Thinking Aloud Method. Cartogr. J. 2015, 52, 28–40. [Google Scholar] [CrossRef]
  49. Donker, A.; Markopoulos, P. A Comparison of Think-aloud, Questionnaires and Interviews for Testing Usability with Children. In People and Computers XVI—Memorable Yet Invisible; Faulkner, X., Finlay, J., Détienne, F., Eds.; Springer London: London, UK, 2002; pp. 305–316. [Google Scholar]
  50. Ooms, K.; De Maeyer, P.; Fack, V. Analyzing eye movement patterns to improve map design. In Proceedings of the AutoCarto 2010; CaGIS: Orlando, FL, USA, 2010; Volume 38, p. 5. [Google Scholar]
  51. Duchowski, A. Eye Tracking Methodology: Theory and Practice; Springer London: London, UK, 2007. [Google Scholar]
  52. Just, M.A.; Carpenter, P.A. Eye fixations and cognitive processes. Cogn. Psychol. 1976, 8, 441–480. [Google Scholar] [CrossRef]
  53. Dong, W.; Liao, H.; Xu, F.; Liu, Z.; Zhang, S. Using eye tracking to evaluate the usability of animated maps. Sci. China-Earth Sci. 2014, 57, 512–522. [Google Scholar] [CrossRef]
  54. Brychtová, A.; Çöltekin, A. An Empirical User Study for Measuring the Influence of Colour Distance and Font Size in Map Reading Using Eye Tracking. Cartogr. J. 2016, 53, 202–212. [Google Scholar] [CrossRef] [Green Version]
  55. Lei, T.-C.; Wu, S.-C.; Chao, C.-W.; Lee, S.-H. Evaluating differences in spatial visual attention in wayfinding strategy when using 2D and 3D electronic maps. GeoJournal 2016, 81, 153–167. [Google Scholar] [CrossRef]
  56. Dong, W.; Jiang, Y.; Zheng, L.; Liu, B.; Meng, L. Assessing Map-Reading Skills Using Eye Tracking and Bayesian Structural Equation Modelling. Sustainability 2018, 10, 3050. [Google Scholar] [CrossRef] [Green Version]
  57. Havelková, L.; Hanus, M. Research into map-analysis strategies: Theory- and data-driven approaches. Geografie 2019, 124, 187–216. [Google Scholar] [CrossRef]
  58. Liao, H.; Dong, W.; Peng, C.; Liu, H. Exploring differences of visual attention in pedestrian navigation when using 2D maps and 3D geo-browsers. Cartogr. Geogr. Inf. Sci. 2017, 44, 474–490. [Google Scholar] [CrossRef]
  59. Keskin, M.; Ooms, K.; Dogru, A.O.; De Maeyer, P. EEG & Eye Tracking User Experiments for Spatial Memory Task on Maps. ISPRS Int. J. Geo-Inf. 2019, 8, 546. [Google Scholar]
  60. Havelková, L.; Hanus, M. The Impact of the Map Type on the Level of Student Map Skills. Cartographica 2018, 53, 149–170. [Google Scholar] [CrossRef]
  61. Voßkühler, A.; Nordmeier, V.; Kuchinke, L.; Jacobs, A.M. OGAMA (Open Gaze and Mouse Analyzer): Open-source software designed to analyze eye and mouse movements in slideshow study designs. Behav. Res. Methods 2008, 40, 1150–1162. [Google Scholar] [CrossRef] [Green Version]
  62. Popelka, S. Optimal eye fixation detection settings for cartographic purposes. In Proceedings of the 14th SGEM GeoConference on Informatics, Geoinformatics and Remote Sensing (SGEM’14), Albena, Bulgaria, 17–26 June 2014. [Google Scholar]
  63. Doležalová, J.; Popelka, S. ScanGraph: A Novel Scanpath Comparison Method Using Visualisation of Graph Cliques. J. Eye Mov. Res. 2016, 9, 1–13. [Google Scholar]
  64. Bojko, A. Informative or Misleading? Heatmaps Deconstructed, New Trends. In Proceedings of the Human-Computer Interaction; Jacko, J.A., Ed.; Springer: Berlin, Germany, 2009; pp. 30–39. [Google Scholar]
  65. Nétek, R.; Pour, T.; Slezáková, R. Implementation of Heat Maps in Geographical Information System – Exploratory Study on Traffic Accident Data. Open Geosci. 2018, 10, 367–384. [Google Scholar] [CrossRef]
  66. Kent, R.A. Analysing Quantitative Data: Variable-Based and Case-Based Approaches to Non-Experimental Datasets; SAGE: London, UK, 2015. [Google Scholar]
  67. Gołębiowska, I.; Opach, T.; Rød, J.K. For your eyes only? Evaluating a coordinated and multiple views tool with a map, a parallel coordinated plot and a table using an eye-tracking approach. Int. J. Geogr. Inf. Sci. 2017, 31, 237–252. [Google Scholar] [CrossRef] [Green Version]
  68. Doležalová, J.; Popelka, S. Evaluation of the User Strategy on 2d and 3d City Maps Based on Novel Scanpath Comparison Method and Graph Visualization. In XXIII ISPRS Congress, Commission II; Halounová, L., Li, S., Šafář, V., Tomková, M., Rapant, P., Brázdil, K., Shi, W., Anton, F., Liu, Y., Stein, A., et al., Eds.; Copernicus Gesellschaft Mbh: Gottingen, Germany, 2016; Volume 41, pp. 637–640. [Google Scholar]
  69. Anderson, N.C.; Anderson, F.; Kingstone, A.; Bischof, W.F. A comparison of scanpath comparison methods. Behav. Res. 2015, 47, 1377–1392. [Google Scholar] [CrossRef] [Green Version]
  70. Needleman, S.B.; Wunsch, C.D. A general method applicable to the search for similarities in the amino acid sequence of to proteins. J. Mol. Biol. 1970, 48, 443–453. [Google Scholar] [CrossRef]
  71. Levenshtein, V.I. Binary codes capable of correcting deletions, insertions, and reversals. Sov. Phys. Dokl. 1966, 10, 707–710. [Google Scholar]
  72. Cristino, F.; Mathôt, S.; Theeuwes, J.; Gilchrist, I.D. ScanMatch: A novel method for comparing fixation sequences. Behav. Res. Methods 2010, 42, 692–700. [Google Scholar] [CrossRef] [PubMed] [Green Version]
  73. Polson, P.G.; Lewis, C.; Rieman, J.; Wharton, C. Cognitive walkthroughs: A method for theory-based evaluation of user interfaces. Int. J. Man-Mach. Stud. 1992, 36, 741–773. [Google Scholar] [CrossRef]
  74. Svenson, O. Differentiation and consolidation theory of human decision making: A frame of reference for the study of pre- and post-decision processes. Acta Psychol. 1992, 80, 143–168. [Google Scholar] [CrossRef]
  75. Dimopoulos, K.; Asimakopoulos, A. Science on the Web: Secondary School Students’ Navigation Patterns and Preferred Pages’ Characteristics. J. Sci. Educ. Technol. 2010, 19, 246–265. [Google Scholar] [CrossRef]
  76. Jarodzka, H.; Scheiter, K.; Gerjets, P.; van Gog, T. In the eyes of the beholder: How experts and novices interpret dynamic stimuli. Learn. Instr. 2010, 20, 146–154. [Google Scholar] [CrossRef] [Green Version]
  77. She, H.C.; Cheng, M.T.; Li, T.W.; Wang, C.Y.; Chiu, H.T.; Lee, P.Z.; Chou, W.C.; Chuang, M.H. Web-based undergraduate chemistry problem-solving: The interplay of task performance, domain knowledge and web-searching strategies. Comput. Educ. 2012, 59, 750–761. [Google Scholar] [CrossRef]
  78. Mayer, R.E. Cognitive, metacognitive, and motivational aspects of problem solving. Instr. Sci. 1998, 26, 49–63. [Google Scholar] [CrossRef]
  79. MacEachren, A.M. How Maps Work: Representation, Visualization and Design; Guilford Press: New York, NY, USA, 1995. [Google Scholar]
  80. Brunyé, T.T.; Taylor, H.A. When Goals Constrain: Eye Movements and Memory for Goal-Oriented Map Study. Appl. Cogn. Psychol. 2009, 23, 772–787. [Google Scholar] [CrossRef]
  81. Snopková, D.; Švedová, H.; Kubíček, P.; Stachoň, Z. Navigation in Indoor Environments: Does the Type of Visual Learning Stimulus Matter? ISPRS Int. J. Geo-Inf. 2019, 8, 251. [Google Scholar] [CrossRef] [Green Version]
  82. Fiorina, L.; Antonietti, A.; Colombo, B.; Bartolomeo, A. Thinking style, browsing primes and hypermedia navigation. Comput. Educ. 2007, 49, 916–941. [Google Scholar] [CrossRef]
  83. Hsieh, T.; Wu, K. The Influence of Gender Difference on the Information-Seeking Behaviors for the Graphical Interface of Children’s Digital Library. Univers. J. Educ. Res. 2015, 3, 200–206. [Google Scholar] [CrossRef] [Green Version]
  84. Cho, S. The role of IQ in the use of cognitive strategies to learn information from a map. Learn. Individ. Differ. 2010, 20, 694–698. [Google Scholar] [CrossRef]
  85. Mason, L.; Tornatora, M.C.; Pluchino, P. Do fourth graders integrate text and picture in processing and learning from an illustrated science text? Evidence from eye-movement patterns. Comput. Educ. 2013, 60, 95–109. [Google Scholar] [CrossRef]
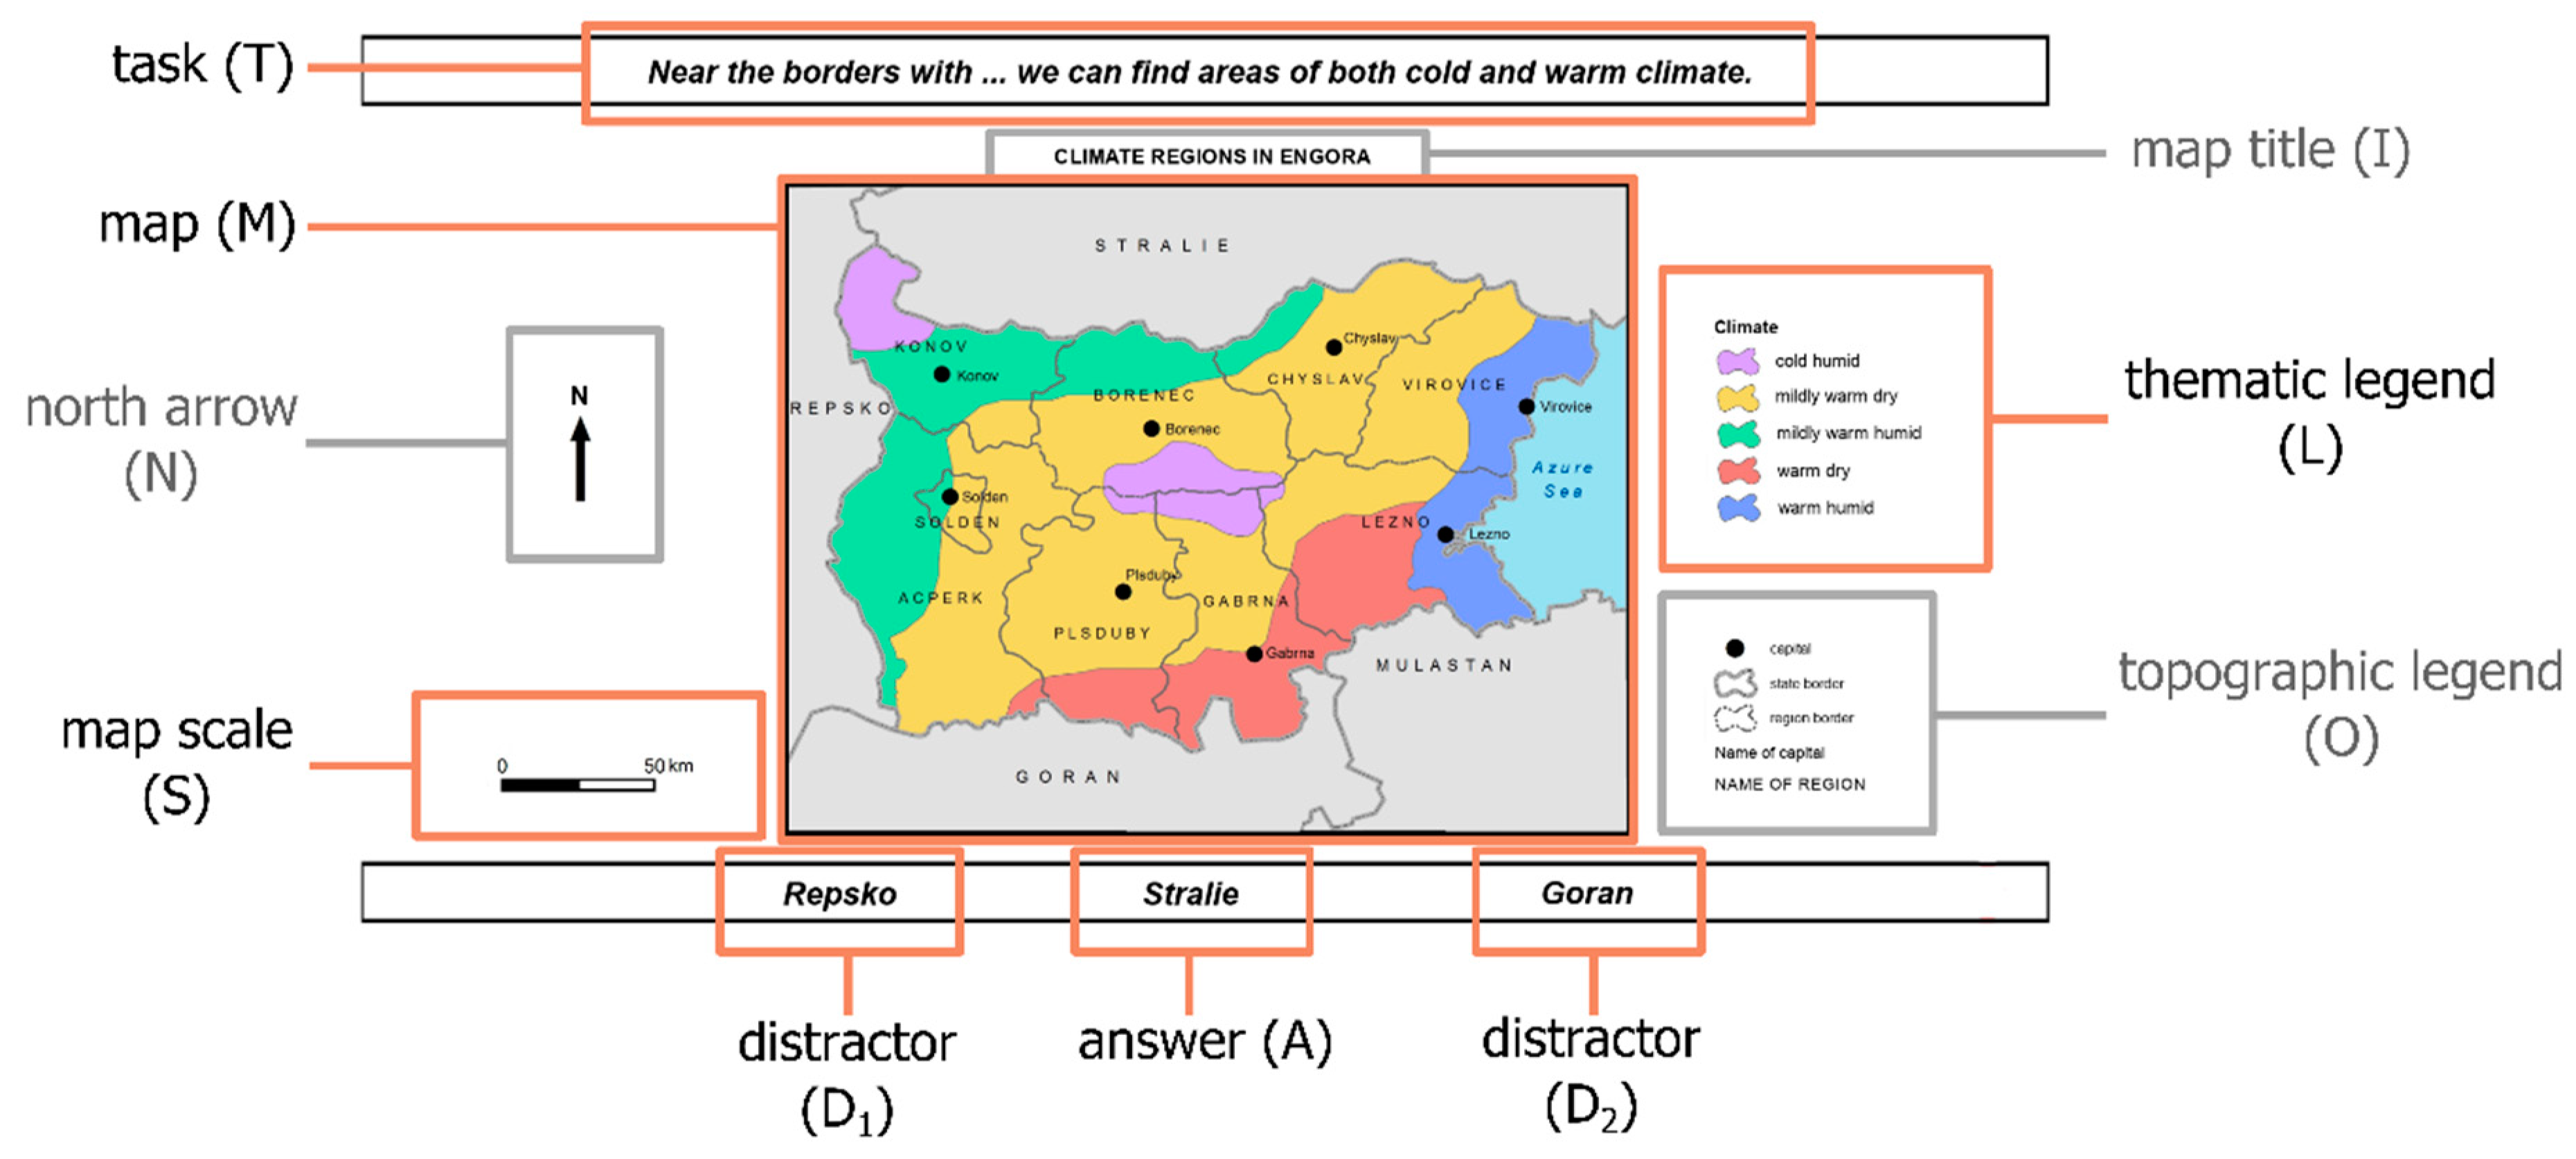
Figure 1. Stimuli layout with the designated AOIs and their abbreviations. The key AOIs applied in further analyses are marked with colored rectangles.
Ijgi 09 00009 g001
Figure 2. Procedure and study design.
Ijgi 09 00009 g002
Figure 3. Comparison of intermediates’ and experts’ success rate.
Ijgi 09 00009 g003
Figure 4. Relative attention maps of participants answering correctly (left column), incorrectly (middle column), and a calculated difference between the attention maps (right column).
Ijgi 09 00009 g004
Figure 5. Distribution of relative fixation duration during task solving among individual AOIs. Each diagram represents a cluster identified by hierarchical cluster analysis. The clusters are ordered based on the share of unsuccessful participants (from the highest to the lowest).
Ijgi 09 00009 g005
Figure 6. The similarity of the order of AOIs visited based on the Needleman–Wunsch algorithm. Each dot in the graphs represents one participant and an edge connecting two dots represents the participants whose value of sequence similarity is among the top 5%.
Ijgi 09 00009 g006
Figure 7. Strategies used when solving the selected task. Participants are manually grouped based on the main strategy (strategies) to which their used strategy (strategies) is related. The groups with 75% or more participants providing incorrect answers are highlighted with a pale red background.
Ijgi 09 00009 g007
Table 1. Examples of tasks with three possible answers used in eye-tracking testing. The stated tasks were chosen for further analyses.
Task FormulationTask Code
Near the borders with … we can find areas of both cold and warm climates.T1.1
RepskoStralieGoran
An approximately …-kilometer-wide area of a warm humid climate edges the coast of the Azure Sea.T1.2
254055
All the regional capitals of the regions neighboring … are connected by a highway.T2.1
GoranMulastanStralie
Residents commuting by train from the capital of Chyslav to the capital of Virovice travel approximately …T2.2
4080120
Table 2. Recommendations leading to more successful (map) task solving based on the study results.
Specific Tips for (thematic) Map AnalysisGeneral Tips for Task Solving
Get familiar with the map as a whole upon first seeing it and, particularly, if more complex map skills are required (i.e., map analysis or map interpretation). Specifically, become acquainted with the meaning of all the cartographic signs used by referring to both thematic and topographic legends.Use all task elements that may be helpful in solving the task efficiently and effectively. Therefore, get familiar with possible solutions if they are provided in the first phase of solving the task, as it can be helpful to narrow the number of task elements that need to be used.
Efficiently take in individual map elements. Specifically, take in the information depicted on the map by comparing the cartographic signs with their meanings stated in the (thematic) legend.If not working to a time constraint, do not prioritize the time it takes to answer. Double-check if the solution found corresponds to the task and, possibly, the solutions given. Moreover, verify that it is the only solution that fits the task as it was comprehended when only one solution can be correct.
Having understood the given task, try to distinguish relevant map layout elements from irrelevant ones in order to decrease the number of map elements you have to thoroughly analyze and repeatedly refer to.
The same is true with the map content presented. Try to reduce the analyzed area presented on a map and/or thematic layers, to the ones that are relevant to the given task. Having completed this, try to focus only on this content when executing the given task.
Try to decode the given task prior to actually solving it to find its structure and to use an appropriate strategy for the task type identified, based on the set sequence of sub-goals that will lead to its solution. Moreover, try to use the same strategy to an identical type of task (e.g., independent of map type) if it proves to be effective. If not, get familiar with the correct answer and find the reason behind the incorrect solution to be able to aptly modify the strategy.