Diachronic UAV Photogrammetry of a Sandy Beach in Brittany (France) for a Long-Term Coastal Observatory

 , ,
, , 
Abstract
1. Introduction
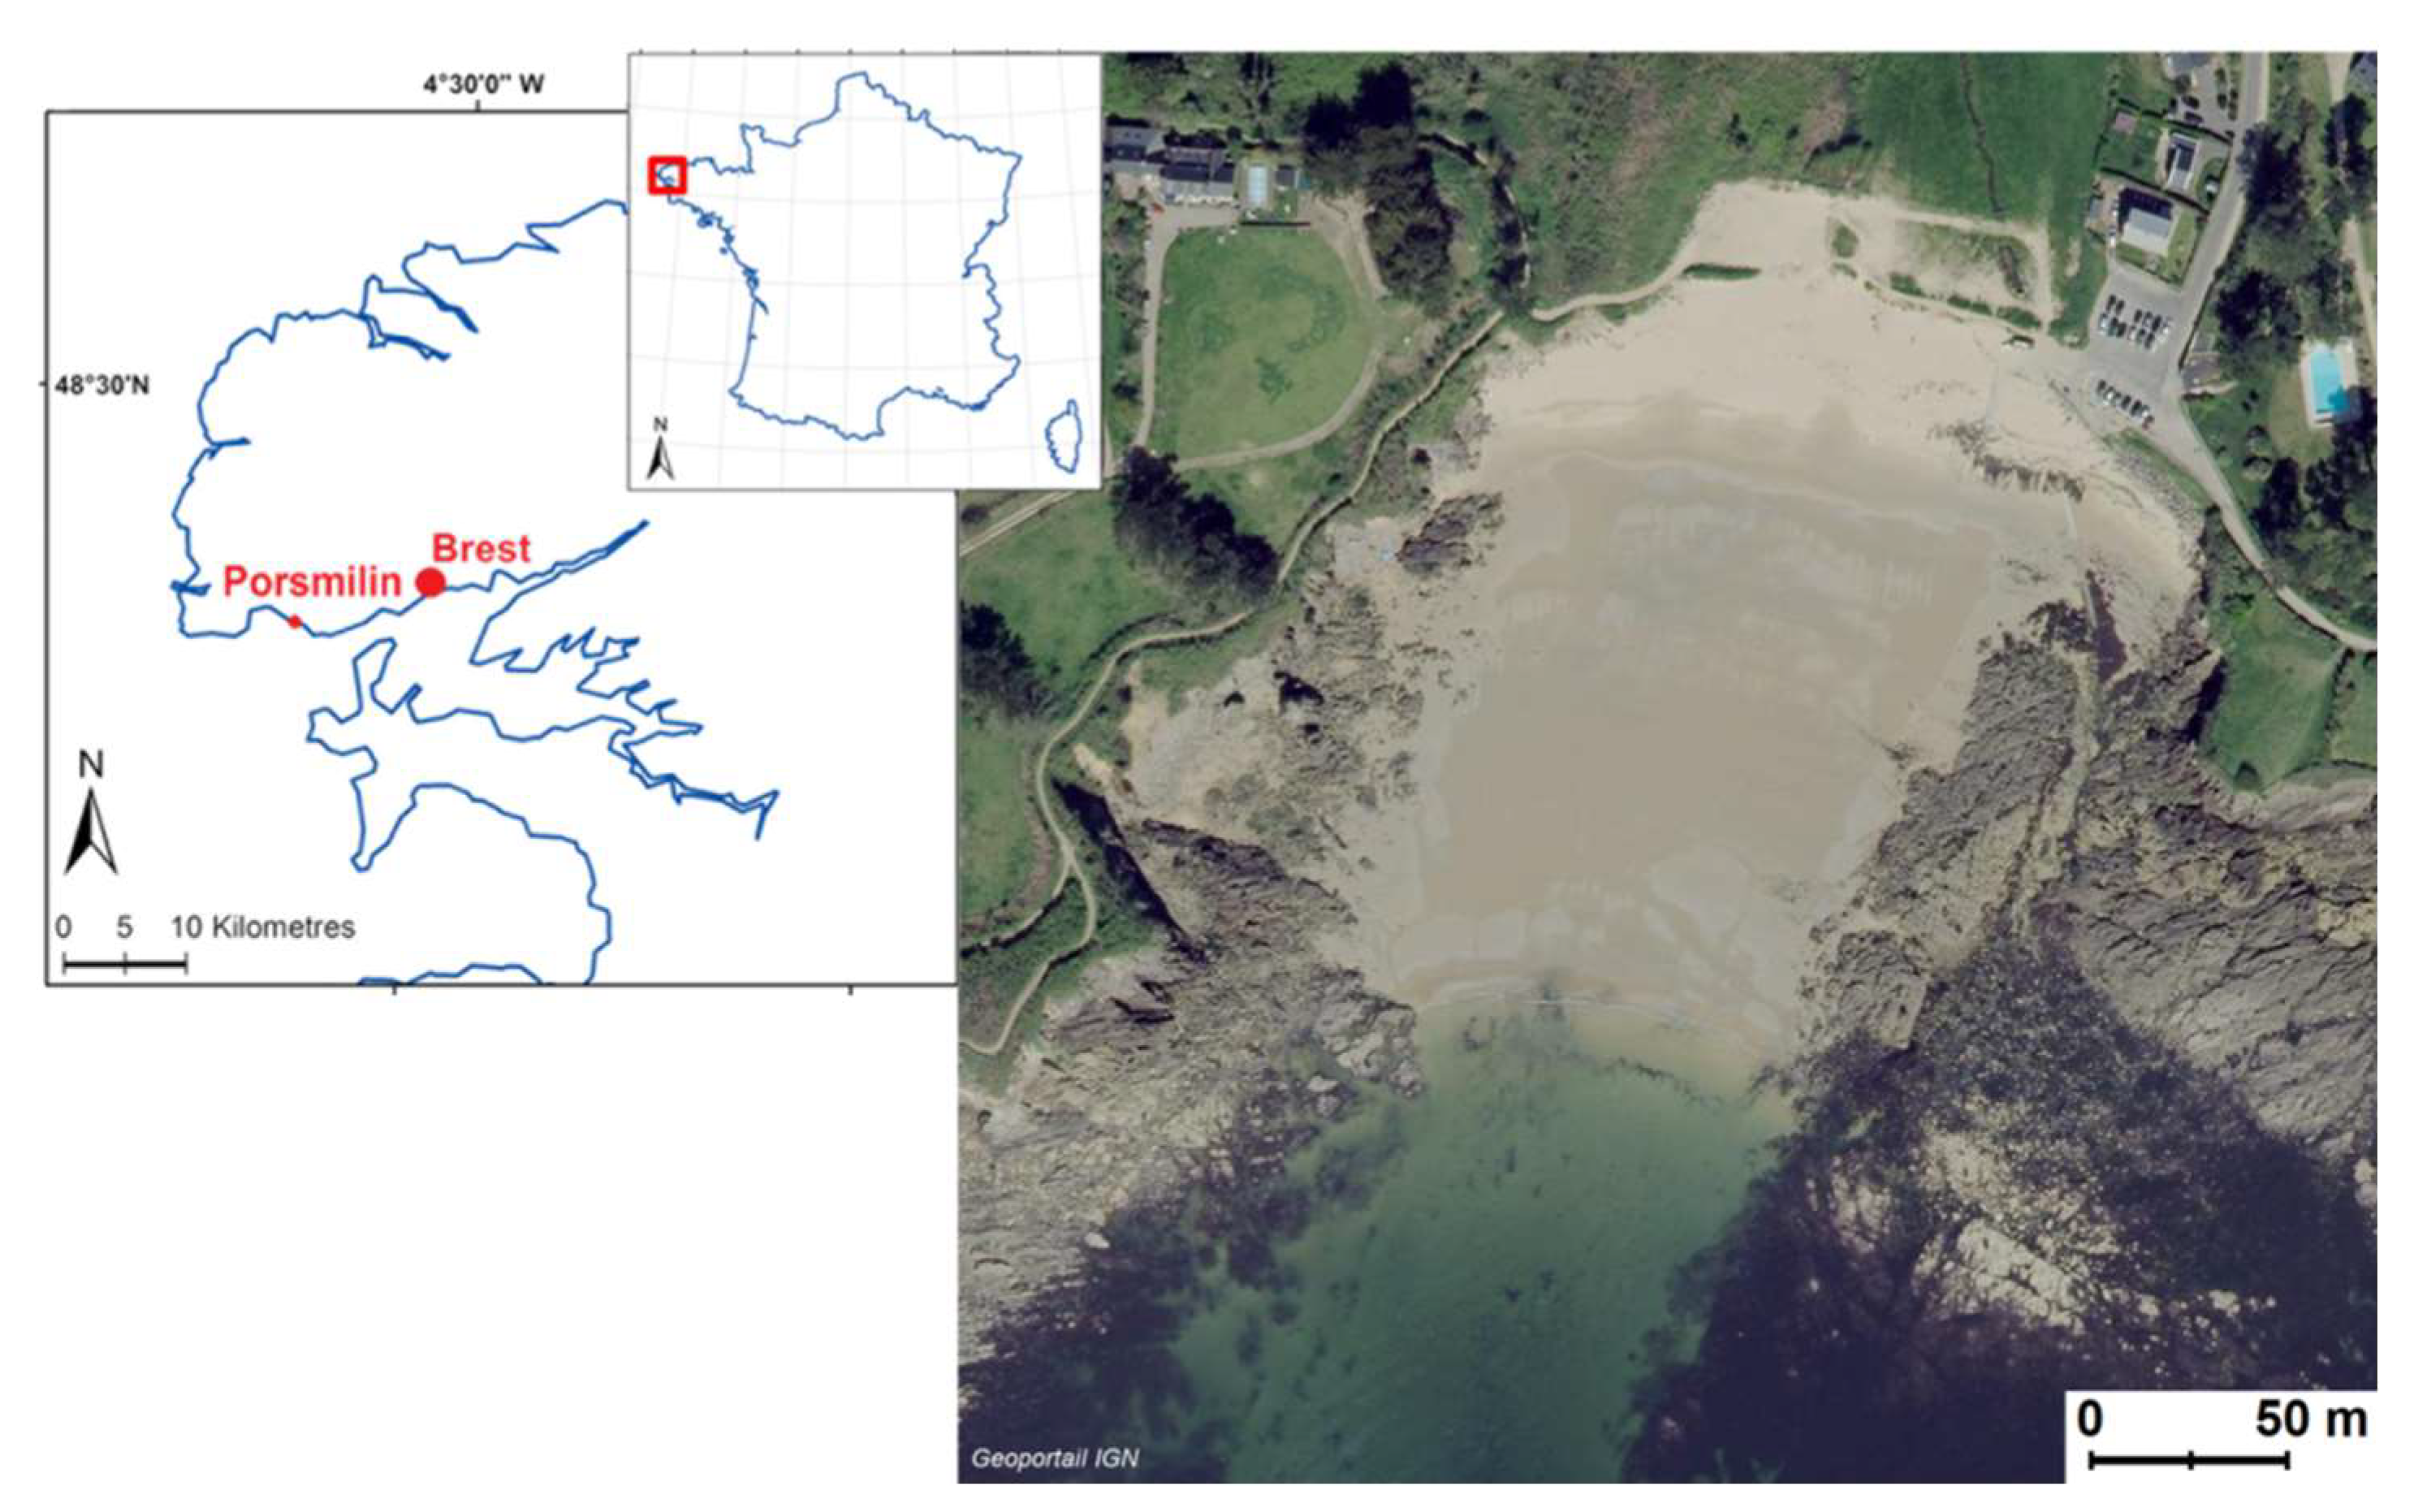
2. Study Area
3. Evolution of Technical Equipment and Methods
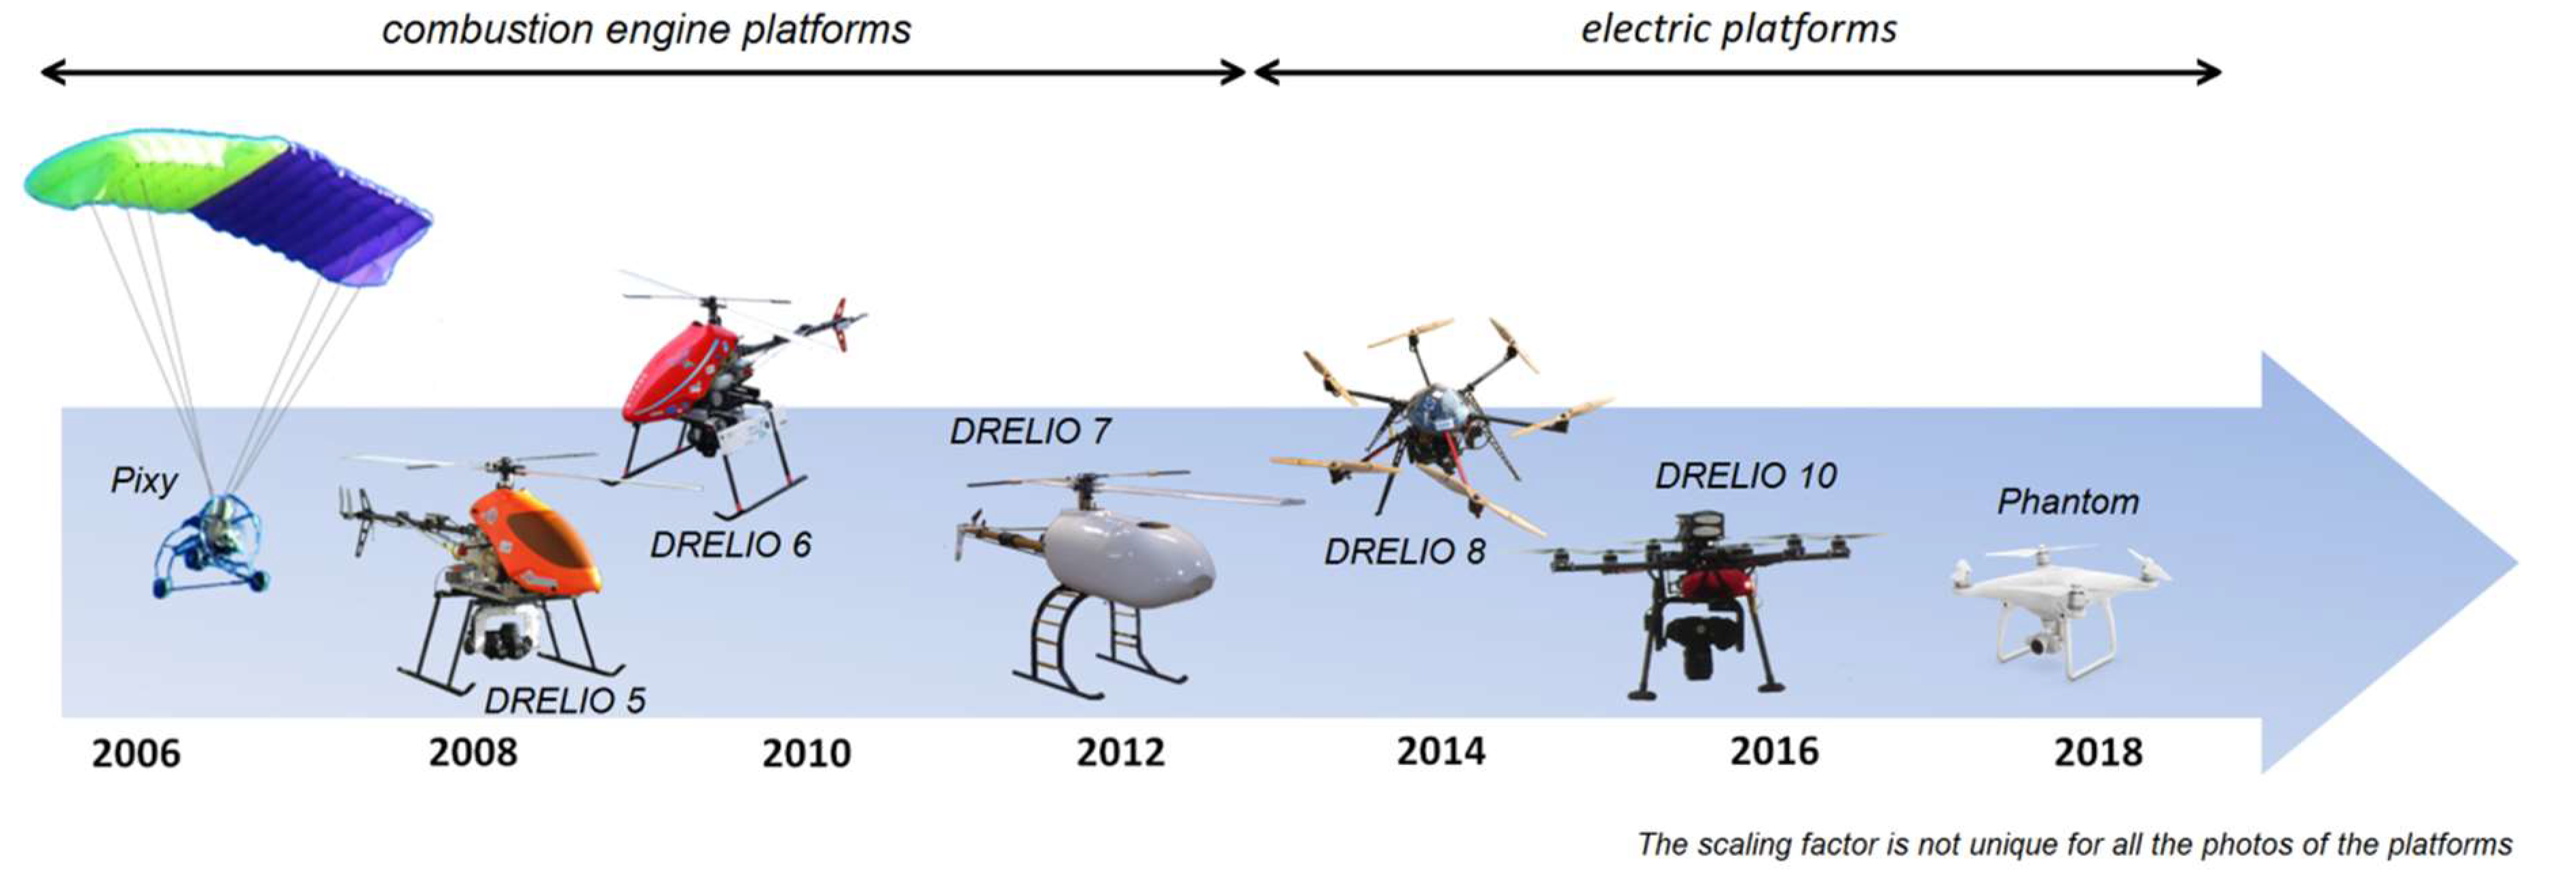
3.1. Evolution of the UAV Platforms
3.2. Evolution of the Processing Tools
3.3. Evolution of the Survey Operational Mode
4. Results and Discussion
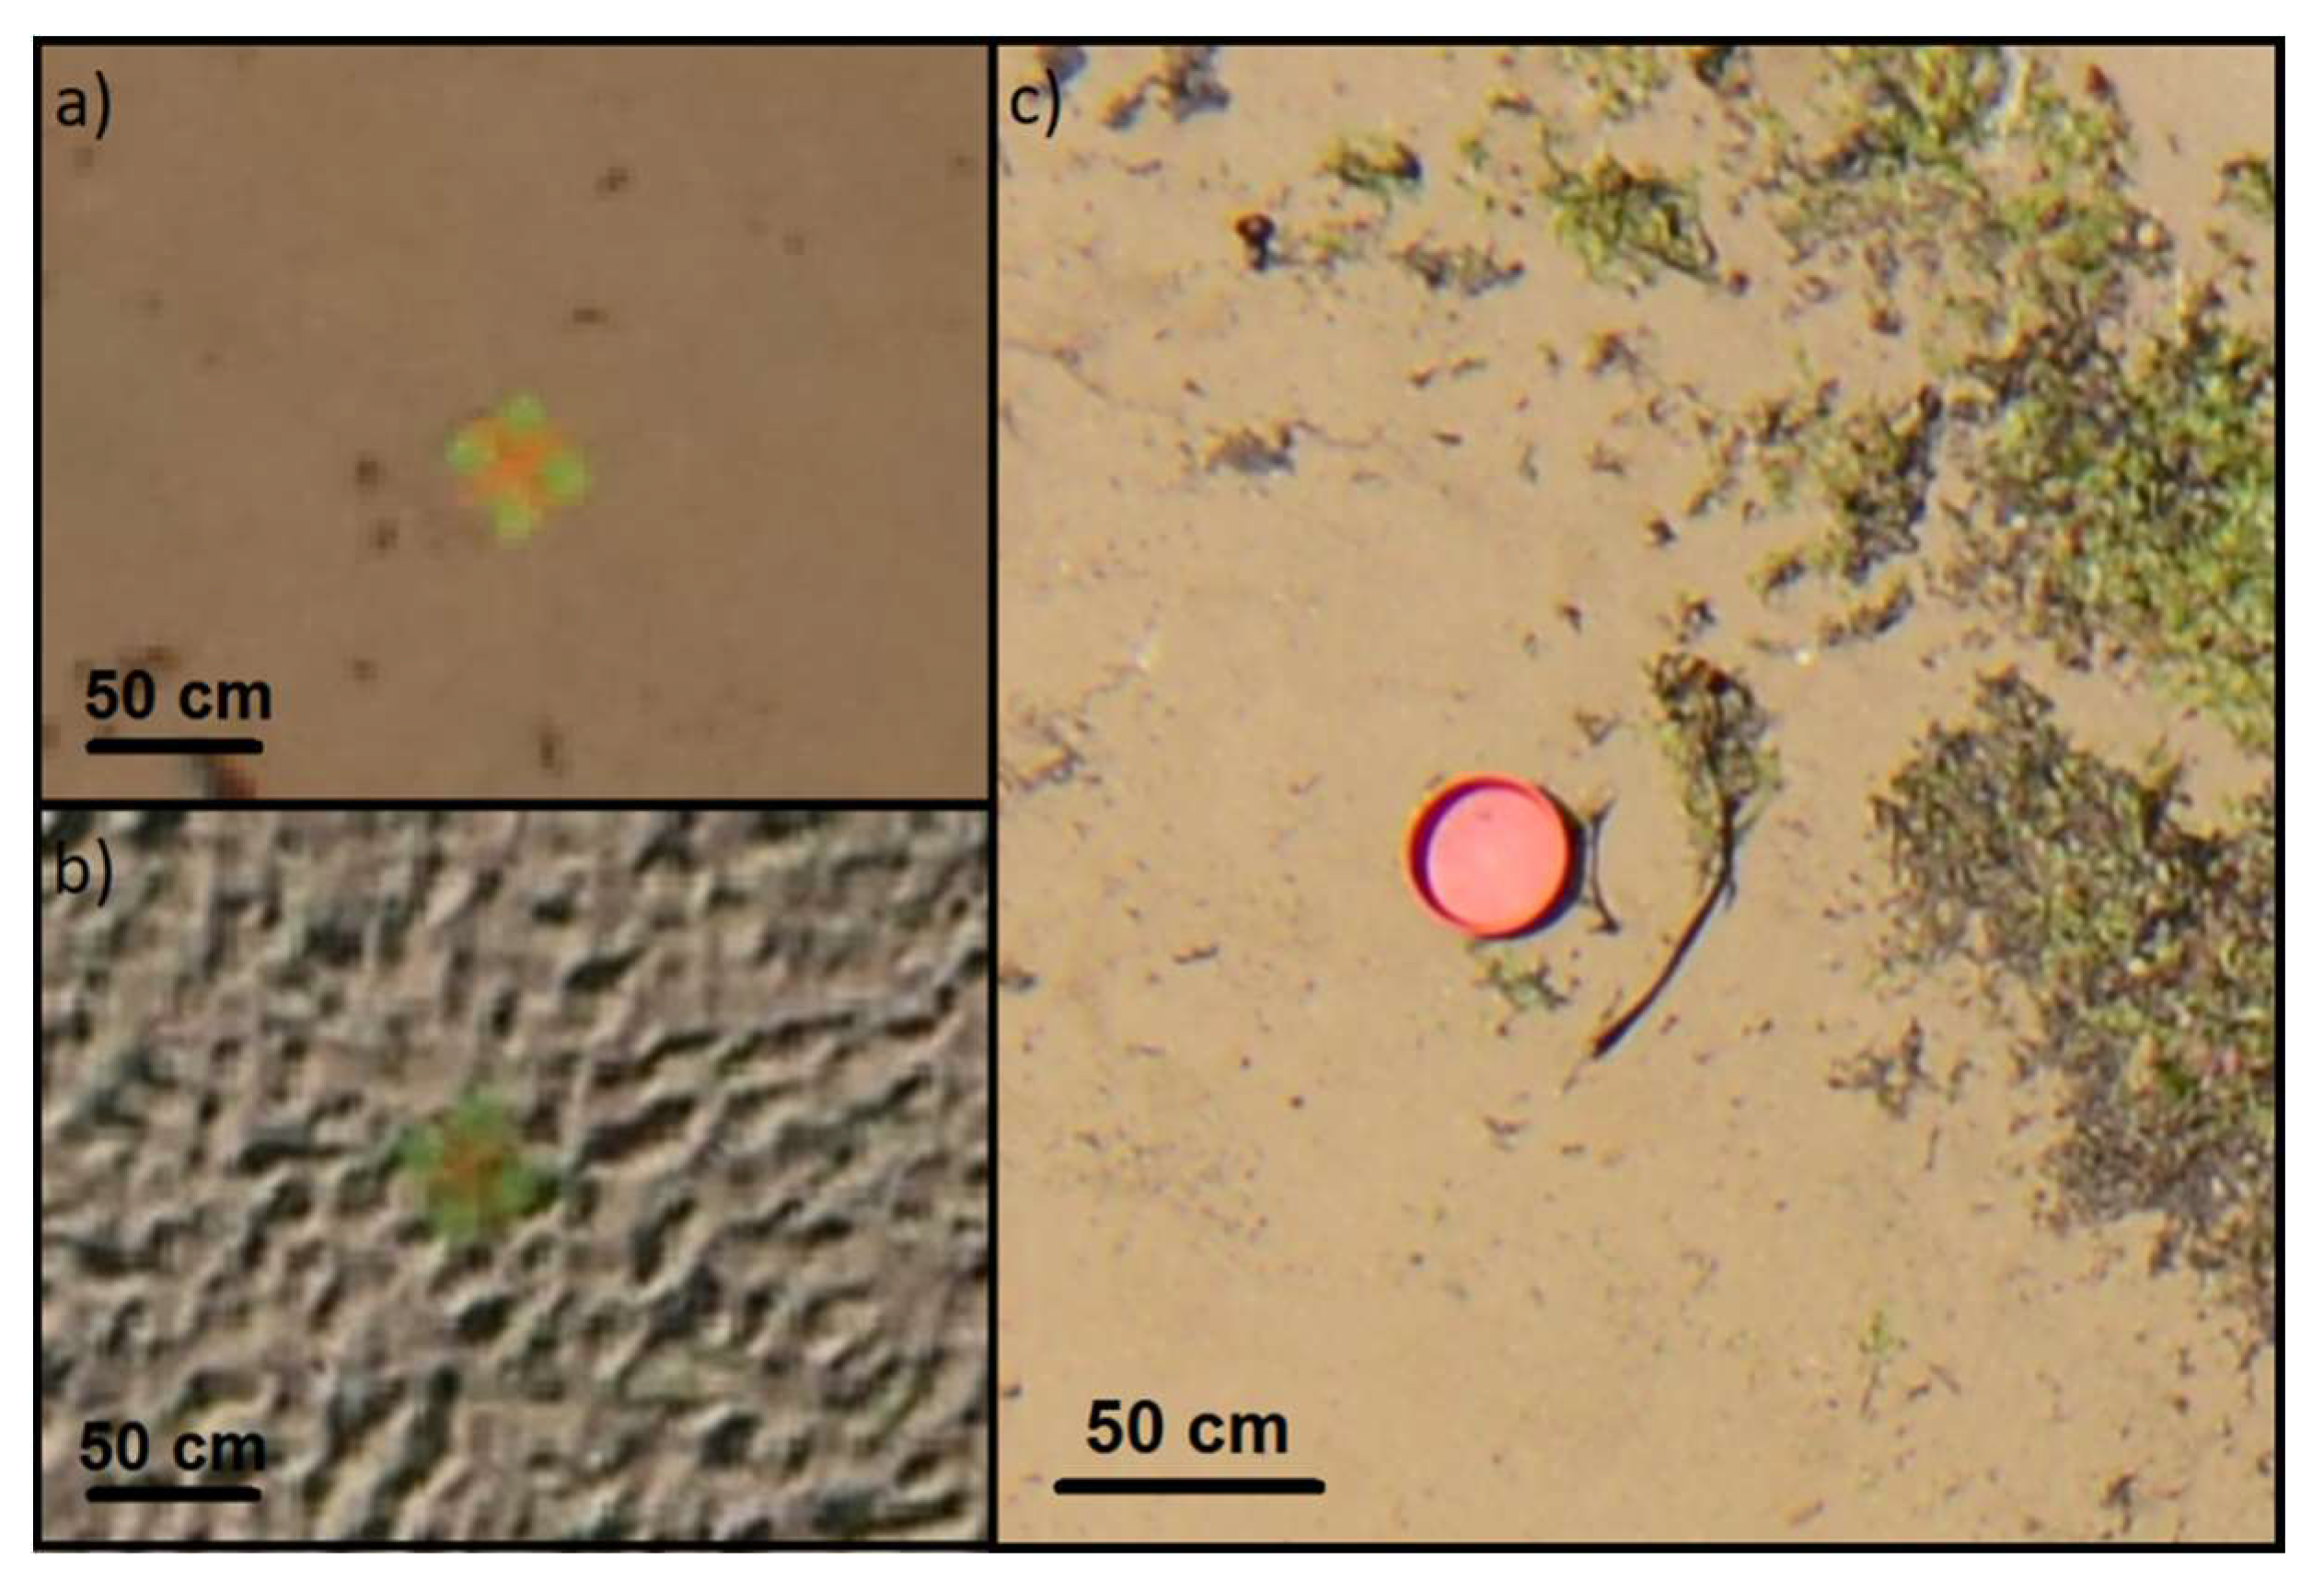
4.1. Data Quality
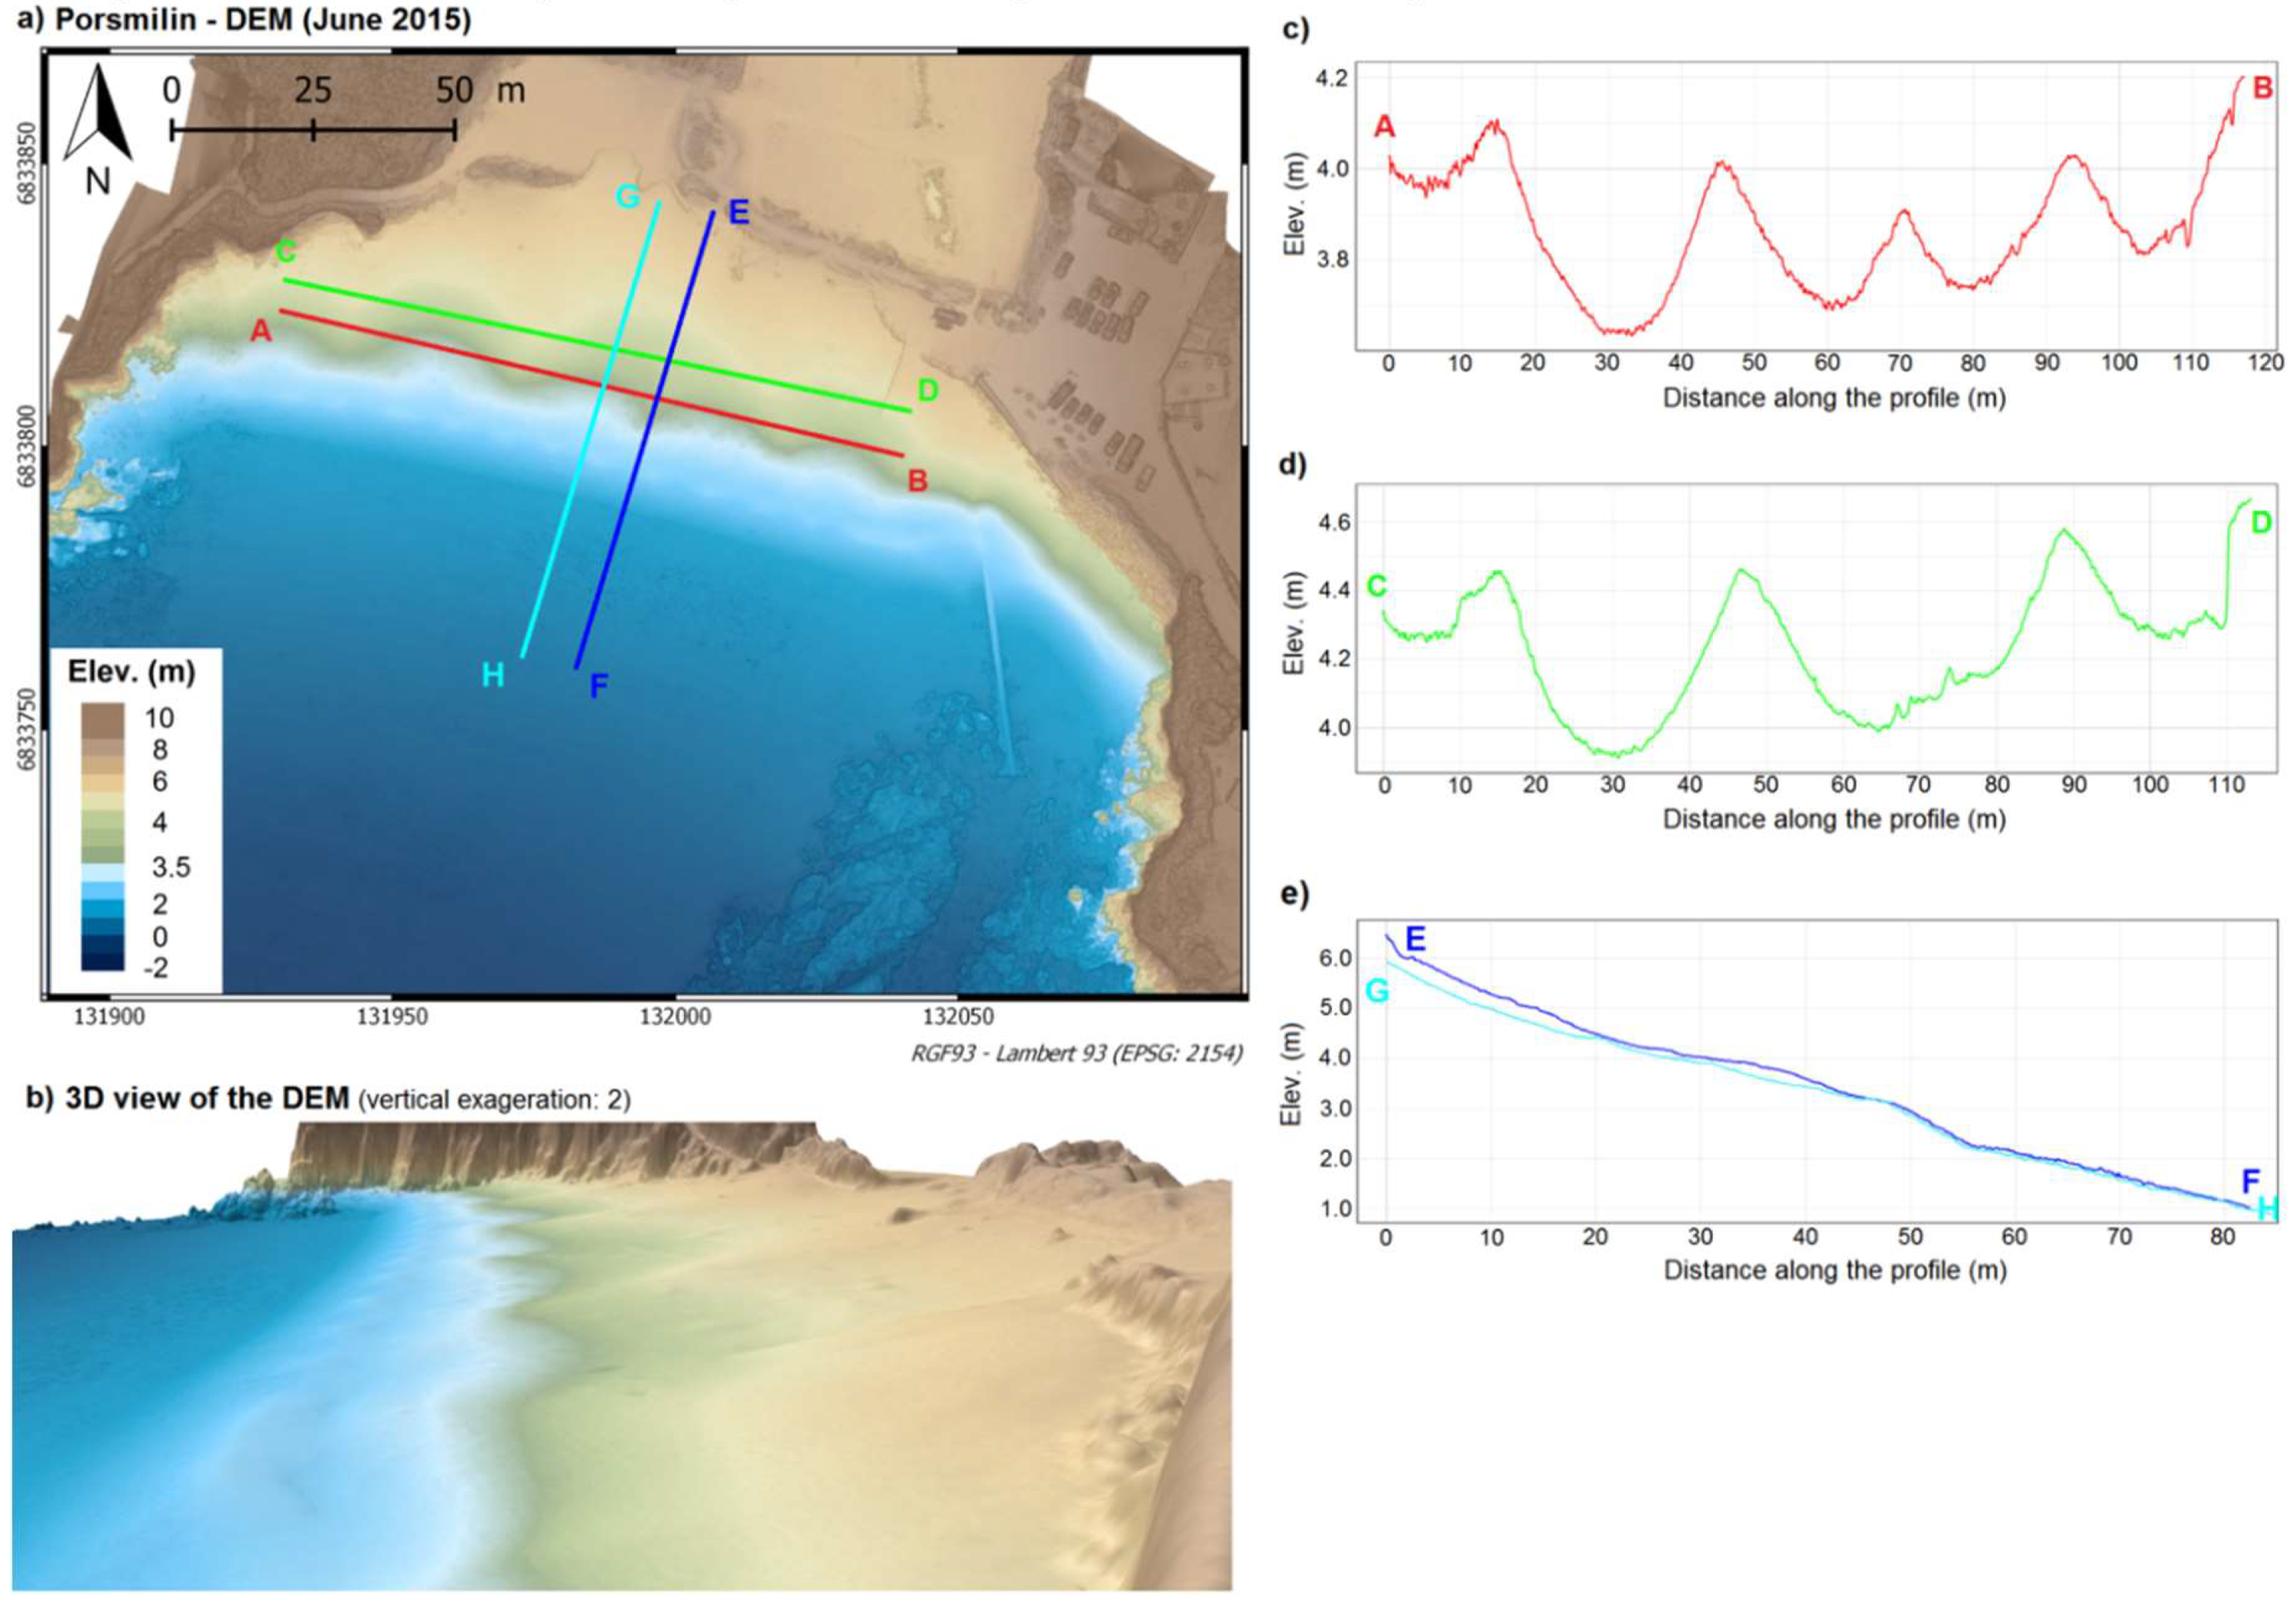
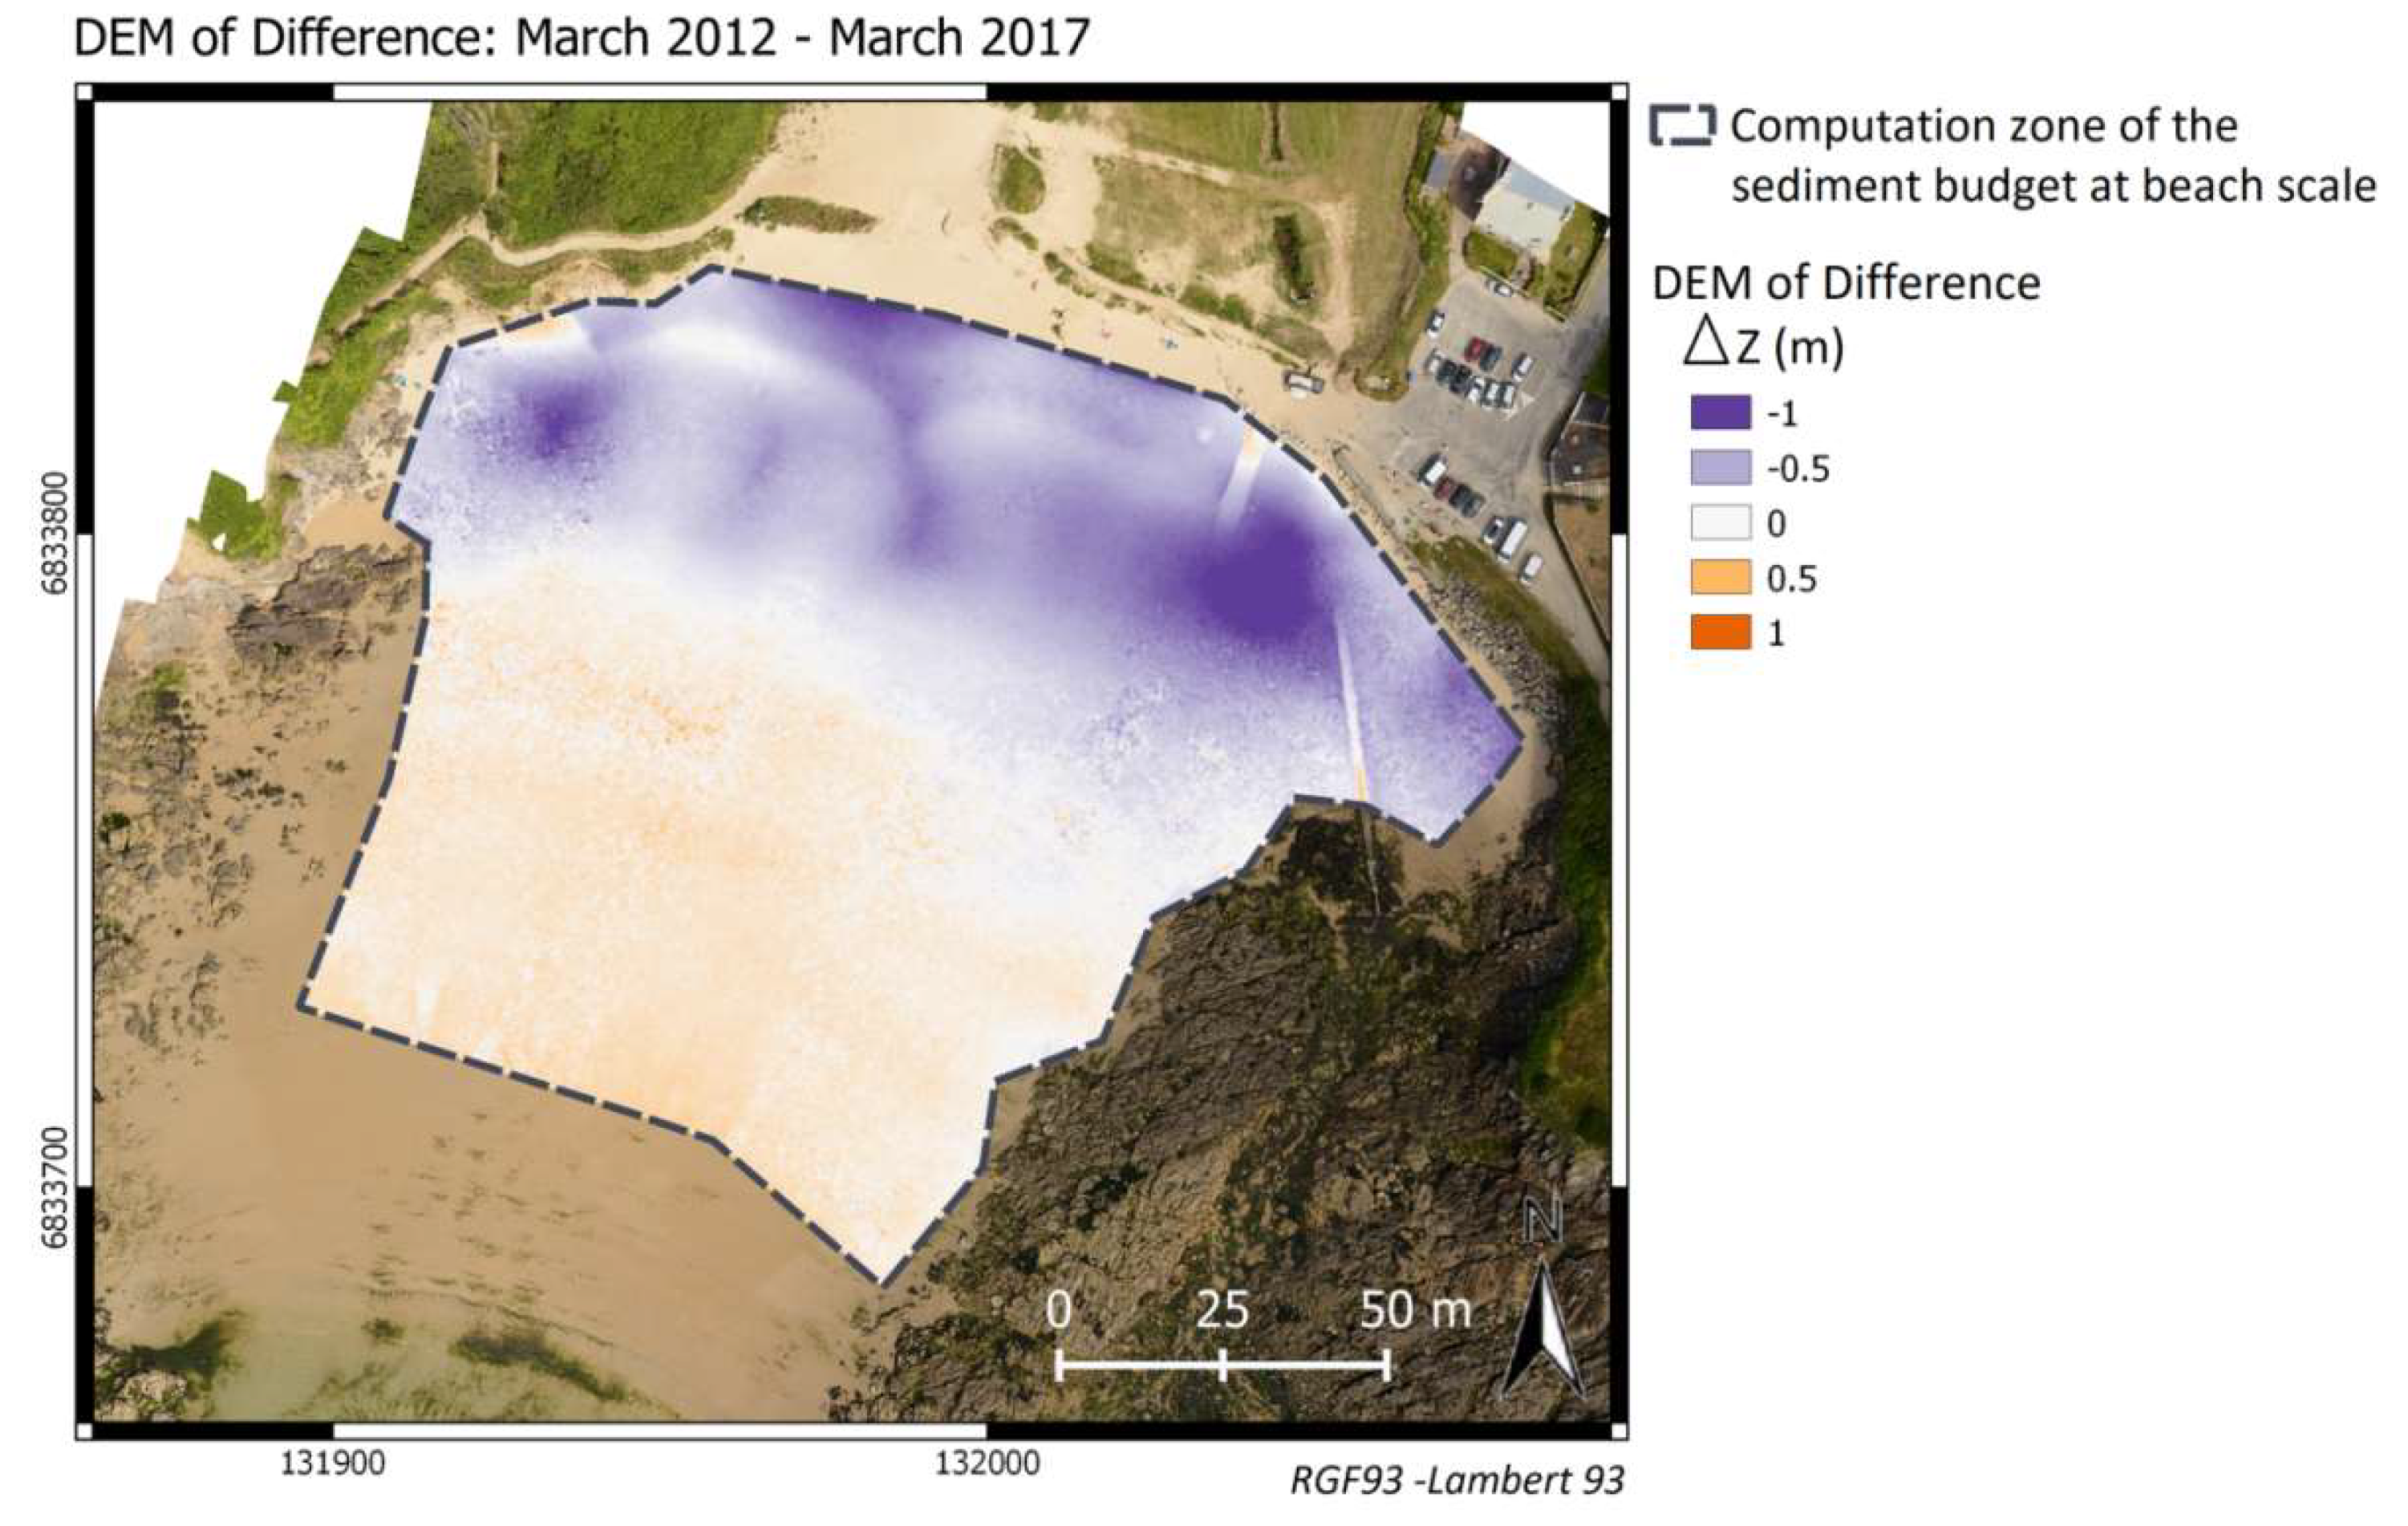
4.2. Benefits of DEM Surveys
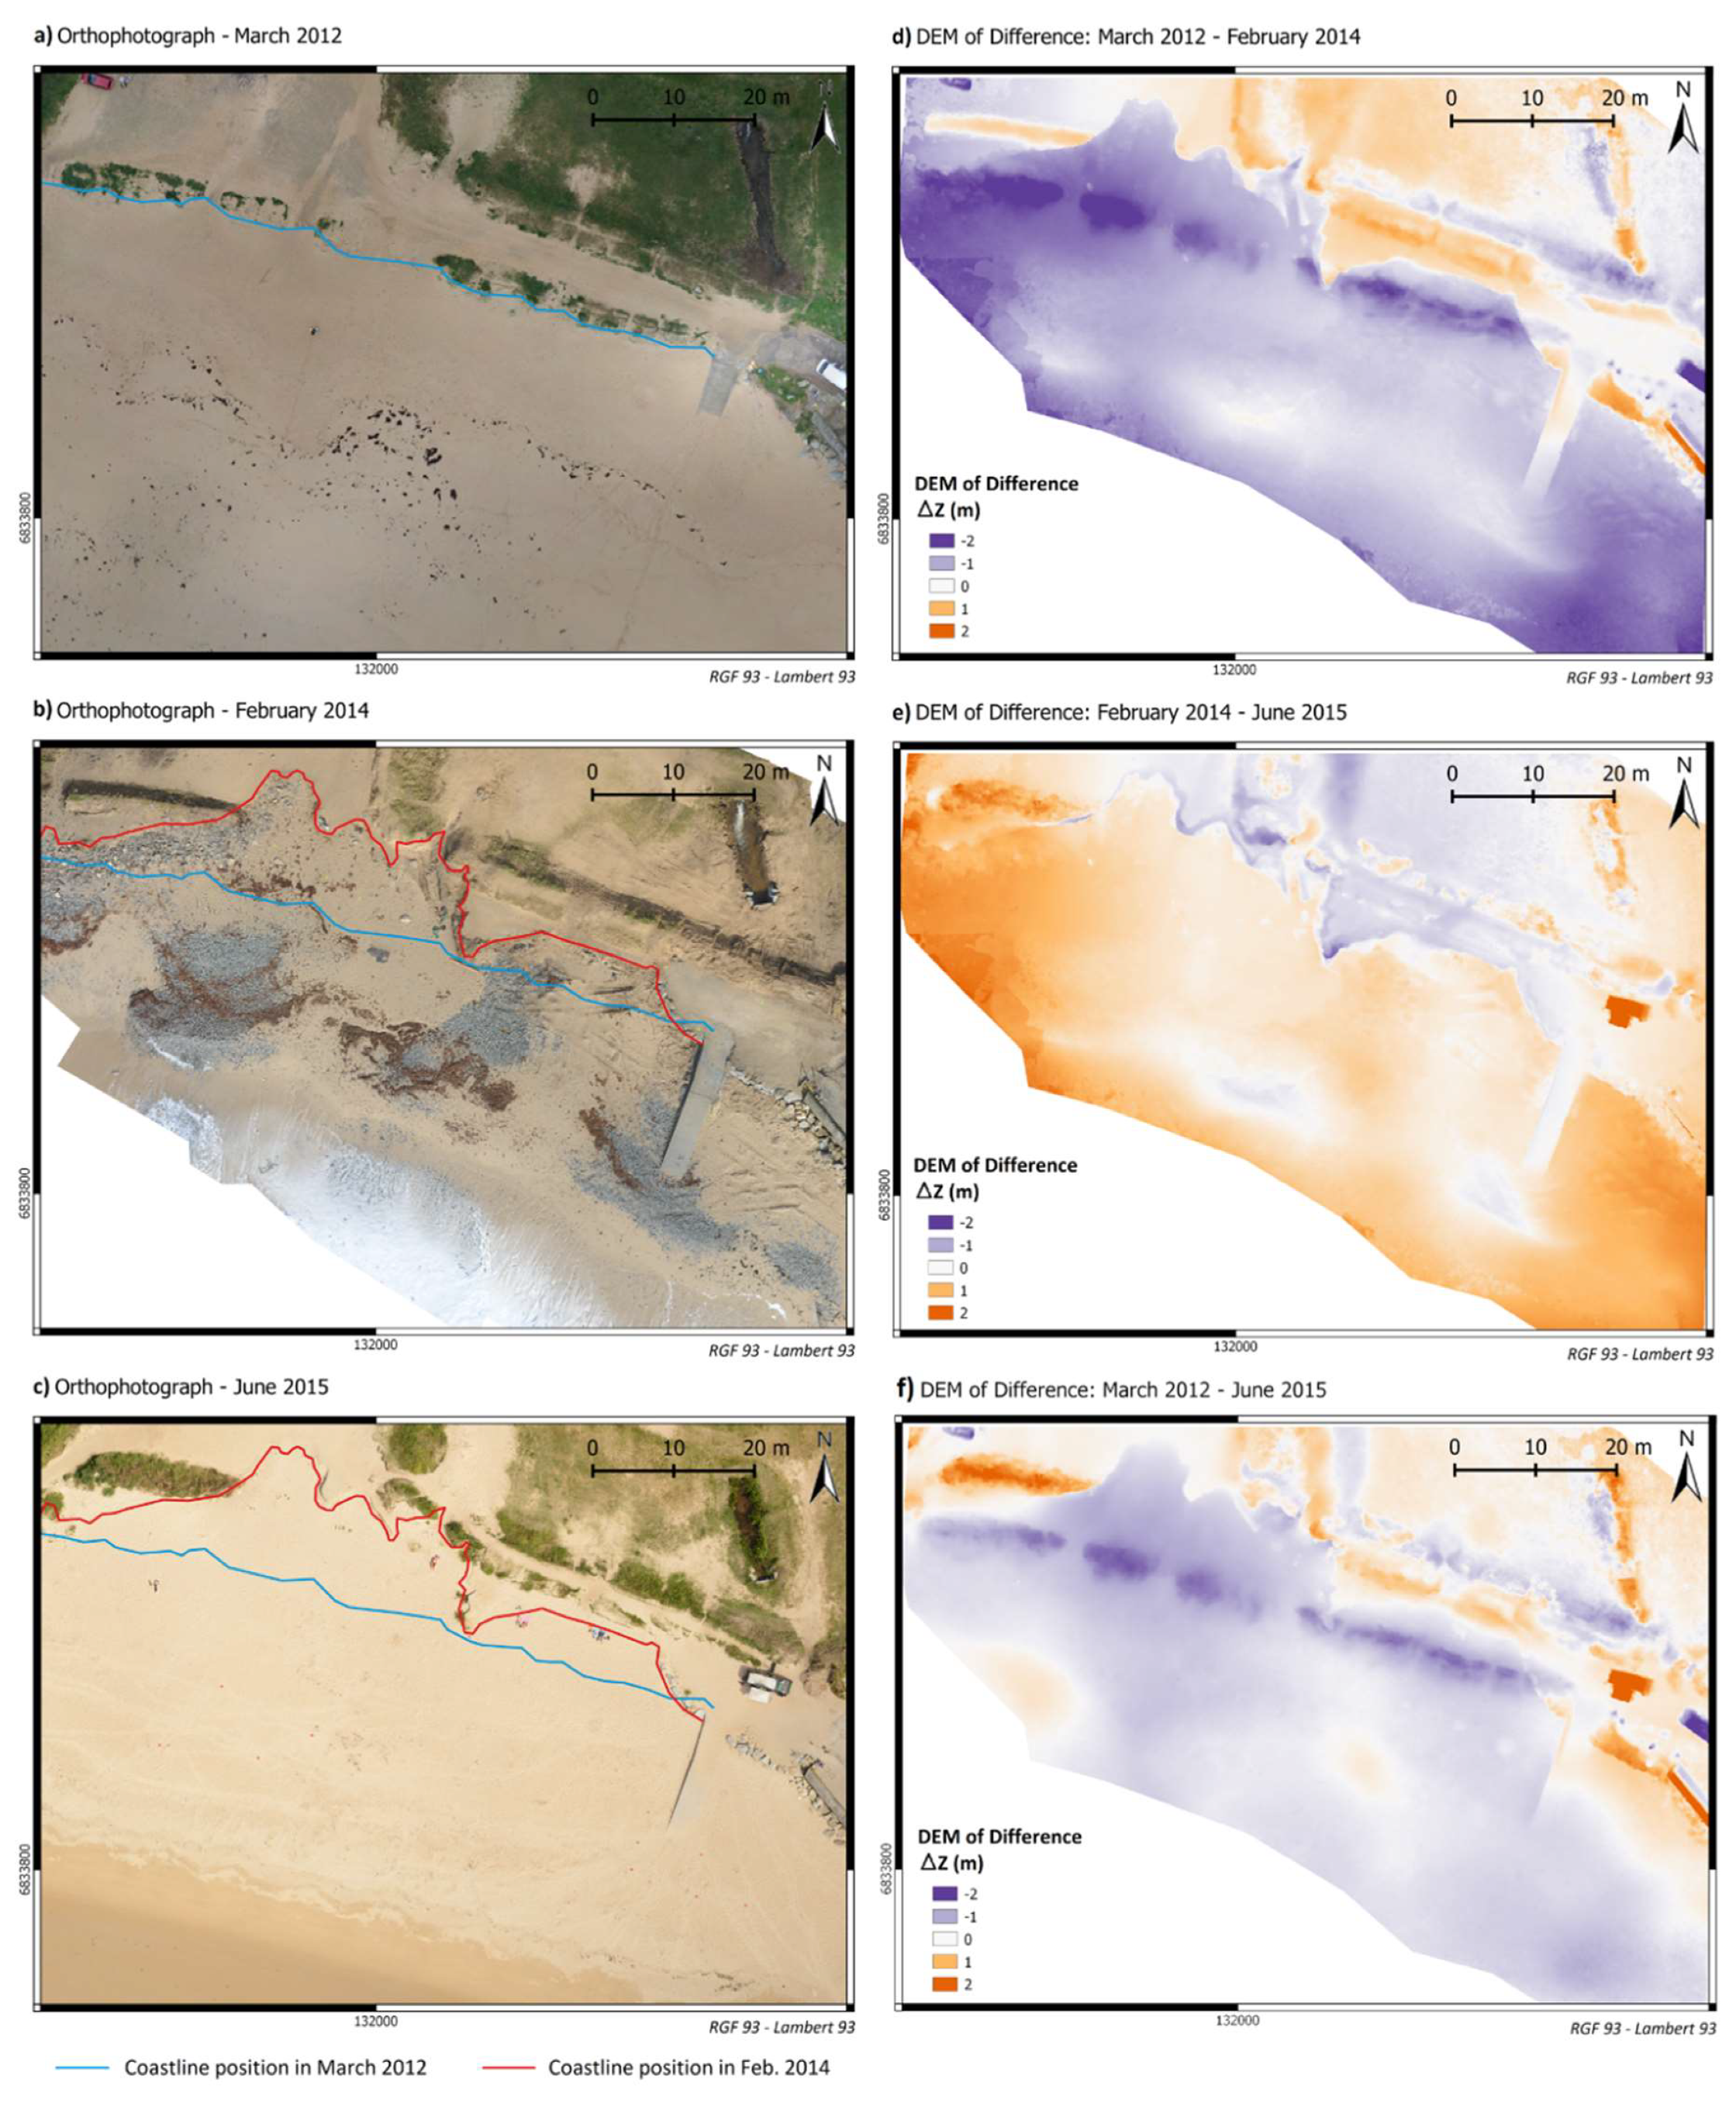
4.3. Study of Beach Resilience Following a Major Storm
5. Conclusions
Author Contributions
Funding
Conflicts of Interest
References
- Baily, B.; Nowell, D. Techniques for monitoring coastal change: A review and case study. Ocean Coast. Manag. 1996, 32, 85–95. [Google Scholar] [CrossRef]
- Klemas, V. Airborne Remote Sensing of Coastal Features and Processes: An Overview. J. Coast. Res. 2013, 287, 239–255. [Google Scholar] [CrossRef]
- Howd, P.A.; Birkemeier, W.A. Beach and Nearshore Survey Data: 1981–1984 CERC Field Research Facility; Technical Report CERC-87-9; US Army Engineer Waterways Experiment Station: Vicksburg, MS, USA, 1987. [Google Scholar]
- Stive, M.J.F.; Aarninkhof, S.G.J.; Hamm, L.; Hanson, H.; Larson, M.; Wijnberg, K.M.; Nicholls, R.J.; Capobianco, M. Variability of shore and shoreline evolution. Coast. Eng. 2002, 47, 211–235. [Google Scholar] [CrossRef]
- Miller, P.; Mills, J.; Edwards, S.; Bryan, P.; Marsh, S.; Mitchell, H.; Hobbs, P. A robust surface matching technique for coastal geohazard assessment and management. ISPRS J. Photogramm. Remote Sens. 2008, 63, 529–542. [Google Scholar] [CrossRef]
- Long, N.; Millescamps, B.; Guillot, B.; Pouget, F.; Bertin, X. Monitoring the Topography of a Dynamic Tidal Inlet Using UAV Imagery. Remote Sens. 2016, 8, 387. [Google Scholar] [CrossRef]
- Letortu, P.; Jaud, M.; Grandjean, P.; Ammann, J.; Costa, S.; Maquaire, O.; Davidson, R.; Le Dantec, N.; Delacourt, C. Examining high-resolution survey methods for monitoring cliff erosion at an operational scale. GISci. Remote Sens. 2017, 1–20. [Google Scholar] [CrossRef]
- Suanez, S.; Garcin, M.; Bulteau, T.; Rouan, M.; Lagadec, L.; David, L. Les observatoires du trait de côte en France métropolitaine et dans les DOM. EchoGéo 2012, 19. [Google Scholar] [CrossRef]
- Nicholls, R.J.; Townend, I.; Bradbury, A.P.; Ramsbottom, D.; Day, S.A. Planning for long-term coastal change: Experiences from England and Wales. Ocean Eng. 2013, 71, 3–16. [Google Scholar] [CrossRef]
- Mahabot, M.-M.; Jaud, M.; Pennober, G.; Le Dantec, N.; Troadec, R.; Suanez, S.; Delacourt, C. Toward a shoreline evolution observatory in tropical environments: The case of back-reef beaches in La Réunion Island. Comptes Rendus Geosci. 2017, 349, 330–340. [Google Scholar] [CrossRef]
- Dehouck, A. Morphodynamique des plages sableuses de la mer d’Iroise (Finistère). Ph.D. Thesis, Université de Bretagne Occidentale, Brest, France, 2006. (In French). [Google Scholar]
- Jaud, M. Techniques d’observation et de mesure haute résolution des transferts sédimentaires dans la frange littorale. Ph.D. Thesis, Université de Bretagne Occidentale, Brest, France, 2011. (In French). [Google Scholar]
- Jaud, M.; Letortu, P.; Augereau, E.; Le Dantec, N.; Beauverger, M.; Cuq, V.; Prunier, C.; Le Bivic, R.; Delacourt, C. Adequacy of pseudo-direct georeferencing of terrestrial laser scanning data for coastal landscape surveying against indirect georeferencing. Eur. J. Remote Sens. 2017, 50, 155–165. [Google Scholar] [CrossRef]
- Floc'h, F.; Le Dantec, N.; Lemos, C.; Cancouët, R.; Sous, D.; Petitjean, L.; Bouchette, F.; Ardhuin, F.; Suanez, S.; Delacourt, C. Morphological Response of a Macrotidal Embayed Beach, Porsmilin, France. In Proceedings of the 14th International Coastal Symposium, Sydney, Australia, 6–11 March 2016; pp. 373–377. [Google Scholar]
- Caulet, C. Les plages sableuses en environnement macro-tidal: De l'influence de la pente sur les processus morphodynamiques. Ph.D. Thesis, Université de Bretagne Occidentale, Brest, France, 2018. (In French). [Google Scholar]
- Delacourt, C.; Allemand, P.; Jaud, M.; Grandjean, P.; Deschamps, A.; Ammann, J.; Cuq, V.; Suanez, S. DRELIO: An unmanned helicopter for imaging coastal area. J. Coast. Res. 2009, 56, 1489–1493. [Google Scholar]
- Jaud, M.; Delacourt, C.; Allemand, P.; Grandjean, P.; Ammann, J.; Cancouët, R.; Deschamps, A.; Varrel, E.; Cuq, V.; Suanez, S. DRELIO: Un drone hélicoptère pour le suivi des zones littorales. In Proceedings of the XIèmes Journées Nationales Génie Côtier—Génie Civil (JNGCGC), Les Sables d’Olonne, France, 22–25 June 2010; pp. 485–496. [Google Scholar]
- Dehouck, A.; Dupuis, H.; Sénéchal, N. Pocket beach hydrodynamics: The example of four macrotidal beaches, Brittany, France. Mar. Geol. 2009, 266, 1–17. [Google Scholar] [CrossRef]
- Asseline, J.; De Noni, G.; Chaume, R. Note sur la conception et l’utilisation d’un drone lent pour la télédétection rapprochée. Photo-Interprétation Images Aériennes et spatiales 1999, 37, 3–13. (In French) [Google Scholar]
- Jaud, M.; Grassot, F.; Le Dantec, N.; Verney, R.; Delacourt, C.; Ammann, J.; Deloffre, J.; Grandjean, P. Potential of UAVs for Monitoring Mudflats Morphodynamics (Application to the Seine estuary, France). Int. J. Geo-Inf. 2016, 5, 50. [Google Scholar] [CrossRef]
- Lowe, D. Object recognition from local scale-invariant features. Proc. Int. Conf. Comput. Vis. 1999, 2, 1150–1157. [Google Scholar]
- Eltner, A.; Kaiser, A.; Castillo, C.; Rock, G.; Neugirg, F.; Abellán, A. Image-Based Surface Reconstruction in Geomorphometry Merits—Limits and Developments. Earth Surf. Dyn. 2016, 4, 359–389. [Google Scholar] [CrossRef]
- Tonkin, T.N.; Midgley, N.G. Ground-Control Networks for Image Based Surface Reconstruction: An Investigation of Optimum Survey Designs Using UAV Derived Imagery and Structure-from-Motion Photogrammetry. Remote Sens. 2016, 8, 786. [Google Scholar] [CrossRef]
- Jaud, M.; Passot, S.; Allemand, P.; Le Dantec, N.; Grandjean, P.; Delacourt, C. Suggestions to Limit Geometric Distortions in the Reconstruction of Linear Coastal Landforms by SfM Photogrammetry with PhotoScan® and MicMac® for UAV Surveys with Restricted GCPs Pattern. Drones 2019, 3, 2. [Google Scholar] [CrossRef]
- Javernick, L.; Brasington, J.; Caruso, B. Modeling the topography of shallow braided rivers using structure-from-motion photogrammetry. Geomorphology 2014, 213, 166–182. [Google Scholar] [CrossRef]
- Masselink, G.; Castelle, B.; Scott, T.; Dodet, G.; Suanez, S.; Jackson, D.; Floc'h, F. Extreme wave activity during 2013/2014 winter and morphological impacts along the Atlantic coast of Europe. Geophys. Res. Lett. 2016, 43, 2135–2143. [Google Scholar] [CrossRef]
- Scott, T.; Masselink, G.; O’Hare, T.; Saulter, A.; Poate, T.; Russell, P.; Davidson, M.; Conley, D. The extreme 2013/2014 winter storms: Beach recovery along the southwest coast of England. Mar. Geol. 2016, 382, 224–241. [Google Scholar] [CrossRef]
- Garrote, J.; Díaz-Álvarez, A.; Nganhane, H.; Garzón Heydt, G. The Severe 2013–14 Winter Storms in the Historical Evolution of Cantabrian (Northern Spain) Beach-Dune Systems. Geosciences 2018, 8, 459. [Google Scholar] [CrossRef]
- Blaise, E.; Suanez, S.; Stéphan, P.; Fichaut, B.; David, L.; Cuq, V.; Autret, R.; Houron, J.; Rouan, M.; Floc’h, F.; et al. Bilan des tempêtes de l’hiver 2013–2014 sur la dynamique de recul du trait de côte en Bretagne. Géomorphologie Relief Processus Environ. 2015, 21, 267–292. (In French) [Google Scholar] [CrossRef]
- De Sanjosé Blasco, J.; Gómez-Lende, M.; Sánchez-Fernández, M.; Serrano-Cañadas, E. Monitoring Retreat of Coastal Sandy Systems Using Geomatics Techniques: Somo Beach (Cantabrian Coast, Spain, 1875–2017). Remote Sen. 2018, 10, 1500. [Google Scholar] [CrossRef]
- Suanez, S.; Cariolet, J.M.; Cancouët, R.; Ardhuin, F.; Delacourt, C. Dune recovery after storm erosion on a high-energy beach: Vougot Beach, Brittany (France). Geomorphology 2012, 139–140, 16–33. [Google Scholar] [CrossRef]
- Turner, I.L.; Aarninkhof, S.G.J.; Dronkers, T.D.T.; McGrath, J. CZM Applications of Argus Coastal Imaging at the Gold Coast, Australia. J. Coast. Res. 2004, 20, 739–752. [Google Scholar] [CrossRef]


| Drone | Operating Period | Characteristics | Camera | Range of Mean Accuracy | ||
|---|---|---|---|---|---|---|
| Weight | Payload | Autonomy | ||||
| Pixy | 2006–2008 | 7 kg | 4 kg | ~1 h | Fuji S2 Pro, 50 mm, 6 Mpix | 10–20 cm |
| DRELIO 5 | 2007–2010 | 11 kg | 5 kg | 45 min | Nikon D200, 35 mm, 10 Mpix | 5–20 cm |
| DRELIO 6 | 2010 | 9.5 kg | 5 kg | 45 min | Nikon D200, 35 mm, 10 Mpix | 5–20 cm |
| DRELIO 7 | 2012 | 15 kg | 8 kg | 50 min | Nikon D700, 35 mm, 12 Mpix | 5–10 cm |
| DRELIO 8 | 2013–2014 | <4 kg | 1.5 kg | 15 min | Nikon D700, 35 mm, 12 Mpix | 1–5 cm |
| DRELIO 10 | 2015–2019 | <4 kg | 1.5 kg | 15 min | Nikon D800, 35 mm, 36 Mpix | 1–2 cm |
| Phantom Pro | 2018–2019 | 1.4 kg | 0.3 kg | 25 min | FC6310, 8.8 mm, 20 Mpix | 1–3 cm |
| DEMs of Differences (DoDs) | Sediment Budget (m3) | Normalized Mean Volume Change (m3/m2) |
|---|---|---|
| March 2012–Feb 2014 | 3005 m3 (± 536 m3) | −0.56 m3/m2 |
| Feb 2014–June 2015 | 2002 m3 (± 536 m3) | +0.37 m3/m2 |
© 2019 by the authors. Licensee MDPI, Basel, Switzerland. This article is an open access article distributed under the terms and conditions of the Creative Commons Attribution (CC BY) license (http://creativecommons.org/licenses/by/4.0/).
Share and Cite
Jaud, M.; Delacourt, C.; Le Dantec, N.; Allemand, P.; Ammann, J.; Grandjean, P.; Nouaille, H.; Prunier, C.; Cuq, V.; Augereau, E.; et al. Diachronic UAV Photogrammetry of a Sandy Beach in Brittany (France) for a Long-Term Coastal Observatory. ISPRS Int. J. Geo-Inf. 2019, 8, 267. https://doi.org/10.3390/ijgi8060267
Jaud M, Delacourt C, Le Dantec N, Allemand P, Ammann J, Grandjean P, Nouaille H, Prunier C, Cuq V, Augereau E, et al. Diachronic UAV Photogrammetry of a Sandy Beach in Brittany (France) for a Long-Term Coastal Observatory. ISPRS International Journal of Geo-Information. 2019; 8(6):267. https://doi.org/10.3390/ijgi8060267
Chicago/Turabian StyleJaud, Marion, Christophe Delacourt, Nicolas Le Dantec, Pascal Allemand, Jérôme Ammann, Philippe Grandjean, Henri Nouaille, Christophe Prunier, Véronique Cuq, Emmanuel Augereau, and et al. 2019. "Diachronic UAV Photogrammetry of a Sandy Beach in Brittany (France) for a Long-Term Coastal Observatory" ISPRS International Journal of Geo-Information 8, no. 6: 267. https://doi.org/10.3390/ijgi8060267
APA StyleJaud, M., Delacourt, C., Le Dantec, N., Allemand, P., Ammann, J., Grandjean, P., Nouaille, H., Prunier, C., Cuq, V., Augereau, E., Cocquempot, L., & Floc’h, F. (2019). Diachronic UAV Photogrammetry of a Sandy Beach in Brittany (France) for a Long-Term Coastal Observatory. ISPRS International Journal of Geo-Information, 8(6), 267. https://doi.org/10.3390/ijgi8060267