Article

Combination of Aerial, Satellite, and UAV Photogrammetry for Mapping the Diachronic Coastline Evolution: The Case of Lefkada Island

by
Konstantinos Nikolakopoulos
*,
Aggeliki Kyriou
,
Ioannis Koukouvelas
,
Vasiliki Zygouri
and
Dionysios Apostolopoulos
Department of Geology, University of Patras, 265 04 Patras, Greece
*
Author to whom correspondence should be addressed.
ISPRS Int. J. Geo-Inf. 2019, 8(11), 489; https://doi.org/10.3390/ijgi8110489
Submission received: 23 August 2019 / Revised: 24 September 2019 / Accepted: 4 October 2019 / Published: 30 October 2019
(This article belongs to the Special Issue Applications of Photogrammetry for Environmental Research)

Abstract

:
Coastline evolution is a proxy of coastal erosion, defined as the wasting of land along the shoreline due to a combination of natural and/or human causes. For countries with a sea border, where a significant proportion of the population lives in coastal areas, shoreline retreat has become a very serious global problem. Remote sensing data and photogrammetry have been used in coastal erosion mapping for many decades. In the current study, multi-date analogue aerial photos, digital aerial photos, and declassified satellite imagery provided by the U.S. Geological Survey (USGS), Pleiades satellite data, and unmanned aerial vehicle images were combined for accurate mapping of the southwestern Lefkada (Ionian Sea, Greece) coastline over the last 73 years. Different photogrammetric techniques were used for the orthorectifation of the remote sensing data, and geographical information systems were used in order to calculate the rates of shoreline change. The results indicated that the southwest shoreline of Lefkada Island is under dynamic equilibrium. This equilibrium is strongly controlled by geological parameters, such as subsidence of the studied shoreline during co-seismic deformation and mass wasting. The maximum accretion rate was calculated at 0.55 m per year, while the respective erosion rate reached −1.53 m per year.

1. Introduction

Coastal areas are defined as those where an interface or a transition between land and sea exists. These areas constitute important and sensitive environments with significant complexity, which are, however, difficult to define due to their diversity in form and dynamics as well as to their spatial boundaries [1,2].
Although coastal areas account for 2% of the planet’s surface, they contain almost 10% of the Earth’s population [3]. Coastal erosion is the wasting of land along the shoreline due to diverse natural or human causes, such as wave action, wave and tidal currents, high winds, earthquakes, landslides, dam construction, drainage, and other human-induced causes of erosion. Coastal urbanization pressure, rising sea levels, and the increasing frequency of storms and cyclones are also maximizing coastal erosion and putting people’s lives and properties at risk. Bird (1996) estimated that 70% of sandy shorelines are eroding [4]. However, this research had no robust estimation of shoreline change rates because of the lack of constant and long-term monitoring. Thus, recent studies suggest a lower rate of constant erosion for the world’s sandy beaches, in the order of 24% [5].
The usefulness of remote sensing imagery has been practically proven in coastal erosion detection and mapping for many decades. Over the years, remote sensing imagery has been transforming as a result of the evolution of aerial platforms from airplanes and satellites to unmanned aerial vehicles (UAVs). The first attempts to map the coastal zone with aerial photography can be traced back to the 1920s, just after the termination of the First World War, during which the method of photogrammetry was first developed. From the outset, the advantages of aerial photos become obvious: they are easily interpreted, they cover large areas, and they offer the possibility to view and map in 3D and to perform very accurate photogrammetric measurements. In one characteristic example, diachronic aerial images, covering a period of forty years, were photogrammetrically processed for monitoring the shoreline evolution at the southern New Jersey coast [6]. Additionally, aerial photographs were used to examine the role of the presence of Posidonia oceanica on shoreline morphology changes in Sardinia, Italy and Corsica, France [7,8].
The next big step was the launch of the first satellites during the early 1970s. The launch of the Landsat series, despite its low spatial resolution, opened new horizons for coastal area mapping due to the existence of multispectral bands, the repeatability of the scenes captured, and the large area coverage. Landsat Thematic Mapper and Enhanced Thematic Mapper images from different years, covering a period of 25 years, were processed in order to map the shoreline changes in Egypt [9]. Landsat imagery covering a 30-year period has been used for the continuous inspection of coastline changes in western Florida [10]. Similar datasets have been interpreted for detecting changes of the shoreline in India [11], China [12], and Namibia [13]. Furthermore, Landsat data, along with Google Earth images and aerial photographs, were processed in order to perform a diachronic survey of the evolution of the coastline in Lower Casamance and southern Gambia, Africa [14]. The development of very high resolution (VHR) satellite sensors (i.e., Ikonos and Quickbird) around 2000 rebooted the use of remote sensing data in coastal monitoring. The new sensors present special characteristics, such as four to eight multispectral bands, programmability in image acquisition globally, high repeatability (between 24 to 72 h), and storage of the data in digital format. An automatic procedure for shoreline extraction from Ikonos images using a mean shift segmentation algorithm was proposed by Reference [15]. More recently, Sekovski et al. [16] processed a WorldView-2 multispectal image to portray the coastline by combining supervised and unsupervised image classification methods. In the last five years, the explosion of the commercial UAV market has opened new avenues in coastal monitoring, as described in Reference [17]. UAVs present some obvious advantages for coastal surveying. These advantages include the best spatial resolution among all the other remote sensing surveys, a lower cost compared to all other ground or remote sensing surveys, potential to transmit the acquired photos to the remote controller, the ability to repeat acquisition in case something goes wrong, and very low security risks as the drones are unmanned.
As mentioned in the previous paragraph, different types of remote sensing data have been used in coastal environment applications. High resolution satellite data and air photos were used to monitor the coastline’s changes or to measure volume changes in coastal areas [18,19,20,21], sea surface temperatures [22,23], sea ice coverage [24,25], and coastal change processes [26,27]. A review paper summarizing the remote processing methods performed in shoreline delineation has been presented [28]. Recently, the use of UAVs for coastal monitoring was investigated in many studies [29,30,31,32,33,34,35,36,37]. In one of these studies, UAV digital photogrammetry was applied in order to develop point clouds and 3D models of the coastal cliffs in East Sussex, monthly for a one-year period, in order to map their recession [38]. UAV images and structure from motion (SfM) photogrammetry was also tested at Dongshan Island, China to map coastal changes [39].
In order to map the diachronic evolution of a coastline, there is a need to use multitemporal and multisensor data with diverse spatial resolution. In such a study, air photos and the Landsat and Spot data series covering a period of 45 years were combined in order to map the shoreline evolution in Mexico [40]. Diverse multidisciplinary survey techniques, such as terrestrial laser scanning, terrestrial photogrammetry, and structure from motion photogrammetry using UAV data, have been tried in order to evaluate their potential in cliff erosion monitoring [41]. Aerial photos and very high-resolution satellite data, such as that from Ikonos, Quickbird, Worldview-2, and Pleiades, covering a 14-year period, have been used for estimating/defining coastal erosion in southern Thailand [42]. Topographic maps, Google Earth images, and Landsat Thematic Mapper data were combined to map shoreline changes along the mangrove ecosystem of East Indonesia [43]. A study combining aerial photographs from three different dates (1960, 1973, and 1988) and Quickbird imagery from 2014 focused on the changes in coastline location in the Bay of Jijel (eastern Algeria) [44]. Aerial photographs and a variety of VHR satellite images (Quickbird, Worldview-1, and Worldview-2) were analyzed to map the shoreline changes from 1943 to 2012 in Papua New Guinea [45]. Historical maps, analogue aerial photos, and airborne Light Detection and Ranging (LiDAR) data were compared in order to evaluate the shoreline change for the period 1881 to 2015 [46]. Historical aerial photos and VHR satellite data were processed for shoreline mapping on the Marshal Islands [47,48]. In the context of air photos and satellite images in combination with a geographical information system (GIS), a Digital Shoreline Analysis System (DSAS) and field surveys were utilized for the assessment of coastal erosion and the kinematics of the coastline in order to understand how natural and anthropogenic factors affect the diachronic coastline evolution [49].
In this study, we use a 73-year inventory period motivated by the strong accretion and erosion rates in the southwestern coastal area of Lefkada (Figure 1). In Figure 1, the scale remains at the same position at different dates, indicating the decrease or increase of the beach width. From 1945 to 1972, the erosion rate was quite small; between 1972 and 2008, the erosion increased; and from 2008 to 2016, the phenomenon is reversed and a high accretion rate is observed. Multi-date analogue aerial photos, digital aerial photos, declassified satellite imagery provided by United States Geological Survey (USGS), Pleiades satellite data, and UAV images were combined for the accurate mapping of the western Lefkada coastline during the last 73 years. This is the first time that such a range of data is being analyzed and compared simultaneously. As far as we know, studies on Pleiades triplet data focused mainly on the vertical accuracy of the derived digital surface model and the horizontal accuracy of the produced orthomosaics [50,51,52,53,54]. Only in one case study [42] were Pleiades data combined with other VHR satellite images in order to map shoreline changes. In the current paper, Pleiades triplet data are processed and compared to air photos and UAV data. Another novel characteristic of the current study is the photogrammetric processing of declassified satellite imagery for coastline evolution. Although more than 24 years have passed since the liberalization of these datasets, there are no studies describing their photogrammetric processing. Furthermore, aerial, satellite, UAV photogrammetry, and geographical information systems are handled together for the remote sensing data processing and the shoreline erosion mapping. In addition to the different remote sensing data used in this paper, the geologic environment is equally fascinating as most of the accumulated sediments in the coast come from active landslides. Thus, the specific work tries to correlate the coastline evolution with the earthquakes through time.
The remainder of the current manuscript is divided into five sections: In the next section, the geological and geomorphological status of Lefkada Island is described. Section 3 presents the materials used and the performed methods. In Section 4 the results are stated, and Section 5 discusses and interprets the results. The final section presents the conclusions.

2. Study Area

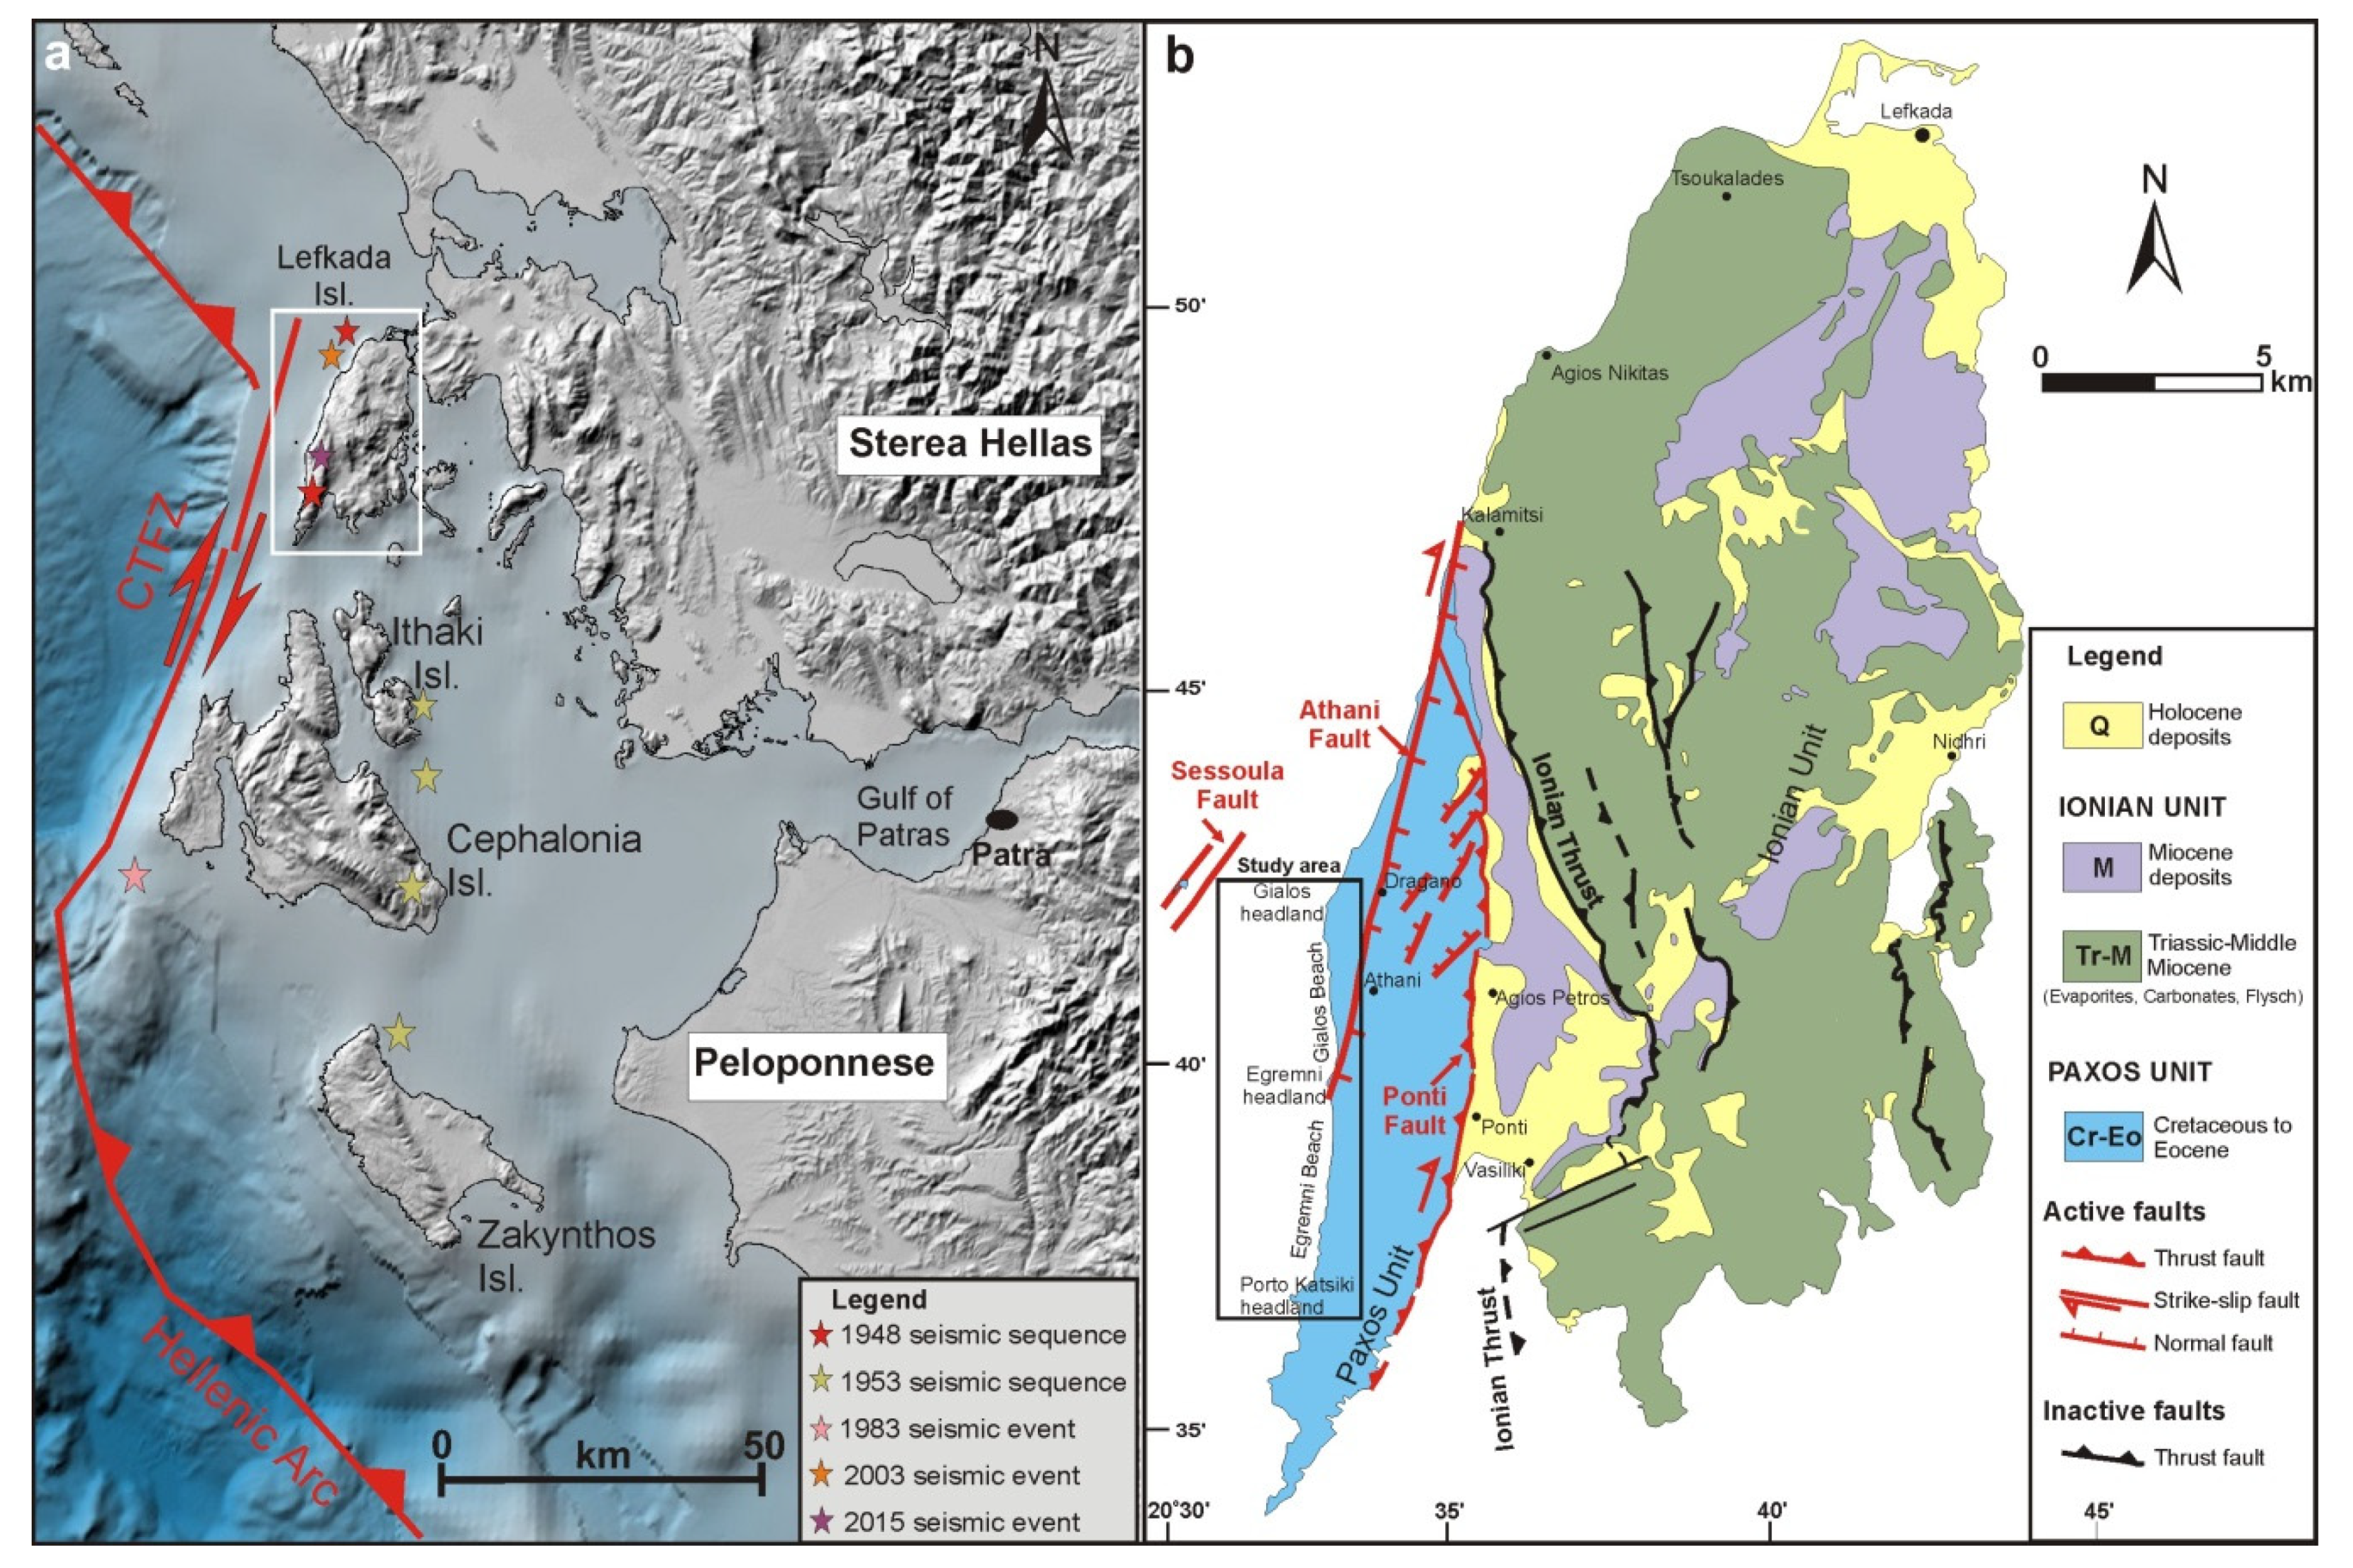
The northwestern-most Hellenic arc, where the Ionian Sea islands are located, is regarded as a site of complex continent–continent to continent–ocean convergent plate margins [55]. The collision zone in the north is separated from the continent–ocean convergence margin in the south by the Cephalonia Transform Fault zone (CTFZ). The CTFZ (Figure 2a) is a major dextral strike-slip structure [56], considered as a highly active seismotectonic structure hosting most of the earthquakes in Cephalonia and Lefkada Islands (Figure 2a and Table 1). The fault is separated in a southern segment that strikes SW–NE offshore to the west of Cephalonia Island. The northern segment of the CTFZ strikes SSW–NNE offshore to the west of Lefkada Island. The total length of the CFTZ is about 60 km [57]. Most known large earthquakes in the study area (Table 1) are the cluster of events during the 1953 Ionian earthquakes that seriously damaged the Cephalonia, Zakynthos, Ithaki, and Lefkada Islands [58,59]. Several large earthquakes have also damaged Lefkada Island in the historical period as well as in the instrumental era of seismicity [58]. Many historical earthquakes have also been documented with the largest of them occurring from 1577 up to 1869 AD at magnitudes ranging from 5.9 to 6.5 [60]. The 2003 Mw6.3 [61] and the 2015 Mw6.4 strong earthquakes [62] are regarded as key earthquakes for understanding the seismotectonics of the northern segment of the CTFZ. Most of these earthquakes are large enough and located close enough to Lefkada to trigger significant landslides in the study area [63,64,65]. Seismicity in the area shows temporal gaps of between 12 and 30 years (Table 1).
In addition to the CTFZ, the so-called Athani Fault is mapped onshore in the study area controlling the western Lefkada coast [66,67]. The Athani Fault is defined for almost 20 km, crossing lengthwise the west coast of Lefkada Island (Figure 2b). The Athani Fault represents a dextral strike slip fault that juxtaposes Paxos unit limestone against Pleistocene to Holocene deposits. In addition to the Athani Fault, other smaller faults, being almost parallel with the CTFZ and Athani Faults with similar kinematics, define steep slopes hosting landslides during earthquake activity [65]. The November 2015 earthquake of Lefkada, 12 years after the 6.3 earthquake of 2003, affected Lefkada’s coastal cliffs. The landslides and the coastal area, on which this work focuses, are at obvious structural proximity with two major faults in the area, namely, the Athani Fault and CTFZ. Thus, the western part of Lefkada Island is an ideal study site characterized by high and frequent rates of seismicity (Table 1) and crossed by active faults.

3. Materials and Methods

3.1. Materials

In the current study, different datasets of airborne, satellite, and UAV platforms were combined and processed using diverse photogrammetric techniques. Acquisition dates, number of data, spatial resolution, and other characteristics of the datasets are presented in Table 2.
The first historical dataset is an orthophoto mosaic of 1945 created for the needs of the Greek Cadastre. The specific digital orthomosaic was created with photogrammetric methods from analogue aerial photographs acquired in 1945. Having a pixel size of 1 m, it covers the whole Greek territory. The specific dataset was developed by the National Greek Cadastre and Mapping Agency. We did not perform any further process on it.
The second dataset includes 3 sets of declassified satellite imagery obtained in the late 1960s–1970s by American military missions and declassified for the first time after 1995. The specific declassified photographs were acquired by U.S. military satellites and give globally important information of the planet surface [70]. This imagery was, for many years, classified as top secret, and it was delivered for free use in 1995. The specific archive contains more than 990,000 photographs. The photos were acquired between 1959 and 1980. The images present a variety of scales and quality. Very often, the scenes are cloudy. The pixel size of the photos varies and ranges between 6 and 30 feet (2–9 m). The film is scanned at 7 microns, and the final total size of an image can surpass 1.3 GB [71]. The first image of the specific dataset was collected during the CORONA KH-4B mission in May 1972 (Table 2). The specific satellite collected the photographs with a telescopic camera, and the film returned to the earth via recovery capsules. While the first Corona missions carried a single panoramic camera or a single frame camera, the next satellites (KH-4, KH-4A, and KH-4B) had double panoramic cameras on board, each looking at 15 degrees forward or backward from the satellite orbit. The pixel size of the image was around 6 feet, but according to previous studies, the KH-4B missions provided the best spatial resolution (1.83 m at nadir [72,73]. The second and the third images of the specific dataset were collected during the CORONA KH-9 program missions. The KH-9 program was active for 7 years (1973 to 1980). The specific mission collected images according to a predefined grid in order to eliminate the image distortion. The images were acquired with overlap for stereoscopic analysis. The KH-9 system produced 9 × 18 inch photos with a pixel size of 20 feet. During the 7-year mission, KH-0 collected almost 29,000 images in 12 accomplished space journeys. The second image of the declassified satellite imagery dataset was acquired in June 1974 during the mission 1208-5. The third image was acquired in October 1980 during the mission 1216-5. The spatial resolution of both images is better than 20 feet, and they were both scanned at 7 microns.
The third dataset comprises 8 analogue aerial photographs from 1992, at 1/15,000 scale accessed through the Hellenic Military Geographical Service (HMGS). With 60% along the track overlap, these photos developed 7 stereopairs and were selected as they combine the best spatial resolution and are cloud free.
The fourth dataset comprises eight analogue aerial photographs from 2000, at the same scale (1/15,000), and from the same source (HMGS).
During the period 2007–2009, digital air photos covering the whole of Greece were acquired by the National Greek Cadastre and Mapping Agency. After photogrammetric processing, an orthomosaic with a pixel size of 50 cm and a digital surface model with a spatial resolution of 5 m were produced. Both covered the whole country, and they are used as basemaps in many studies as they present the highest horizontal and vertical accuracies. The orthophoto and the Digital Surface Model of National Greek Cadastre and Mapping Agency covering Lefkada Island belong to the fifth dataset used in this study.
The sixth dataset consists of 2 scenes of Pleiades satellite imagery. The Pleiades system comprises two satellites in the same orbit but with 180° offset. The first satellite was launched in 2011, while the second satellite was launched 1 year later. Each satellite simultaneously collects 1 panchromatic and 4 multispectral bands. The panchromatic band has a pixel of 0.7 m, while the 4 multispectral bands have a pixel size of 2.8 m [74]. Lefkada Island is covered by two scenes (triplets). The first scene was acquired on 26 September 2016, and the second was acquired on 13 October 2016. Each scene (triplet) was composed of 3 images (tri-stereo), and both scenes were totally free of clouds.
A total of 462 UAV photographs comprise the seventh and final dataset. These were acquired by the University of Patras team during field work in November 2018. A photogrammetric flight was performed in the Egremni beach area. The flight’s altitude was 60 m above ground level (agl). The along-the-track overlap of the photos was 90%, while the respective across-the-track overlap was 75%. Table 3 presents all the flight details.

3.2. Methods

The 7 datasets noted in the previous paragraph were processed using different photogrammetric and computer vision techniques discussed below. We used two software packages, ERDAS IMAGINE Leica photogrammetry Suite (LPS) and Agisoft Photoscan Professional, for the processing of the various remote sensing data. The Greek Cadastre orthophoto and Digital Surface Model (DSM) of 2008 were used as a basemap and reference for all the other datasets. According to the Greek Cadastre specifications, the orthomosaics have a horizontal (planimetric) accuracy of 0.71 m while the vertical accuracy of the respective DSM is better than 2 m.

3.2.1. Analogue Air Photo Data Processing

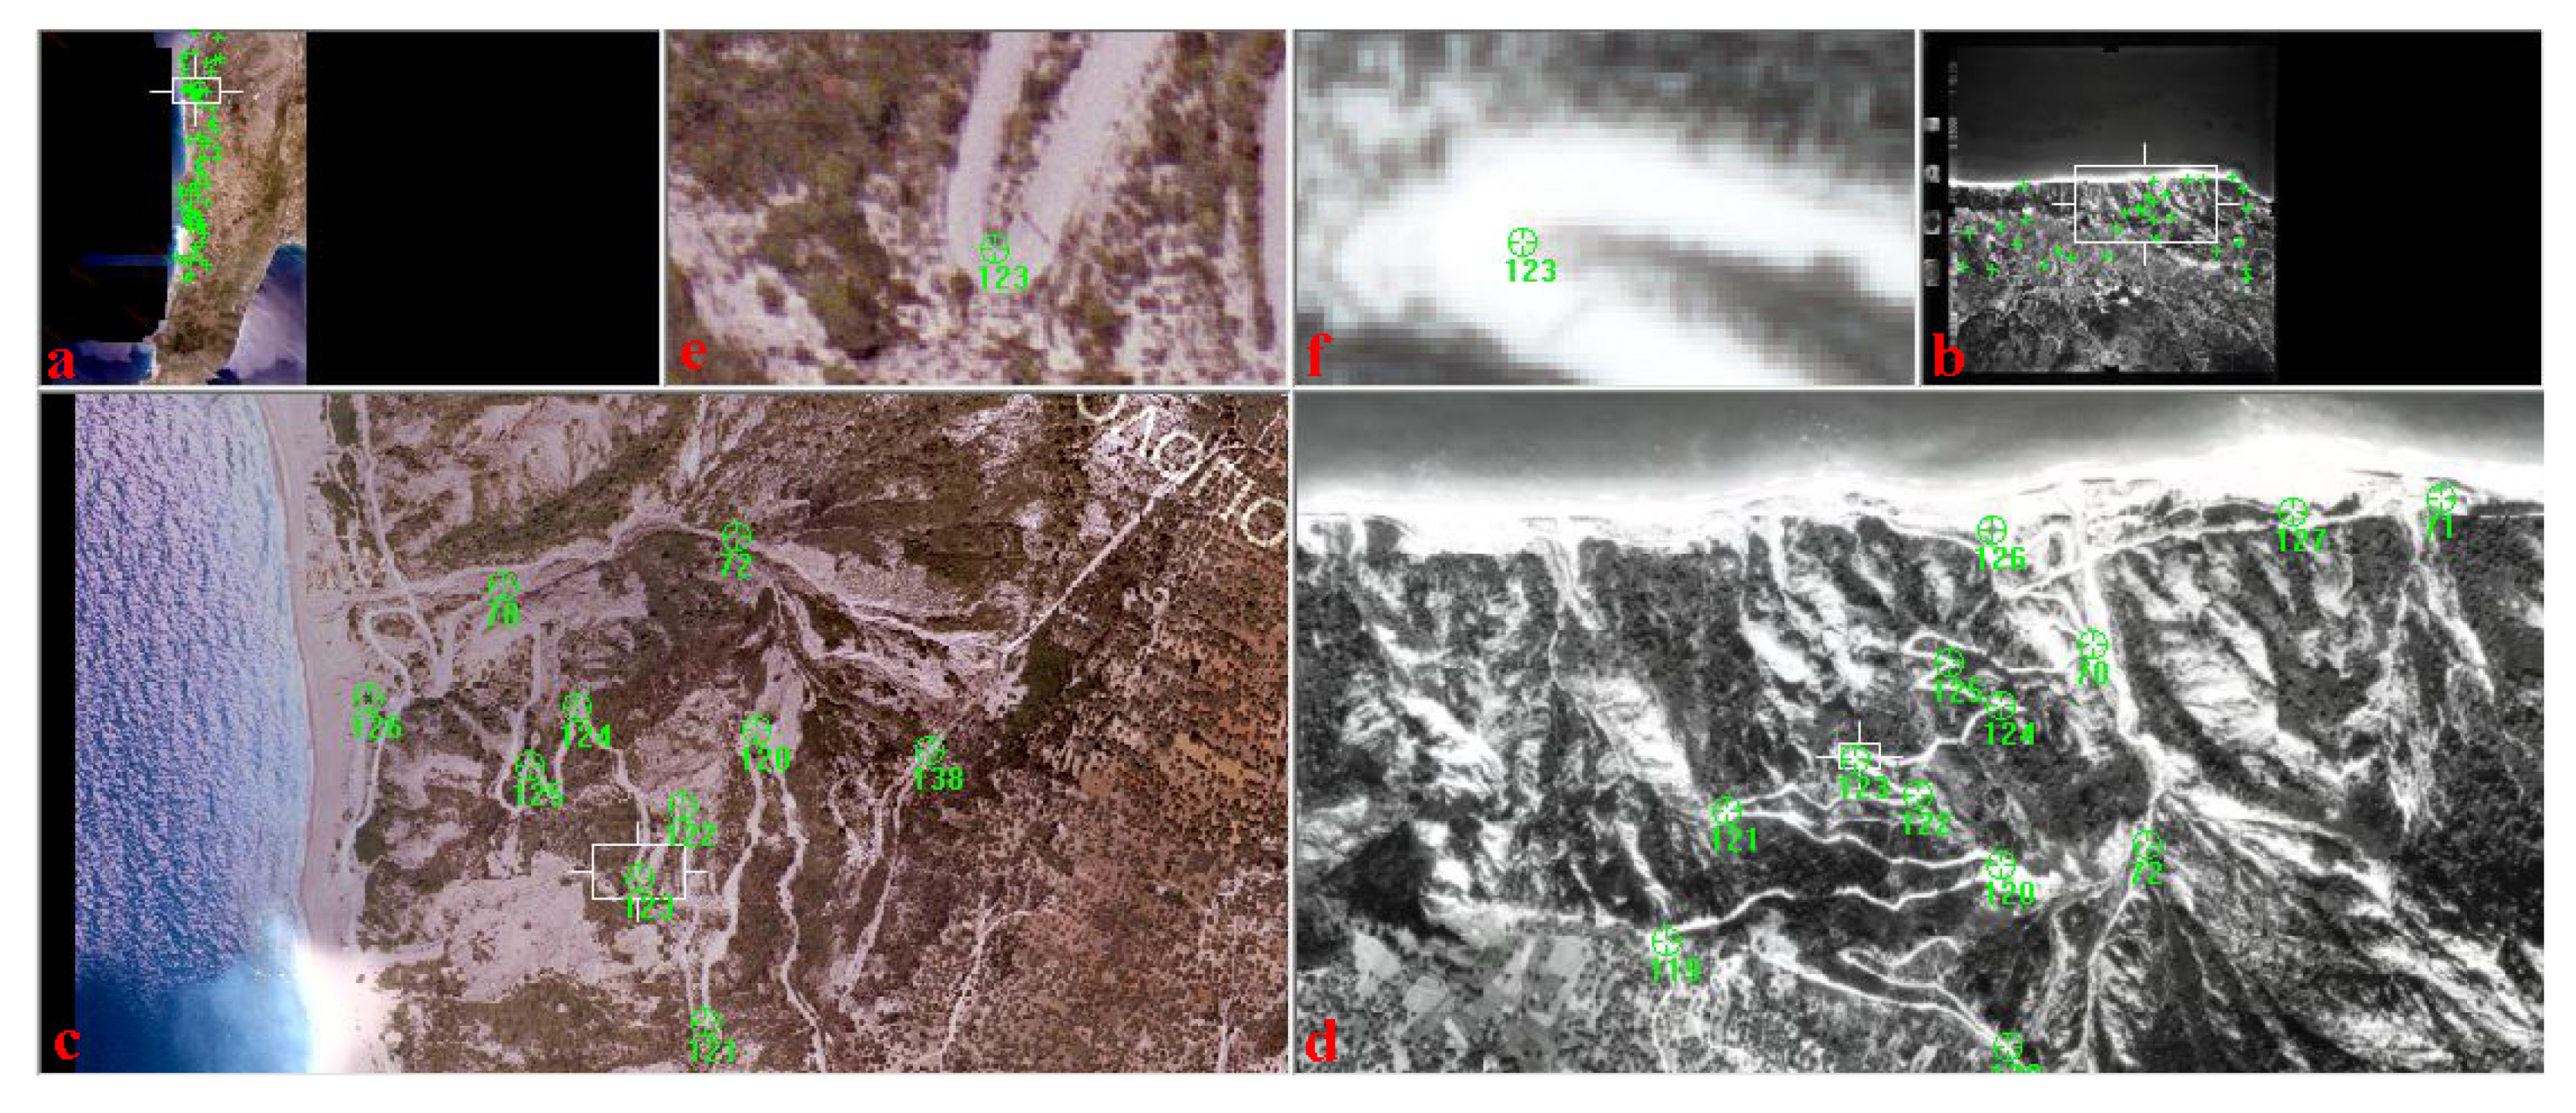
In LPS (2014 release), a block was created and the analogue air photos were imported into it (Figure 3). The internal triangulation of the air photos was calculated using the fiducial points on each photo. Furthermore, there is a need for external Ground Control Points (GCPs) to orthorectify the imagery (Figure 3). There are many possible error sources in an air photo block, such as lens distortion, film distortion, and atmospheric refraction [75]. Each of these may possibly decrease the accuracy of aerial triangulation results and the accuracy of the final orthomosaic. The major parameters which increase or decrease the accuracy of the triangulation and the accuracy of the final orthomosaic are the following: the position of the air photos (block geometry), the allocation, the quantity and the accuracy of the points that are used (control or tie points), and the existence of any other random error. The whole procedure is described in detail in a previous study [75] and cannot be repeated in the current paper. As the block geometry and the existence of random errors are predefined, the main duty of the user is to select with high precision the GCPs and the tie points.
In the first LPS block of analogue air photos of 2000, we used 71 GCPs, while in the second LPS block of 1992 air photos, we used 54 GCPs. The coordinates of GCPs were obtained from the Greek Cadastre orthomosaic, while the respective altitude was obtained from the respective DSM. The GCPs had a very good distribution around the broader area with an emphasis given on the area across western Lefkada beach (Figure 3). Then, LPS was used to calculate the root mean square error (RMSE) values for the entire block, as seen in Table 4. The RMSEs calculated for the two blocks are assumed acceptable in order to proceed to the orthorectification of the photos and the creation of the final orthomosaics, one for the May 1992 air photos and one for the September 2000 air photos.

3.2.2. Declassified Satellite Imagery Processing

The 3 declassified satellite scenes were processed in 3 different blocks in LPS, one for each date. In a previous study [76], LPS was used for the analyses of CORONA KH-4 imagery. That study demonstrated the huge contribution of these data process for archaeological studies in the Near East. Stereo models, digital elevation models (DEMs), and orthomosaics have been successfully produced utilizing a simplified frame-model in LPS for orthorectification of the CORONA KH-4 images. The GCPs used in that study [76] were selected from freely available datasets. LPS was also used for the orthorectification of CORONA KH-4 data in another study [77]. Ikonos Geo product imagery and Shuttle Radar Topography Mission DEMs were used for the orthorectification of the declassified image. CORONA imagery has been processed in ERDAS IMAGINE OrthoBASE Pro in order to produce a DEM [78]. Sohn et al. [73], among others, used the same software to assess the quality of CORONA imagery derived, and Reference [79] proposed a methodology for CORONA image processing based on ERDAS IMAGINE toolboxes. CORONA KH-9 imagery was processed with satisfactory results in the past [71,80].
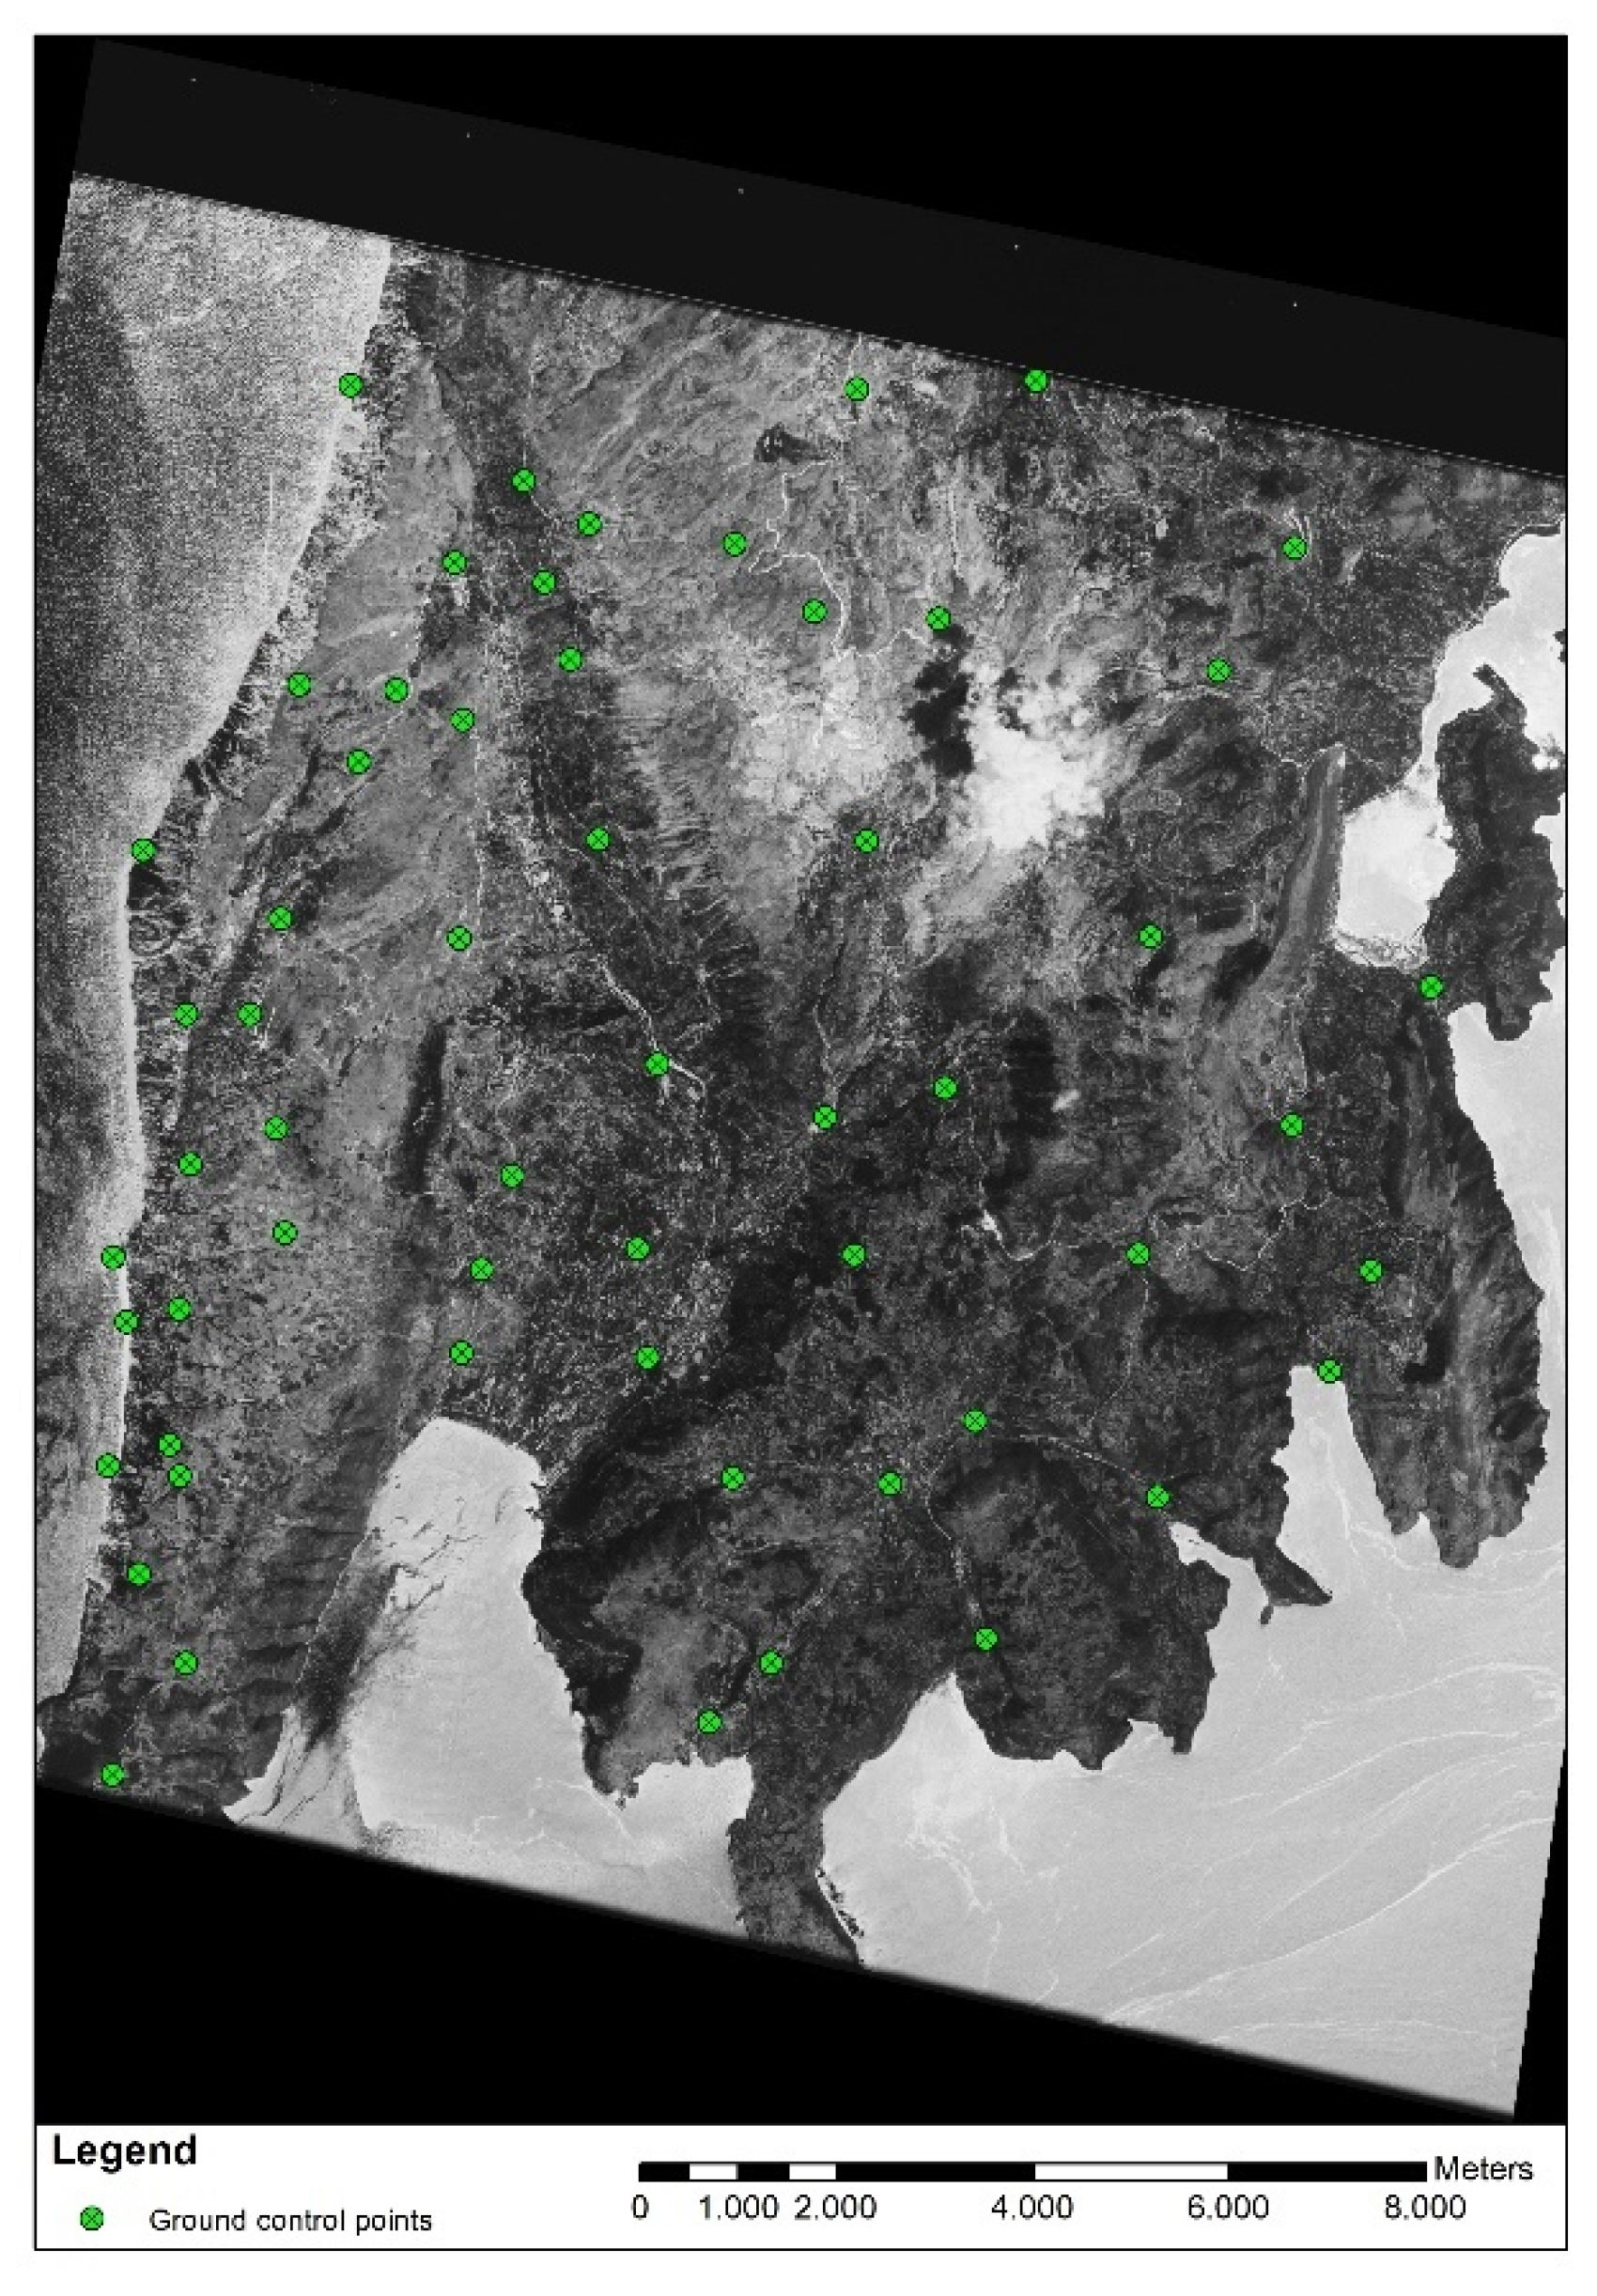
In the current study, the 3 declassified scenes were orthorectified using LPS (2014 release). Around 50 points were selected from the Greek Cadastre orthophoto to serve as the GCPs for each declassified scene. Particularly for the 1972 imagery, 58 ground control points allocated all over the scene were used (Figure 4). The declassified imagery of 1972 was orthorectified with a pixel size of 2 m, while the respective images of 1974 and 1980 were orthorectified with a pixel size of 4 m.

3.2.3. Pleiades Data Processing

Pleiades tri-stereo images were processed using also LPS. The exact procedure for Pleiades triplets processing is described in Reference [54]. Initially, all 6 panchromatic images that group the two triplets were inspected for radiometric unconformities during the image acquisition as proposed in Reference [54]. Commonly, radiometric anomalies show up only in one of the two or three images (stereo pair or triplet). They are caused by the existence of surfaces of highly reflective objects (e.g., metal roofs and water surfaces). A different acquisition angle may produce sun glint in one of the images and not in others [50]. None of these effects was noted in the present set of Pleiades images. The coordinates of 180 GCPs were obtained from the orthomosaic provided by the National Cadastre and Mapping Agency S.A., while the elevation was retrieved by the respective DSM.

3.2.4. UAV Data Processing

UAV images were imported into the Agisoft PhotoScan software. The software combined computer vision techniques and structure from motion (SfM) photogrammetry to achieve direct georeferencing or bundle adjustment with ground control points (GCPs) [75,81,82] or simple similarity transformation over the whole block without GCPs. Alike to classic photogrammetry from air photos or satellite stereopairs, SfM photogrammetry uses overlapping images taken from different points of view. The major variation between the two approaches is that SfM defines the internal camera characteristics, the position of the camera, and the orientation of each image in an automatic way without the need for any prior knowledge or grid determination [83]. All the necessary calculations for the internal orientation are estimated automatically by a repeat procedure called “bundle adjustment”. Bundle adjustment reflects the automatic localization of common characteristics in a group of overlapping photos [75]. The geometry of the whole scene is built as more overlapping images are processed and more mutual objects are detected and related. The requirement for many overlapping photos in order to cover an entire area of interest generated the procedure name of structure from motion photogrammetry or photogrammetry produced from a moving camera [82].
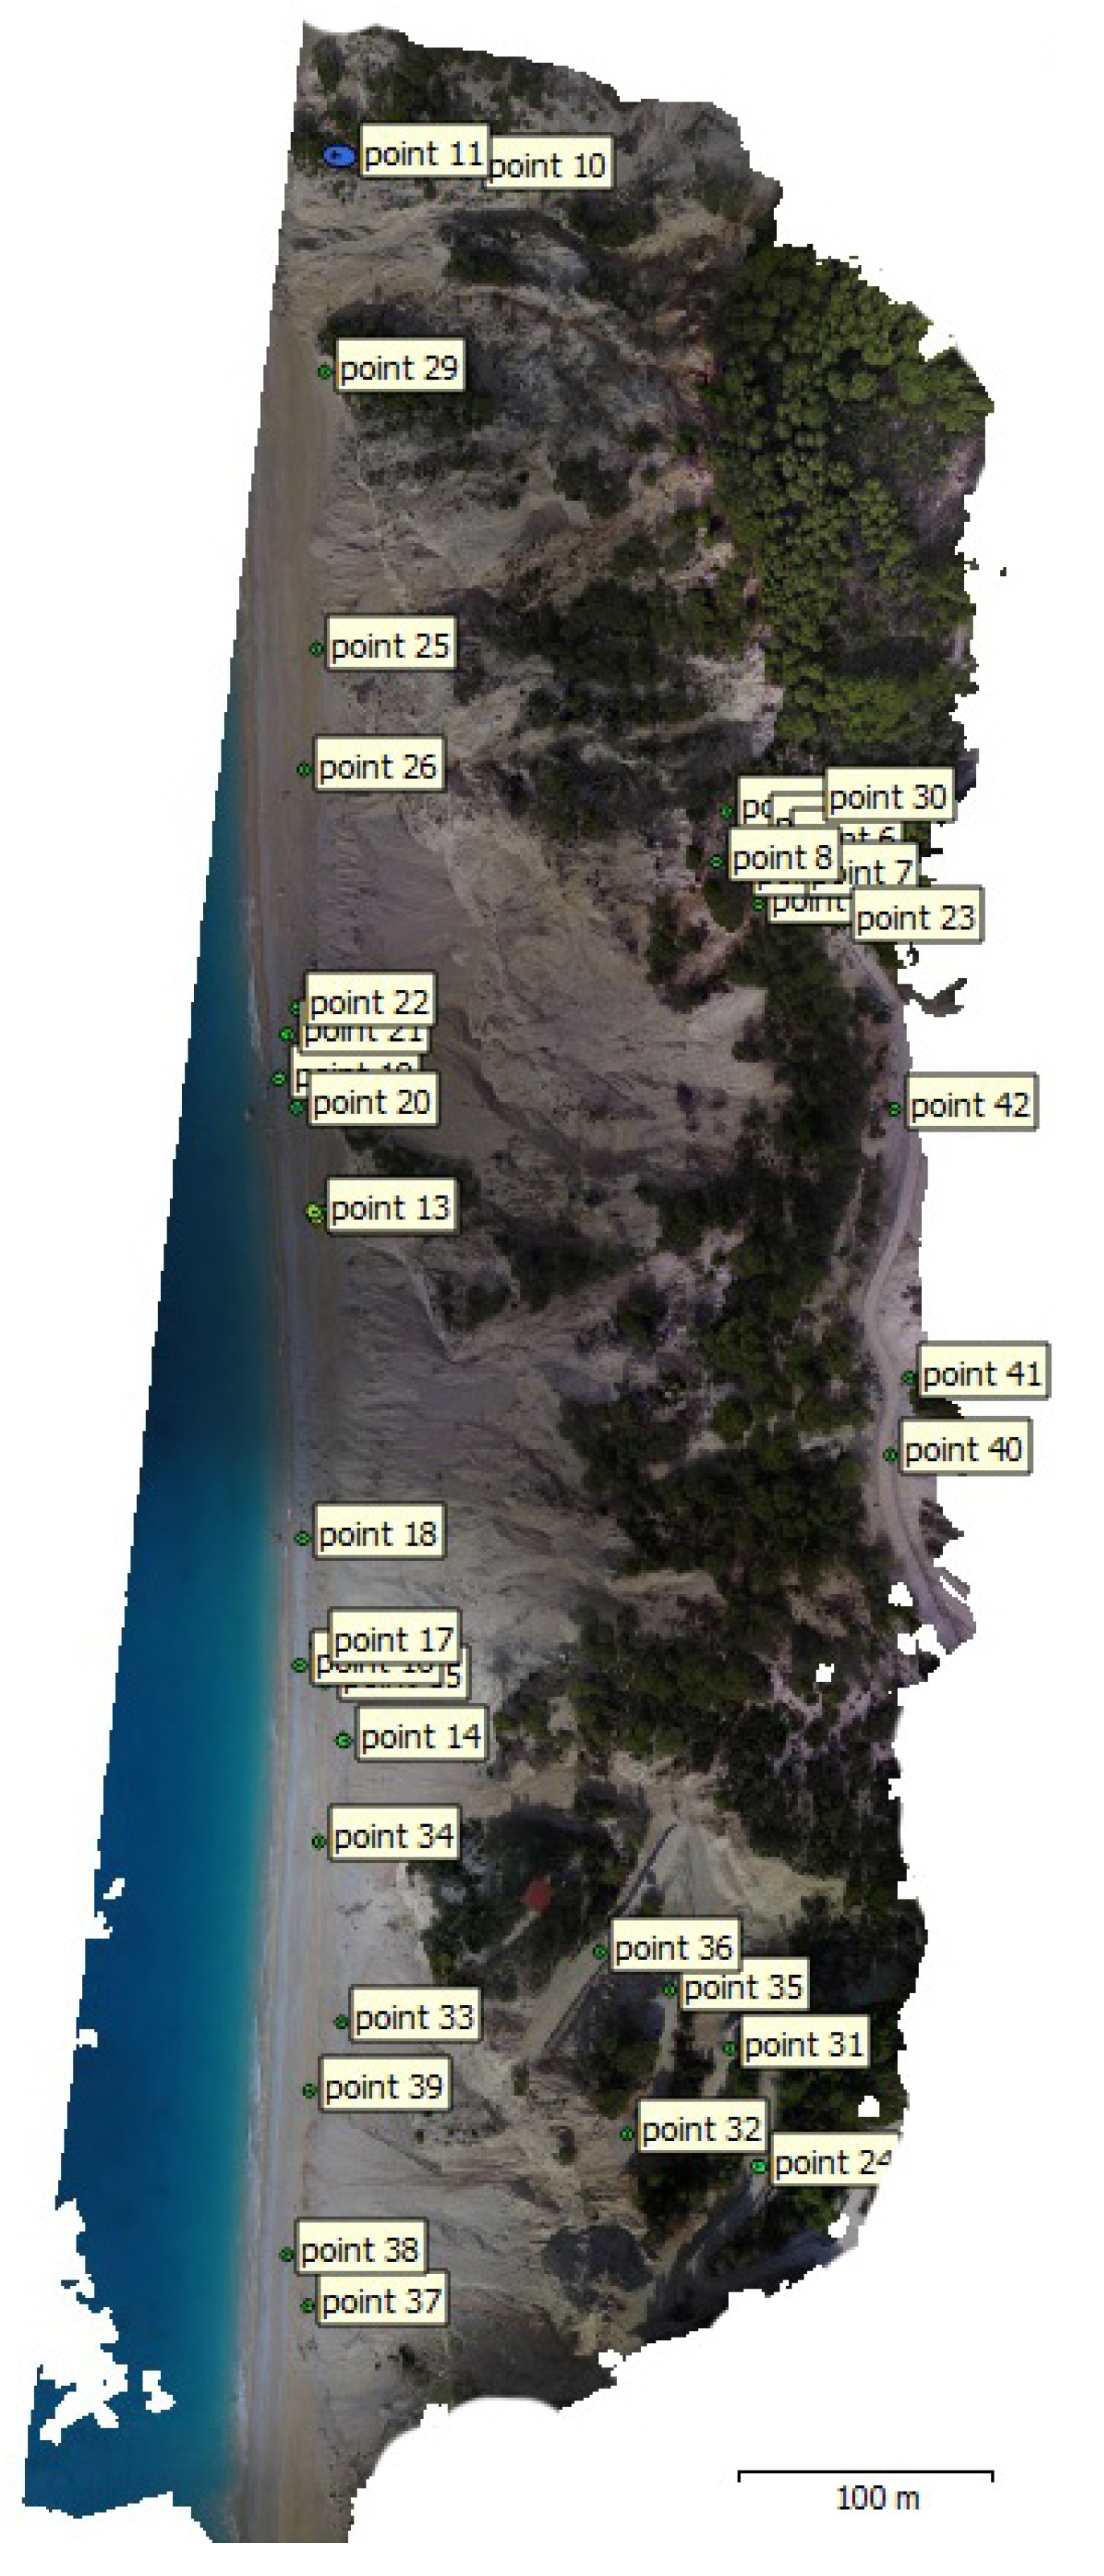
During the flight campaigns, artificial targets were spread out in the broader area and measured with a differential Global Navigation Satellite System (GNSS) receiver (Leica GS08). These artificial targets were easily detectable in the UAV images and used as ground control points. The use of artificial targets as ground control points is described in detail in a previous study [17]. The allocation of these targets is presented in Figure 5. As described in more detail in another case [75], the GNSS sensor was receiving corrections—through the GSM network—from the Greek Hellenic Positioning System (HEPOS). The receiver collects signals from GPS (L1, L2, and L2C frequencies), GLONASS (L1 and L2 frequencies), and Satellite-Based Augmentation Systems like Wide Area Augmentation System (WAAS), European Geostationary Navigation Overlay Service (EGNOS), etc. All the GCPs’ measurements have a horizontal accuracy better than 1.3 cm and a vertical accuracy better than 2 cm.

3.3. Historical Shoreline Analysis

To quantify shoreline changes, we separated the 73-year period from 1945 to 2018 into 3 subperiods. These were 1945–1972, 1972–2000, and 2000–2016. This time separation enabled the detailed analysis of the erosion and accretion in rates and in absolute lengths highlighted along the shoreline trace. For the shoreline analysis, two different approaches were used. Firstly, the shoreline was digitized from all the datasets. Then, two different flowcharts—one fully automatic and one semiautomatic—were followed for the shoreline evolution mapping, as described in the next paragraphs. The decision to use two different flowcharts was based on a previous study [84] which proved that different techniques can provide very correlated results for smooth shorelines but less correlated results for irregular shorelines.

3.3.1. Digital Shoreline Analysis System (DSAS)

A software package called the Digital Shoreline Analysis System (DSAS) was used in order to measure the shoreline rates-of-change by comparing vectorized shorelines from diverse dates [85]. DSAS is an add-on tool of ArcGIS software, developed by the USGS in conjunction with the TPMC Environmental Services. The DSAS software creates transect lines perpendicular to the coastline with reference to a specific baseline set by the user. The user also determines the spacing of the transect lines across the shoreline [40]. The shift of the shoreline seaward or landward, with reference to the baseline, is characterized as accumulation or erosion at each transect, respectively, and the statistical values are considered as positive for accumulation and negative for erosion. The software calculates diverse statistical values in order to measure the shoreline position change [85]. The main values are the end point rate (EPR), which measures the rate of the coastline change between two successive shorelines, and the net shoreline movement (NSM), which calculates the total distance between the successive shorelines. The specific method for coastline change detection has been used in the past with different types of remote sensing data. For example, DSAS was used with multi-date satellite images from the Indian sensors (IRS P6 and LISS-III) in order to extract the shoreline change on the western coasts of India [86]. The same software was used with diverse Landsat Thematic Mapper and Enhanced Thematic Mapper images during a 25-year period to derive the shoreline changes in Egypt [7]. In another example, diachronic aerial photographs and Quick-bird satellite data were used in combination with DSAS [44] in order to detect and measure the shoreline movements at the Bay of Jijel (eastern Algeria). Multitemporal and satellite dataset have been interpreted with DSAS for the change detection in 112 km of shoreline in India [11]. Aerial photographs and a variety of VHR satellite images (Quickbird, Worldview-1, and Worldview-2) were analyzed to map the shoreline changes from 1943 to 2012 in Papua New Guinea [45] with DSAS. Multi-date Landsat images were also processed with the same software [12]. Historical aerial photos and VHR satellite data were processed for the shoreline mapping in the Marshal Islands using DSAS [47,48].
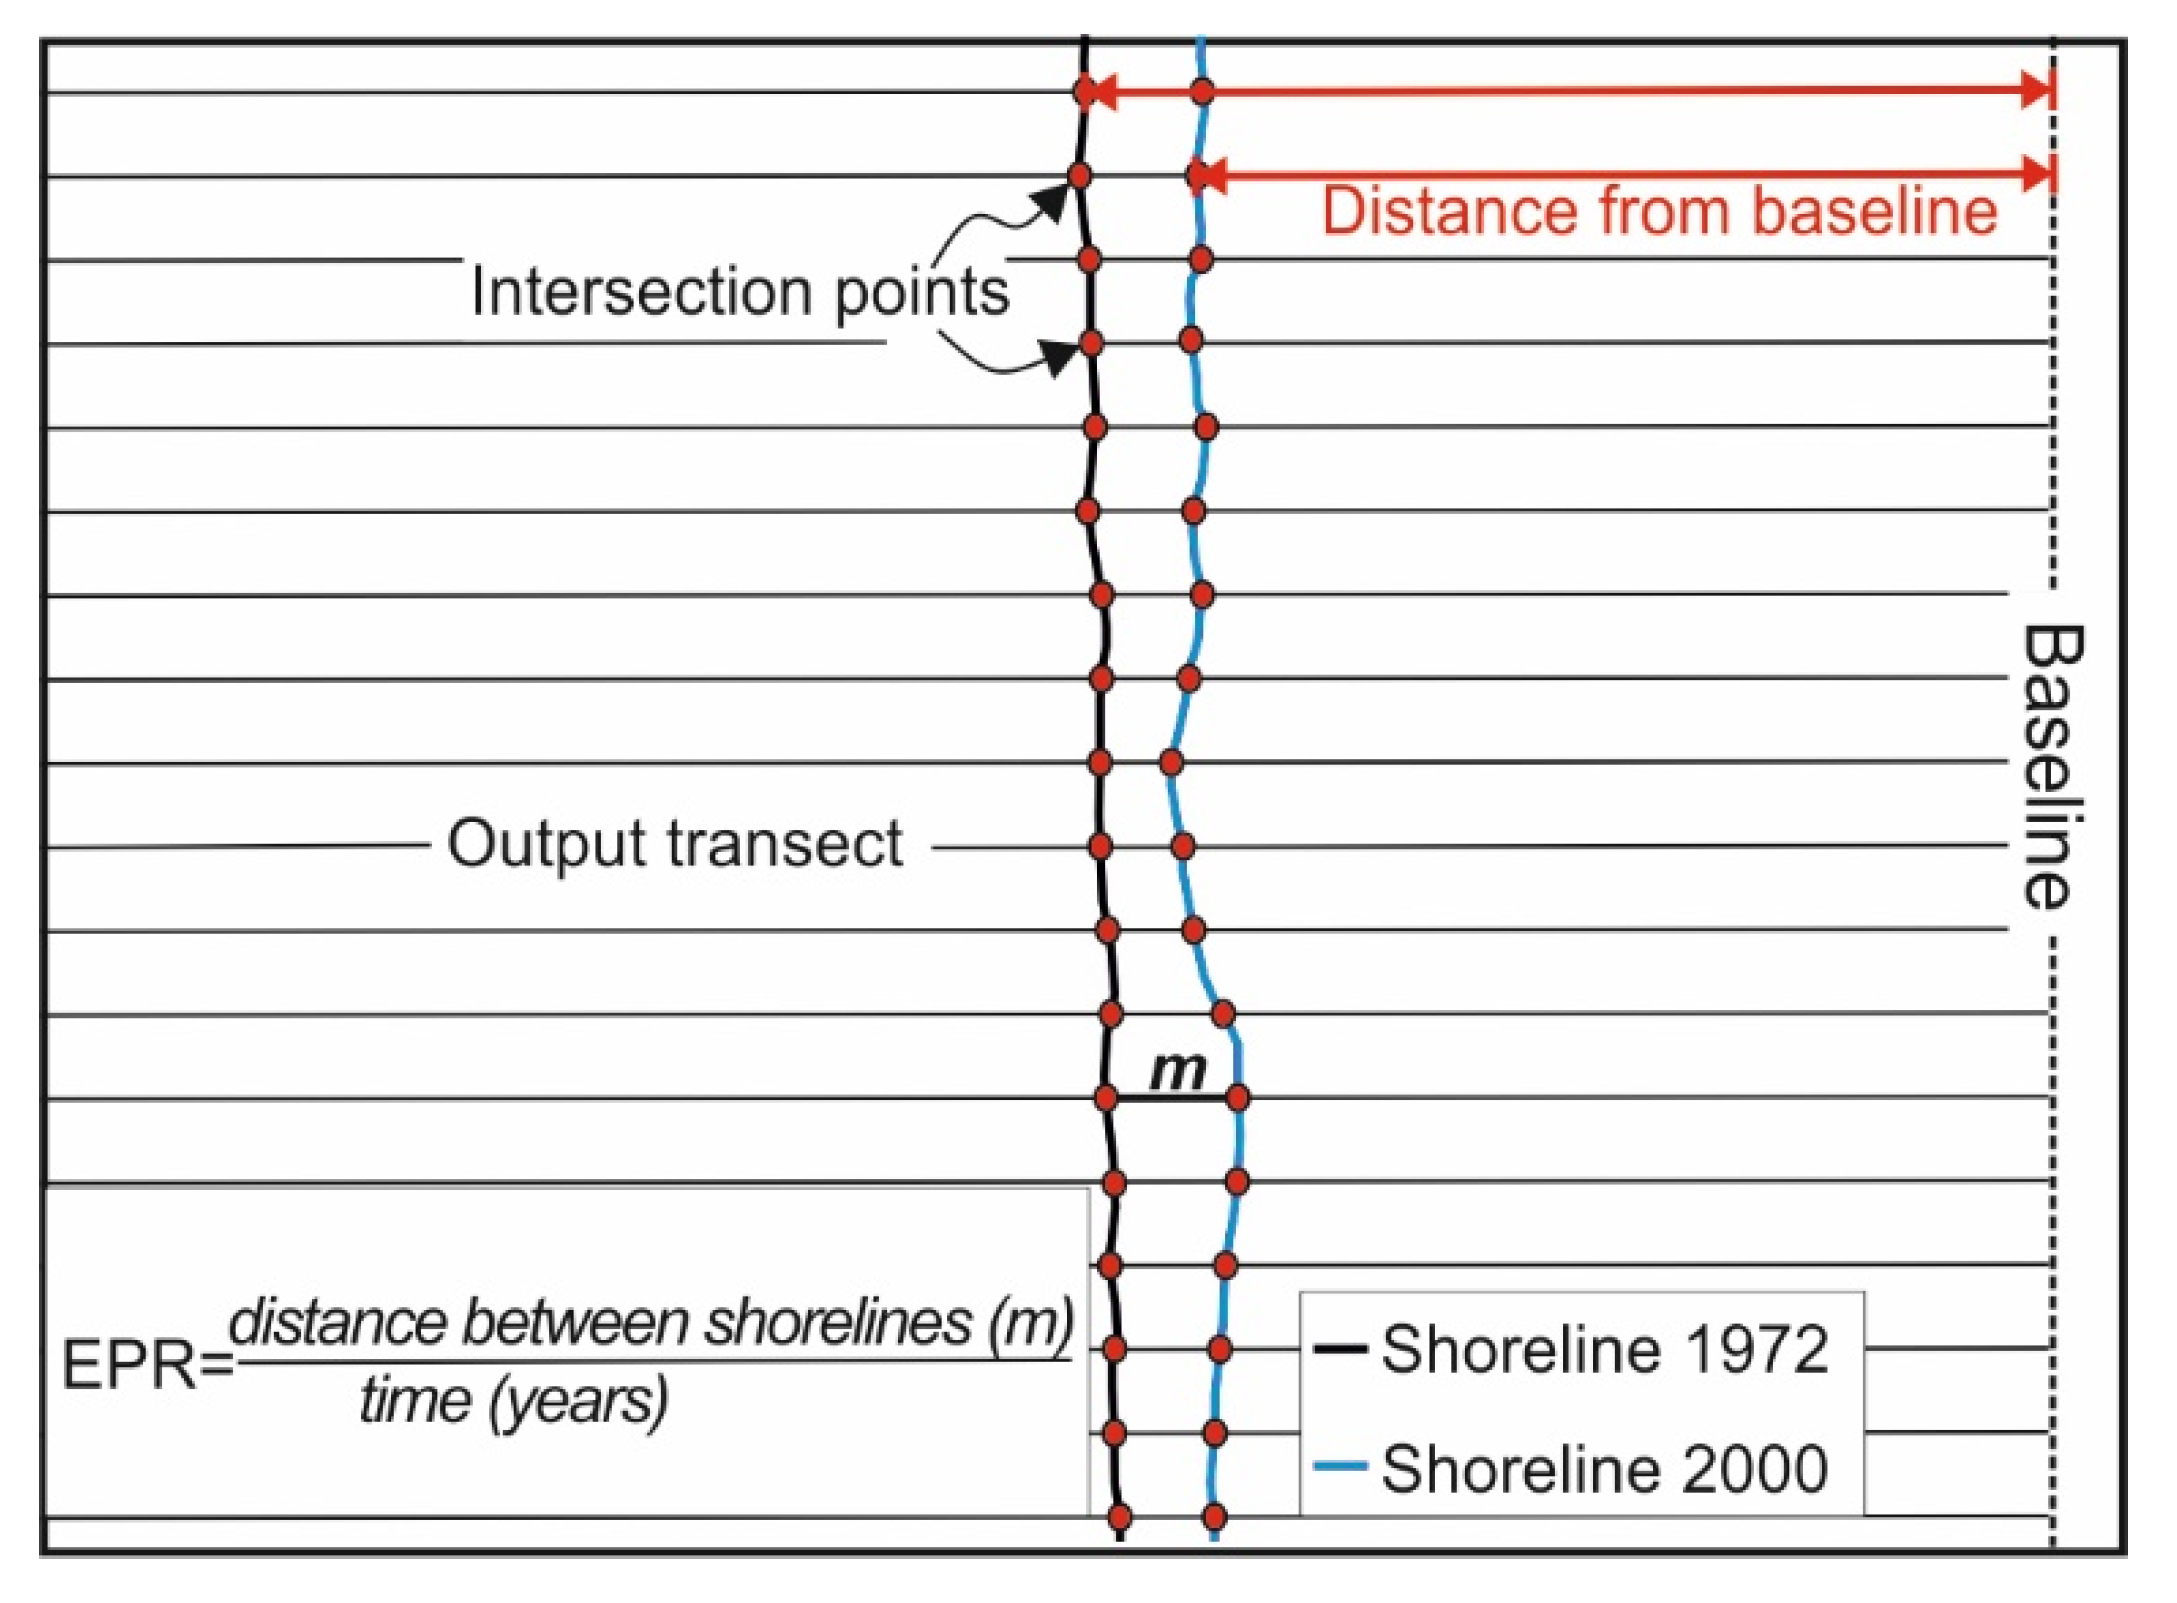
In the current study, DSAS utilizes the digitized shorelines in reference to a baseline projected to the same reference system (Greek Grid). The shorelines cover the following years: 1945, 1972, 1974, 1980, 1992, 2000, 2008, 2016, and 2018. For each shoreline vector, the software requires that the date is predefined in the format year/month/day. The software creates transects which intersect the multi-date shorelines at specific points, which are used for the calculations of the EPRs. The EPR calculation is presented in Figure 6, while the general flowchart of DSAS is presented in Figure 7.

3.3.2. Semiautomatic Processing in GIS Environment

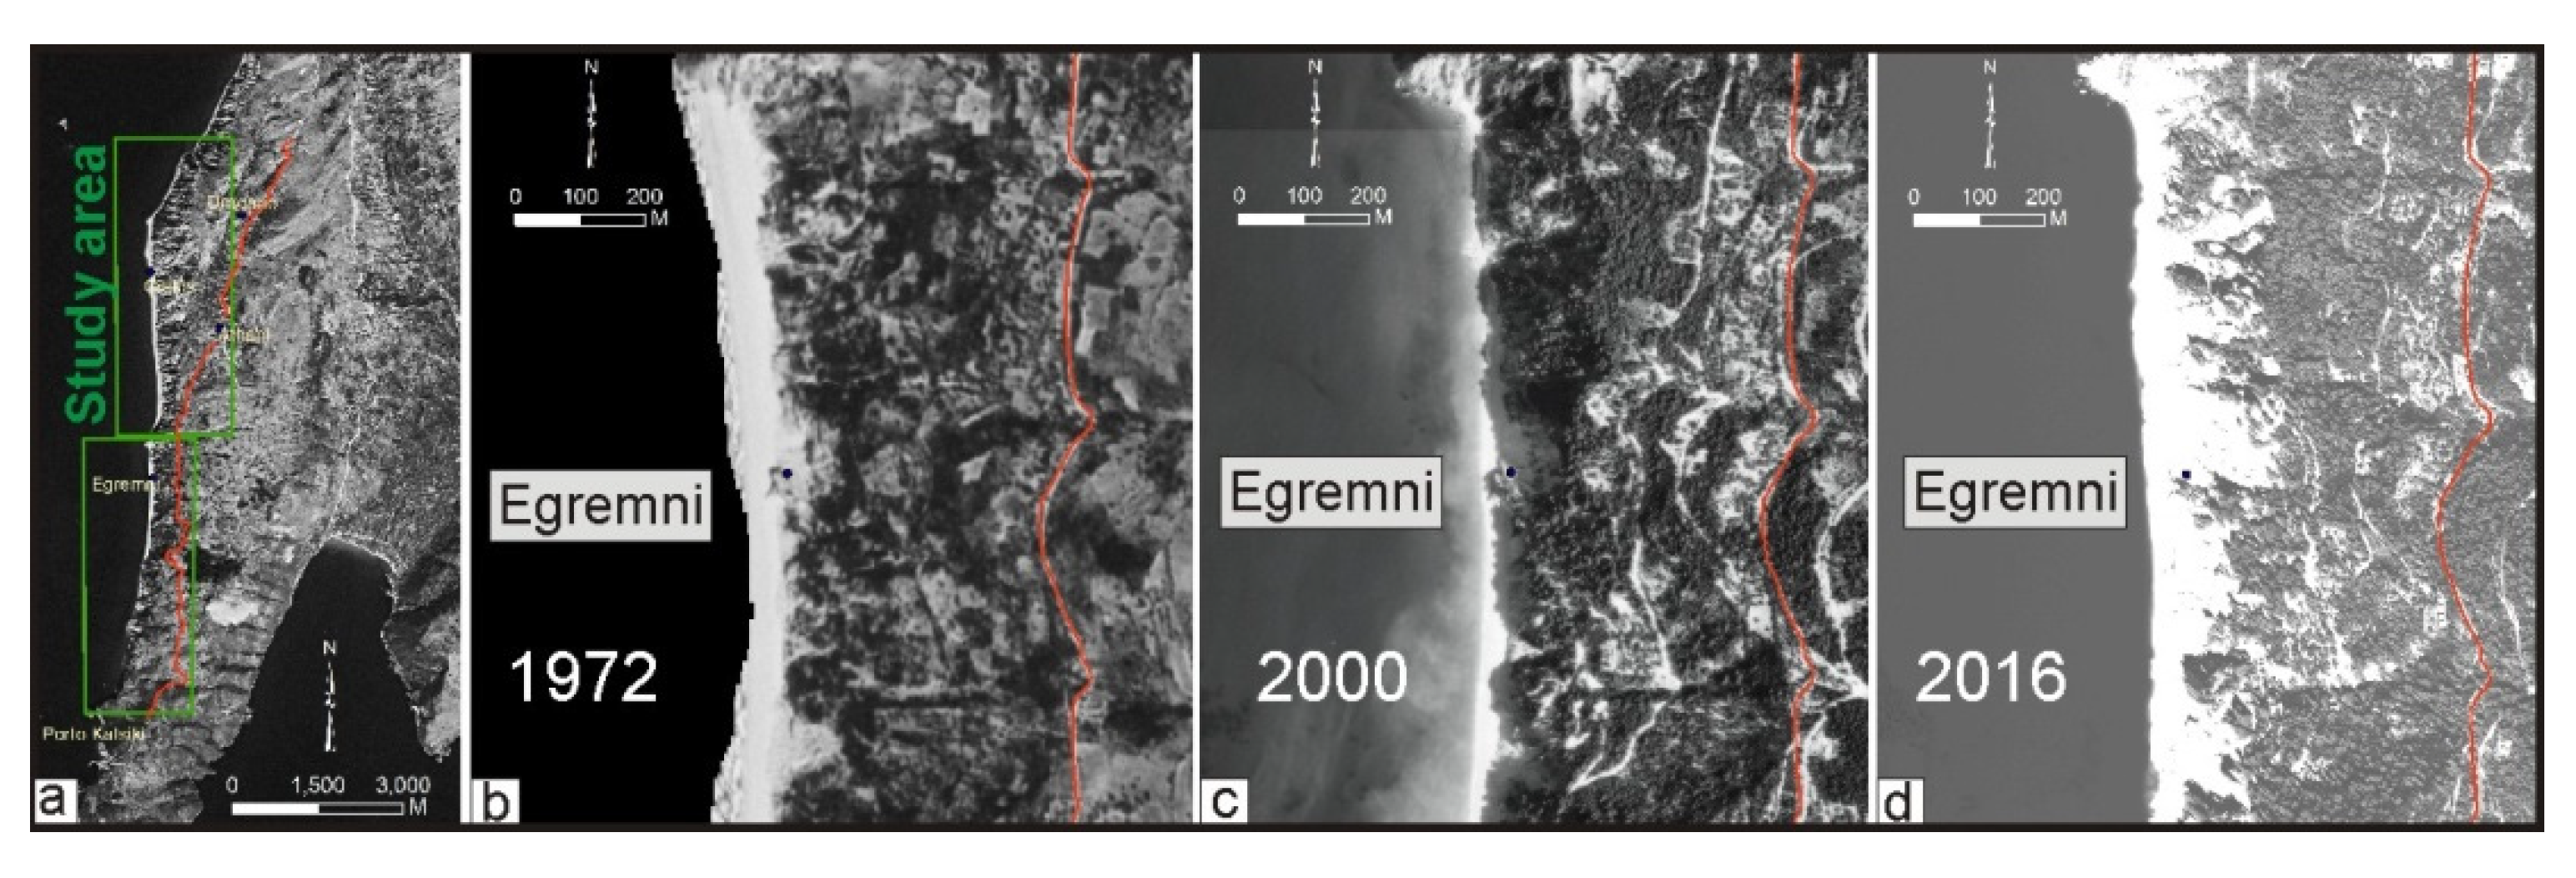
For the shorelines of Egremni and Gialos in SW Lefkada Island, we also applied semiautomatic processing in a GIS environment for extracting shoreline alterations through time. The methodological procedure was based on the creation of 102 transect lines spaced every 100 m. Their contact point with the studied shorelines identifies the coastal point viewed in a distance diagram. The baseline, which was the road from Porto Katsiki to Athani and from Athani to Komilio that can be identified in images more recent than 1972, was projected to images of all different ages. In Figure 8, the digitized road from the 1972 orthophoto is overlaid in the orthomosaics of 2000 and 2016. The digitized roads confirm the accuracy of the derived orthomosaics of different ages because their spatial adjustment in all the orthomosaics can be identified easily and they also act as testimonies of the used methodology (Figure 8). Thus, the semiautomatic procedure used in this paper represents an evaluation tool for the DSAS methodology and attaches great importance in the study to the shorelines of Egremni and Gialos of Lefkada Island in terms of accretion and erosion.

4. Results

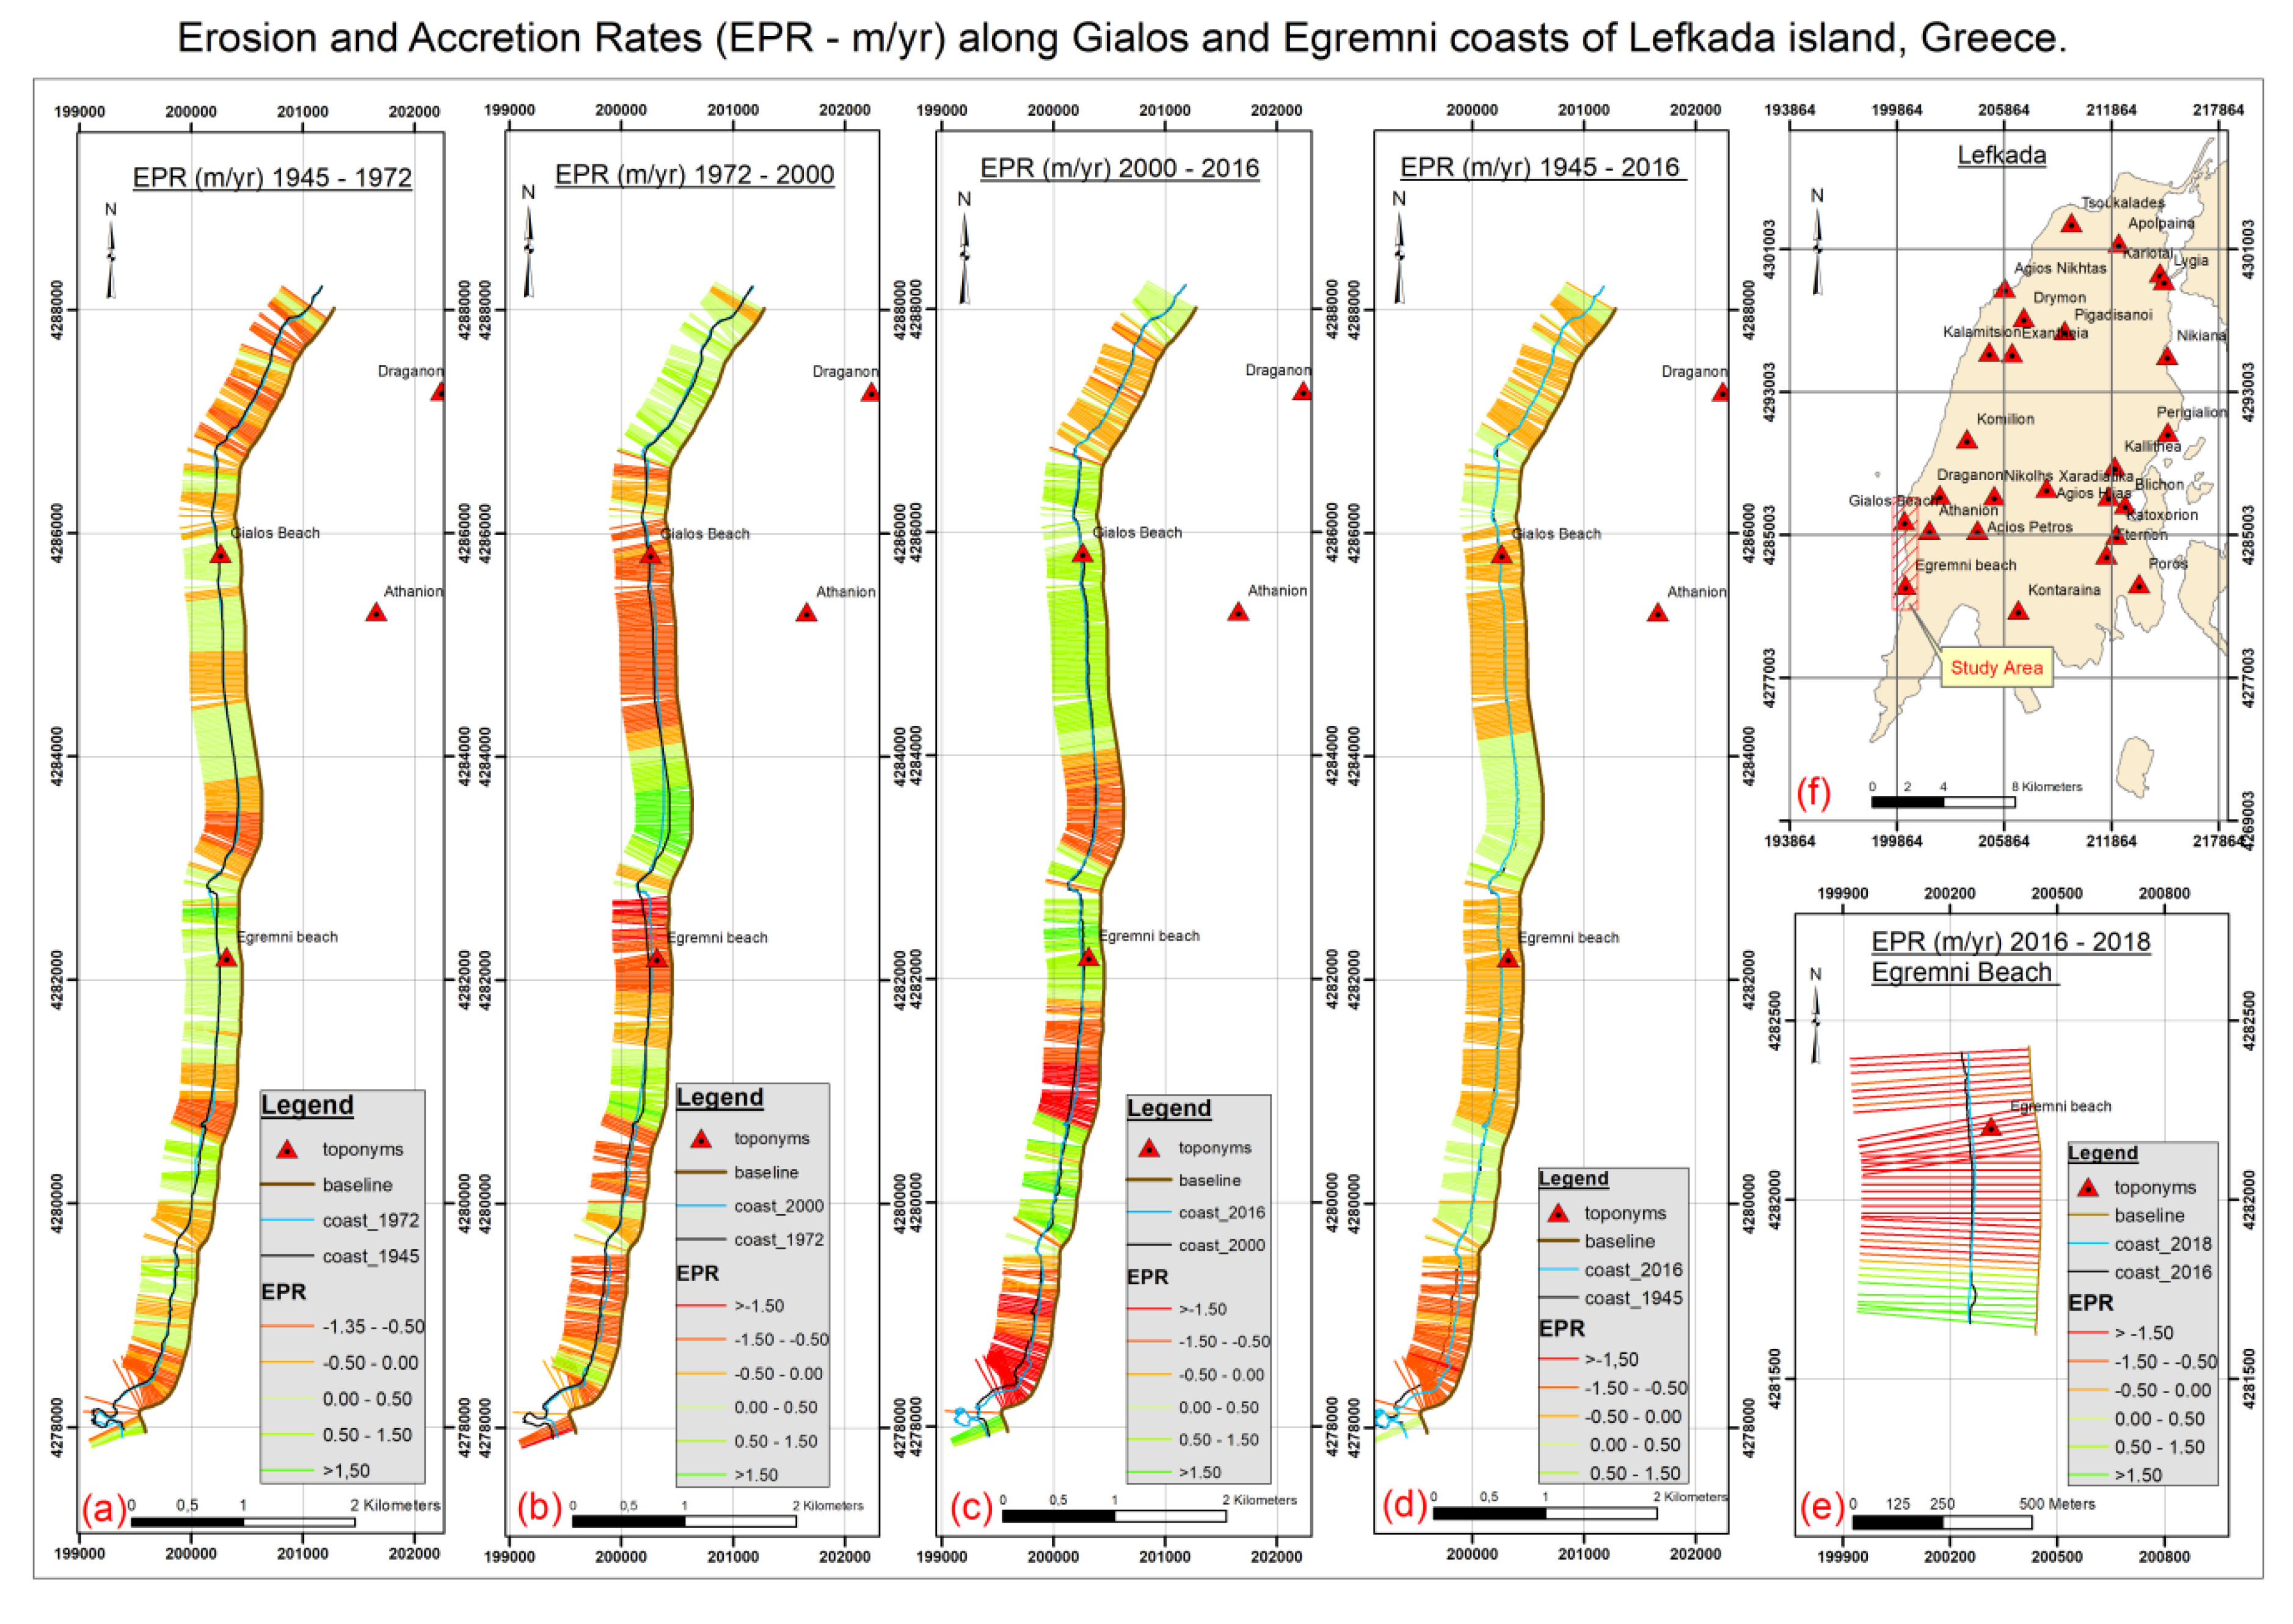
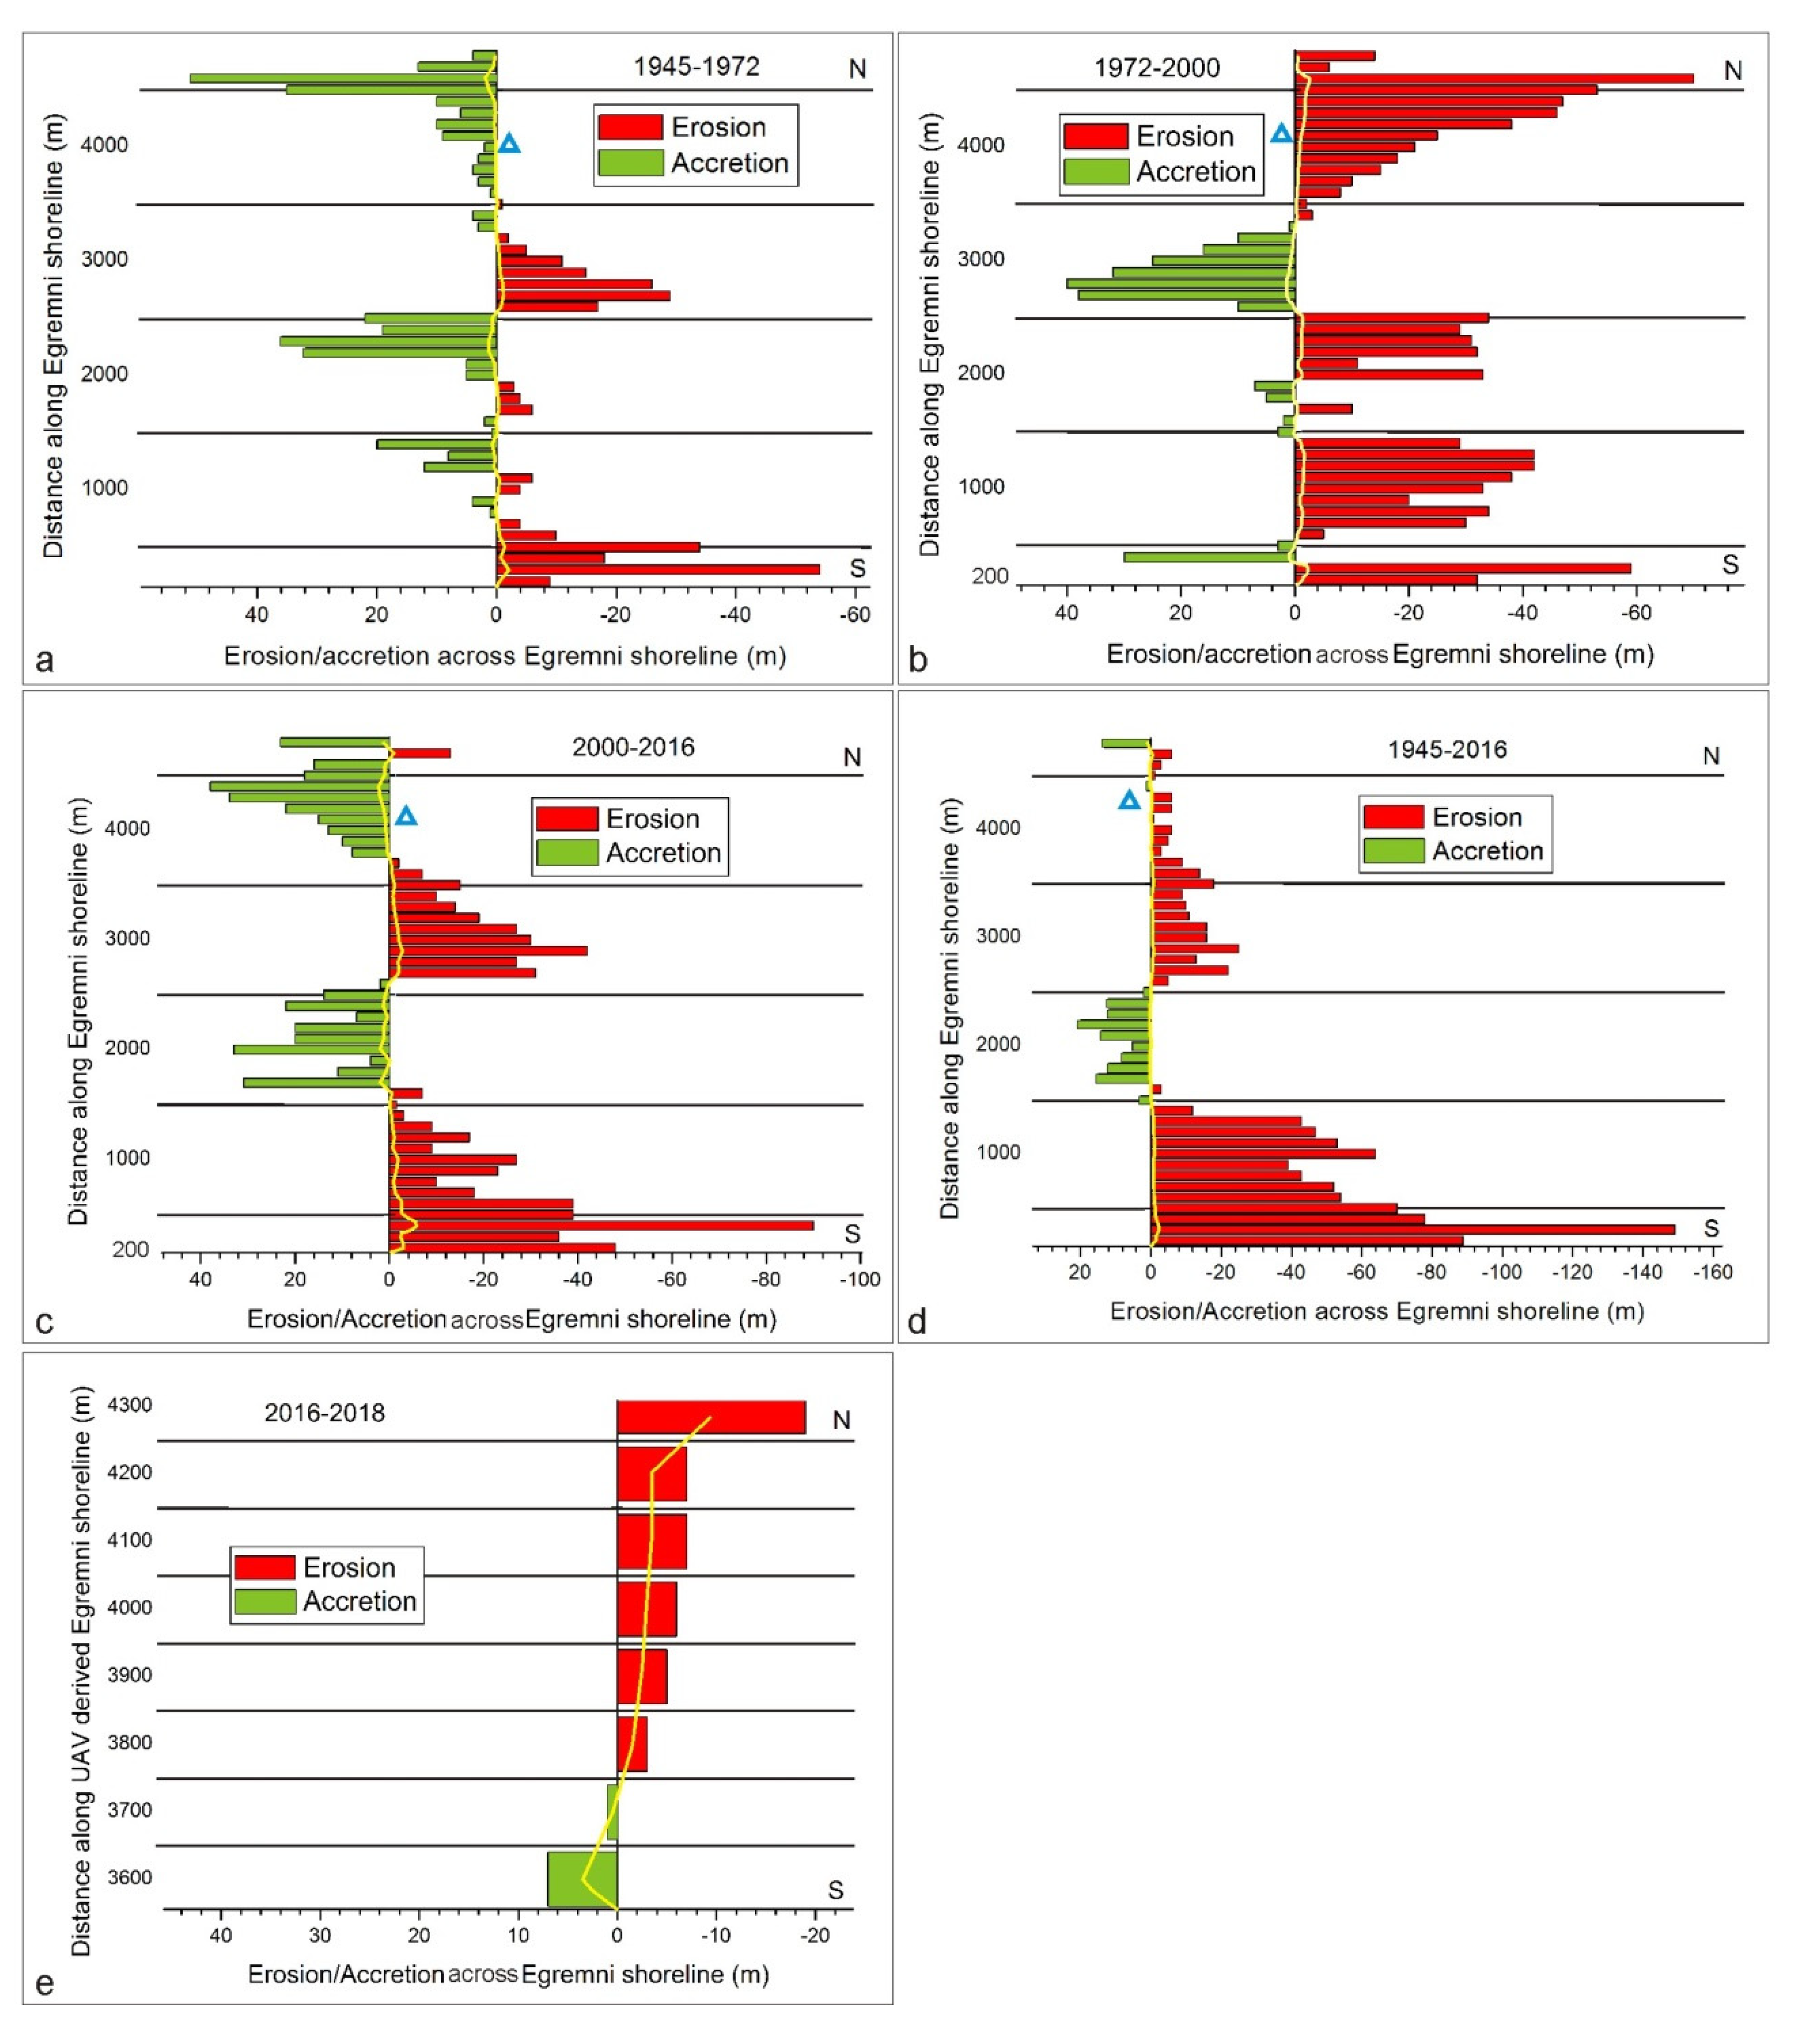
The images of 1945, 1972, 1974, 1980, 1992, 2000, 2008, and 2016 and a UAV flight campaign during 2018 were used to analyze the rate of change at two significant and popular tourist beaches, Egremni and Gialos, in which both include similar sandy and rocky parts (Figure 2b). These shorelines are regarded as significant for the geomorphological evolution of the west part of the island because a series of factors seem to have a common impact on their evolution. These factors are the wave action; the seismicity; and, for the years after 2000, the human factor. The 73 years of inventory of both beaches revealed remarkable changes over time across the shoreline in the previously referred periods. In these periods, we mapped high erosion and/or accretion rates and absolute length changes. We also defined shoreline trends from erosion to accretion and vice versa (Figure 9). Analytically, our results over discrete periods are summarized in Figure 9. In total, the shoreline mapping results are presented in three figures (Figure 9, Figure 10 and Figure 11) and in one table where the maximum erosion and accretion rates are highlighted in each time period (Table 5). In Figure 10 and Figure 11, maximum erosion (up to 149 m) and maximum accretion (up to 44 m) can be observed. Over the entire coast, from the Porto Katsiki headland to the northernmost end of the studied shoreline (Gialos headland), erosion affects 6300 m and accretion affects 3700 m, indicating that erosion has prevailed over accretion during the last 73 years.
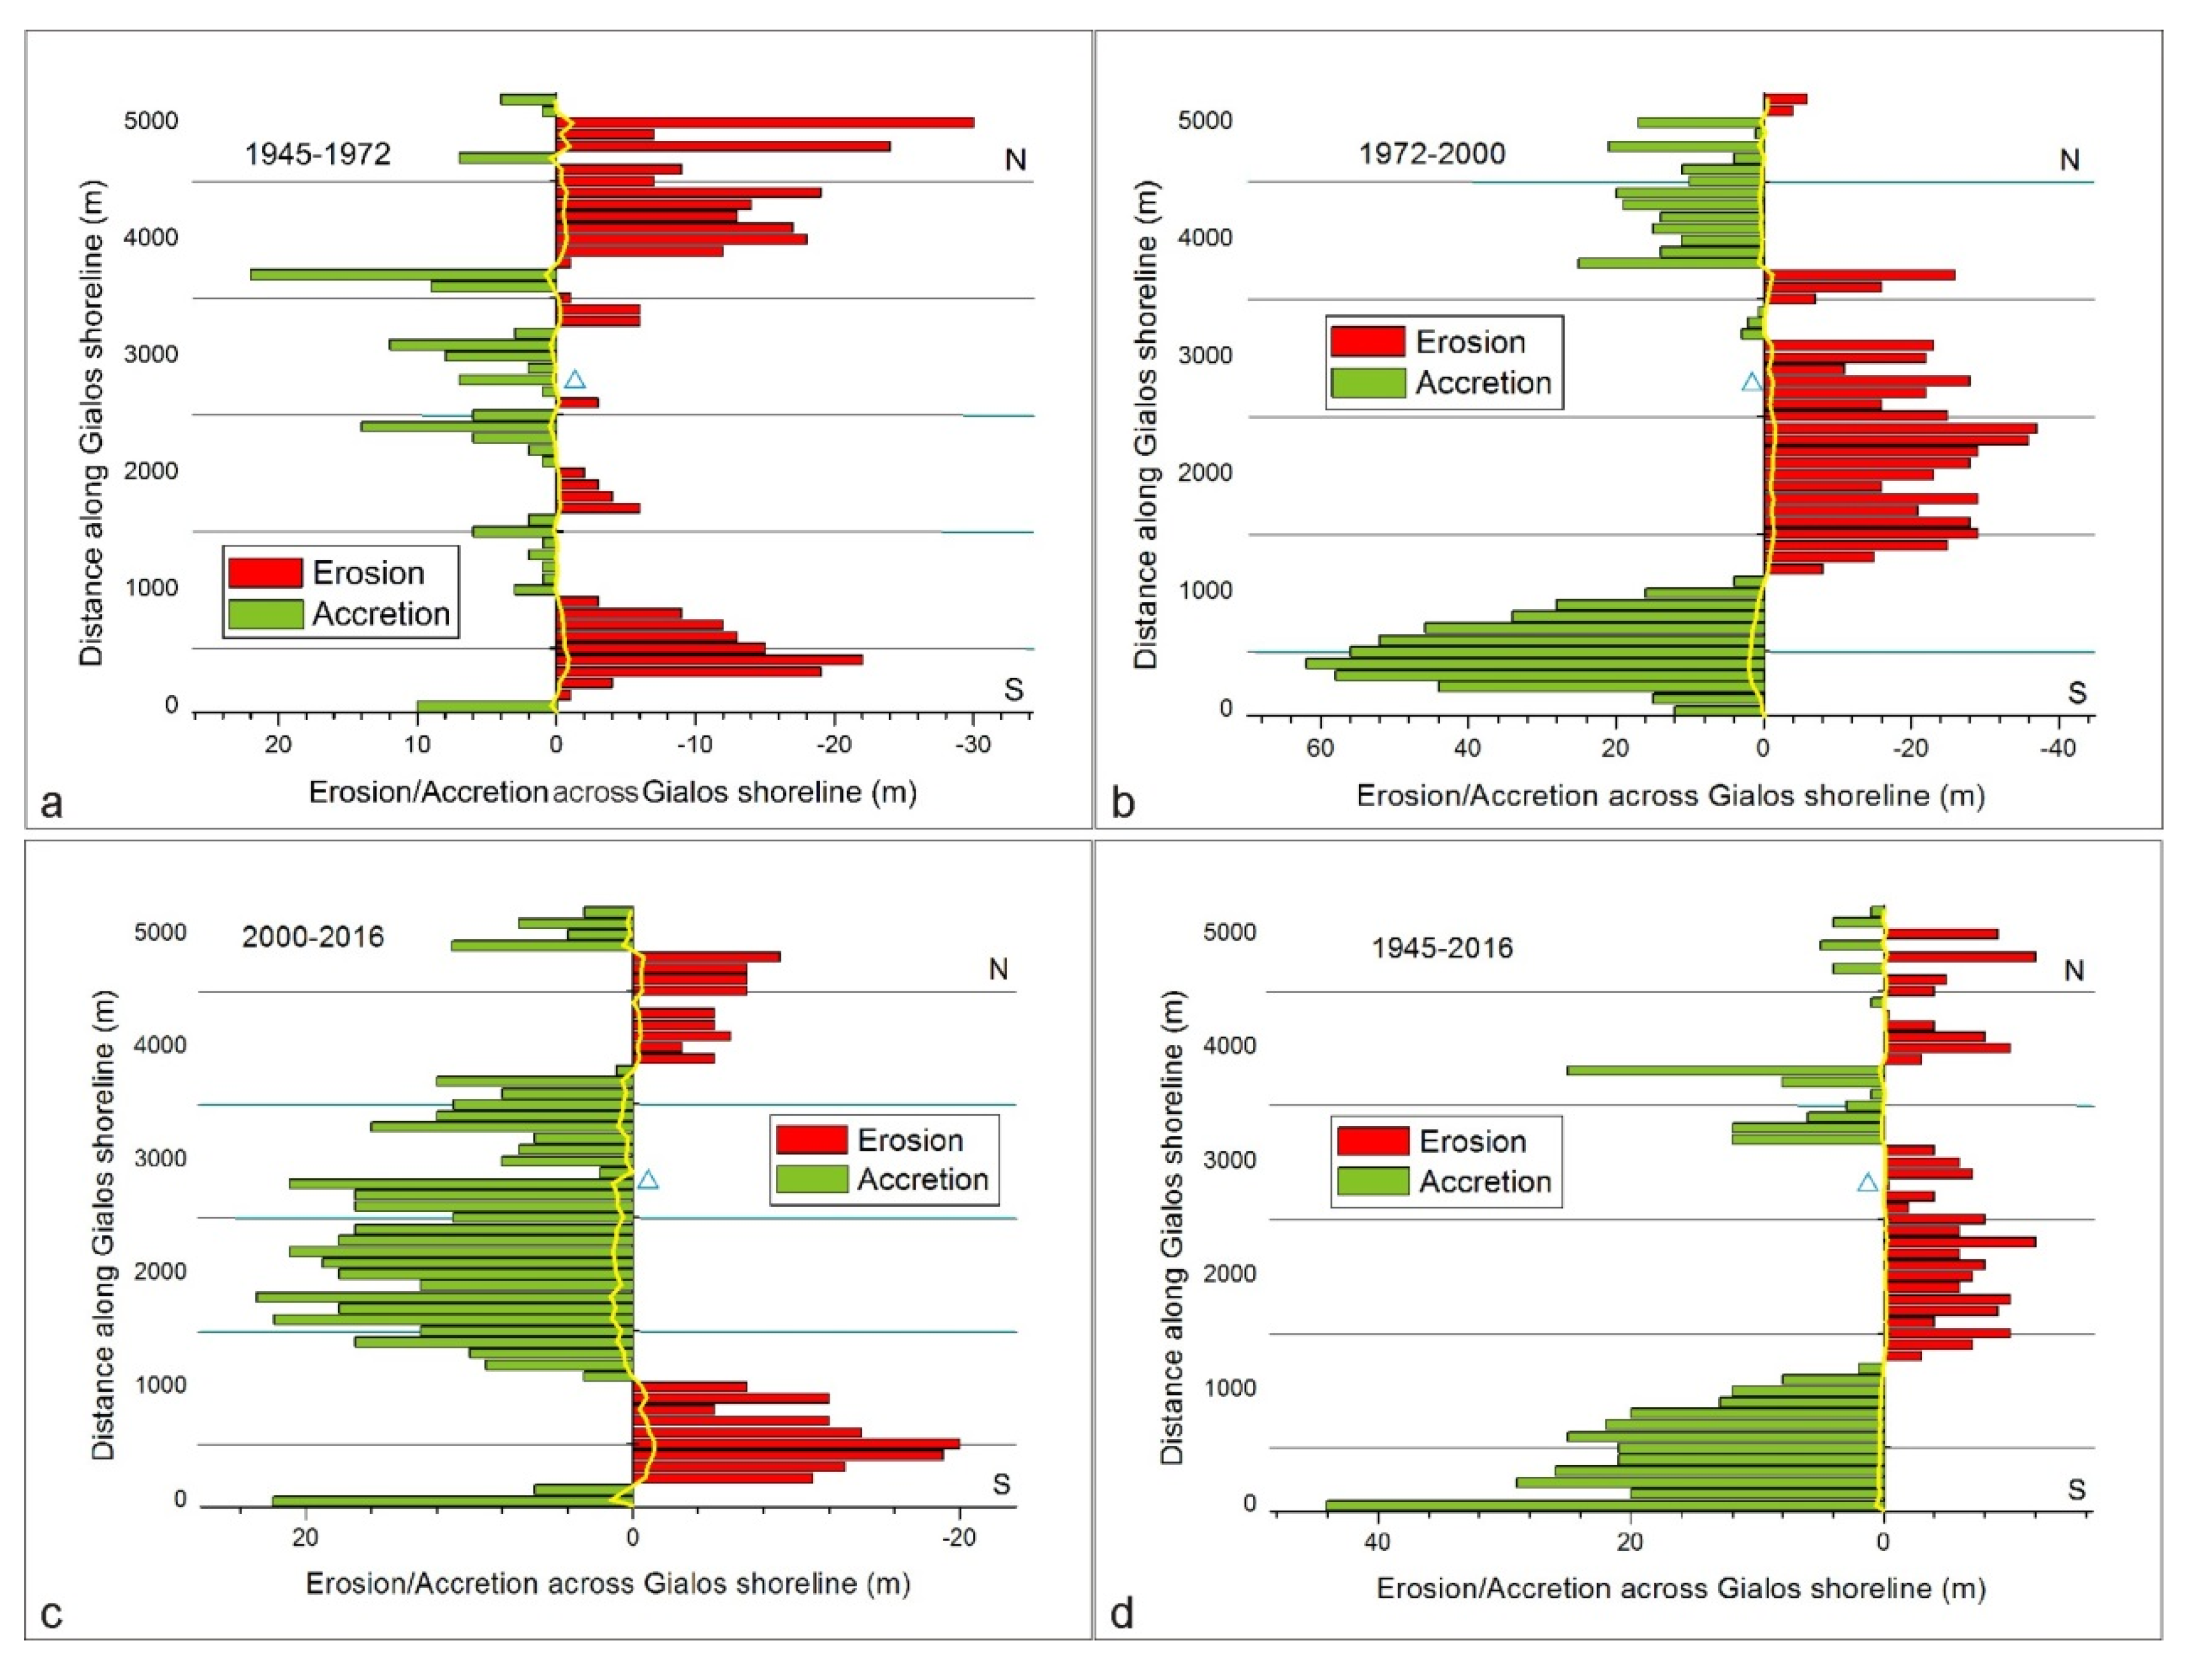
For the period of 1945–1972, erosion was dominant in six areas where the erosion annual rate surpasses 0.50 m and three large areas where accretion surpasses 0.50 m per year (Figure 9a). Overall, 4800 m of the coast is under erosion while accretion extends to 5200 m, suggesting that the area of erosion is almost equal to the area of accretion. In the south (Egremni beach), accretion in the period 1945–1972 shows a maximum of 51 m while maximum erosion is 54 m (Figure 10a). In the Egremni beach, the accretion is active in 2800 m, or 60% of the total length of the beach, with erosion prevailing in 1900 m, or 40% of the beach length. For the same period in the Gialos beach, accretion is active in 2400 m, or 45% over the beach length, and erosion in 2900 m, or 55% of the beach length (Figure 11a). Maximum accretion in Gialos beach is as much as 22 m and maximum erosion is 30 m.
During the period 1972–2000, we defined the change from erosion into accretion in comparison to the 1945–1972 period. The new pattern depicts erosion into areas of accretion and vice versa (Figure 9b). At the southern end of the shoreline, erosion prevailed in both periods but now has an impact on a wider area (Figure 10b). At Egremni beach during this period, erosion is remarkably high, up to 70 m in the north and up to 38 m in the south (Figure 10b). Overall, the accretion is active in 1400 m, or 30% of the total beach length, while erosion is prevailing in 3300 m, or 70% of the beach length (Figure 10b). In the Gialos beach, accretion is active in 2800 m, or 53% of the beach length, and erosion in 2500 m, or 47% of the beach length (Figure 10b). Maximum accretion in Gialos beach is as much as 62 m, and maximum erosion reaches 37 m (Figure 11b).
Over the 2000–2016 period, there was again a change from an erosion to an accretion trend in comparison with the previous period (1972–2000). The new pattern once more shows erosion moves into areas of accretion and vice versa (Figure 9c). The southernmost end of the shoreline remains constantly under erosion in this period (Figure 9c). At the Egremni beach during this period, erosion is remarkably high, up to 42 m in the north and up to 90 m in the south (Figure 10c). Maximum accretion is 38 m at the north end of the Egremni beach (Figure 10c). Overall, the accretion is active in 2000 m, or 42% of the total length of the beach, while erosion is prevailing in 2700 m, or 58% of the beach length (Figure 10c). At the Gialos beach, the accretion affected an area 3400 m long, or 64% of the beach length, and erosion affected 1900 m, or 36% of the beach length, in the period 2000–2016 (Figure 11c). Maximum accretion in Gialos beach is as much as 22 m, and maximum erosion is 20 m. In summary, over the 73 years, both beaches were under erosion, with the highest erosion observed at the southernmost end of the Egremni beach near the Porto Katsiki headland (149 m) (Figure 10d), and the highest accretion was observed at the southern end of Gialos beach near Egremni headland (44 m) (Figure 11d).
During the 73 years, there are periods related to intense seismicity and periods with low or absence of seismicity (Table 1). Significant seismicity is recorded at the beginning of the first period, during 1948 and 1953. In the second period, the biggest earthquake occurred in the middle of the 1972–2000 period. The most recent period of seismicity was recorded in 2003 and 2015. Based on these data, our mapping of shorelines corresponds to significant, low, and very high seismicity. Based on our unpublished mapping data relating to the 2003 and 2015 earthquakes, significant landslides and mass wasting across the shoreline were triggered due to these two earthquakes.

5. Discussion

The phenomenon of shoreline changes is quite complex, affected by oceanographic and meteorological conditions and geological parameters. In general, the study area is influenced by west to northwest prevailing winds that rarely blow above a maximum speed of 6 Bf [87]. The tide wave action is characterized by low amplitude as in the rest of Mediterranean Sea, and the average offshore wave height is almost 0.79 m [88]. However, in this study, as oceanographic and meteorological data and studies are missing for Lefkada Island, we have to focus exclusively on geological parameters such as seismicity, active deformation, and mass wasting across the west cliff of Lefkada in order to explain the shoreline changes. Those changes were mapped using multi-date and multisensor remote sensing data combining, for the first time, aerial photos, declassified satellite imagery, Pleiades data, and UAV data. The photogrammetric processing of these data and the very low RMSE (Table 4) resulted in the excellent georeferencing of the diachronic data (Figure 8). The extensive field work provided the necessary number of ground control points for the accurate georeferencing of the UAV data in order to combine them with the other remote sensing data. This is fully in accordance with previous studies [89,90] that noted that the registration of UAV imagery with any other remote sensing coarser product depends on the use of ground control points that succeed in highly accurate georeferencing. However, the requirements of this procedure are by far more demanding in time and ground support [89].
The study area includes two sweeping beaches, located at southwestern Lefkada Island, separated by a headland developed between the Gialos and the Egremni beaches (Egremni headland). To the south, the study area ends at the Porto Katsiki headland and, to the north, at Gialos headland. The beach to the north of the Egremni headland is characterized by maximum accretion of 44 m (Figure 11d), while north of the Porto Katsiki headland, erosion dominates, reaching up to 149 m in the time period from 1945 to 2016 (Figure 10d). Since erosion or accretion is constantly sustained through the 73-year period in these two locations, we consider that the beach topography and oceanographic conditions are the main mechanisms controlling erosion or accretion at these specific sites. In contrast to these sites, all other shoreline lengths show remarkable changes from erosion to accretion and vice versa. Trying to highlight these changes in a better way, we considered seismicity as a major factor controlling sediment equilibrium and active deformation through earthquake induced landslides along the Egremni–Gialos beaches.
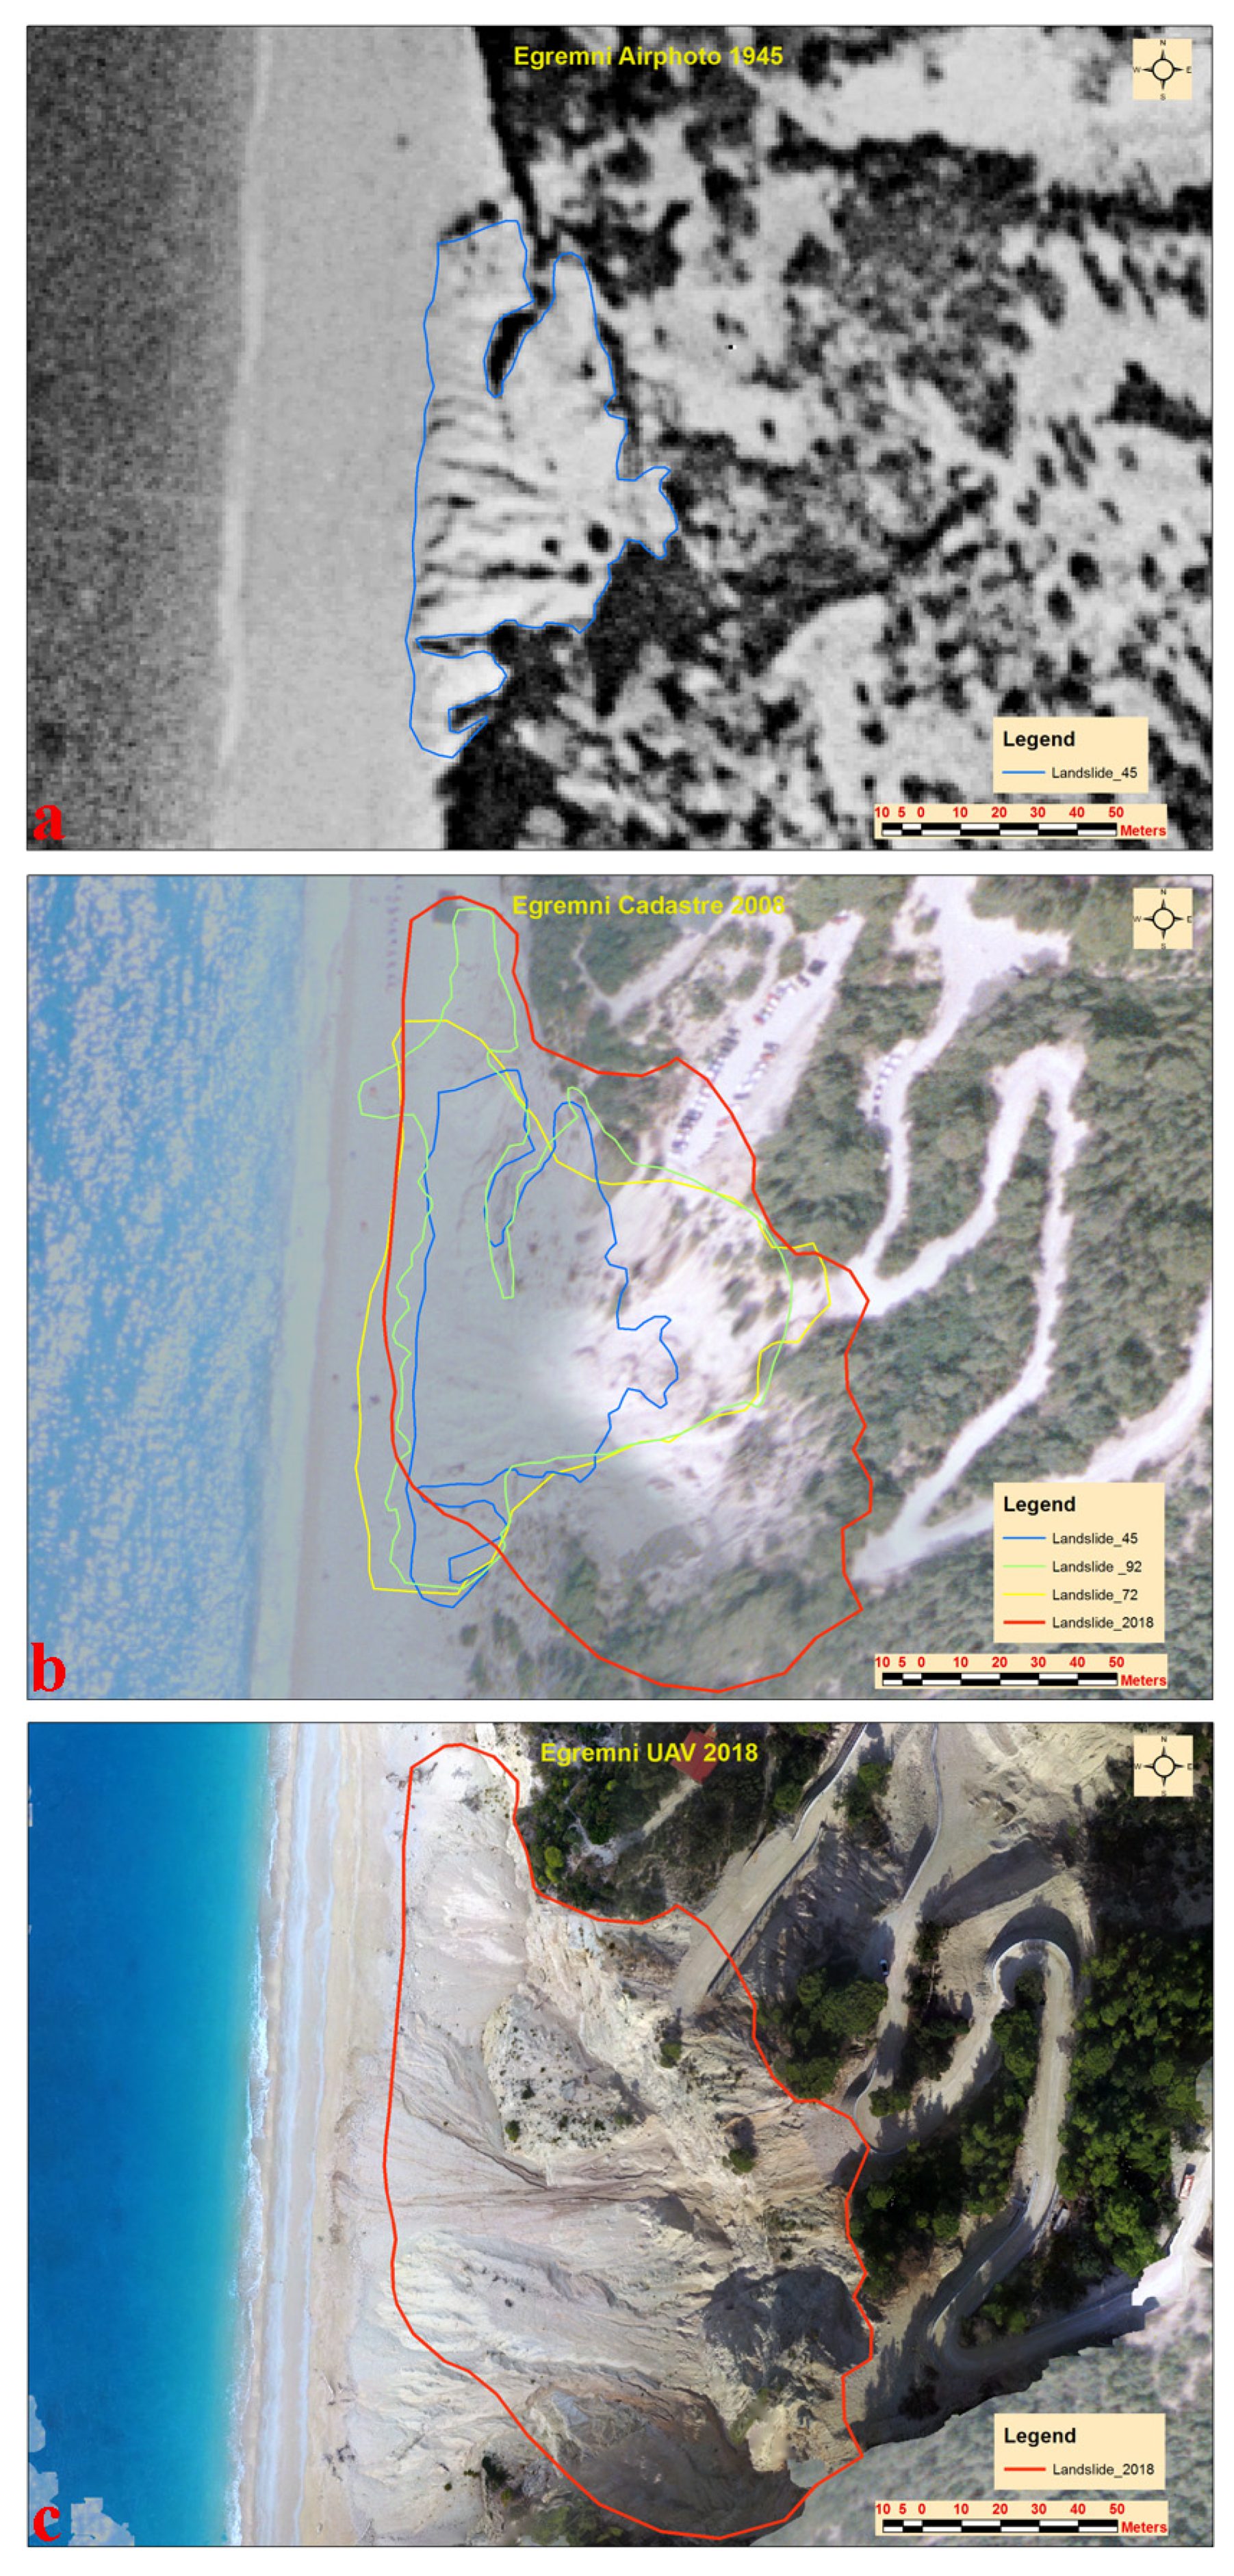
Indeed, the study of different time imageries confirms that the landslides in the overhanging cliff are directly related to earthquake occurrence and affect the forest development or retreat (Figure 12). Figure 12 presents the diachronic evolution of one of the landslides in the overhanging cliff in Egremni beach. It is obvious that from 1945 to 2018 that the extent of the landslide was almost doubled, offering waste material to the Egremni beach. The usual material that covers Lefkada beaches is mostly coarse sand with a small percentage of pebbles [87]. However, both Egremni and Gialos Beaches present a significant percentage of medium to large pebbles and granules (Figure 12) attributed to mass wasting phenomena evolving in both beaches. Thus, our multidate analysis indicates that, primarily, the seismic events of 1948, 2003, and 2015 [69] intercalated in two out of three time periods that represented crucial parameters for cliff erosion and sediment accumulation along the studied shoreline. However, Reference [69] indicated that the analyzed shoreline during the most recent seismicity has subsided a few centimeters and Ganas et al. 2016 [91] suggested extensive coastal road failures related to the outbreak of numerous earthquake-induced landslides. Thus, the changes of the two periods 1945–1972 and 2000–2016 are regarded as the result of the strong earthquakes of 1948, 1953, 2003, and 2015 (Figure 2a and Table 1). Their immediate impact is the prevalence of shoreline accretion, especially in the sandy part of both beaches (Figure 10a,c and Figure 11a,c). In contrast, during the 30-year period of seismic quiescence (from 1953–1983) and especially in the 1972–2000 period, only one earthquake affected the area (Figure 2a and Table 1); hence, the main process is the shoreline erosion (Figure 10b and Figure 11b). On the contrary, the two other seismic quiescence periods appear incapable of producing significant changes on the accretion/erosion equilibrium.
It is worth mentioning that both the fully automatic DSAS method and the semiautomatic method gave the same results (Table 5). The specific result is in accordance with the results derived in a previous study for a smooth shoreline in the Tyrrhenian Sea, Italy [84]. Both methodologies can be applied to vectorized coastlines independently from their originality (raster basemap used for digitizing the coastline). DSAS was, in the past, used with shorelines digitized from aerial photographs and VHR satellite images [44,45,47,48] or medium resolution satellite data [7,11,12,86]. The main concept in all these studies is that the raster data should have a similar spatial resolution and very accurate georeferencing. Those two prerequisites have been fully accomplished in the current study, as presented in Table 2 and Table 4.
Particularly important for understanding the phenomenon of erosion and/or accretion is the last period of monitoring with UAV in the north part of the Egremni beach. During this monitoring, we mapped extensive earthquake-induced landslides and prevalence of erosion. These highly accurate UAV data indicate beyond any doubt that, for a better understanding of the mass wasting after each earthquake, further remote sensing data acquisition and analysis is needed in order to gain knowledge about the exact time that a strong earthquake effect stops its impact as a sediment feeder for the affected shoreline. The basic advantages of the UAV SfM photogrammetry (low cost, flexibility, and high accuracy) proved the feasibility of the specific technology in coastal change mapping. The same conclusion was derived in a recent study [92] using UAV to monitor wind- and wave-driven morphological changes on a beach-dune at Truc-Vert in southwest France.

6. Conclusions

The photogrammetric processing of diverse remote sensing data (air photographs, satellite images, and drone-acquired footage) and further analysis in a GIS environment indicates that the southwest shoreline of Lefkada Island is under dynamic equilibrium. This equilibrium is strongly controlled by geological parameters such as the subsidence of the studied shoreline during co-seismic deformation and mass wasting. The following observations can be noted:
  • Headlands appear to control accretion and/or erosion along the sweeping beaches of SW Lefkada Island.
  • Periods of strong seismicity predate shoreline accretion, while periods of relatively long seismic quiescence, in the order of 30 years, are related to erosion.
  • Periods of strong earthquakes give rise to the change of the former prevailed condition. Areas of erosion change to accretion areas and vice versa.
  • Mass wasting is dramatically related to the first years after earthquakes, and sediment dispersal signifies the long-term phenomenon of sediment drift along and across the shoreline.
  • Both famous beaches will maintain their sediment budget, and an analogous evolution will be sustained as long as strong earthquakes occur in the future.
Furthermore, for the first time, it was demonstrated that photogrammetric processing is appropriate for declassified satellite imagery provided by USGS. In order to map the diachronic evolution of a coastline, diverse remote sensing data can be combined. UAVs can be successfully combined with other remote sensing data and have proven to be a very cheap, accurate, and flexible method for coastline monitoring.

Author Contributions

Conceptualization, Konstantinos Nikolakopoulos; methodology, Konstantinos Nikolakopoulos and Vasiliki Zygouri; software, Konstantinos Nikolakopoulos, Aggeliki Kyriou, Vasiliki Zygouri, and Dionysios Apostolopoulos; validation, Konstantinos Nikolakopoulos, Aggeliki Kyriou, and Vasiliki Zygouri; field work, Konstantinos Nikolakopoulos, Ioannis Koukouvelas, Vasiliki Zygouri, and Aggeliki Kyriou; data curation, Aggeliki Kyriou, Vasiliki Zygouri, and Dionysios Apostolopoulos; writing—original draft preparation, Konstantinos Nikolakopoulos, Ioannis Koukouvelas, and Vasiliki Zygouri; writing—review and editing, Konstantinos Nikolakopoulos, Ioannis Koukouvelas, and Vasiliki Zygouri; project administration, Konstantinos Nikolakopoulos and Ioannis Koukouvelas.

Funding

This research received no external funding.

Acknowledgments

The authors would like to thank the “EnCeladus” Hellenic Supersite (http://www.earthobservations.org/gsnl.php) for the Pleiades data provision and the National Greek Cadastre and Mapping Agency for the orthomosaics of 1945 and 2008 offer in the frame of the current study.

Conflicts of Interest

The authors declare no conflict of interest.

References

  1. Lavalle, C.; Rocha, G.C.; Baranzelli, C.; Batista e Silva, F. Coastal Zones Policy Alternatives Impacts on European Coastal Zones 2000–2050. JRC-IES: European Union’s policies: Luxembourg, Luxembourg. 2011. Available online: http://www.jrc.ec.europa.eu/ (accessed on 29 September 2019).
  2. Boak Elizabeth, H.; Ian, L. Turner Shoreline Definition and Detection: A Review. J. Coast. Res. 2005, 21, 688–703. [Google Scholar] [CrossRef]
  3. Feagin, R.A.; Barbier, E.B.; Koch, E.W.; Silliman, B.R.; Hacker, S.D.; Wolanski, E.; Primavera, J.; Granek, E.F.; Polasky, S.; Aswani, S.; et al. Vegetation’s role in coastal protection. Science 2008, 320, 176–177. [Google Scholar] [CrossRef]
  4. Bird, E.C.E. Beach Management; John Wiley & Sons: Chichester, UK, 1996. [Google Scholar]
  5. Luijendijk, A.; Hagenaars, G.; Ranasinghe, R.; Baart, F.; Donchyts, G.; Aarninkhof, S. The state of the World’s Beaches. Sci. Rep. 2018, 8, 6641. [Google Scholar] [CrossRef]
  6. Robert, D.; Bruce, H.; Jeffrey, H. A new photogrammetric method for determining shoreline erosion. Coast. Eng. 1978, 2, 21–39. [Google Scholar] [CrossRef]
  7. Tigny, V.; Ozer, A.; De Falco, G.; Baroli, M.; Djenidi, S. Relationship between the Evolution of the Shoreline and the Posidonia oceanica Meadow Limit in a Sardinian Coastal Zone. J. Coast. Res. 2007, 23, 787–793. [Google Scholar] [CrossRef]
  8. Pasqualini, V.; Pergent-Martini, C.; Clabaut, P.; Marteel, H.; Petgent, G. Integration of Aerial Remote Sensing, Photogrammetry, and GIs Technologies in Seagrass Mapping. Photograrnmetric Eng. Remote Sens. 2001, 67, 99–105. [Google Scholar]
  9. Esmail, M.; Mahmod, W.E.; Fath, H. Assessment and prediction of shoreline change using multi-temporal satellite images and statistics: Case study of Damietta coast, Egypt. Appl. Ocean. Res. 2019, 82, 274–282. [Google Scholar] [CrossRef]
  10. Wenyu, L.; Peng, G. Continuous monitoring of coastline dynamics in western Florida with a 30-Year time series of Landsat imagery. Remote Sens. Environ. 2016, 179, 196–209. [Google Scholar] [CrossRef]
  11. Salghuna, N.N.; Aravind Bharathvaj, S. Shoreline Change Analysis for Northern Part of the Coromandel Coast. Aquat. Procedia 2015, 4, 317–324. [Google Scholar] [CrossRef]
  12. Wang, X.; Liu, Y.; Ling, F.; Liu, Y.; Fang, F. Spatio-Temporal Change Detection of Ningbo Coastline Using Landsat Time-Series Images during 1976–2015. ISPRS Int. J. Geo-Inf. 2017, 6, 68. [Google Scholar] [CrossRef]
  13. Behling, R.; Robert, M.; Sabine, C. Spatiotemporal shoreline dynamics of Namibian coastal lagoons derived by a dense remote sensing time series approach. Int. J. Appl. Earth Obs. Geoinf. 2018, 68, 262–271. [Google Scholar] [CrossRef] [Green Version]
  14. Thior, M.; Dièye, T.; Sané, T.; El Hadj, B.D.; Sy, O.; Cissokho, D.; Demba Ba, B.; Descroix, L. Coastline dynamics of the northern Lower Casamance (Senegal) and southern Gambia littoral from 1968 to 2017. J. Afr. Earth Sci. 2019, 160, 103611. [Google Scholar] [CrossRef]
  15. Di, K.; Wang, J.; Ma, R.; Li, R. Automatic shoreline extraction from high-resolution Ikonos satellite imagery. In Proceedings of the Annual ASPRS Conference, Anchorage, AK, USA, 5–9 May 2003. [Google Scholar]
  16. Sekovski, I.; Stecchi, F.; Mancini, F.; Del Rio, L. Image classification methods applied to shoreline extraction on very High-Resolution multispectral imagery. Int. J. Remote Sens. 2014, 35, 3556–3578. [Google Scholar] [CrossRef]
  17. Nikolakopoulos Konstantinos, G.; Kozarski, D.; Kogkas, S. Coastal areas mapping using UAV photogrammetry. In Proceedings of the SPIE 10428, Earth Resources and Environmental Remote Sensing/GIS Applications VIII, 104280O, Warsaw, Poland, 5 October 2017. [Google Scholar] [CrossRef]
  18. Kaliraj, S.; Chandrasekar, N.; Ramachandran, K.K. Mapping of coastal landforms and volumetric change analysis in the south west coast of Kanyakumari, South India using remote sensing and GIS techniques. Egypt. J. Remote Sens. Space Sci. 2016, 20, 265–282. [Google Scholar] [CrossRef]
  19. Maglione, P.; Parente, C.; Vallario, A. High resolution satellite images to reconstruct recent evolution of domitian coastline. Am. J. Appl. Sci. 2015, 12, 506–515. [Google Scholar] [CrossRef]
  20. Görmüş, K.S.; Kutoǧlu, Ş.H.; Şeker, D.Z.; Özölçer, I.H.; Oruç, M.; Aksoy, B. Temporal analysis of coastal erosion in Turkey: A case study Karasu coastal region. J. Coast. Conserv. 2014, 18, 399–414. [Google Scholar] [CrossRef]
  21. Kim, I.-H.; Lee, H.-S.; Song, D.-S. Time series analysis of shoreline changes in Gonghyunjin and Songjiho Beaches, South Korea using aerial photographs and remotely sensed imagery. J. Coast. Res. 2013, 2, 1415–1420. [Google Scholar] [CrossRef]
  22. Schweitzer, P.N. Modern Average Global Sea-Surface Temperature; US Geological Survey Digital Data Series, USGS Numbered Series, Data Series no. 10; U.S. Dept. of the Interior, U.S. Geological Survey: Reston, VA, USA, 1993.
  23. Ioannis, K.; Nikolakopoulos, K. Use of Landsat TM images for the detection of water outflows in the coastal area of south Attiki Peninsula, Greece. In Proceedings of the SPIE 4881, Sensors, Systems, and Next-Generation Satellites VI, Crete, Greece, 8 April 2003. [Google Scholar] [CrossRef]
  24. Garrity, C. Passive Microwave Remote Sensing of Snow Covered Floating Ice during Spring Conditions in the Arctic and Antarctic; Diss York Univ.: Toronto, ON, Canada, 1991; p. 348. [Google Scholar]
  25. Massom, R.A.; Comiso, J.C.; Worby, A.P.; Lytle, V.I.; Stock, L. Regional classes of sea ice cover in the East Antarctic Pack observed from satellite and in situ data during a winter time period. Remote Sens. Environ. 1999, 68, 61–76. [Google Scholar] [CrossRef]
  26. Howarth, P.J.; Alfoeldi, T.T.; Laframboise, P.; Munday, J.C.; Thompson, K.P.P.; Tomlins, G.F.; Wickware, G.M. Landsat for monitoring hydrologic and coastal change in Canada. In Landsat for Monitoring the Changing Geography of Canada. Can. Cent.; Thompson, M.D., Ed.; Remote Sensing, Energy, Mines and Resour.: Ottawa, ON, Canada, 1982; pp. 7–40. [Google Scholar]
  27. Hanslow, D.J.; Clout, B.; Evans, P.; Coates, B. Islands; Economy, Society and Environment New Zealand Geographical Society Conference Series. Monit. Coast. Chang. Using Photogramm. 1997, 19, 422–426. [Google Scholar]
  28. Toure, S.; Diop, O.; Kpalma, K.; Maiga, A.S. Shoreline Detection using Optical Remote Sensing: A Review. ISPRS Int. J. Geo-Inf. 2019, 8, 75. [Google Scholar] [CrossRef]
  29. Chikhradze, N.; Henriques, R.; Elashvili, M.; Kirkitadze, G.; Janelidze, Z.; Bolashvili, N.; Lominadze, G. Close Range Photogrammetry in the Survey of the Coastal Area Geoecological Conditions (on the Example of Portugal). Earth Sci. 2015, 4, 535–540. [Google Scholar] [CrossRef]
  30. Klemas, V.V. Coastal and Environmental Remote Sensing from Unmanned Aerial Vehicles: An Overview. J. Coast. Res. 2015, 315, 1260–1267. [Google Scholar] [CrossRef] [Green Version]
  31. Marcaccio, J.V.; Markle, C.E.; Chow-Fraser, P. Unmanned aerial vehicles produce High-Resolution, Seasonally-Relevant imagery for classifying wetland vegetation. Int. Arch. Photogramm. Remote Sens. Spat. Inf. Sci.-ISPRS Arch. 2015, 40, 249–256. [Google Scholar] [CrossRef]
  32. Papakonstantinou, A.; Topouzelis, K.; Pavlogeorgatos, G. Coastline Zones Identification and 3D Coastal Mapping Using UAV Spatial Data. ISPRS Int. J. Geo-Inf. 2016, 5, 75. [Google Scholar] [CrossRef]
  33. Drummond, C.D.; Harley, M.D.; Turner, I.L.; Matheen, A.N.A.; Glamore, W.C. UAV applications to coastal engineering. In Proceedings of the Aust. Coasts Ports 2015 Conf., Auckland, New Zealand, 15–18 September 2015; pp. 0–6. [Google Scholar]
  34. Bay, N.; Park, N. UAV Monitoring of Dune Dynamics-Anna Bay Entrance; Stockton Bight. In Proceedings of the NSW Coastal Conference, Coffs Harbour, Australia, 9–11 November 2016; pp. 1–22. [Google Scholar]
  35. Amos, D.A.N. Monitoring Mixed Sand and Gravel Beaches Using Unmanned Aerial Systems. In Proceedings of the Coast. Sediments 2015, San Diego, CA, USA, 11–15 May 2015; pp. 1–13. [Google Scholar]
  36. Turner, I.L.; Harley, M.D.; Drummond, C.D. UAVs for coastal surveying. Coast. Eng. 2016, 114, 19–24. [Google Scholar] [CrossRef]
  37. Alain, M.; Becker, M.; Benveniste, J.; Cazenave, A. White Paper on Monitoring the evolution of coastal zones under various forcing factors using Space-Based observing systems. In Proceedings of the International Space Science Institute (ISSI) Forum, Bern, Switzerland, 11–12 October 2016; pp. 1–38. [Google Scholar]
  38. Jamie, G.; Barlow, J.; Moore, R. Detection and analysis of mass wasting events in chalk sea cliffs using UAV photogrammetry. Eng. Geol. 2019, 250, 101–112. [Google Scholar] [CrossRef] [Green Version]
  39. Chen, B.; Yang, Y.; Wen, H.; Ruan, H.; Zhou, Z.; Luo, K.; Zhong, F. High-Resolution monitoring of beach topography and its change using unmanned aerial vehicle imagery. Ocean. Coast. Manag. 2018, 160, 103–116. [Google Scholar] [CrossRef]
  40. Valderrama-Landeros, L.; Flores-de-Santiago, F. Assessing coastal erosion and accretion trends along two contrasting subtropical rivers based on remote sensing data. Ocean. Coast. Manag. 2019, 169, 58–67. [Google Scholar] [CrossRef]
  41. Pauline, L.; Jaud, M.; Grandjean, P.; Ammann, J.; Costa, S.; Maquaire, O.; Davidson, R.; Le Dantec, N.; Delacourt, C. Examining High-Resolution survey methods for monitoring cliff erosion at an operational scale. GIScience Remote. Sens. 2018, 55, 457–476. [Google Scholar] [CrossRef]
  42. Pantanahiran, W. Using remote sensing data for calculating the coastal erosion in southern Thailand. Int. Arch. Photogramm. Remote Sens. Spat. Inf. Sci. 2019, XLII-3/W7, 51–56. [Google Scholar] [CrossRef]
  43. Prasita, V.D. Determination of Shoreline Changes from 2002 to 2014 in the Mangrove Conservation Areas of Pamurbaya Using GIS. Procedia Earth Planet. Sci. 2015, 14, 25–32. [Google Scholar] [CrossRef] [Green Version]
  44. Saci, K.; Boutiba, M.; Guendouz, M. Mohamed Said Guettouche, DalilaKhelfani, Detection and analysis of shoreline changes using geospatial tools and automatic computation: Case of Jijelian sandy coast (East Algeria). Ocean. Coast. Manag. 2016, 132, 46–58. [Google Scholar] [CrossRef]
  45. Mann, T.; Westphal, H. Assessing Long-Term Changes in the Beach Width of Reef Islands Based on Temporally Fragmented Remote Sensing Data. Remote Sens. 2014, 6, 6961–6987. [Google Scholar] [CrossRef] [Green Version]
  46. Helene, B.; French, J. Understanding coastal change using shoreline trend analysis supported by cluster-based segmentation. Geomorphology 2017, 282, 131–149. [Google Scholar]
  47. Ford, M. Shoreline changes interpreted from Multi-Temporal aerial photographs and high resolution satellite images: Wotje Atoll, Marshall Islands. Remote Sens. Environ. 2013, 135, 130–140. [Google Scholar] [CrossRef]
  48. Ford, M.R.; Kench, P.S. Multi-decadal shoreline changes in response to sea level rise in the Marshall Islands. Anthropocene 2015, 11, 14–24. [Google Scholar] [CrossRef] [Green Version]
  49. Salim, F.Z.; El Habti, M.Y.; Hamman, L.-H.K.B.; Raissouni, A.; El Arrim, A. Application of a Geomatics Approach for the Diachronic Study of the Meditterannean Coastline Case of Tangier Bay. Int. J. Geosci. 2018, 9, 320–336. [Google Scholar] [CrossRef] [Green Version]
  50. Poli, D.; Remondino, F.; Angiuli, E.; Agugiaro, G. Radiometric and geometric evaluation of GeoEye-1, WorldView-2 and Pleiades-1A stereo images for 3D information extraction. ISPRS J. Photogramm. Remote Sens. 2015, 100, 35–47. [Google Scholar] [CrossRef]
  51. Perko, R.; Raggam, H.; Gutjahr, K.H.; Schardt, M. Advanced DTM generation from Very High-Resolution Satellite stereo images. ISPRS Ann. Photogramm. Remote Sens. Spat. Inf. Sci. 2015, II-3/W4, 165–172. [Google Scholar] [CrossRef]
  52. Bagnardi, M.; Gonzalez, P.J.; Hooper, A. High-Resolution digital elevation model from Tri-Stereo Pleiades-1 satellite imagery for lava flow volume estimates at Fogo Volcano. Geophys. Res. Lett. 2016, 43, 6267–6275. [Google Scholar] [CrossRef]
  53. Berthier, E.; Vincent, C.; Magnússon, E.; Gunnlaugsson, Á.Þ.; Pitte, P.; Le Meur, E.; Masiokas, M.; Ruiz, L.; Pálsson, F.; Belart, J.M.C.; et al. Glacier topography and elevation changes derived from Pléiades Sub-Meter stereo images. Cryosphere 2014, 8, 2275–2291. [Google Scholar] [CrossRef]
  54. Panagiotakis, E.; Chrysoulakis, N.; Charalampopoulou, V.; Poursanidis, D. Validation of Pleiades Tri-Stereo DSM in Urban Areas. ISPRS Int. J. Geo-Inf. 2018, 7, 118. [Google Scholar] [CrossRef]
  55. Kokkalas, S.; Xypolias, P.; Koukouvelas, I.; Doutsos, T. Postcollisionalcontractional and extensional deformation in the Aegean region. Spec. Pap. Geol. Soc. Am. 2006, 409, 97–123. [Google Scholar] [CrossRef]
  56. Kahle, H.-G.; Müller, M.V.; Geiger, A.; Danuser, G.; Mueller, S.; Veis, G.; Billiris, H.; Paradissis, D. The strain field in the northwestern Greece and the Ionian Islands: Results inferred from GPS measurements. Tectonophysics 1995, 249, 41–52. [Google Scholar] [CrossRef]
  57. Louvari, E.; Kiratzi, A.A.; Papazachos, B.C. The Cephalonia Transform Fault and its extension to western Lefkada island. Tectonophysics 1999, 308, 223–236. [Google Scholar] [CrossRef]
  58. Papazachos, B.C.; Papazachou, C.C. The Earthquakes of Greece; Ziti Publication Co.: Thessaloniki, Greece, 1997. [Google Scholar]
  59. Papadopoulos, G.A.; Karastathis, V.K.; Koukouvelas, I.; Sachpazi, M.; Baskoutas, I.; Chouliaras, G.; Agalos, A.; Daskalaki, E.; Minadakis, G.; Moshou, A.; et al. The Cephalonia, Ionian Sea (Greece), sequence of strong earthquakes of January–February 2014: A first report. Res. Geophys. 2014, 4, 5441. [Google Scholar] [CrossRef]
  60. Fokaefs, A.; Papadopoulos, G.A. Historical earthquakes in the region of Lefkada Island, Ionian Sea–Estimation of magnitudes from epicentral intensities. Bull. Geol. Soc. Greece 2004, 36, 1389–1395. [Google Scholar] [CrossRef]
  61. Papadopoulos, G.; Karastathis, V.; Ganas, A.; Pavlides, S.; Fokaefs, A.; Orfanogiannaki, K. The LefkadaIonian sea (Greece), Shock (Mw6.2) of 14 August 2003: Evidence for the characteristic earthquake from seismicity and ground failures. Earth Planets Space 2003, 55, 713–718. [Google Scholar] [CrossRef]
  62. Sokos, E.; Zahradnik, J.; Gallovic, F.; Serpetsidaki, A.; Plicka, V.; Kiratzi, A. Asperity break after 12 years: The Mw6.4 2015 Lefkada(Greece) earthquake. Geophys. Res. Lett. 2016, 43, 6137–6145. [Google Scholar] [CrossRef]
  63. Zygouri, V.; Koukouvelas, I. Techniques of rockfall inventory in earthquake prone rock slopes. Bull. Seism. Soc. Greece 2016, 50, 1756–1765. [Google Scholar] [CrossRef]
  64. Papadopoulos, G.; Agalos, A.; Biocchini, G.M.; Chousianitis, K.; Karastathis, V.; Triantafyllou, I.; Kontoes, C.; Papoutsis, I.; Svigkas, N.; Koukouvelas, I.; et al. The Mw6.5 earthquake of 17 November 2015 in Lefkada Island and the seismotectonics in the Cephalonia Transform Fault (Ionian Sea, Greece). Geophys. Res. Abstr. 2016, 18, EGU2016-9041-1. [Google Scholar]
  65. Tsangaratos, P.; Loupasakis, C.; Nikolakopoulos, K.; Angelitsa, V.; Ilia, I. Developing a landslide susceptibility map based on remote sensing, fuzzy logic and expert knowledge of the Island of Lefkada, Greece. Environ. Earth Sci. 2018, 77, 363. [Google Scholar] [CrossRef]
  66. Cushing, M. Evolution structurale de la marge nord ouest hellénique dans l’ île de Levkas et ses environs (Grèce nord occidentale). In Thèse 3me Cycle; Univ. de Paris-Sud: Paris, France, 1985. [Google Scholar]
  67. Rondoyanni, T.; Mettos, A.; Paschos, P.; Georgiou, C. Neotectonic Map of Greece, Scale 1:100.000; Lefkada sheet. I.G.M.E.: Athens, Greece, 2007. [Google Scholar]
  68. Papazachos, B.C.; Karakostas, V.G.; Papazachos, C.B.; Scordilis, E.M. The geometry of the Wadati-Benioff zone and lithospheric kinematics in the Hellenic arc. Tectonophysics 2000, 319, 275–300. [Google Scholar] [CrossRef]
  69. Karakostas, V.; Papadimitriou, E.; Patias, P.; Georgiadis, C. Coastal deformation in Lefkada Island associated with strong earthquake occurrence. Bolletino Geofis. Appl. 2019, 60, 1–16. [Google Scholar]
  70. Declassified Intelligence Satellite Photographs. FS 2008-3054. Geological Survey (U.S.); 2008. Available online: https://pubs.usgs.gov/fs/2008/3054/pdf/fs2008-3054.pdf (accessed on 29 September 2019).
  71. Nikolakopoulos Konstantinos, G.; Kavoura, K.; Sabatakakis, N.; Vaiopoulos, A.D. Fusion of declassified airphotos and Landsat MSS data for old landslides detection. In Proceedings of the SPIE 9245, Earth Resources and Environmental Remote Sensing/GIS Applications V, 92450E, Amsterdam, The Netherlands, 23 October 2014. [Google Scholar] [CrossRef]
  72. Schenk, T.; Csatho, B.; Shin, S.W. Rigorous panoramic camera model for DISP Imagery. In Proceedings of the Joint ISPRS/EARSeL Workshop ‘High Resolution Mapping from Space 2003’, Hannover, Germany, 6–8 October 2003. [Google Scholar]
  73. Sohn, H.G.; Kim, G.H.; Yom, J.H. Mathematical modelling of historical reconnaissance Corona KH-4B Imagery. Photogramm. Rec. 2004, 19, 51–66. [Google Scholar] [CrossRef]
  74. Centre National d’Etudes Spatiales (CNES). 2016. Available online: https://pleiades.cnes.fr/en/PLEIADES/index.htm (accessed on 10 May 2018).
  75. Nikolakopoulos, K.G.; Soura, K.; Koukouvelas, I.K. Argyropoulos, N.G. UAV vs classical aerial photogrammetry for archaeological studies. J. Archaeol. Sci. Rep. 2017, 14, 758–773. [Google Scholar] [CrossRef]
  76. Casana, J.; Cothren, J. Stereo analysis, DEM extraction and orthorectification of CORONA satellite imagery: Archaeological applications from the Near East. Antiquity 2008, 82, 732–749. [Google Scholar] [CrossRef]
  77. Galiatsatos, N.; Donoghue, D.N.M.; Philip, G. High resolution elevation data derived from stereoscopic CORONA imagery with minimal ground control: An approach using IKONOS and SRTM data. Photogramm. Eng. Remote Sens. 2008, 74, 1093–1106. [Google Scholar] [CrossRef]
  78. Altmaier, A.; Kany, C. Digital surface model generation from CORONA satellite images. ISPRS J. Photogramm. Remote Sens. 2002, 56, 221–235. [Google Scholar] [CrossRef]
  79. Hamandawana, H.; Eckardt, F.; Ringrose, S. Proposed methodology for georeferencing and mosaicking Corona photographs. Int. J. Remote Sens. 2007, 28, 5–22. [Google Scholar] [CrossRef]
  80. Konstantinos, N.; Pavlopoulos, K.; Chalkias, C.; Manou, D. Monitoring the urban expansion of Athens using remote sensing and GIS techniques in the last 35 years. In Proceedings of the SPIE 5983, Remote Sensing for Environmental Monitoring, GIS Applications, and Geology V, 598309, Bruges, Belgium, 31 October 2005. [Google Scholar] [CrossRef]
  81. Nikolakopoulos, K.; Kavoura, K.; Depountis, N.; Kyriou, A.; Argyropoulos, N.; Koukouvelas, I.; Sabatakakis, N. Preliminary results from active landslide monitoring using multidisciplinary surveys. Eur. J. Remote Sens. 2017, 50, 280–299. [Google Scholar] [CrossRef] [Green Version]
  82. Nikolakopoulos, K.G.; Lampropoulou, P.; Fakiris, E.; Sardelianos, D.; Papatheodorou, G. Synergistic Use of UAV and USV Data and Petrographic Analyses for the Investigation of Beachrock Formations: A Case Study from Syros Island, Aegean Sea, Greece. Minerals 2018, 8, 534. [Google Scholar] [CrossRef]
  83. Westoby, M.; Brasington, J.; Glasser, N.F.; Hambrey, M.J.; Reyonds, M.J. ‘Structure–from–Motion’ photogrammetry: A low cost, effective tool for geoscience applications. Geomorphology 2012, 179, 300–314. [Google Scholar] [CrossRef]
  84. Thieler, E.R.; Danforth, W.W. Historical shoreline mapping (II): Application of the digital shoreline mapping and analysis systems (DSMS/DSAS) to shoreline change mapping in Puerto Rico. J. Coast. Res. 1994, 10, 600–620. [Google Scholar]
  85. Anfuso, G.; Bowman, D.; Danese, C.; Pranzini, E. Transect based analysis versus area based analysis to quantify shoreline displacement: Spatial resolution issues. Environ. Monit. Assess. 2016, 188, 568. [Google Scholar] [CrossRef] [PubMed]
  86. RajuAedla, G.S.; Dwarakish, D. Venkat Reddy, Automatic Shoreline Detection and Change Detection Analysis of Netravati-GurpurRivermouth Using Histogram Equalization and Adaptive Thresholding Techniques. Aquat. Procedia 2015, 4, 563–570. [Google Scholar] [CrossRef]
  87. Ghionis, G.; Poulos, S.; Verykiou, E.; Karditsa, A.; Alexandrakis, G.; Andris, P. The Impact of an Extreme Storm Event on the Barrier Beach of the Lefkada Lagoon, NE Ionian Sea (Greece). Mediterr. Mar. Sci. 2015, 16, 562–572. [Google Scholar] [CrossRef]
  88. Athanassoulis, G.A.; Skarsoulis, E.K. Wind and Wave Atlas of North-East Mediterranean Sea. Laboratory of Nautical and Marine Hydrodynamics; Hellenic Navy General Staff, Hellenic Army Navy, NTUA: Athens, Greece, 1992; p. 191. [Google Scholar]
  89. Padró, J.-C.; Muñoz, F.-J.; Planas, J.; Pons, X. Comparison of four UAV georeferencing methods for environmental monitoring purposes focusing on the combined use with airborne and satellite remote sensing platforms. Int. J. Appl. Earth Obs. Geoinf. 2019, 75, 130–140. [Google Scholar] [CrossRef]
  90. Rabah, M.; Basiouny, M.; Ghanem, E.; Elhadary, A. Using RTK and VRS in direct geo-referencing of the UAV imagery. NRIAG J. Astron. Geophys. 2018, 7, 220–226. [Google Scholar] [CrossRef] [Green Version]
  91. Ganas, A.; Elias, P.; Bozionelos, G.; Papathanassiou, G.; Avallone, A.; Papastergios, A.; Valkaniotis, S.; Parcharidis, I.; Briole, P. Coseismic deformation, field observations and seismic fault of the 17 November 2015 Mw6.5, lefkada Island, Greece earthquake. Tectonophysics 2016, 687, 210–222. [Google Scholar] [CrossRef]
  92. Laporte-Fauret, Q.; Marieu, V.; Castelle, B.; Michalet, R.; Bujan, S.; Rosebery, D. Low-Cost UAV for High-Resolution and Large-Scale Coastal Dune Change Monitoring Using Photogrammetry. J. Mar. Sci. Eng. 2019, 7, 63. [Google Scholar] [CrossRef]
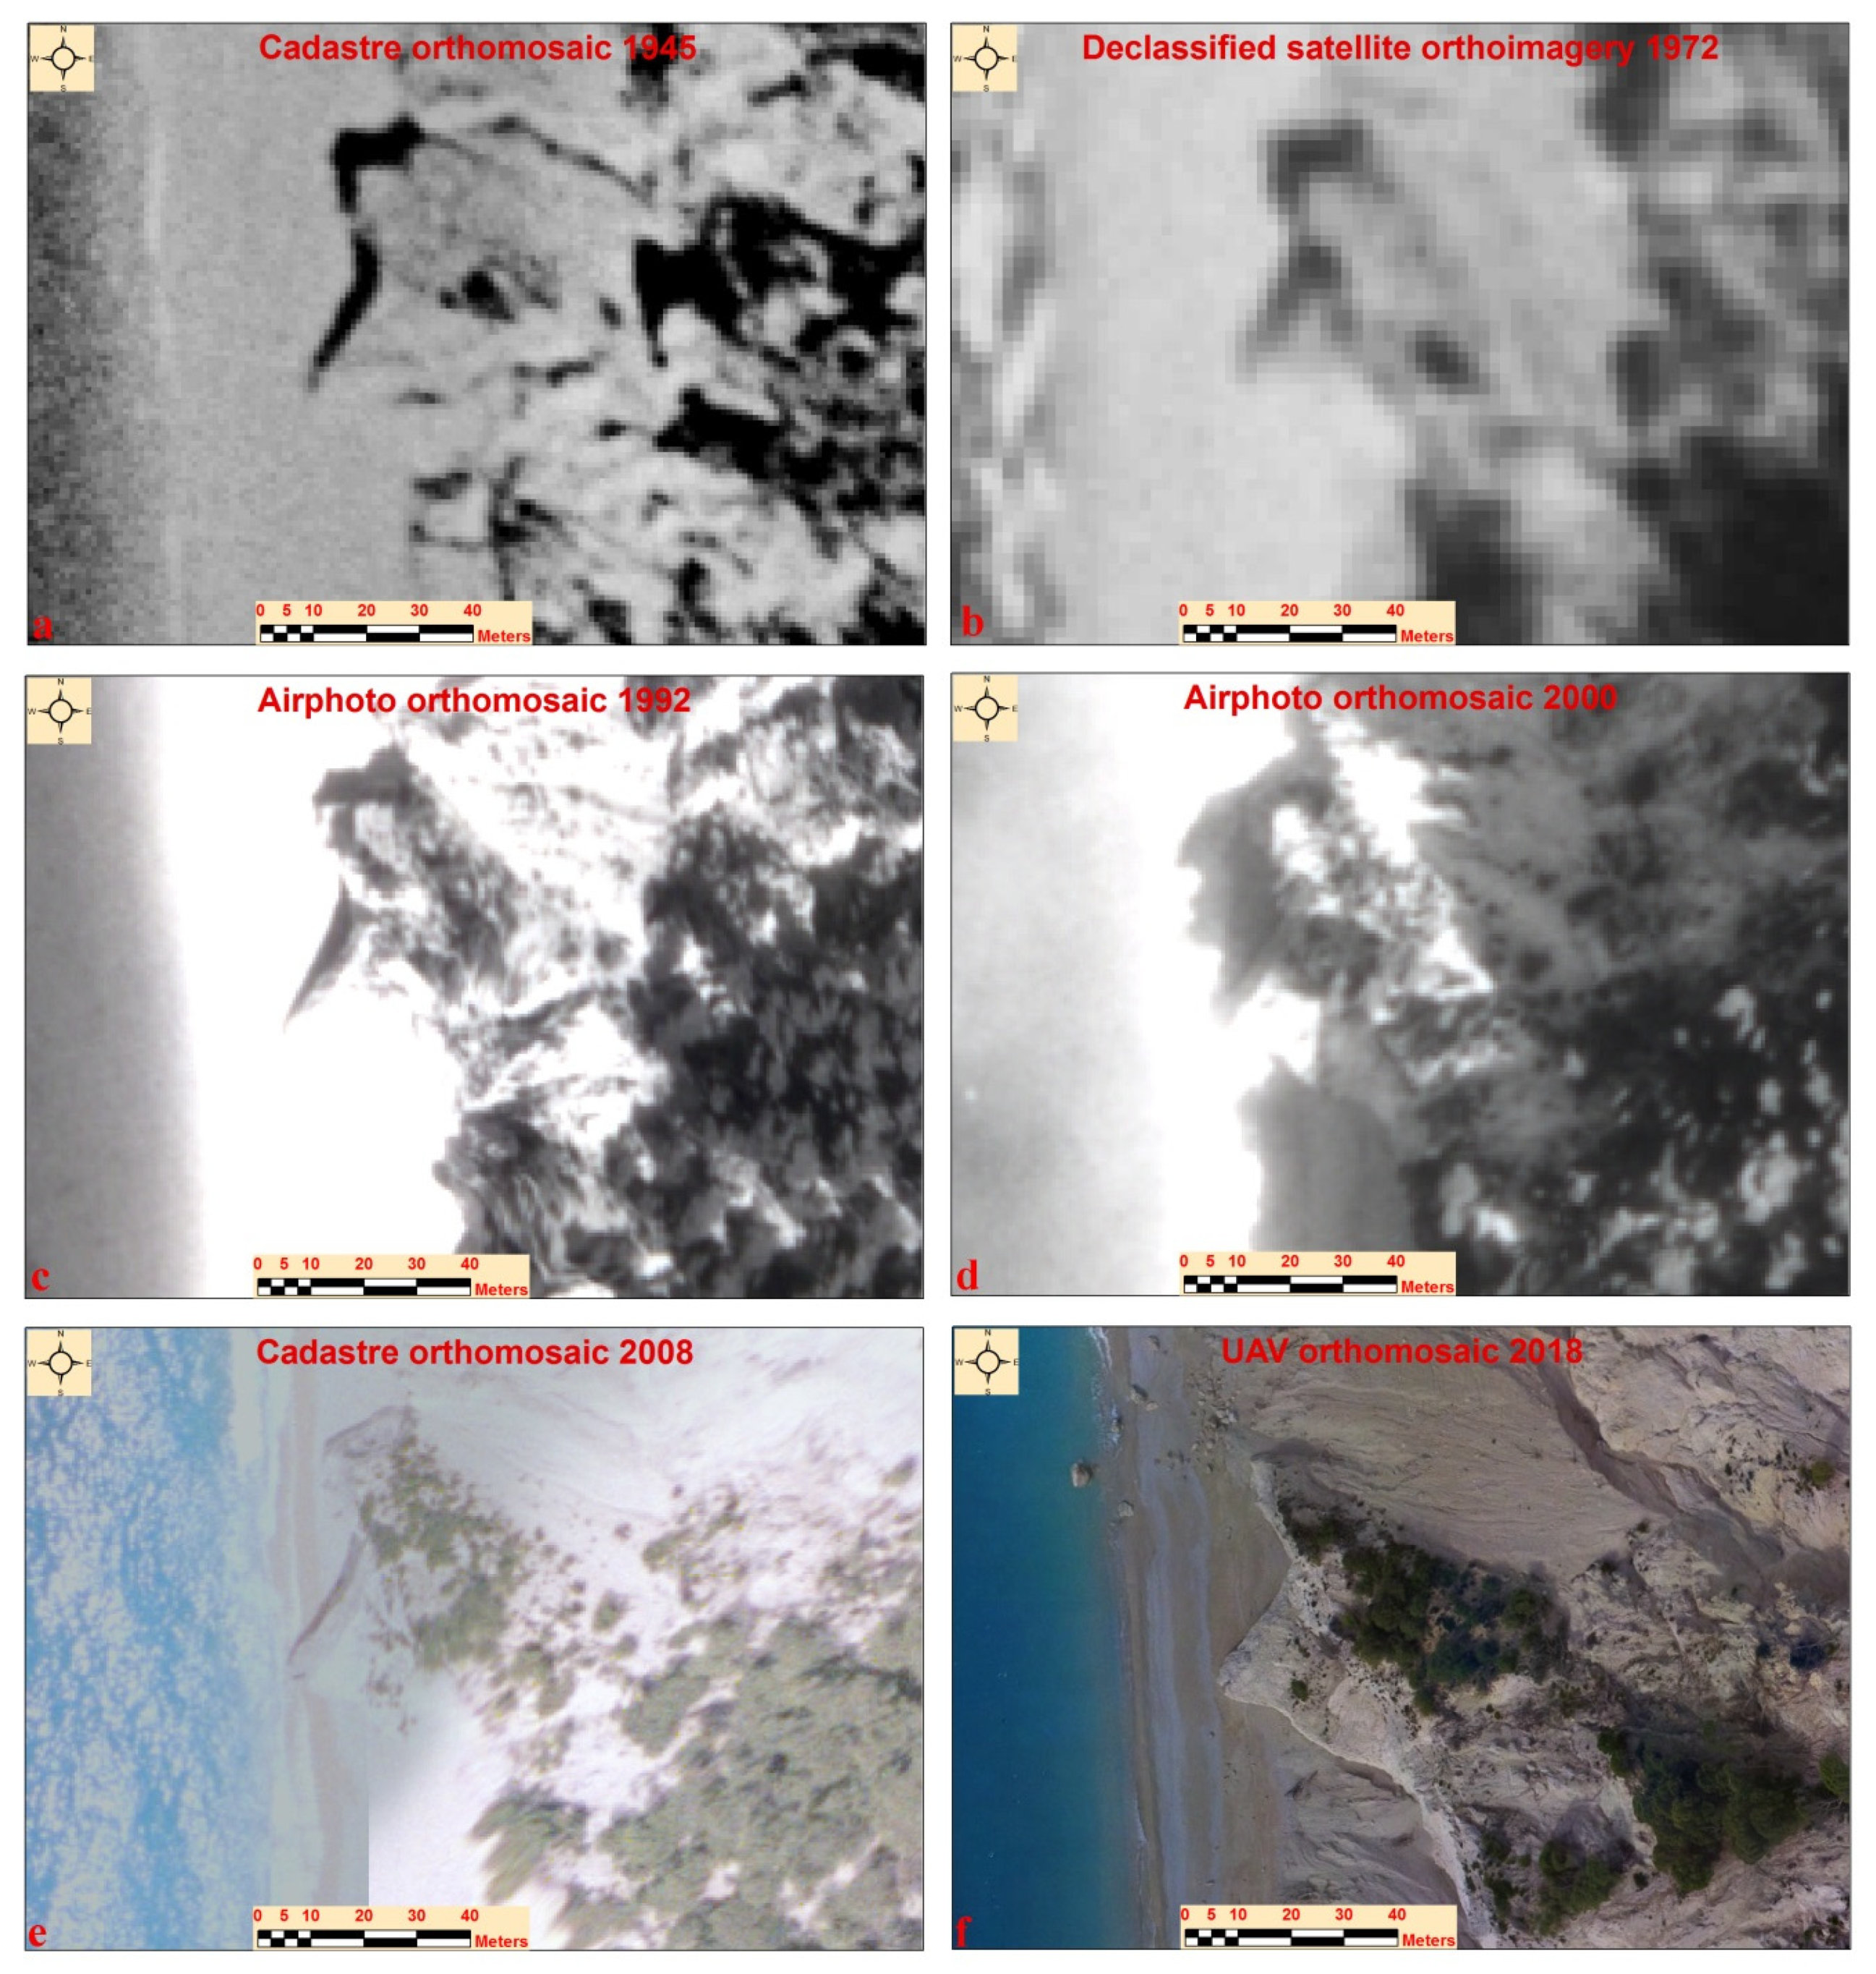
Figure 1. Diachronic images showing a rock outcrop in the central part of the Egremni beach: Note the characteristic erosion and accretion of the shoreline over the years. The scale bar is located at the same point in all the images. (a) Air photo mosaic of 1945. (b) Declassified satellite imagery of 1972. (c) Air photo mosaic of 1992. (d) Air photo mosaic of 2000. (e) Cadastre mosaic of 2008. (f) Unmanned aerial vehicle (UAV) mosaic of 2018.
Ijgi 08 00489 g001
Figure 2. (a) The main structural features that affect the seismotectonics of the Ionian Sea: The stars provide the epicenters of the seismic events presented in Table 1. (b). A simplified display of the main geological characteristics of Lefkada island: The black box delineates the study area.
Ijgi 08 00489 g002
Figure 3. Selection of ground control points during the orthorectification process of the air photos of 2000: (a) Cadastre orthomosaic displaying the study area. (b) One of the air photos of 2000 displaying the study area. (c) Enlargement of Figure 3a. (d). Enlargement of Figure 3b. (e). Focus on one ground control point on the Cadastre orthomosaic. (f) Focus on the respective ground control point on air photo of 2000.
Ijgi 08 00489 g003
Figure 4. Allocation of the ground control points on the declassified satellite imagery.
Ijgi 08 00489 g004
Figure 5. Allocation of the ground control points measured with differential Global Navigation Satellite System (GNSS) receiver on the UAV orthomosaic.
Ijgi 08 00489 g005
Figure 6. An example of the end point rate (ERP) calculation using 1972 and 2000 shorelines at the study area.
Ijgi 08 00489 g006
Figure 7. Flowchart of the algorithm of Digital Shoreline Analysis System (DSAS) v4.3.
Ijgi 08 00489 g007
Figure 8. (a) The study area where the DSAS and semiautomatic processing in geographical information system (GIS) were performed: Orthomosaics from (b) 1972, (c) 2000, and (d) 2016. In red color, a digitized road from the 1972 orthophoto is overlaid in all mosaics.
Ijgi 08 00489 g008
Figure 9. The processing results of DSAS software for the study area: Red colors represent erosion rate per year, while green colors represent accretion rate per year. (a) Six areas where the erosion annual rate overpasses 0.50 m and three large areas where accretion overpasses 0.50 m per year for the period of 1945–1972. (b) Erosion into areas of accretion and vice versa for the period of 1972–2000. (c) One more change from the erosion to accretion trend in comparison with the previous period (1972–2000). (d) Areas where erosion and accretion take place over the period of 1945–2016. (e) Highest erosion overpasses 1.50 m per year observed in the southernmost end of the Egremni beach for the period of 2016–2018. (f) Study area in Lefkada Island.
Ijgi 08 00489 g009
Figure 10. The processing results of the semiautomatic method for Egremni beach: Red colored bars represent total erosion in each transect for the specific time period, while green colored bars represent total accretion for the same time period. The blue triangle states the Egremni rock outcrop shown in Figure 1. The yellow line represents the erosion/accretion rate along the Egremni beach for each time period. N and S are abbreviations for north and south compass points. Each diagram represents a specific time period: (a) 1945–1972 period, (b) 1972–2000 period, (c) 2000–2016 period, (d) 1945–2016 period, and (e) 2016–2018 period.
Ijgi 08 00489 g010
Figure 11. The processing results of the semiautomatic method for Gialos beach: Red colored bars represent total erosion in each transect for the specific time period, while green colored bars represent total accretion for the same time period. The blue triangle states the Gialos reference in Figure 9. The yellow line represents the erosion/accretion rate along the Gialos beach for each time period. N and S are abbreviations for north and south compass points. Each diagram represents a specific time period: (a) 1945–1972 period, (b) 1972–2000 period, (c) 2000–2016 period, and (d) 1945–2016 period.
Ijgi 08 00489 g011
Figure 12. The diachronic evolution of one of the landslides in the overhanging cliff at Egremni beach: From 1945 to 2018, the extent of the landslide almost doubled, offering waste material to Egremni beach. (a) The landslide extent as mapped from the 1945 orthophoto. (b) Multicolor polygons represent the landslide extent at different dates. The background image is from the 2008 Cadastre orthophoto. (c) The landslide extent as mapped from the 2018 UAV orthophoto.
Ijgi 08 00489 g012
Table 1. The most significant earthquakes affecting Lefkada Island during the studied time period. For more information on the earthquakes see References [62,64,68,69].
DateLongitudeLatitudeDepth Mw
22 April 194838.6820.60Unknown6.5
30 June 194838.8020.60Unknown6.4
12 August 195338.3020.80Unknown7.0
30 Years of No Seismicity
17 January 198337.9720.259 km6.5
20 Years of No Seismicity
14 August 200338.7920.5612 km6.3
12 Years of No Seismicity
17 November 201538.6720.6011 km 6.5
Table 2. The datasets used in this study, their source, and their spatial resolution.
DateData TypeSourceReference SystemNumber of PhotosSpatial Resolution
1945Air photo mosaicNational Greek Cadastre and Mapping AgencyGreek GridOrthomosaic1
27/05/1972Declassified satellite imageryUnited States Geological SurveyNo reference system12 m
05/06/1974Declassified satellite imageryUnited States Geological SurveyNo reference system14 m
05/10/1980Declassified satellite imageryUnited States Geological SurveyNo reference system14 m
11/09/1992Analogue air photosHellenic Military Geographical ServiceNo reference system81 m
30/05/2000Analogue air photosHellenic Military Geographical ServiceNo reference system81 m
2008Digital colored air photosNational Greek Cadastre and Mapping AgencyGreek GridOrthomosaic0.5 m
2016Pleiades ImageryEnceladus Greek SupersiteWorld Geodetic System 842 triplets0.5 m
3/11/2018Unmanned Aerial Vehicle ImageryUniversity of PatrasWorld Geodetic System ‘844620.1 m
Table 3. Characteristics of the UAV flight campaign and pixel size of the produced orthophoto and Digital Surface Model.
Flight Campaign Altitude (m)Along the Track Overlap %Across the Track Overlap %Number of PhotosOrthophoto Pixel Size (m)DSM Pixel Size (m)Image Quality (pixel)
6090754624.2 cm8.4 cm3000 × 4000
Table 4. The number of ground control points used in each Leica Photogrammetry Suite block, the respective number of tie points, and the aerial triangulation root mean square errors.
LPS BlockNo of Images No of Ground Control PointsNo of Tie PointsRMSE (m)
Declassified 197215800.0044
Declassified 197414500.0727
Declassified 198013800.1668
Air photo 1992854831.9753
Air photo 2000871921.8602
Pleiades 201661802240.1263
Table 5. Maximum and minimum rates of EPR along the study area.
Maximum/Minimum Rates of EPR (DSAS Method)Maximum/Minimum Rates of Accretion/Erosion (Semiautomatic Processing Method)
PeriodMaximum Rate (m/yr)Minimum Rate (m/yr)Egremni BeachGialos Beach
Maximum Rate (m/yr)Minimum Rate (m/yr)Maximum Rate (m/yr)Minimum Rate (m/yr)
1945–19721.92−1.351.89−1.260.81−1.11
1972–20002.45−2.531.07−2.102.21−1.32
2000–20162.24−5.732.38−5.621.44−1.25
1945–20160.55−1.530.21−2.100.62−0.17