1. Introduction
The wide use of mobile GIS and mobile navigation software has ignited the public’s understanding of the map, location based services, and also led to the development of the Geographic Information System (GIS) [
1,
2,
3]. The GIS operation equipment has grown from the initial personal computer to the servers, mobile phones, professional handsets, and Web terminals. The hardware and operating systems are diversified, which requires a mobile map for rendering engines on different platforms.
Mobile GIS usually adopts plug-in based architecture [
4]. The map data parsing engine and map rendering engine are designed as plug-in mode. Map rending engine is a critical research topic in mobile GIS [
5], including spatial data models, GIS algorithms, optimization strategies, and modeling [
6,
7,
8]. Although the technical development can realize the extended development of map rendering engine in the mobile GIS applications, researchers and developers need to implement a corresponding map rendering engine for different operation systems. A cross-platform map rendering engine is needed for mobile GIS.
The growth of multi-source heterogeneous high-dimensional spatial data and its Web applications is increasing [
9]. Information technologies (IT) such as location based social networks [
10,
11,
12], Virtual Reality (VR), and Augment Reality (AR) are also actively integrating with mobile GIS. The visualization of high-dimensional geospatial data such as oblique photogrammetry, building information model (BIM), and laser point cloud is essential to visualize in mobile GIS. High performance-based rendering methods are needed for mobile GIS with limited memory capabilities and less efficient CPUs.
The main contribution of this study is to propose a high-performance cross-platform map rendering technology as the solution to address the challenges above. Based on OpenGL graphics library, a cross-platform and high-performance map rendering engine (GL engine) is developed to achieve high performance of vector data and raster data as well as a cross-platform rendering method that assures, on different platforms, the consistency of the map rendering style. Map rendering algorithms and methods for rendering are developed to develop a high-performance, cross-platform map rendering engine. A new masking mechanism is proposed to solve the problem of triangulation. The order of magnitude improves the segmentation performance of the polygon and solves the problem of triangulation for the self-intersecting polygon and the island polygon. The texture dictionary caching technology is used to solve the problem that the font data is exchanged in the memory and the cache when the text is drawn, which greatly improves the rendering performance of the text and realizes high-performance annotation text along the line.
2. Related Work
The rendering map features can be decomposed into point features, line features, polygon region features, text features, and image features [
7,
13,
14]. These map related elements are provided in the graphical interface library of the operating system, but the graphics library algorithms and interfaces provided by different operating systems are different, which brings great inconvenience to the drawing of the map in mobile GIS.
There are various geometry-based algorithms for rendering vector data from computer graphics and geo-informatics [
15,
16,
17,
18]. However, most of these geospatial algorithms and spatial models need more space to store the pre-processing result and with high computing capabilities, for example, spatial index data for pre-processing geospatial data and hierarchical road network topologies for route planning. The strategy of map rendering between GIS and mobile GIS is different [
19,
20], because the management of massive geospatial data sets and rendering spatial data on reduced hardware configuration requirements of mobile terminal devices are difficult for mobile GIS.
As the world’s leading provider of GIS products, Esri, its product called ArcGIS has been based on the Windows operating system for a long time. The map rendering engine in ArcGIS on the GDI graphics library is provided by the Windows system, which has caused difficulties for its subsequent cross-platform development. With the increasing demand for cross-platform products, the ArcGIS Runtime SDK product implements different map rendering engines for different operating systems, which is not conducive to the consistency of map rendering effects [
21].
Li implemented a set of cross-platform graphics library (UGraphics) based on the rendering characteristics of the map for related optimization to achieve cross-platform mapping in SuperMap mobile GIS [
22]. The map rendering engine uses a graphics library provided by the operating system. For example, the Windows operating system uses GDI (Graphics Device Interface). The Linux operating system uses XLib, GTK, and Qt. The mobile device Android uses Skia, and the iOS uses Quartz. With the increasing use of mobile hardware and operating systems, this problem is increasingly hard to solve. Li developed a bitmap map rendering engine, which implements the related graphics image algorithm. This map rendering engine solves the reliance on the operating system graphics library and solves the cross-operating system problem. It has been used in SuperMap GIS platform software products for nearly ten years. However, devices such as iPad have the demand for explosive growth of graphics acceleration hardware (GPU) and Web applications. The bitmap map rendering engine cannot use the GPU for the acceleration of map rendering and the bitmap engine has low performance for large-scale data, and does not support map rendering on a web browser.
Anti-Grain Geometry (AGG) is an open source 2D graphics engine [
23]. It provides a set of graphics algorithms that combine subpixel accuracy technology with anti-aliasing technology to achieve high efficiency and high quality 2D graphics processing [
24]. AGG is written in C++ and the standard C Runtime Function. This gives AGG good cross-platform capabilities. Another feature of AGG is its great flexibility. AGG provides a series of loosely coupled algorithms, and all its classes are described by templates. Developers can freely combine, rewrite, and replace some or all of the algorithms to meet their specific graphics operations. Wenfeng Lu et al. compared the GDI/GDI+, Qt, AGG, and other graphics libraries, and ultimately chose AGG [
25], but AGG was difficult to expand development by the complexity of using the template techniques [
24,
26]. The lack of support for GPU graphics acceleration, the mobile property, the Web-based applications, and 3D rendering also restricted the types of applications in Mobile GIS.
Qt is a cross-platform C++ graphical user interface software developed by Trolltech [
27,
28]. Qt is designed with object-oriented programming to make the functions better packaged and modularized. Qt has good cross-platform features and supports Windows, Linux, Mac, Android, iOS, and other operating systems. Qt’s Qpainter strategy provides a suite of drawing API functions, such as drawArc, drawChord, drawEllipse, drawImage, drawLine, and drawText. It also supports path, color gradient, and plane coordinate transformation, which brings a sense of security to the drawing of complex graphics. Qt is rendered based on the FrameBuffer. There is a special service to copy the frame data to the graphics card. Therefore, the rendering efficiency of Qt is relatively high. In order to improve the quality of the drawing characteristics, Qt provides an anti-aliasing strategy to make the drawn graphics more comfortable. Qt is implemented based on OpenGL for 3D graphics rendering. The combination of Qt and GIS are widely used in GIS, including Quantum GIS (QGIS) [
29], Merkopolo [
30], and GIS related applications [
31]. Qt has issues to the map rendering engine for mobile GIS, including GPU graphics acceleration, weak support for mobile applications, lack of support for 3D rendering, and lack of support for web applications.
An API is defined as a set of functions that a client program can call. OpenGL (Open Graphics Library) is a cross-language and cross-platform application programming interface (API) for drawing 2D and 3D vector graphics. The API is typically used to interact with a graphics processing unit (GPU) for hardware accelerated rendering [
32]. The OpenGL specification describes an abstract API for drawing 2D and 3D graphics. Although the API can be implemented entirely in software, its design is primarily implemented on hardware. Although function definitions are similar in appearance to programming language C, they are language independent. Therefore, the OpenGL has many language bindings, the most notable of which is JavaScript binding to WebGL (OpenGL ES 2.0 based API for 3D rendering in a web browser), C binding (WGL, GLX and CGL) [
33,
34], C binding provided by iOS and Java, and C binding provided by Android. In addition to being independent of the language, OpenGL is also cross-platform. The specification does not mention the issue of getting and managing OpenGL contexts, but rather a detail of the underlying windowing system. The OpenGL is purely focused on rendering and does not provide APIs related to input, audio, or windows. OpenGL is characterized with its text rendering, cross-platform graphics rendering, graphics hardware acceleration, Web-based graphics rendering (WebGL), mobile graphics rendering (OpenGL ES), and the issuance of free commercial licenses.
3. Methods
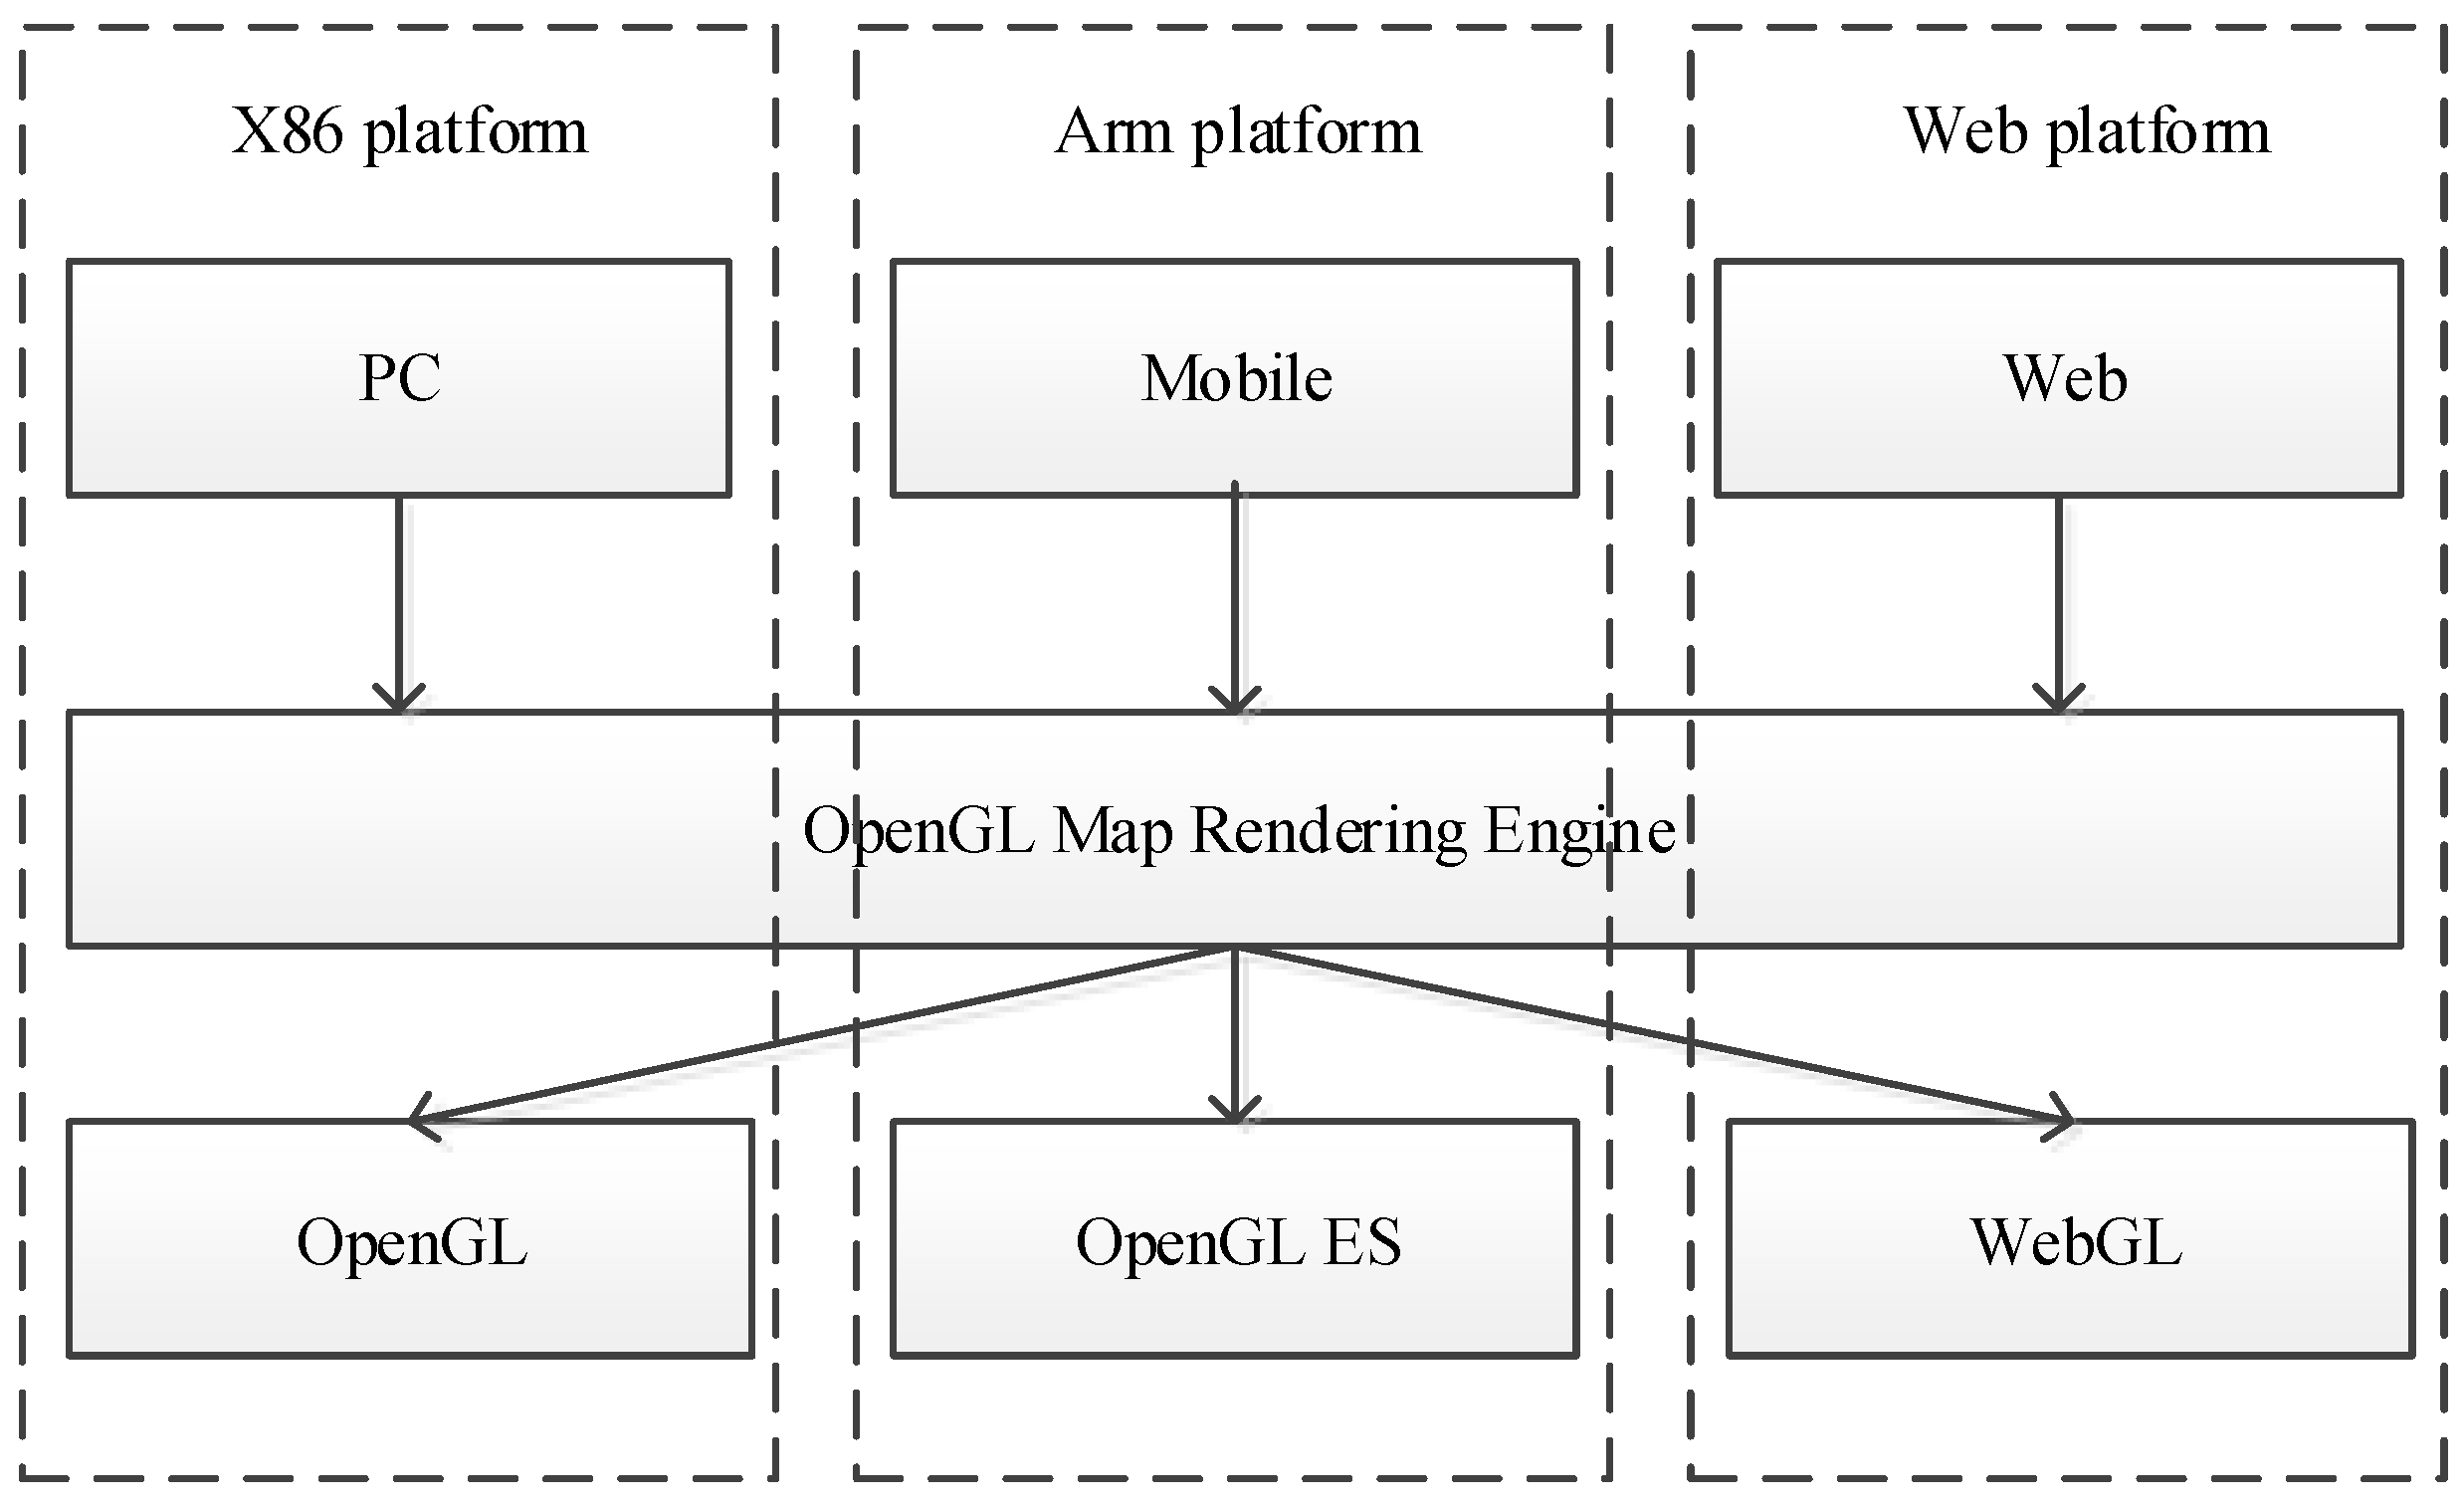
A high-performance cross-platform map rendering engine (Graphics Library map rendering engine, GL map rendering engine) is proposed in this study. The GL map rendering engine is based on the OpenGL graphics library, which realizes the rendering of each element of the map. When the map is rendered, the layers are rendered first, and then the rendered layer is superimposed and rendered, and the complete rendering is completed. The process of map rendering is implemented in a visual studio.
The GL map rendering engine contains a unified map element drawing method and a unified map data docking API. The map rendering engine decomposes the map elements into basic graphic elements. Under different platforms, only the OpenGL graphics library of different systems needs to be called to draw the basic graphic elements (points, lines, polygons, and text), which can form a unified style map and reach different platforms. The specific architecture for the unified map rendering is shown in
Figure 1.
3.1. The Architecture of the Graphics Library Map Rendering Engine
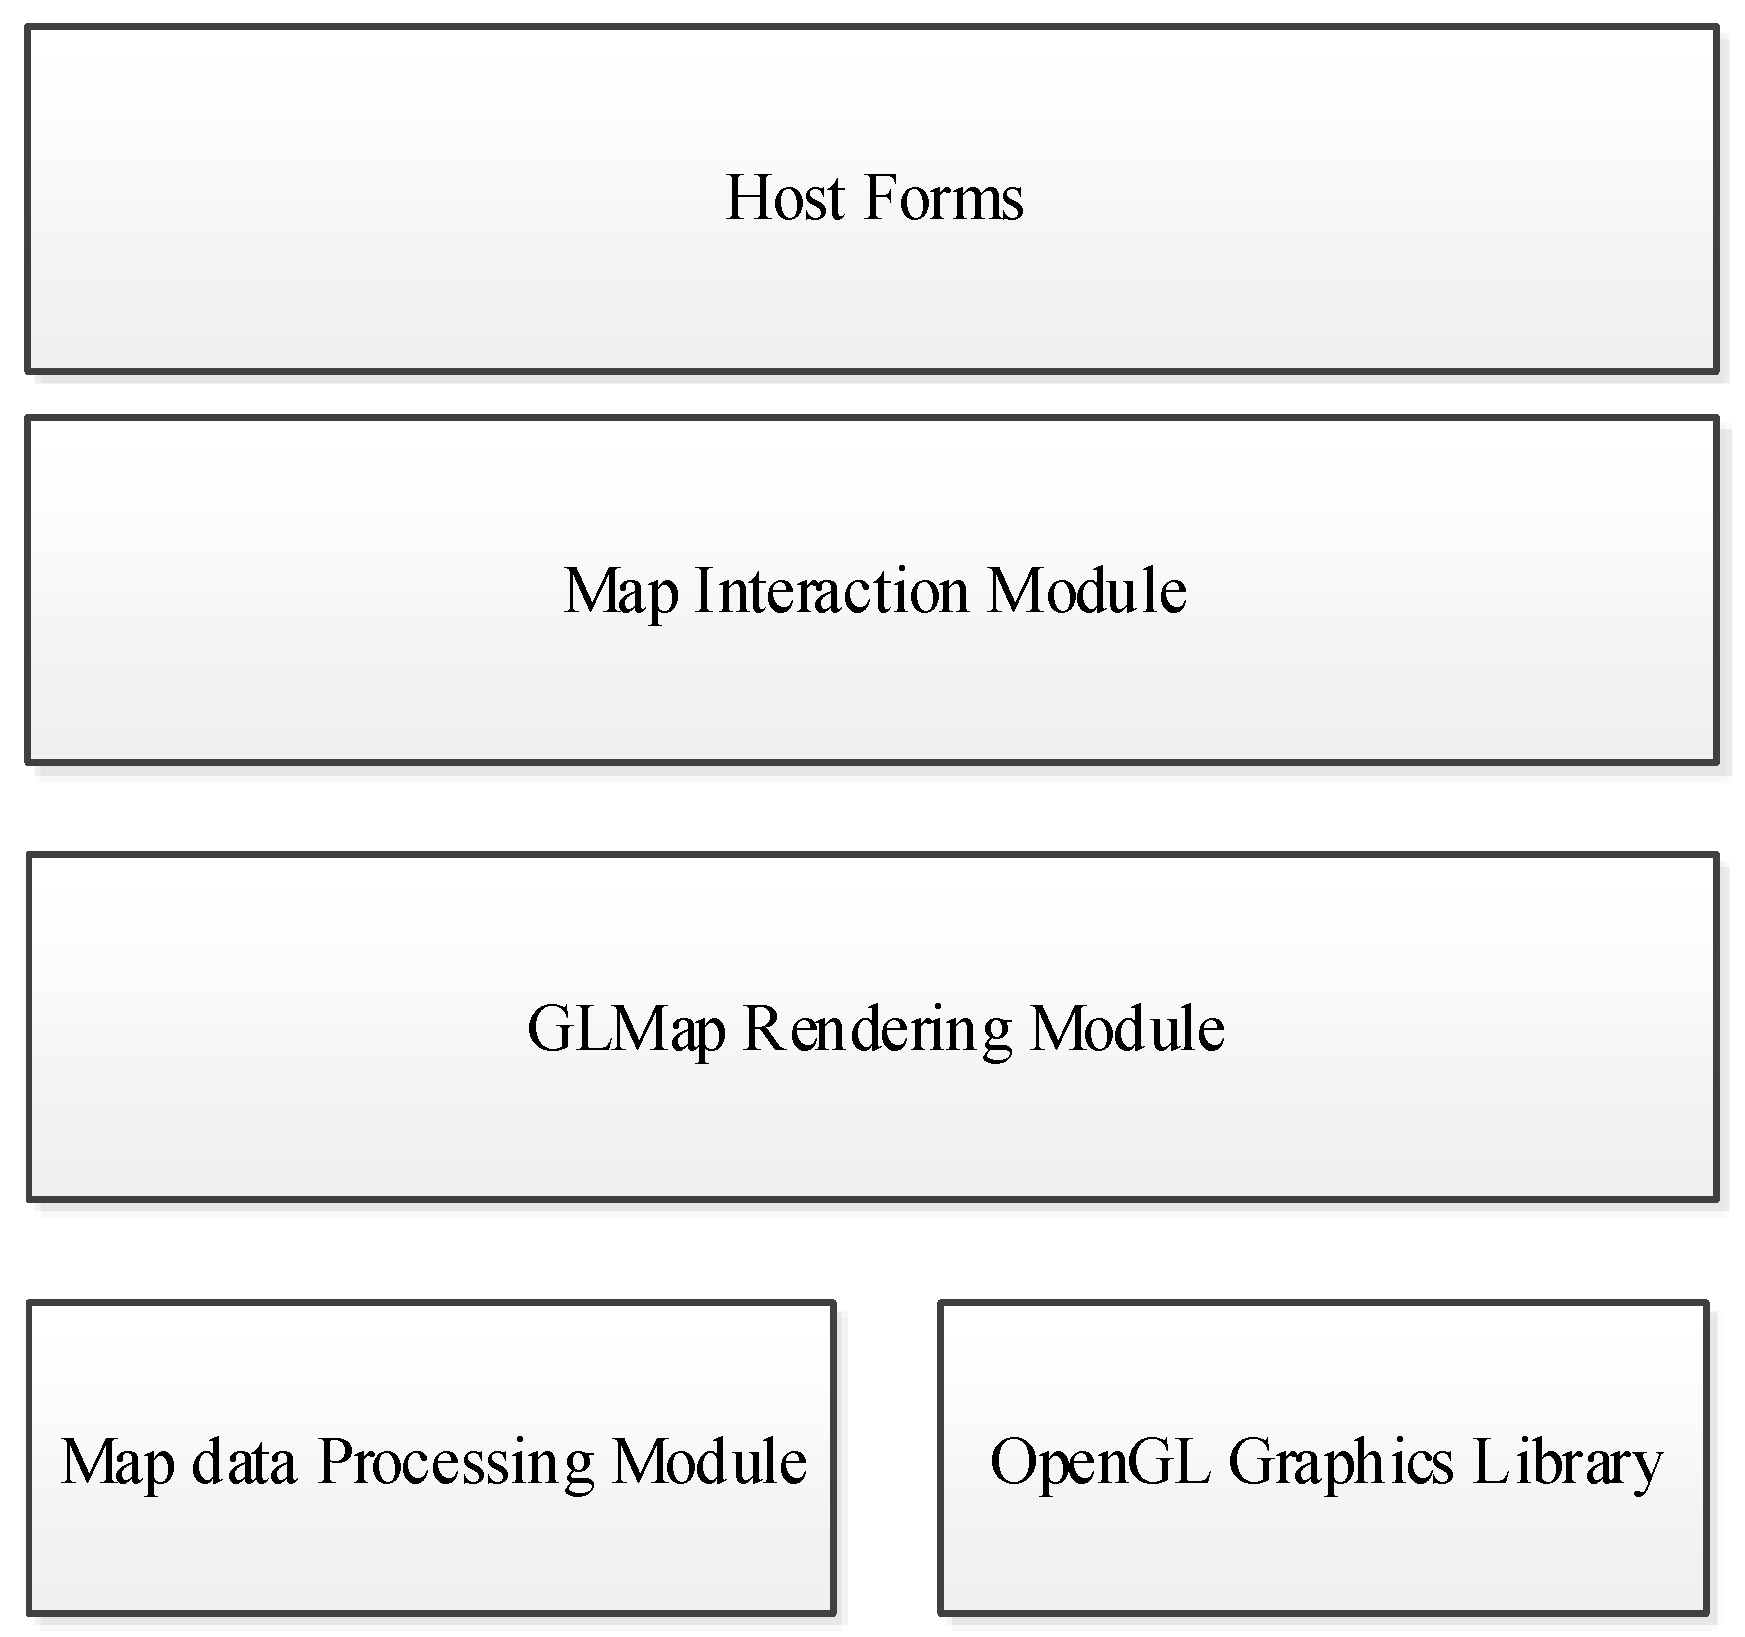
The modules of the GL engine include a map module, an event processing module, a GL rendering module, and a geospatial data processing module (
Figure 2). The geospatial data processing module is responsible for parsing the map data into OpenGL identifiable format and is mainly responsible for triangulating the spatial geometric data, and encoding the position, the color and the similarity in the vector map data into OpenGL render objects (RO). The GL rendering module calls the OpenGL graphics rendering library to render the data as visual data, including parsing the RO array, and by controlling the rendering pipeline to render the map by calling the API to operate the OpenGL state machine. The map results are displayed to the screen through the host system form of the interactive module.
The map interaction module is responsible for rendering the map results to the monitor device or simply a display and accepting the user’s interaction operation. The map interaction module provides an OpenGL display form, supplies various user interactions, including gestures, and handles user interaction operations to generate events. There two ways to respond to events. One way is to add data processing tasks, usually including events with range scale changes and need to display new data. Another way is map redrawing operation.
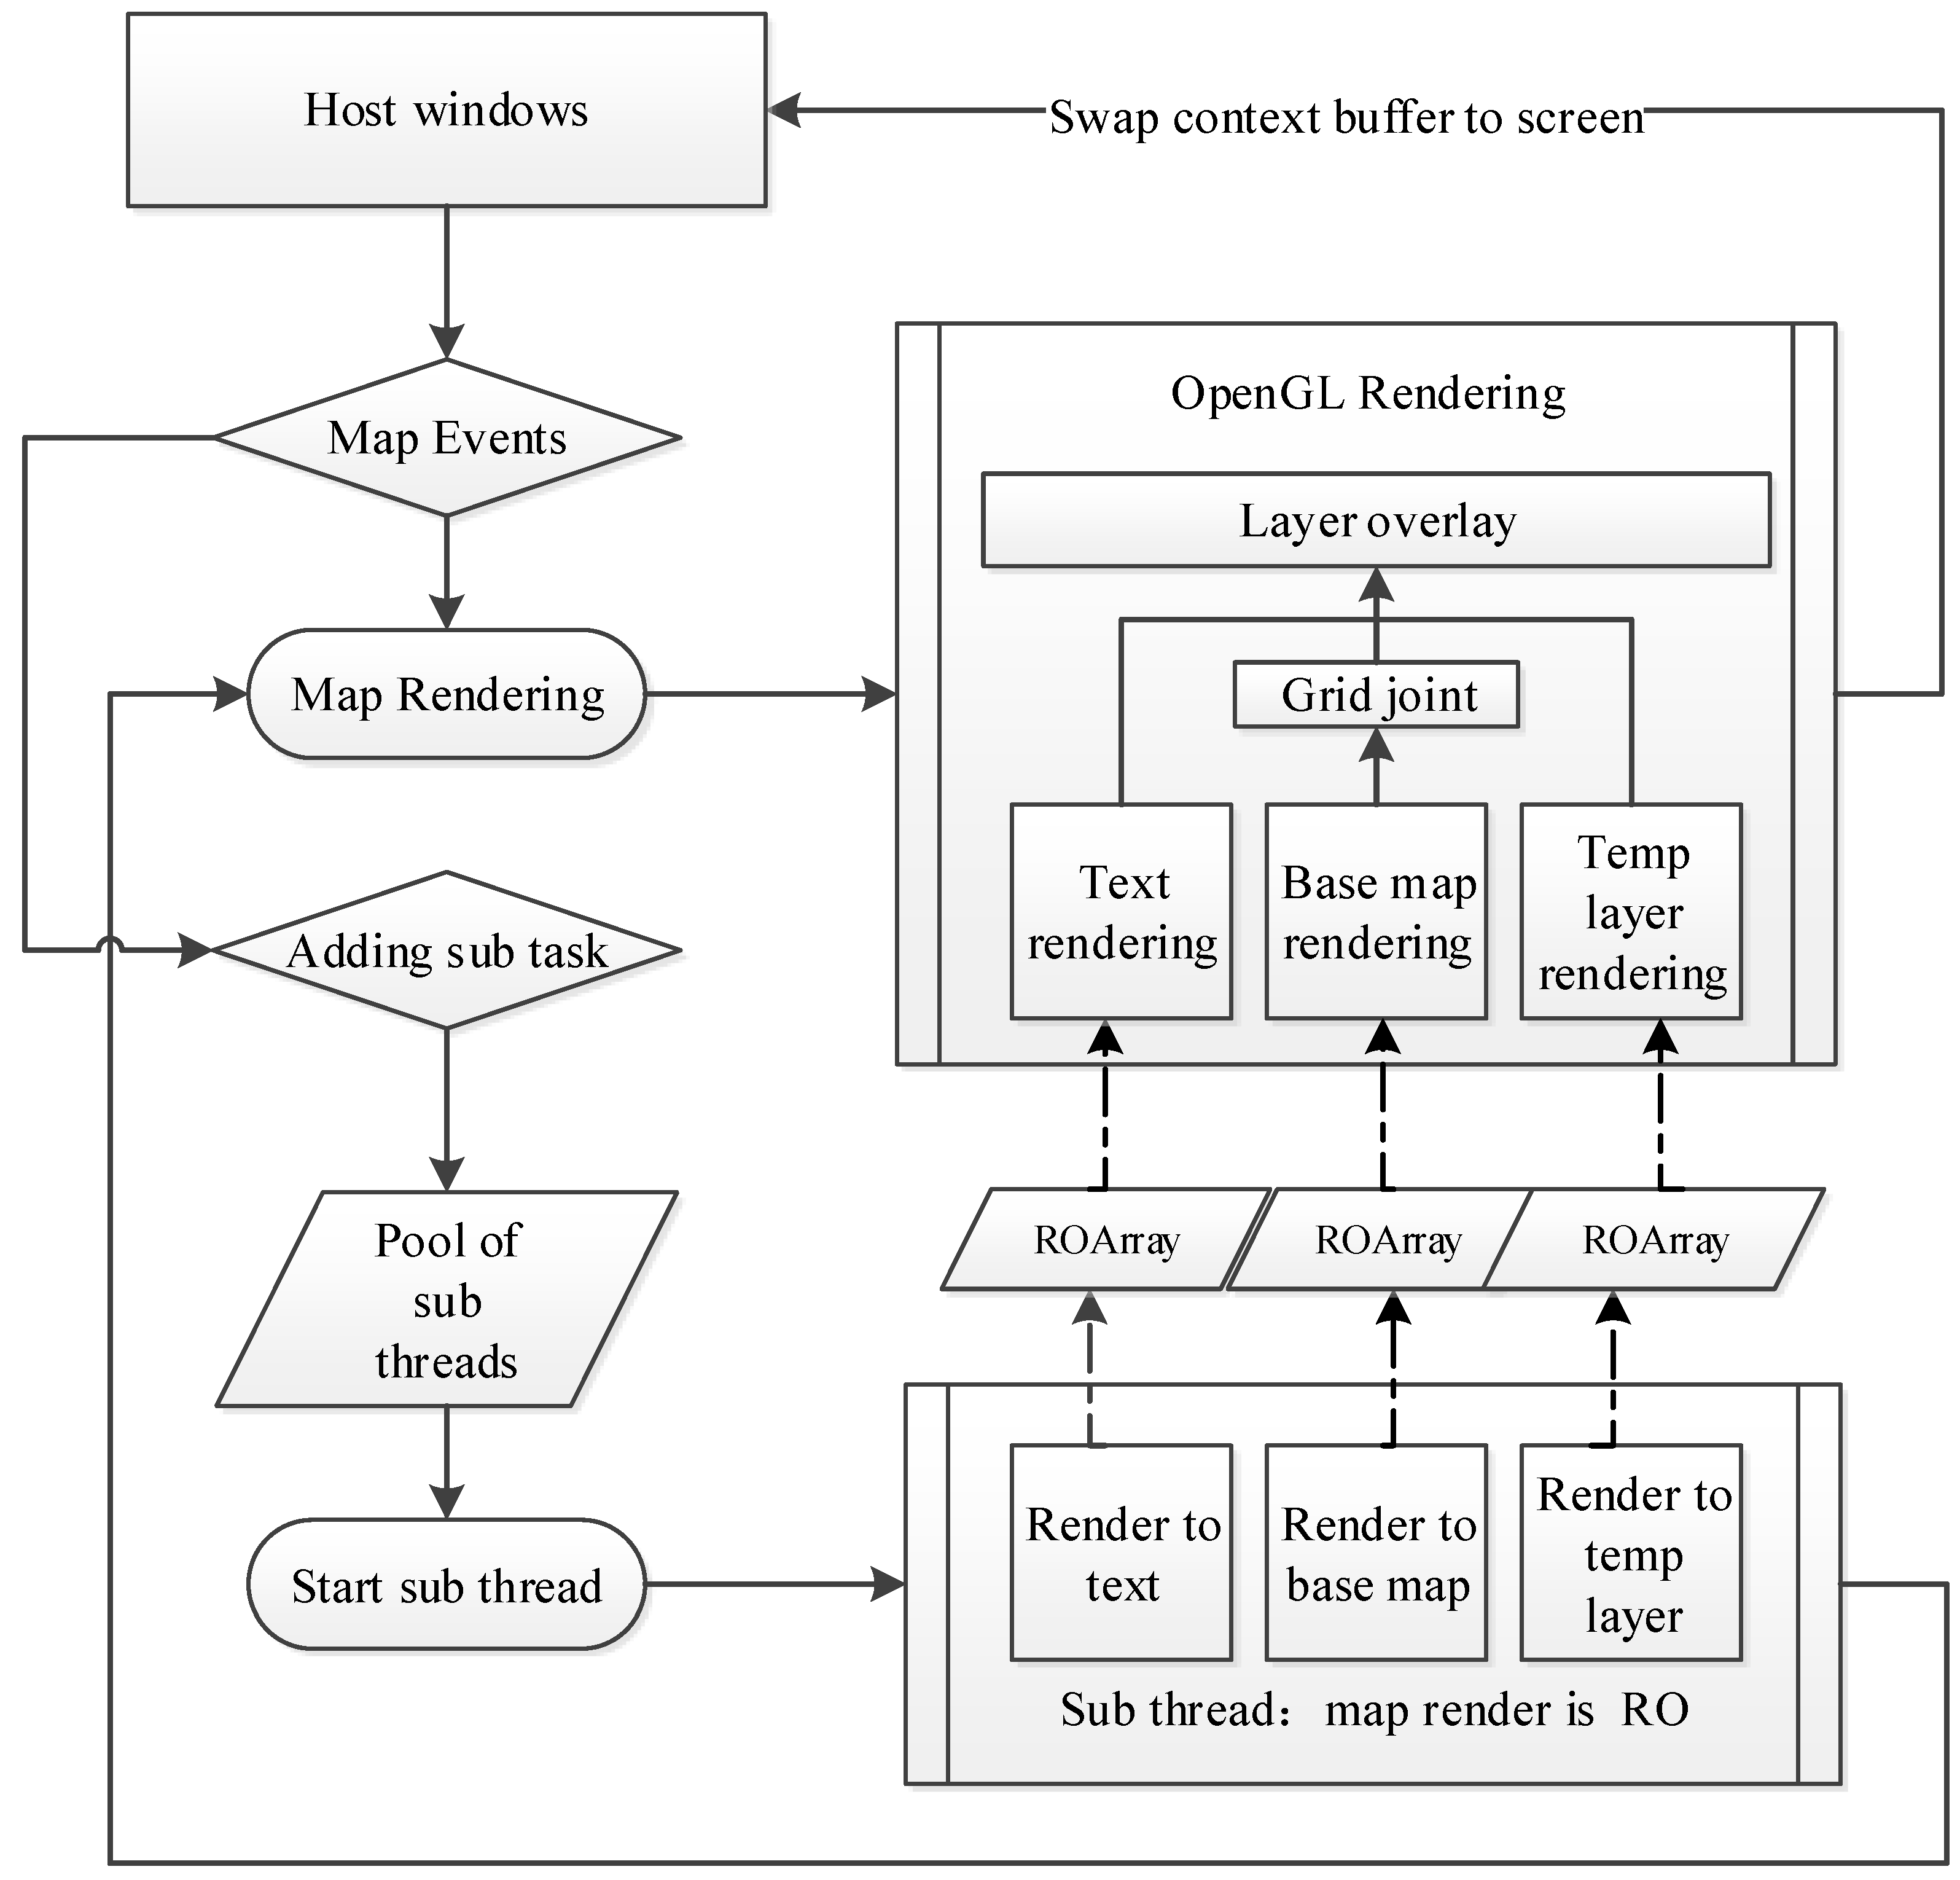
3.2. The Rendering Process for the GL Map Rendering Engine
When the host environment map window changes the mobile GIS, the rendering operation of the map is triggered. The change of the map window mainly includes the initial loading of the map or other application windows to cover the map window, and another change is the interactive operation of the map, such as zooming the map and roaming the map, editing maps and other operations.
The rendering process of the map in Mobile GIS is shown in
Figure 3. When the local map change event is fired, the map enters the rendering process. The map rendering module divides the map into nine grid spaces according to the size range of the current window, and then passes the inner map of the grid space to the child thread for drawing.
The tasks in the child threads pool will be processed in turn. These tasks include reading geospatial data from the geospatial data sets, determining whether the data is in the visible range, cropping, and organizing the data to form a rendering RO. After the sub-thread processing is completed, the redraw operation is called back. The redraw operation is to render the processed RO through the GL function to form a pixel matrix and to render it onto the screen.
3.3. Rendering of Map Elements
In the high-performance rendering process of vector map data, the parts that affect the performance of the GL engine include the rendering of line geometry objects, the rendering of polygon geometry objects, the rendering of text, and the rendering of symbols. This study made special designs for these four types of elements, including wide line splitting drawing technology, surface feature mask drawing technology, dictionary text rendering technology, and texture symbol rendering technology.
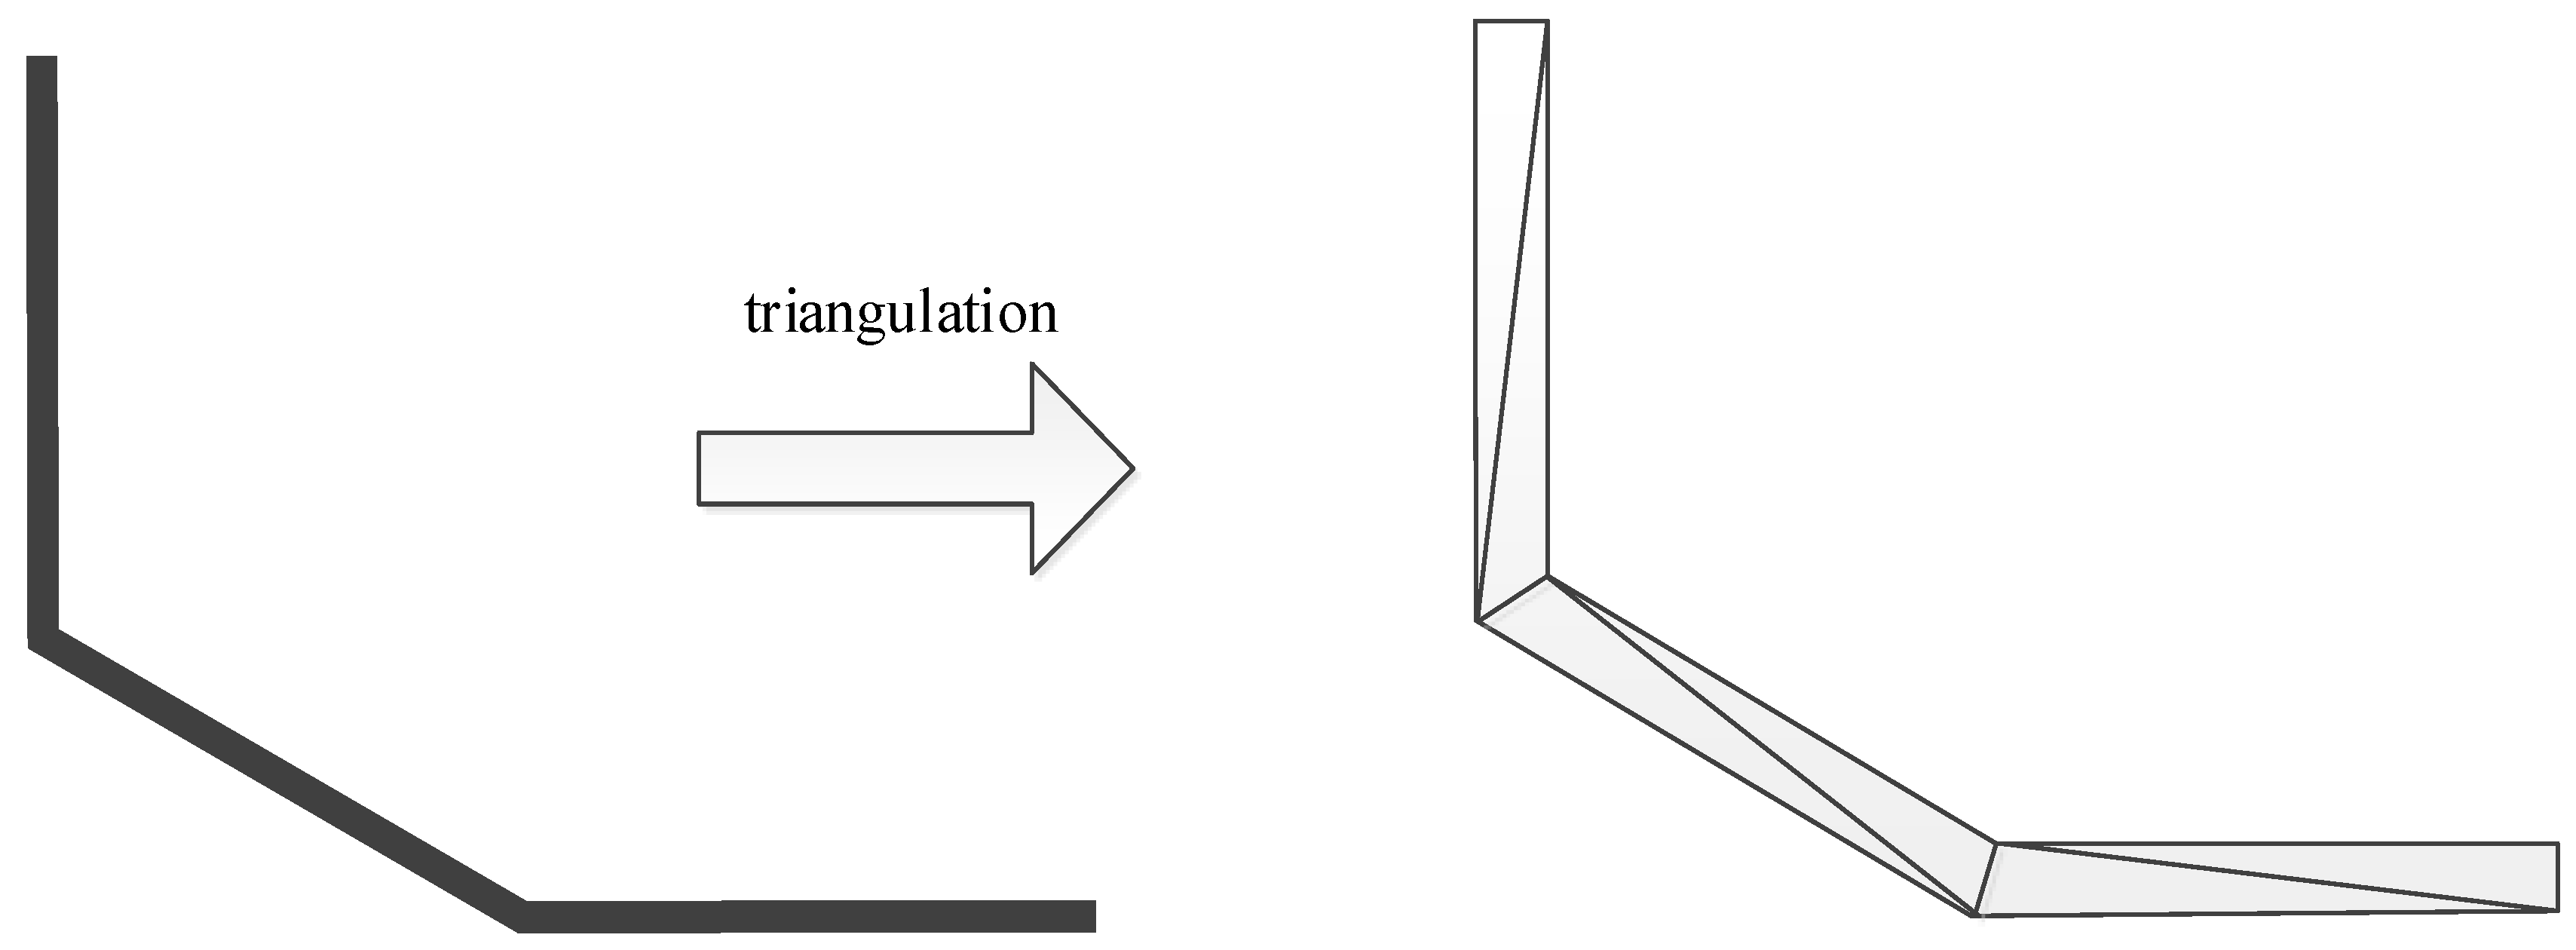
3.3.1. Line Rendering
Line layers can be divided into three categories: single-line layers, wide-line layers, and symbol-line layers. The GL map rendering engine draws single-line features directly using OpenGL-supported APIs, but the GL engine first splits the wide-line layer into rectangles for the wide-line layer, then splits the rectangle into triangles, and then renders it. The process workflow of triangulation of wide-line is shown in
Figure 4.
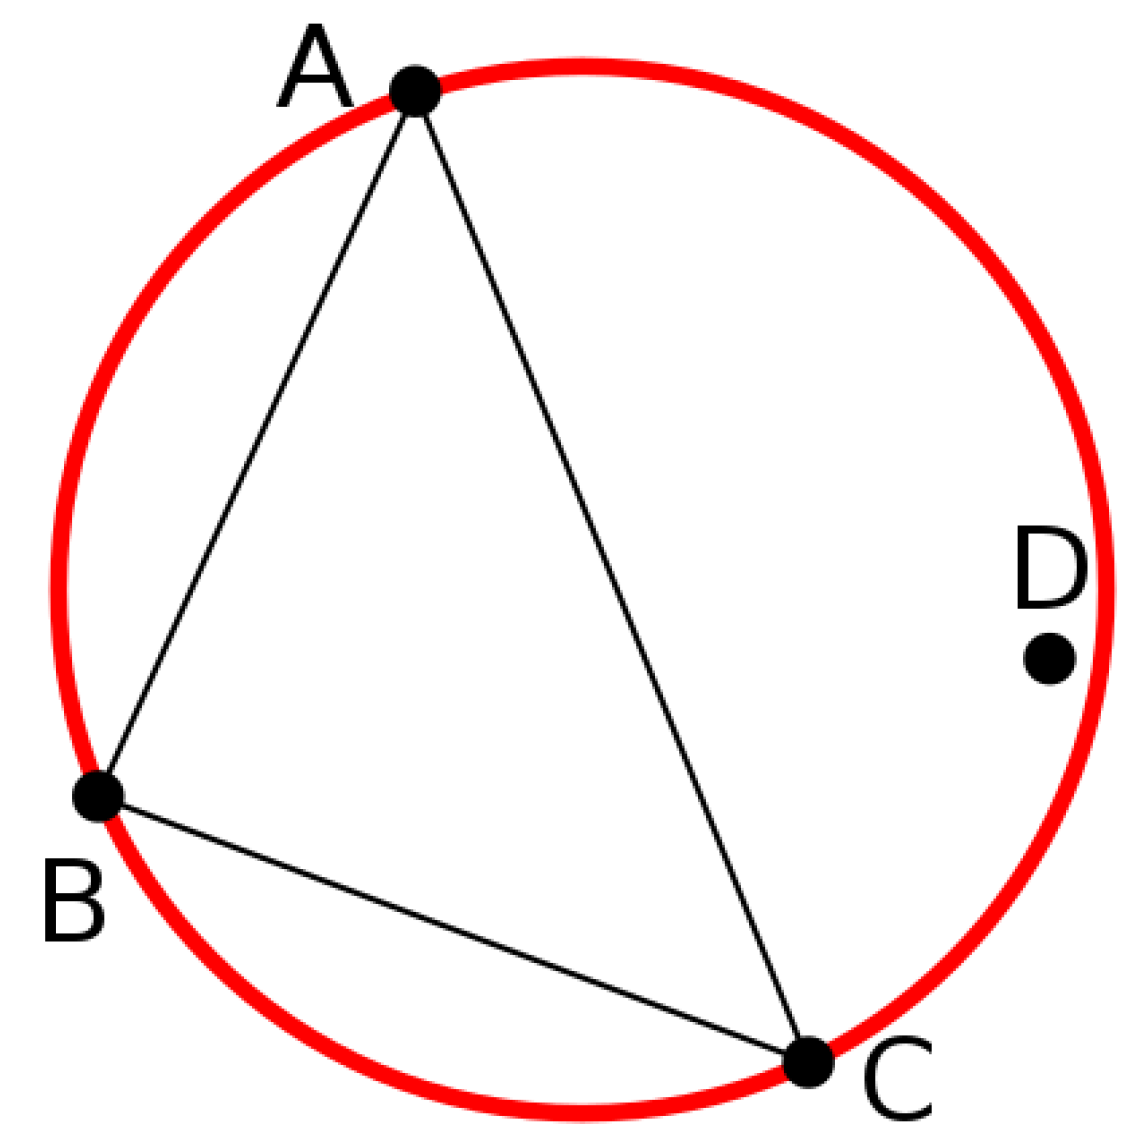
The Delaunay triangulation algorithm was used to split the rectangle into triangles. The algorithm for calculating triangulation relies on quickly detecting whether a point is within the circumscribed circle of a triangle and has a valid data structure that stores triangles and edges. In a two-dimensional scene, a way to detect whether a point D is located at A, B, or C is to evaluate a determinant value, sorting A, B, and C clockwise, if and only if D is at A, B. This determinant inequality holds when C is in the circumscribed circle (
Figure 5).
Formulation (1) determines if point D is in the outer circle of A, B, and C.
Yu et al. summarized three types of methods in the construction of the existing Delaunay triangulation: point-by-point insertion method, triangulation method, and the divide and conquer method for the algorithm of Delaunay triangulation [
35], and proposed the direction of optimization as a hybrid construction method. However, the optimal performance can reach
O(
n*loglogn) in these methods.
This study uses the point-by-point insertion algorithm to perform the wide-line triangulation operation that combined with the large volume of GIS data and high-performance requirements. At the same time, in order to avoid the complexity of the splitting at the corners of the wire ends, the performance is low. In this study, the triangulation work of the line segment intersection is replaced by adding the circle at the intersection of the line segment, which greatly improves the performance of drawing the wide line. The symbol line processing is similar to the composite point layer. It is split into basic points, lines, faces, and texts, and is processed into multiple RO.
3.3.2. Polygon Rendering
If the polygon features are drawn by the triangulation method of points and line elements, there is a defect operation. If the polygon feature is drawn by triangulation, the process is the geometric polygon that expresses the polygon feature is divided into a combination of multiple triangles, and the triangle mesh completely covers the polygon and has no intersecting edges, and then renders in the video memory. The problem is that the time complexity of the triangulation algorithm is
O(
n2). When the polygon boundary is complicated, especially for the polygon containing the island and the hole, the time-consuming exponential growth. Moreover, the triangulation algorithm does not support the profiled surface, especially for the self-intersection polygons (
Figure 6). The Delaunay triangulation is essential for complex polygons, like self-intersection polygons. In our study, multi simple polygons are generated from a self-intersection complex polygon and then Delaunay triangulation is running.
Most of the polygons for rendering the real-world geographic information drawing are complex self-intersection polygons. The OpenGL does not support direct filling of concave polygons [
36]. There are still a large number of island polygons. For this case, a mask algorithm is proposed in this paper. The drawing mechanism, polygon drawing, replaces the traditional triangulation scheme in this way, reducing the complexity of the operation to
O(n). A masking technique was used in the GL map rendering engine proposes for polygon features, which divides polygon feature rendering into two steps. The first step is to engrave the shape of the image in the OpenGL stencil buffer to form a mask on the color buffer. The second step is to draw the outer bounding rectangle of the face in the color buffer to get the final rendering result. Similar to painting a piece of paper with a hollow shape on the canvas, the polygon feature is rendered in the shape of the paper (template buffer), then the entire canvas (color buffer) is colored. When the paper takes the back element, the shape is printed on the canvas. The OpenGL uses the computing power of the GPU to ensure the efficiency of the method.
The operation of template buffer engraves the shape of the picture. For a screen of length M and width N, its corresponding color buffer is described by a matrix of pixels consisting of M*N points. The stencil buffer is also a matrix of M*N, which corresponds to each pixel to describe the pass state when it is used as a template test. The shape for the engraved picture is required to distinguish the area from the uncovered area (the point on the pixel matrix). The specific method is:
- (1)
Create a stencil buffer with a depth of 1 bit and clear all bits of the stencil buffer matrix,
- (2)
Use the vertex array described in 1) to draw a triangle in the stencil buffer in GL_TRIANGLE_FAN mode (the first point of the point array is the triangle vertex, and the adjacent two points are taken sequentially - the
N-th (
N > 1) points and
N + 1 point - the line is the bottom edge of the triangle, forming a triangle network). The
glStencilFun parameter is
GL_NEVER, which means that the stencil buffer is only manipulated without rendering to the color buffer. The glStencilOp parameter is GL_INVERT, which means that the stencil buffer is operated in reverse color mode (the stencil buffer point value that is covered by the triangle for a single number of times is 1, and the stencil buffer point value that is evenly covered by the triangle is 0, and the stencil buffer operation mode is shown in the
Figure 7. The part of the stencil buffer that is not 0 is the area covered by the face.
3.3.3. Text Rendering
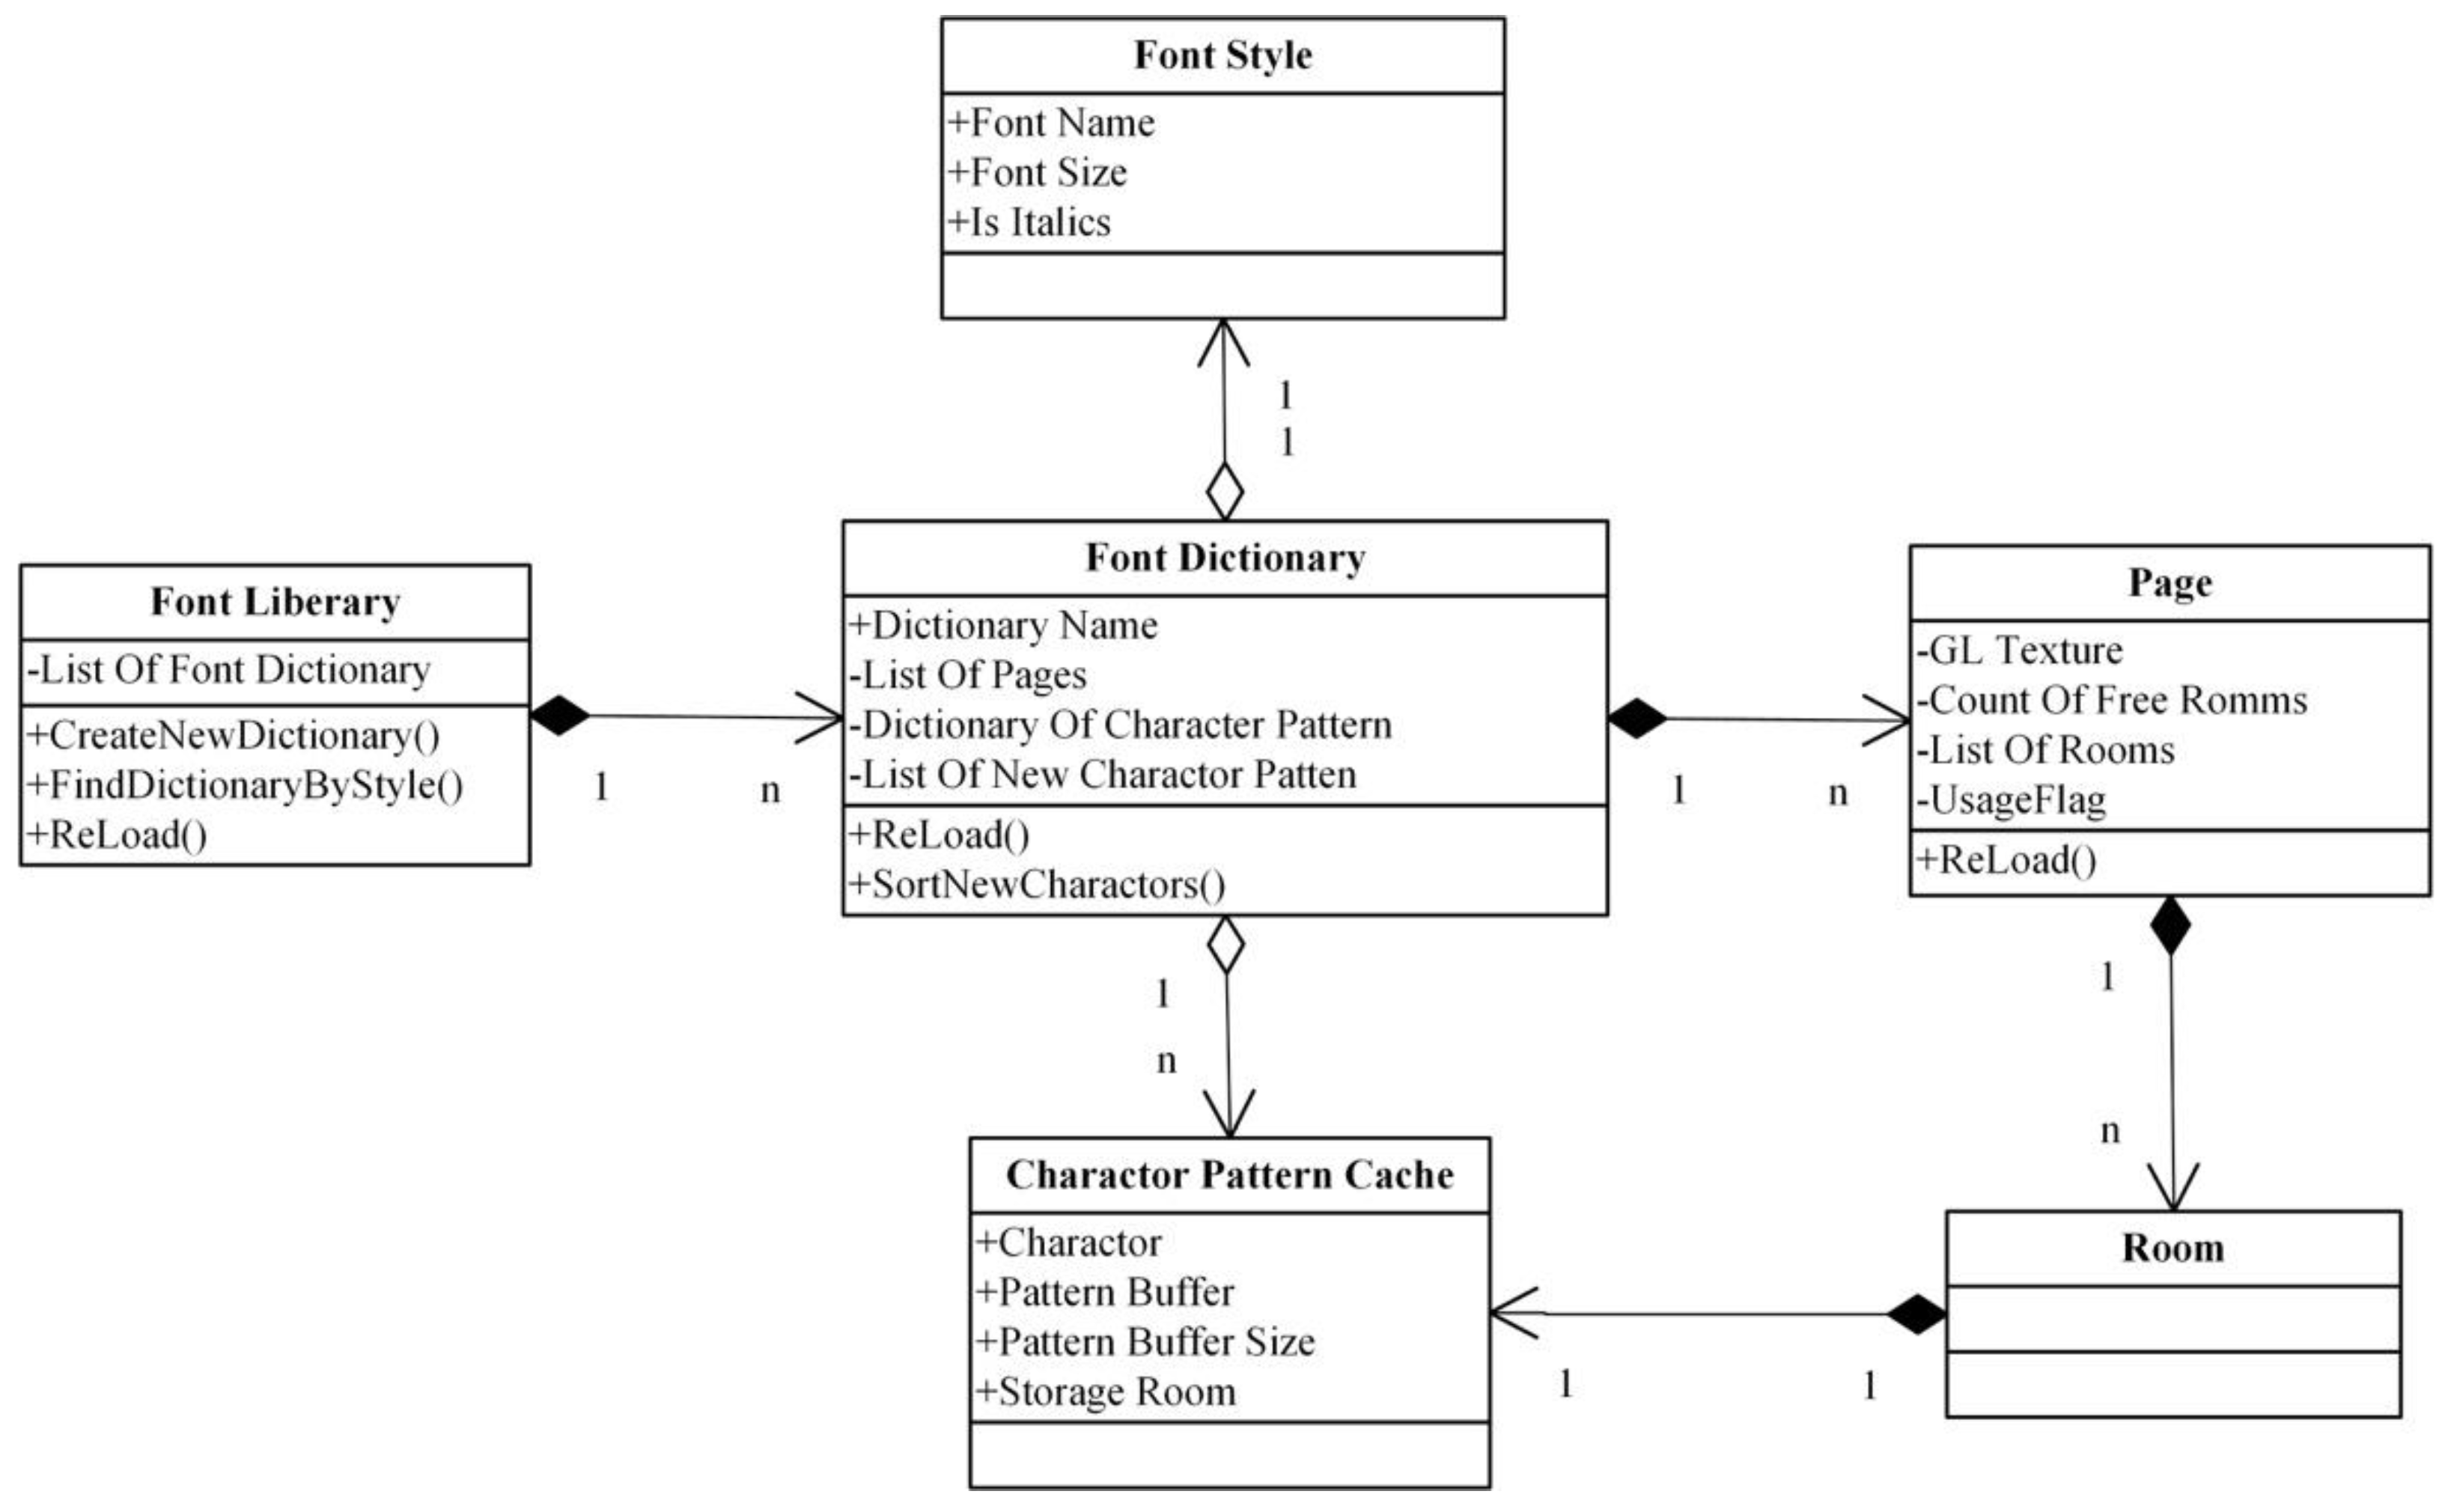
The way of text rendering in OpenGL is to copy the fonts Buffer produced by FreeType in memory to the memory texture before rendering. The problem with this method is that each time a text is rendered, the content exchange between memory and video memory is performed, which is inefficient and slow to render. If the glyph is managed in units of Point of Interest (POI), a texture memory cache is created for all POI data, and the same POI directly multiplexes the cache to render text, and there is no need to repeatedly use the FreeType to render text (
Figure 8). It can alleviate the problem of low rendering efficiency to a certain extent, but it cannot achieve high-performance rendering of massive POI. In addition, this method takes up a lot of memory space due to the large amount of texture.
The GL engine proposes a dictionary-based text caching scheme based on the OpenGL. The core strategy is to copy the text font image of the same font and font size used for one rendering to each group of 16 × 16 and copy it to the texture page in the video memory. The multiple pages constitute the dictionary of the font under the font size. When rendering a single text, the texture is bound to the dictionary page corresponding to the text, and the text can be rendered by texture mapping. The same dictionary only needs to be updated with local textures to be reused in multiple renderings. With this scheme, the full-screen text rendering of the map can be completed in 0.1 seconds.
4. Experiments and Results
To test the performance of the GL map rendering engine, this study uses the same national map data (less than 1:1 million scale using China data and more than 1:1 million scale using Beijing data), full-element map data, a total of 268 layers. The total size of spatial data 30.25 GB. In this study, the benchmark experiment is running on iOS system using Apple’s 12.9-inch iPad Pro (32 GB/WIFI version) mobile device, the parameters of the iPad are 2.26 GHz clock speed, 12.9-inch screen, 2732 × 2048 pixel screen resolution, 4GB system memory, and 32 GB storage capacity. The benchmark experiment is also running on Android system using Xiaomi’s Pad 4. The parameters of the Xiaomi’s Pad 4 are 2.2 GHz clock speed, 8-inch screen, 1920 × 1200 pixel screen resolution, 4 GB system memory, and 64 GB storage capacity. The benchmark experiments between GL map rendering engine and the general map rendering engine (UGraphics) were compared. The results of the experiments showed that the performance of the GL map rendering engine was 1.75 times better than that of UGraphics (as shown in
Table 1) in the iOS system and the performance of the GL map rendering engine was 1.54 times better than that of UGraphics (as shown in
Table 2) in the Android system.
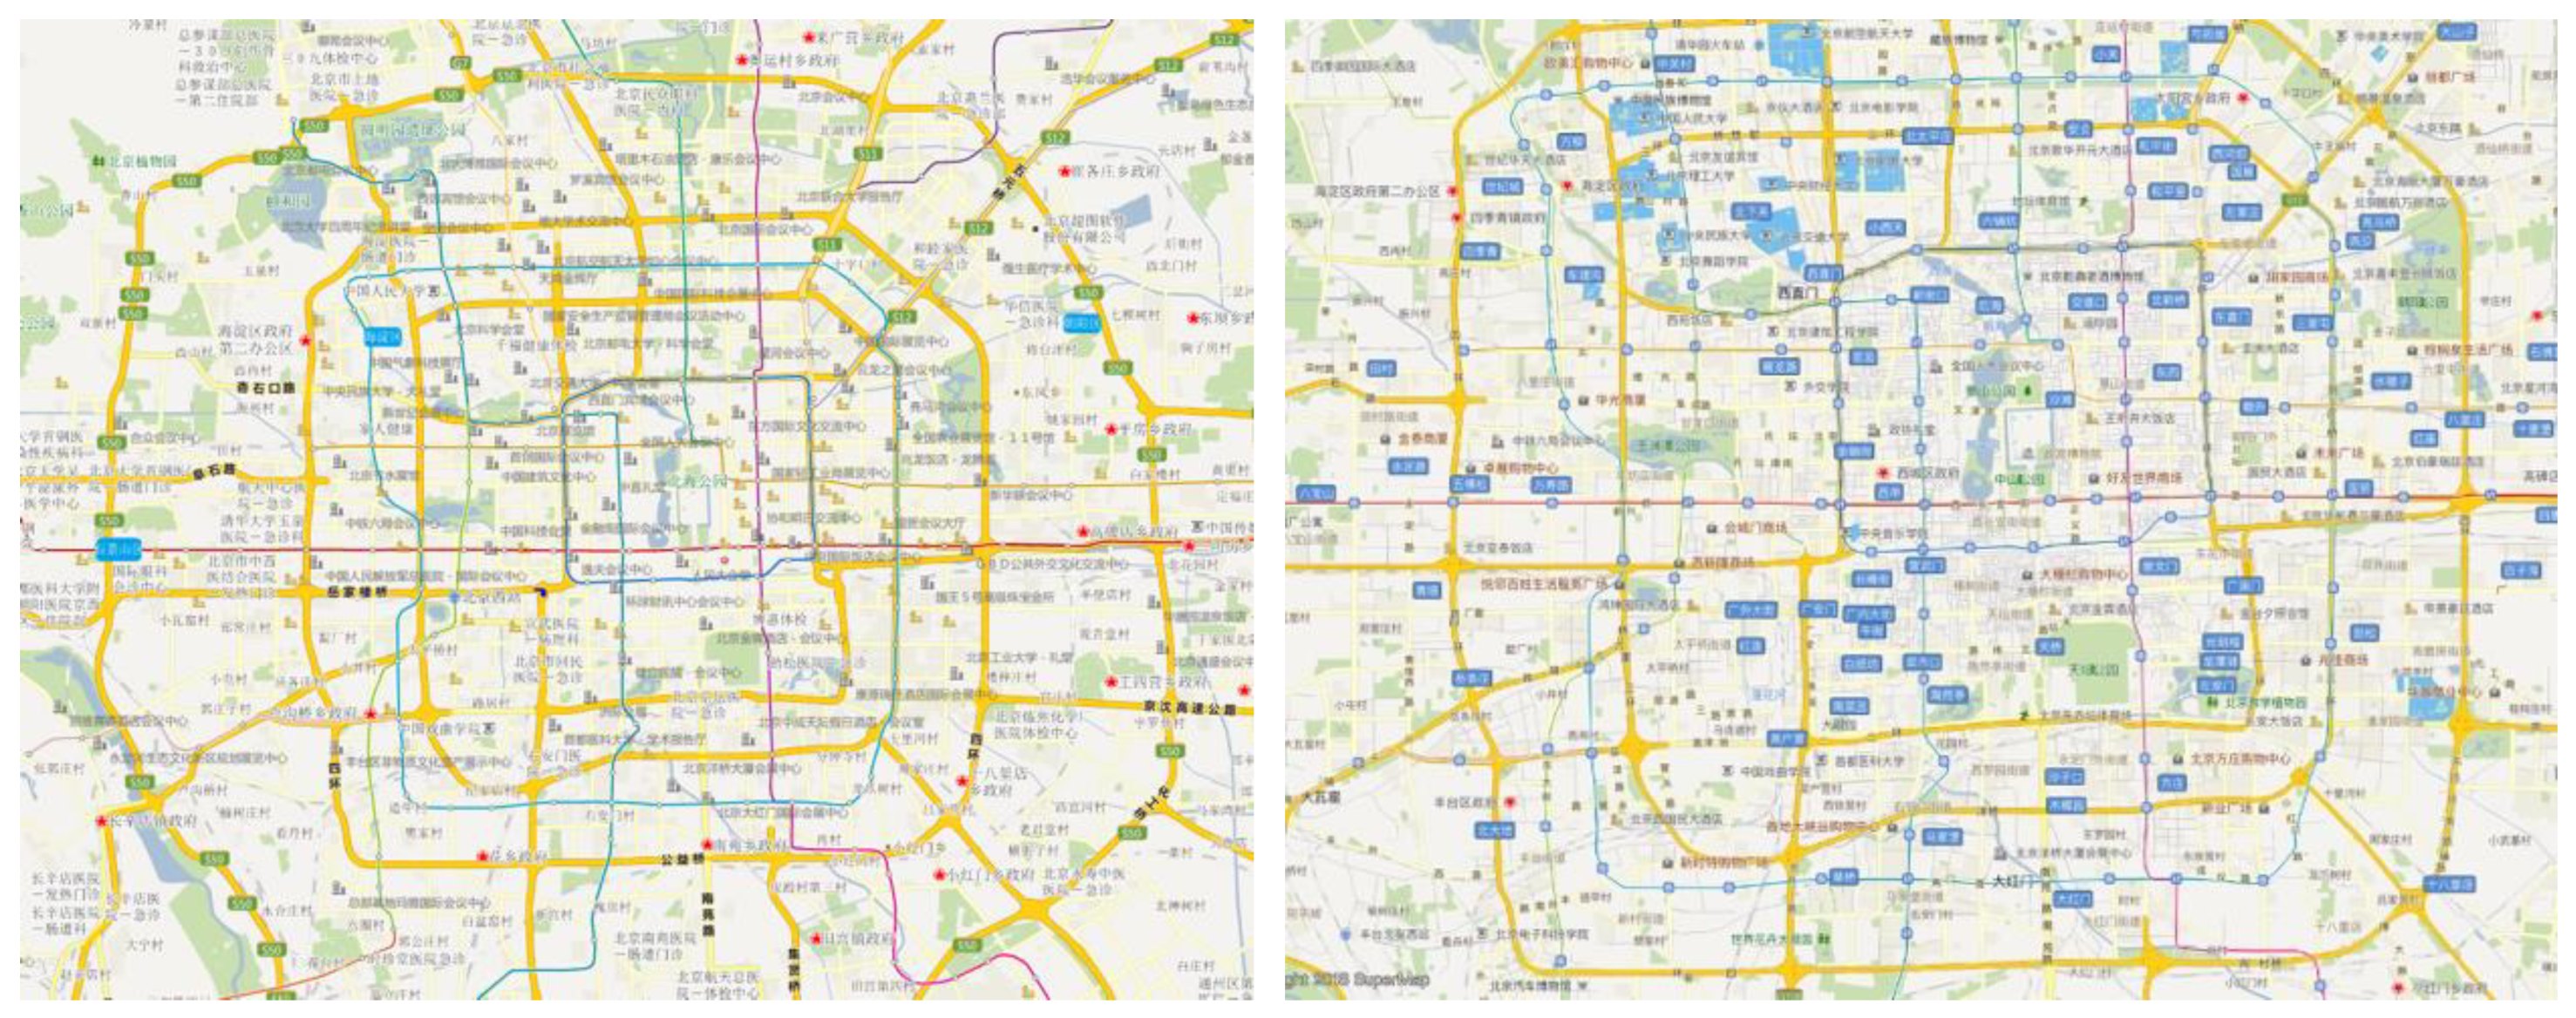
In order to test the performance of the GL map rendering engine for rending vector map tiles, the benchmark of the experiments between the GL map rendering engine and the MapBox map rendering engine were compared (
Figure 9). The performance of the GL map rendering engine is 11.89 times better than that of Mapbox performance rendering in the iOS system (
Table 3) and 9.54 times better than that of Mapbox performance rendering in the Android system (
Table 4).
5. Conclusions and Further Work
In this study, the cross-platform high-performance map rendering engine was proposed and the GL map rendering engine was developed, which solves the problem that the map cannot be rendered across different platform with high efficiency. It uses graphics acceleration hardware and innovative graphics rendering algorithms to achieve high-performance rendering of the map. The map rendering color correction algorithm realizes the consistency of the map rendering style under different platforms. The results of the benchmark experiments show that the performance of GL engine is 1.75 times and 1.54 times better than the general map rendering engine in the iOS system and in the Android system, respectively, and the rendering performance for vector tiles is 11.89 times and 9.52 times better than rendering in the Mapbox in the iOS system and in the Android system, respectively.
Although the GL map rendering engine has high performance for cross-platform map rendering, with the development of information technology, high-performance rendering of 3D BIM data and real-time rendering of streaming map data are still to be explored in further work.

 ,
, 


