Article

A High-Definition Road-Network Model for Self-Driving Vehicles

1
State Key Laboratory of Information Engineering in Surveying, Mapping and Remote Sensing, Wuhan University, Wuhan 430079, China
2
School of Data and Computer Science, Sun Yat-Sen University, Guangzhou 510006, China
*
Author to whom correspondence should be addressed.
ISPRS Int. J. Geo-Inf. 2018, 7(11), 417; https://doi.org/10.3390/ijgi7110417
Submission received: 4 September 2018 / Revised: 12 October 2018 / Accepted: 26 October 2018 / Published: 29 October 2018

Abstract

:
High-definition (HD) maps have gained increasing attention in highly automated driving technology and show great significance for self-driving cars. An HD road network (HDRN) is one of the most important parts of an HD map. To date, there have been few studies focusing on road and road-segment extraction in the automatic generation of an HDRN. To improve the precision of an HDRN further and represent the topological relations between road segments and lanes better, in this paper, we propose an HDRN model (HDRNM) for a self-driving car. The HDRNM divides the HDRN into a road-segment network layer and a road-network layer. It includes road segments, attributes and geometric topological relations between lanes, as well as relations between road segments and lanes. We define the place in a road segment where the attribute changes as a linear event point. The road segment serves as a linear benchmark, and the linear event point from the road segment is mapped to its lanes via their relative positions to segment the lanes. Then, the HDRN is automatically generated from road centerlines collected by a mobile mapping vehicle through a multi-directional constraint principal component analysis method. Finally, an experiment proves the effectiveness of this HDRNM.

1. Introduction

The development of intelligent transportation and advanced driver assistance system (ADAS) has attracted significant attention in academia and industry [1,2,3]. High-definition (HD) maps can provide detailed map information to assist smart cars with HD positioning [4,5,6], which can solve problems with sensor failures under certain circumstances, correct the shortcomings of environmental sensors and improve the sensing ability of smart cars [7,8,9]. Based on prior knowledge of maps and dynamic transportation information, HD maps help self-driving vehicles determine the best driving path and a reasonable driving strategy using global path planning [10,11,12], effectively enhancing driving safety and reducing driving complexity [13]. Therefore, the creation of HD maps is important, and they are currently in high demand [14].
Road-network data represent roads in the real world, and HD road-network data are an important component of HD maps. In this paper, we focus on an HD road-network model (HDRNM). To obtain an HDRNM for self-driving vehicles, road-network data must first be collected. Next, modeling must be performed based on the road-segment network and lane network, as well as on the relations between them. Finally, the HDRNM can be applied in different ways to meet different self-driving requirements.
Research on creating HD road networks has mainly used crowd-sourcing or smart cars to extract road-network data [15,16,17], generate HD road segments [18,19] and extract HD intersections [20]. Research on how to model HD road networks has mainly been focused on the representation of HD road networks [21], intersections [22] and road models [23,24]. However, some researchers have worked on the automatic generation of topological relationships between lanes and road segments. Previous methods to generate topological relationships in road networks automatically have included merging intersections of different layers [25], using point correlations [26],and hidden Markov model (HMM) map matching [27]. However, these studies were not based on the topological extraction of lane-level road networks, which still relies on manual work.
To solve these problems, we propose a linear, event-based HDRNM. This model simultaneously represents relationships among road segments, intersections and lanes. In addition, we used principal component analysis (PCA) under multi-directional constraints to extract road-network data automatically and establish lane-level topological relationships. Finally, we evaluated this method by comparing the results with experimental data. Figure 1 is a diagram of the proposed model.
The main contributions of this paper include proposing the HDRNM, using linear event points for road segmentation, establishing topological relationships between lanes and road segments, automatically extracting lanes using PCA under multi-directional constraints and establishing a demonstrative road network through experiments. The rest of the paper is organized as follows: In Section 2, we present a literature review. We introduce the HDRNM in Section 3, describe the method for automatically extracting road networks in Section 4 and describe experiments and results in Section 5. A discussion comprises Section 6, and conclusions are drawn in Section 7.

2. Literature Review

HD map data usually have centimeter-level positioning accuracy [28]. Recently, the automatic generation of HD road networks has attracted additional attention from scholars. HD maps serve ADASs, as well as self-driving systems, auxiliary safety systems and road coordination systems. We used an HDRNM to represent the road network model as an application of HD maps. A HDRNM is richer than a road-segment-level network model in both data and modeling.
To model HD road networks, many researchers have studied lane extraction and modeling. Gi-Poong et al. used piecewise polynomials to simulate lanes and improve the efficiency of road-network storage [17]. Chunzhao et al. used a third-order polynomial based on an approximated clothoid spline to represent the lanes, and they used the cubic Catmull–Rom spline to represent the curved lines at the intersections [15]. Those two strategies can facilitate efficient modeling of lanes and intersections. Anning et al. used the cubic Hermite spline to model lane centerlines [24], and they used software compatible with the GIS database to model a series of lanes and road segments. Kichun et al. used a B-spline curve to represent a lane-level road network [23] in three dimensions, ensuring the shape and accuracy of the three-dimensional road network. These studies were focused on the geometric representation of a lane model. Tao et al. defined the lanes of the HD road network with lane arcs, lane attributes, intersections and intersection attributes [21]. These descriptions facilitate the stimulation of lanes in the HD road network. However, there is still a lack of representation of road segments and the connecting relationships between lanes and road networks.
HD road networks include significant details. The U.S. Federal Highway Administration and National Highway Traffic and Safety Administration used lane details to enrich the HD road network conceptually [29]. Bétaille et al., further described the geometry of lanes and their topological relationships, which increased the accuracy of networks and enriched the content of road networks [2]. Tao et al. added a virtual lane at an intersection [22], which addressed the challenge of limited detailed information at the intersection. However, these studies did not provide a dynamic, multi-dimensional or comprehensive representation of HD network attributes, which has certainly limited the representation of real-time self-driving.
Self-driving requires a geometrically precise road network, with detailed information about each lane. A HDRNM should meet the following conditions:
  • The road-network structure and the relationships between layers should be complete, enabling adaptation to applications and calculations in different situations.
  • The geometry, topology and attribute data of each layer of the road network should be complete.
  • The attribute data of the road-network components should support dynamic storage and updates to meet the needs of real-time self-driving.
Considering the above requirements, we propose an HDRNM that represents the road-network model at the lane level, describing detailed geometrical information of each lane and topological relationships between the lanes. The model also maintains the integrity of the structure, content and relationships at the road-network level. The road-network structure meets the self-driving requirements in both geometry and topology. For an HDRNM, it is necessary to extract both lane and topological relationships. Jia et al. used PCA to generate line segments from points after clustering them, finding road segments with fit direction and length from the original points [30]. Similarly, Lin et al. applied the PCA method for road-skeleton segmentation using global positioning system (GPS) tracking points, and they further extracted intersections from the road network based on the direction of road segments [31].
Based on all of these efforts, we propose a new method to generate HD road networks automatically. We used PCA under multi-directional constraints to extract road segments from lane-centerline data automatically, identified intersections, established topological relationships between lanes and road segments and generated HD road-network lanes.

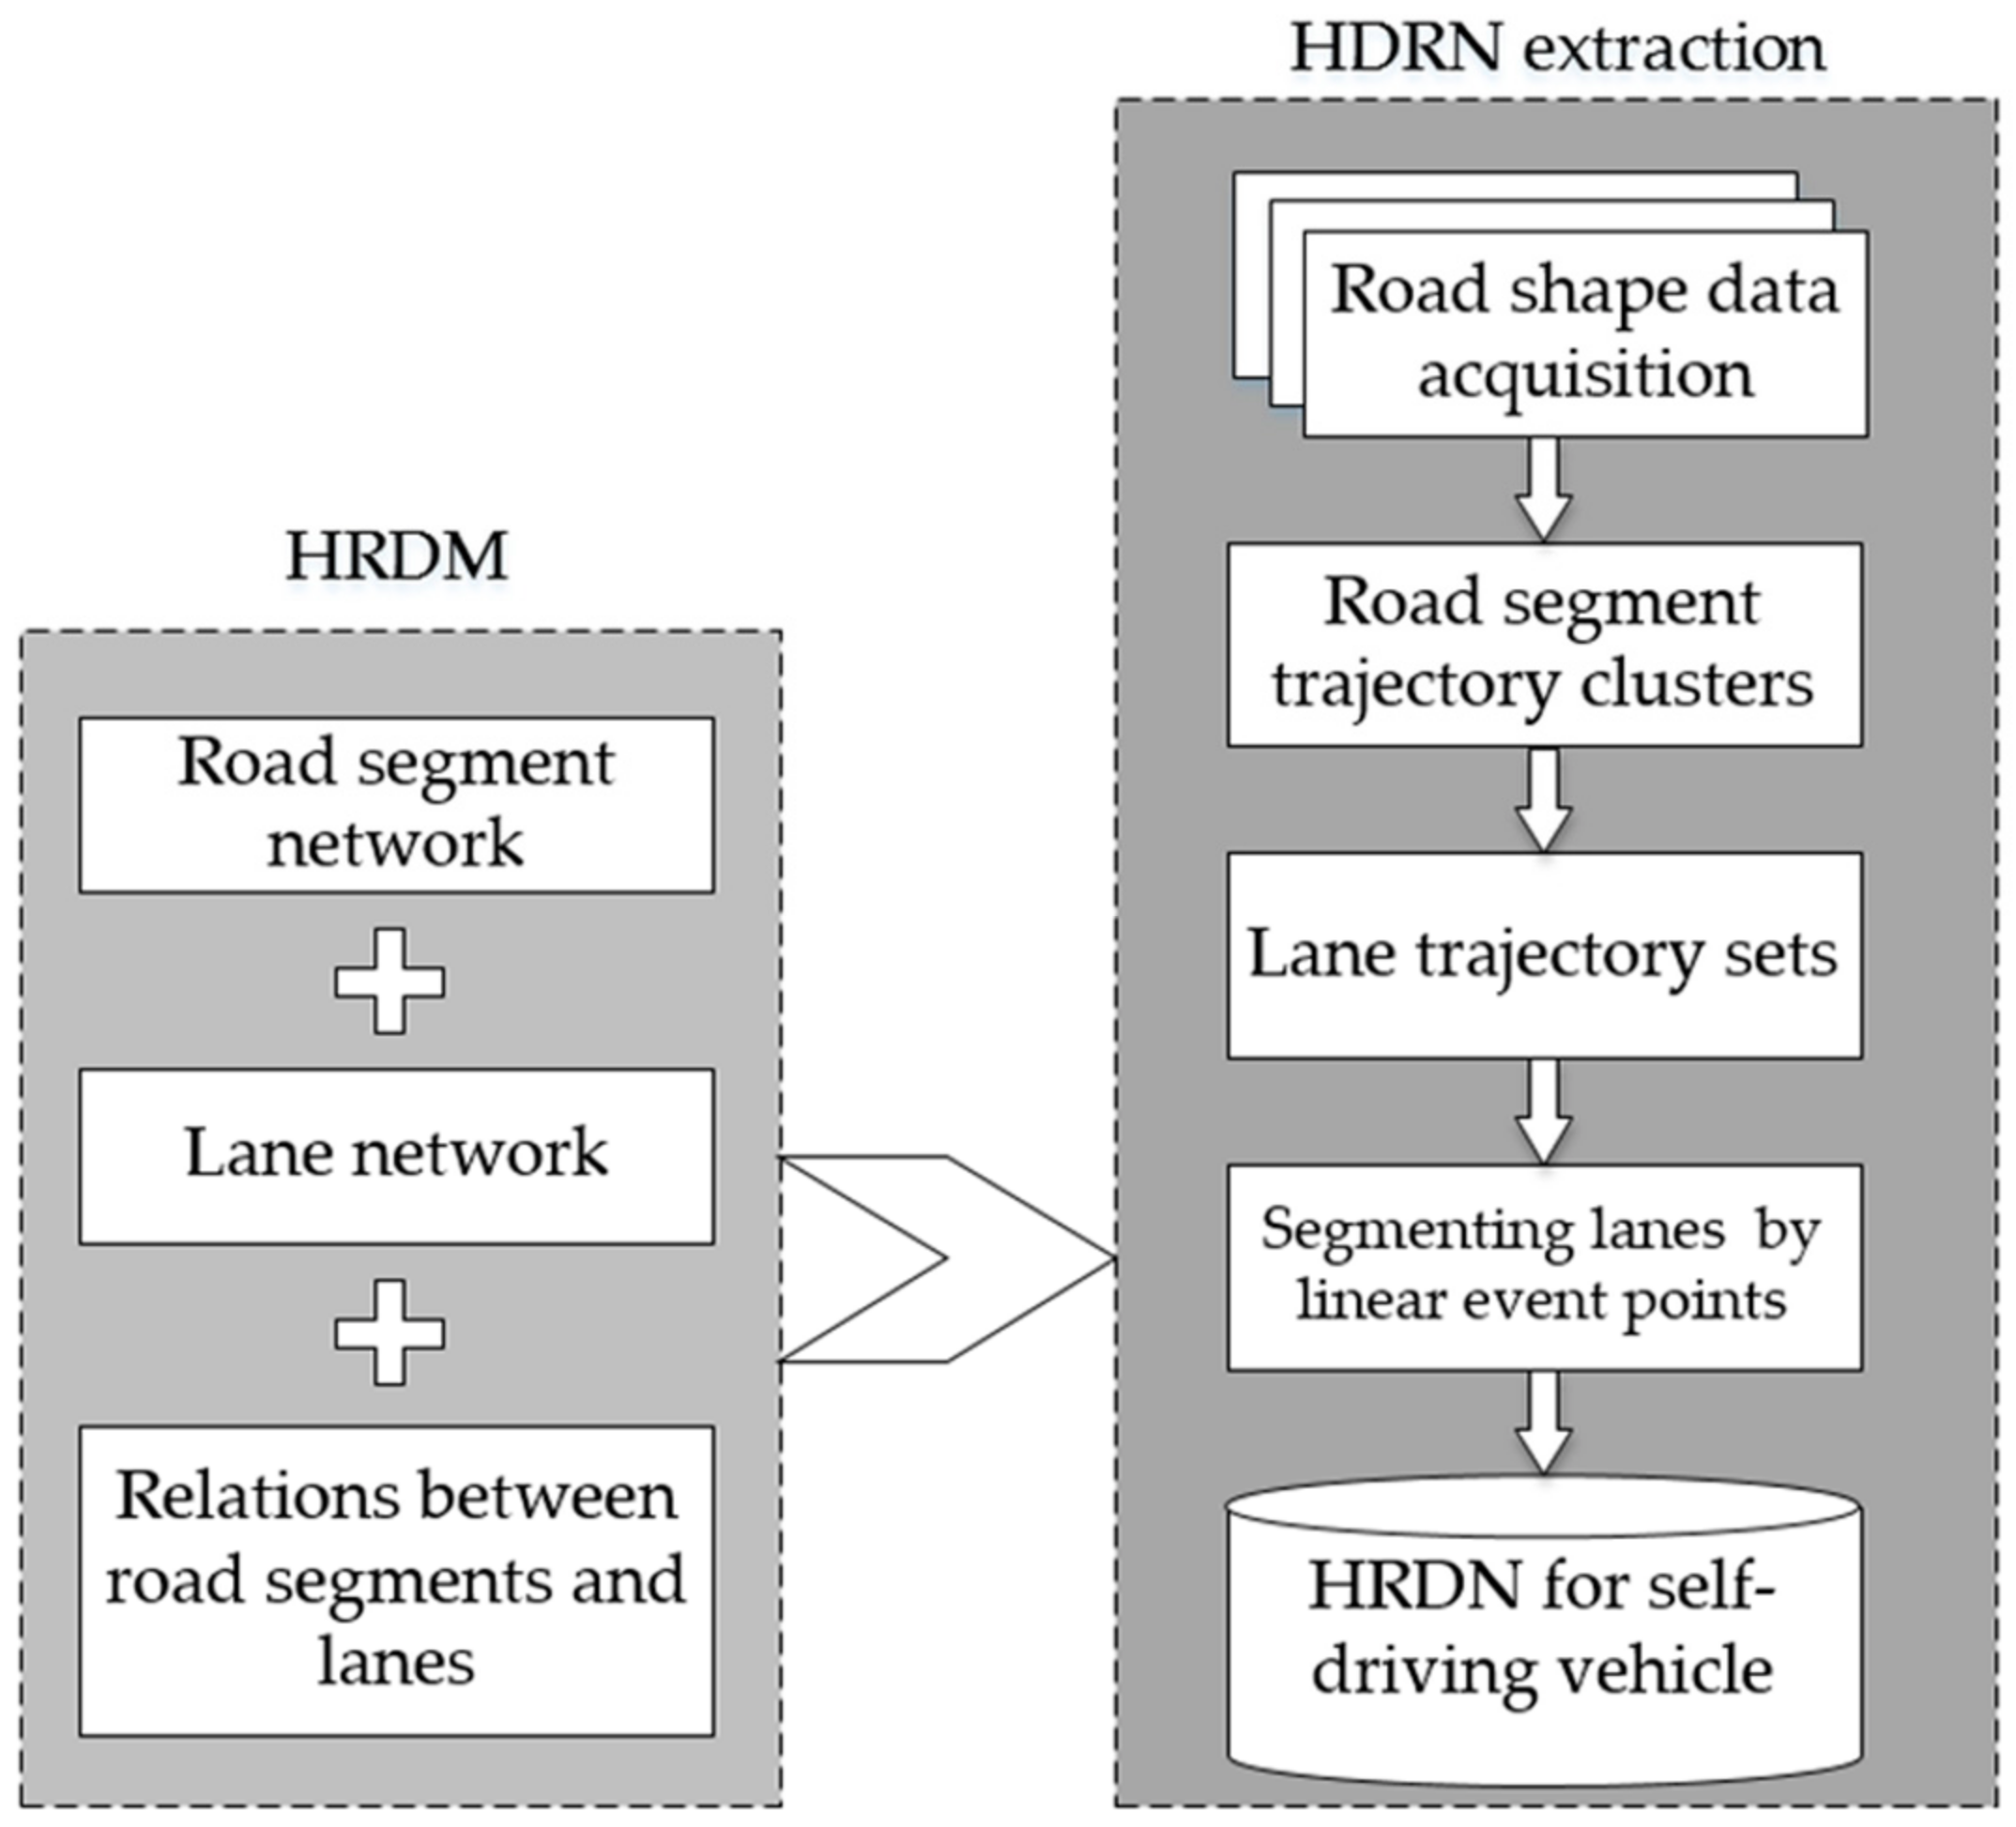
3. HDRNM for a Self-Driving Vehicle

We define the HDRNM in Equations (1)–(7), which is also compatible with the road-network model in China’s existing navigation electronic maps [32]:
W   =   ( C ,   R ) .  
R   =   { r 1 ,   r 2 ,   ,   r N } .  
r   =   ( S r ,   S N r ,   E N r ,   Q r ,   R L ,   L S ) .  
L S   =   { l 1 ,   l 2 ,   ,   l i } .  
l   =   S l ,   S N l ,   E N l ,   Q l ,   L L .  
Q   =   f   ( t ,   q ) .  
In addition, the road segment R and corresponding lane L should have the relationship described in Equation (7):
  R e = f ( M ) .  
The meanings of the above equations are as follows:
Equation (1): W represents a road network; C is a set of intersections; and R is a set of road segments.
Equation (2): 1 , 2 , , N represents a set of road sequence indexes; r represents a set of road segments; and r 1 ,   r 2 ,   ,   r N represent the individual road segments in the set.
Equation (3): r represents the segment index; S r represents the shape points of segments; S N r represents the starting point of the roads; E N r represents the end points of the roads; Q r represents the attributes of road segments, such as road name and service level as listed in China’s national standard [32]; R L represents the link numbers of roads; and L S represents the set of sequence of lanes on a segment.
Equation (4): 1 ,   2 , , i represents a set of lane-sequence indexes; l represents lanes; and l 1 ,   l 2 ,   ,   l i represent the lanes in a road segment.
Equation (5): l   represents   the   lane   index ;   S l represents the shape points of lanes; S N l represents the starting points of lanes; E N l represents the ending points of lanes;   Q l represents lanes’ attributes, including the length of the lane, the width of the lane, the slope of the lane and the radius of curvature of the lane, which can be expanded according to the application requirements of a self-driving vehicle; and L L represents the link numbers of roads.
Equation (6): Q represents dynamic attributes, either yes or no; t represents time; q represents a static attribute value; and Q represents the attribute value of a lane or section in Equations (3) and (4), which corresponds to an enumeration type.
Equation (7): R e represents the relationship between the road segment and the lane; and M represents a set of linear event points.
We now explain the above equations in detail.
  • Complete road-network structure and layer-to-layer relationship
To meet the data and scale requirements of different self-driving functions, we used vertical layers and divided the road-network model into a road-network layer and a lane-network layer. The smallest modeling unit of the road-network layer is a road segment, and the smallest modeling unit of the lane-network layer is a lane. We abstracted road segments from the geometric data of lanes in the lane layer to form the geometric dataset of the road-network layer. Figure 2 illustrates the abstraction of the road-network and lane-network layers, representing the real world.
To represent multi-layer topological data, it is necessary to represent the connection relationships between segments and those between lanes, as well as the corresponding associations between segments and lanes. Linear event points are commonly used to describe attributes of a point in a GIS. The locations of these attributes are determined by linear metric values. Attribute-changing points (such as those on narrowing lanes) are crucial for self-driving, as they directly affect path generation and driving trajectory. Therefore, we first used the linear event points to represent the positions of attribute-changing points on the road-segment layer. Figure 3 shows examples of linear event points.
We defined the place in a road segment at which the attribute changes as a linear event point. The road segment served as a linear benchmark, and the linear event point from the road segment was mapped to its lanes via their relative positions to segment the lanes. Then, linear benchmark changes were mapped into each lane in the direction of the road, in the same way we mapped out the linear event points of lanes and measured the linear metric values of lanes. We divided lanes into road segments based on attribute-changing points. According to the conditions of roads in China, the error between the linear event point in the direction of the lane and the linear metric value of the original M should be less than 10 m. In the road direction, the lane-shape function was LaneShapeFunction in Equation (7), which can be expressed by a collection of morphological points, or abstracted as a piecewise curve function, b-spline curve function, clothoid curve function, etc. The function for the road segment is expressed by Equations (8)–(10):
[ l 1 , j l n , j ] = [ L S 1 , j L S n , j ]   I n , n   =   [ 1 ,   t o t a l L a n e S h a p e F u n c t i o n ] ,   j [ 1 , t o t a l M N u m   +   1 ] ,  
  I n   =   d i a g ( 1 , 1 , , 1 ) ,   n   =   t o t a l L a n e S h a p e F u n c t i o n ,  
  L S i , j ( X i ) = { L S i , j ( x j ) ,   x j X i   0 ,   x j X i   ,   i     [ 1 , t o t a l L a n e S h a p e F u n c t i o n ] ,   j [ 1 , t o t a l M N u m   +   1 ] .  
In the above equations, i represents a sequence of lane shape functions perpendicular to the lane direction; j represents a sequence of linear segments in the segment direction; totalLaneShapeFunction represents the sum of lane shapes on the current road segment; totalMNum represents the sum of points at time M on the current road segment; I n is a unit matrix and has no practical meaning; l represents lanes; l i , j represents the i-th parallel lane on the j-th road segment; LS is the abbreviation of the lane-shape function LSFunction; LSi,j represents the i-th lane-shape function LSFunction in the j-th linear segment; x j represents the range of coordinates in the road direction in the (j − 1)-th to j-th linear segments; and X i represents the range of coordinate values of the lane shape function of the i-th parallel lane in the segment direction.
Figure 4 and Table 1 show an example of segmenting a lane through linear event points on a road segment.
  • Complete data of all road network layers
To adapt to different application requirements, the road-network data of each layer must be complete. The geometric, topology and attribute data of both the road-segment and lane layers must be included. Equations (3) and (5) show those two layers. The geometric data of lanes must represent lane shapes in detail. The relationship between roads is often represented by a link node, and we use them here to represent the relationships between lanes. The linear event points mentioned in the preceding subsection are link nodes. However, since attribute-changing points are added to describe the relationship between lanes and segments, the relationship between the lanes also needs to be added to the same road segment. This relationship is represented by storing the left- and right-hand lanes in the road direction.
  • Attributes of road-network components supporting dynamic storage and update
To improve traffic efficiency, road rules often change with time, such as by adding reversible lanes and changing lane-turning restrictions. To simulate real-time self-driving, we used a Heaviside step function to describe traffic rules over time.
Suppose that the unit step function is defined as:
  p ( t ) = { 0 ,   t   <   0 1 ,   t     0  
The definition of the traffic rules in Equation (6) can be represented as a function of the step function:
P a s s i n g V a l u e ( t )   =   p ( t T 1 )     p ( t T 2 ) .
where t represents time and P a s s i n g V a l u e indicates whether passing is allowed or not. If it is equal to one, then passing is allowed. If it is less than one, then passing is not allowed. This value can also be used to indicate whether turning is allowed. p ( t ) is a unit step function and has no practical meaning, as listed in Equation (11). T 1 and T 2 indicate the effective time ranges of a rule.

4. HDRNM Automatic Construction Method

GPS tracks were collected with mobile measuring vehicles and then further analyzed. The mobile measuring vehicle was equipped with positioning equipment, such as GPS and decimeter- or even centimeter-level inertial navigation systems. When collecting data, the vehicle traveled on the centerline of lanes, and it completed tasks according to China’s mapping standard [33]. Finally, we digitized the data. Extracting HD road networks from the digitalized lane centerlines consisted of three steps: extraction of road segments, identification of topological relationships between lanes and determination of relationships between road segments and lanes.

4.1. Extracting Segment Direction and Sets of Points with the PCA Algorithm

PCA is a commonly-used data analysis method that can describe the distribution features of points [33]. PCA reduces n-dimensional raw data to k-dimensional data, minimizing data loss; that is, it converts data from the original coordinate system to a new coordinate system, identifying a unit vector to maximize the variance of the projected data in that direction. The PCA algorithm calculates feature matrices, which are sample distributions that can represent the majority of features and be used to measure relationships between points. Feature matrices can produce feature vectors, from which corresponding eigenvalues x 1 ,   x 2 can be obtained. Here, K = M A X { x 1 ,   x 2   } / { x 1 + x 2 } represents linearity. As discussed earlier, when K > 0.9, the clustered points can fit a straight line [30]. Therefore, we used linearity to determine whether a set of points in a range had a linear relationship.
We first defined a search radius searchR and performed a Gaussian projection for all coordinate points. In the second step, the algorithm started from a point and normalized other points within the search radius. Through PCA, these sets of two-dimensional coordinates were projected onto a one-dimensional plane. The linearity K value was calculated using the eigenvalues. In the third step, we selected all points with K > 0.9, and those intersecting points formed a maximum linear point set. This point set corresponded to the set of all lane-centerline points in each road segment. In the fourth step, we projected this maximum linear point set through PCA to obtain the projection direction of each road segment.

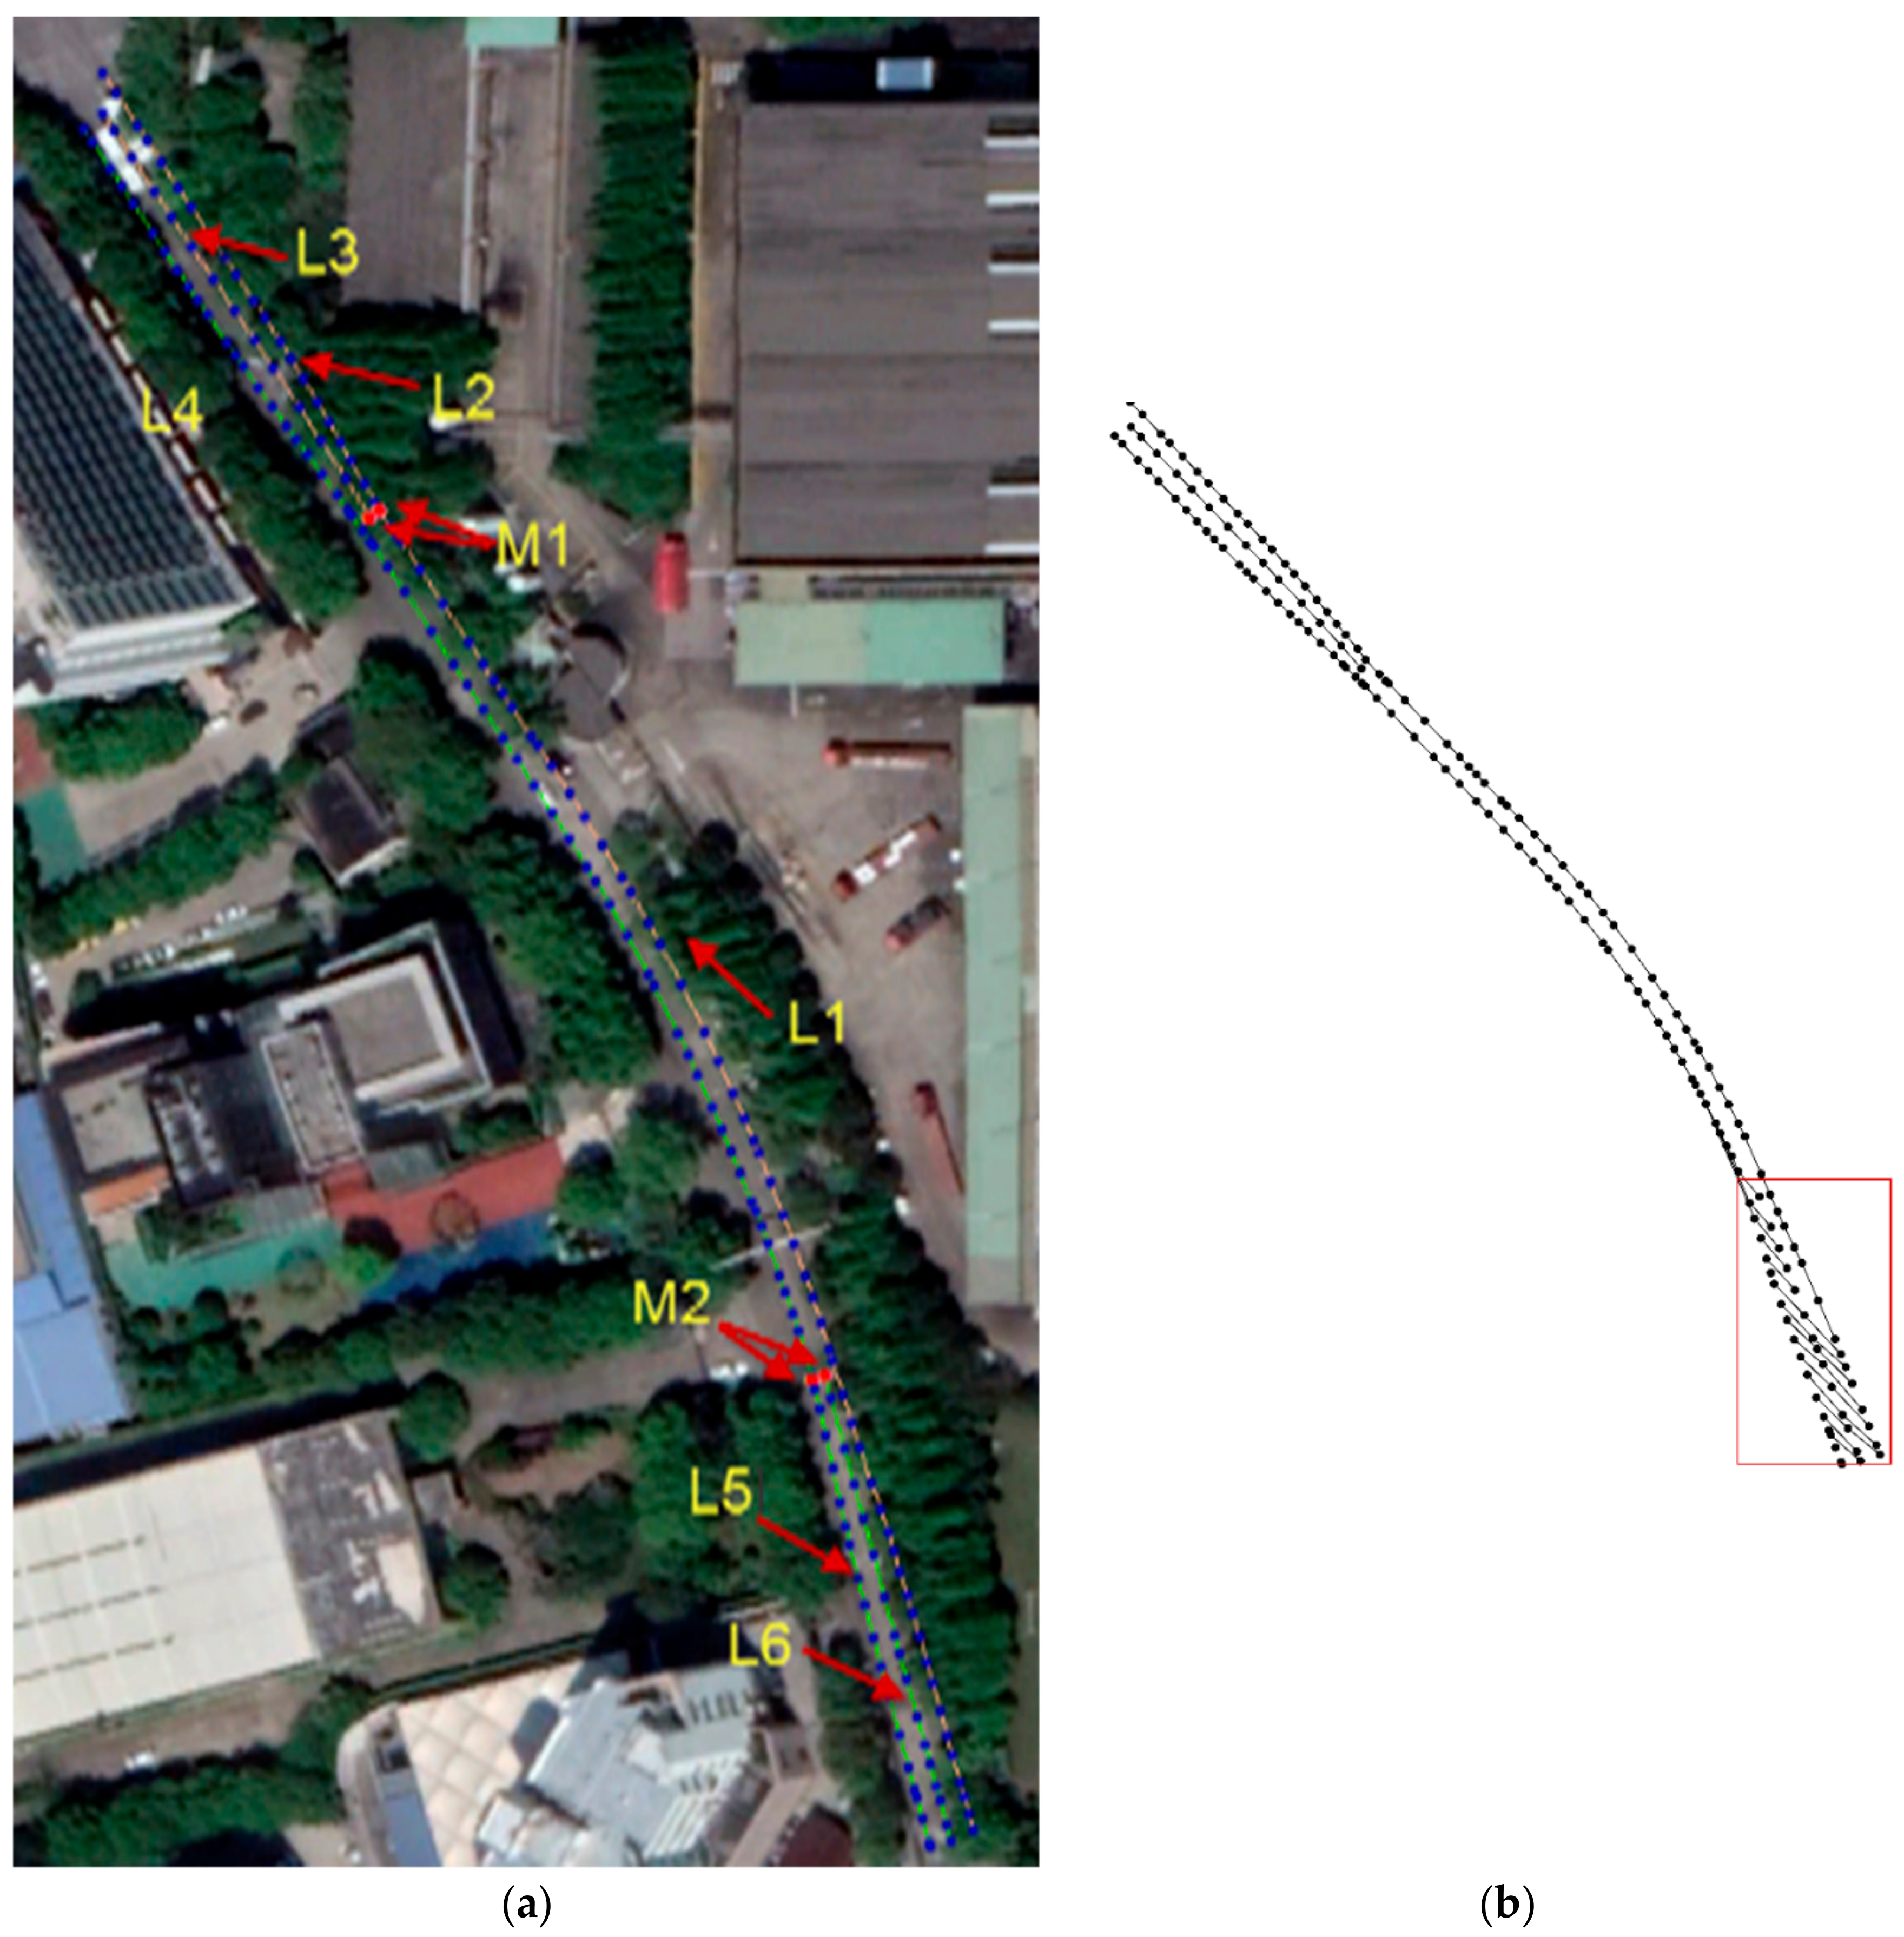
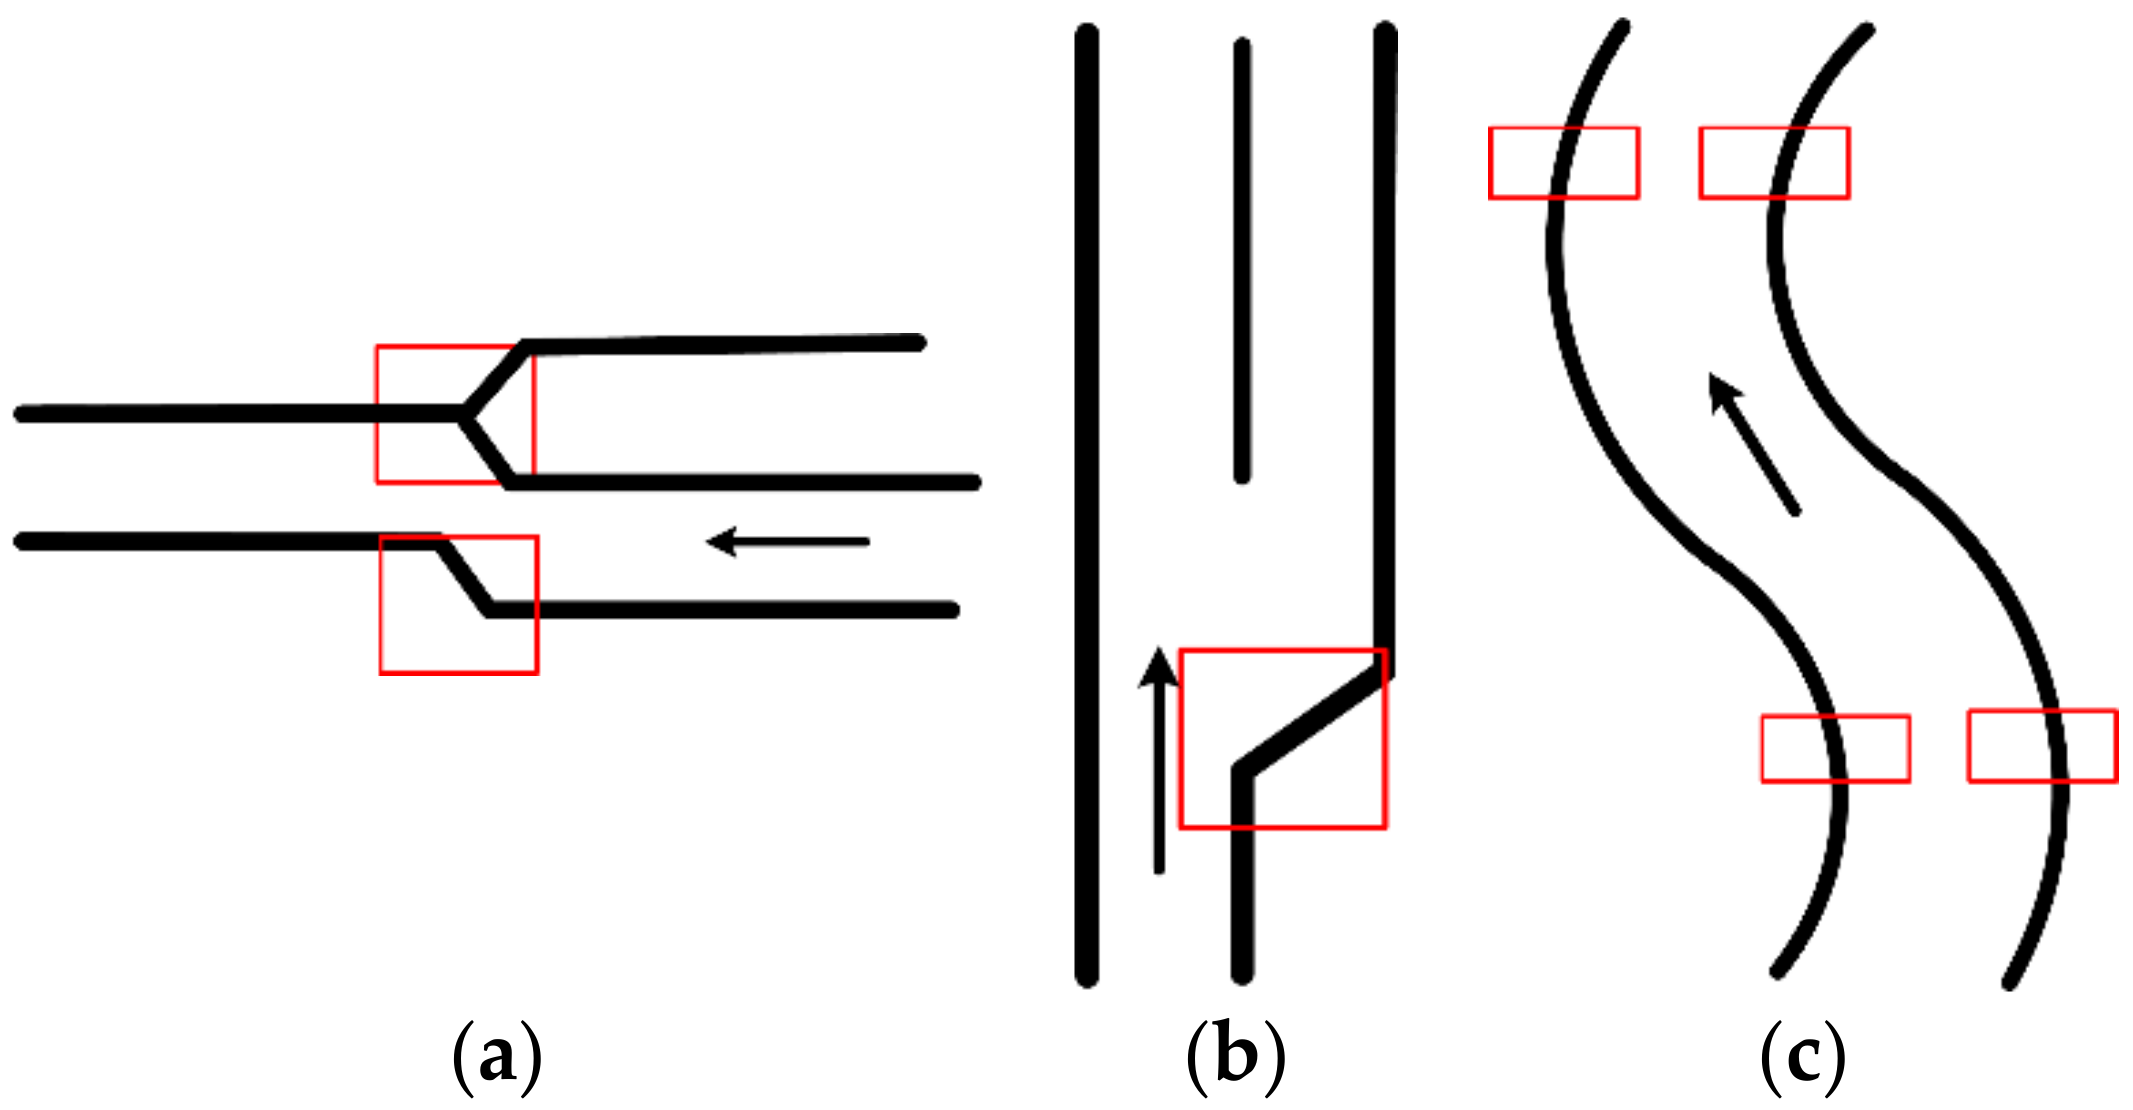
4.2. Lane-Network Construction under Multi-Directional Constraints

After extracting road segments, we further extracted and classified coordinate points to find different lane point sets on the road segments. In this process, we extracted lanes under two directional constraints: the PCA main direction and angle threshold σ. The angle threshold σ represents the angle between the main direction projection and the vector line from the current point to the next. As shown in the experimental results, the angle threshold σ ranged between [0°,30°]. When a road segment was close to a straight line, it was given an empirical value of 15°. When the entire road was curved, the angle threshold was set at 30°.
The specific extraction process included the following steps:
  • From the results of the previous process, we obtained points arranged in the direction of each road segment and their angles in the primary direction.
  • First, we tracked each road segment in the direction of the first point and then traversed them by giving priority to the main direction. Then, we calculated the angles between the current point and the traversal point. When the angle was in the range of σ, we considered the two points to be on the same lane.
  • We repeated this loop tracking until all points were traversed.
  • We calculated the length of all lanes in the road direction and determined the linear metric value of linear event points on the road segment.

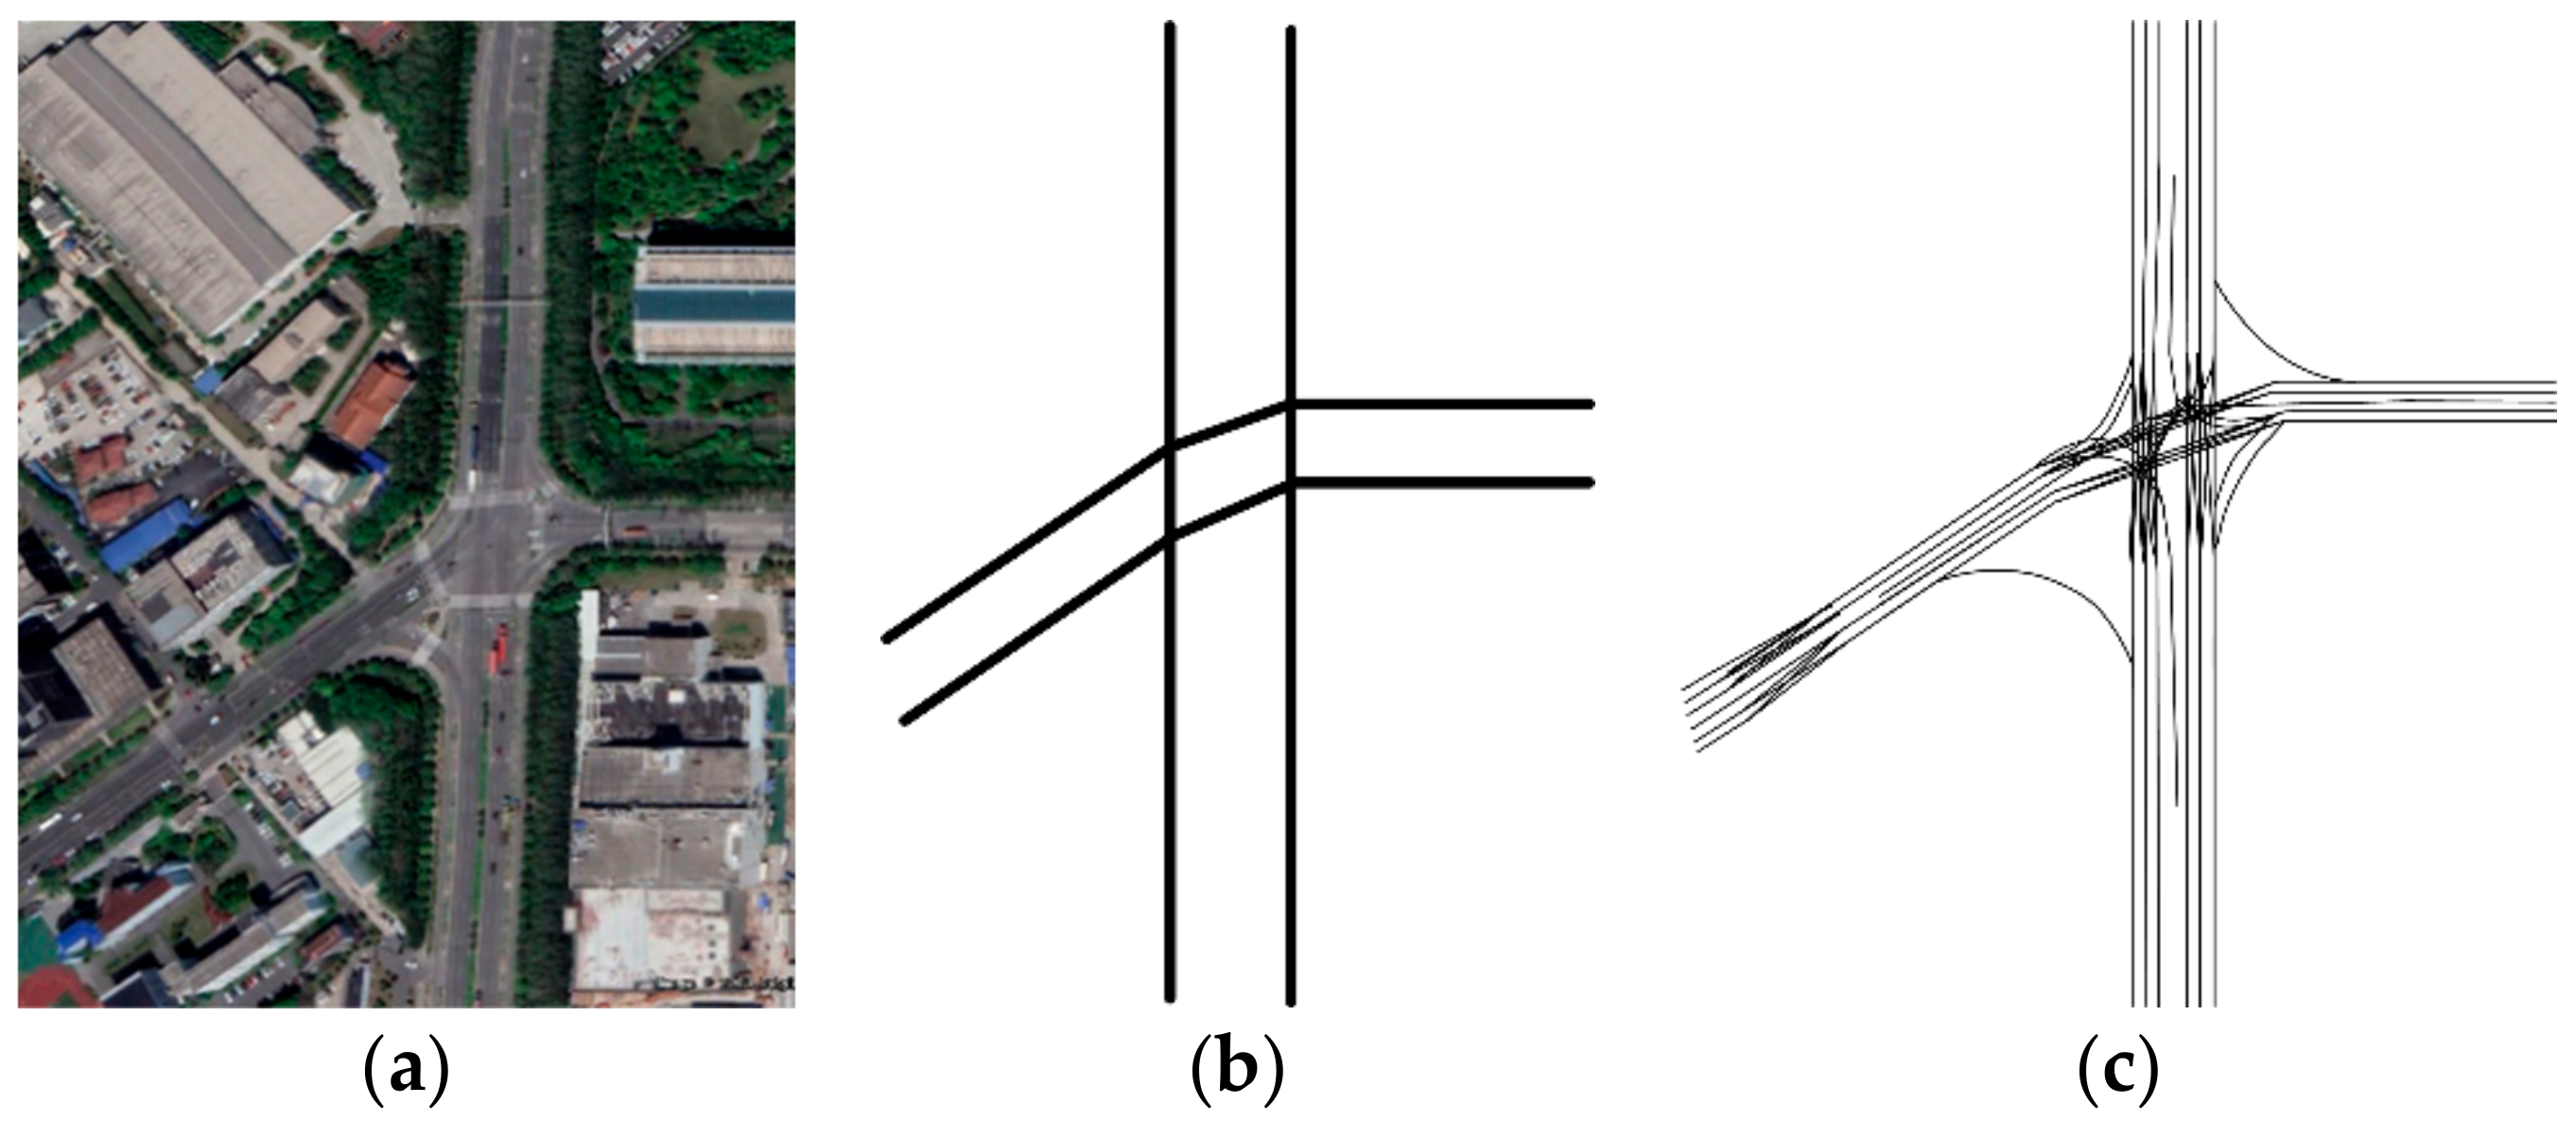
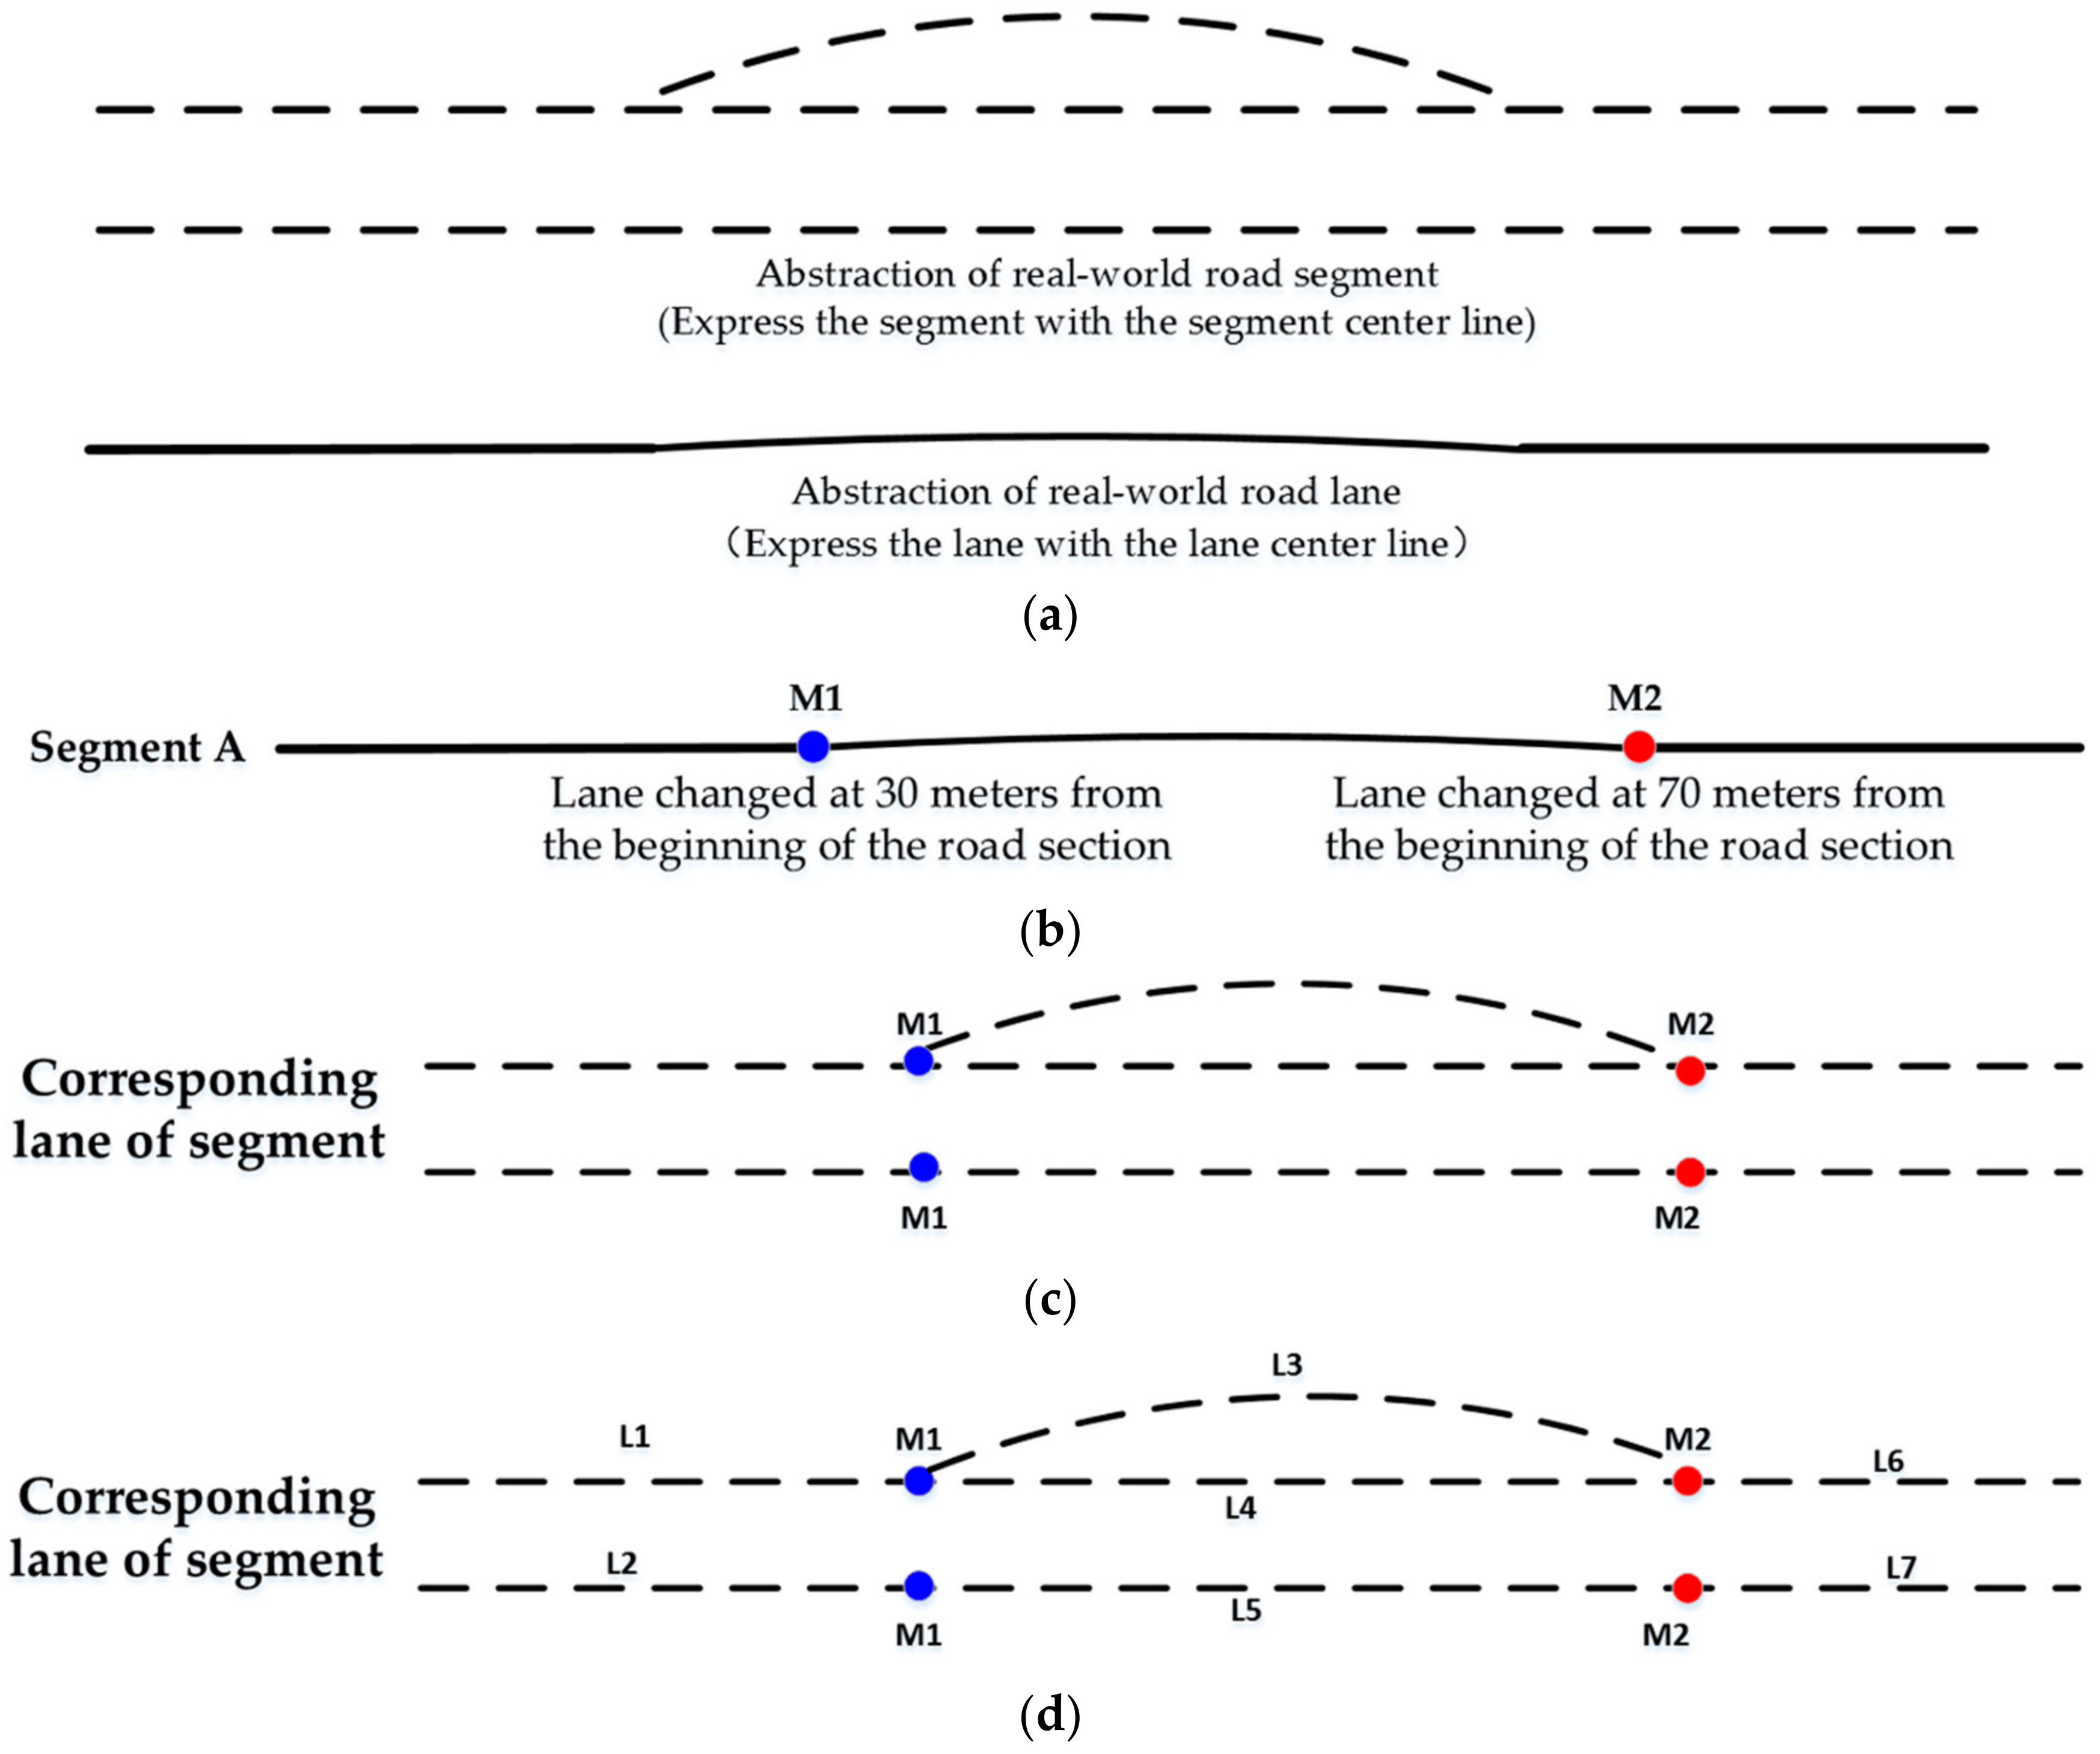
4.3. Generation of Road Network Based on Relationships between Linear Event Points

We divided road segments into two parts if there were two traffic directions. In China, the number of entrance lanes to a road is usually smaller than or equal to the number of the exit lanes of that road segment. We selected a road segment to be the seed road segment and entered the traffic direction. In the entrance direction, if the total number of lanes was odd, the number of lanes on the left-hand side equaled the number of lanes divided by two, rounding down; the opposite was true in the exit direction. If the number of lanes was even, the lanes were equally divided in the two traffic directions. If one end of a lane was pre-set for a road direction, we separated the lanes, extracted the centerlines [34] from the lanes in the same direction of the road segment and obtained the positions of the centerlines. The algorithm began from the current road segment to the next nearest segment. If the angle was less than 90° s, it was a left turn lane; otherwise, it was a right turn lane to the current road segment.

5. Experiments and Results

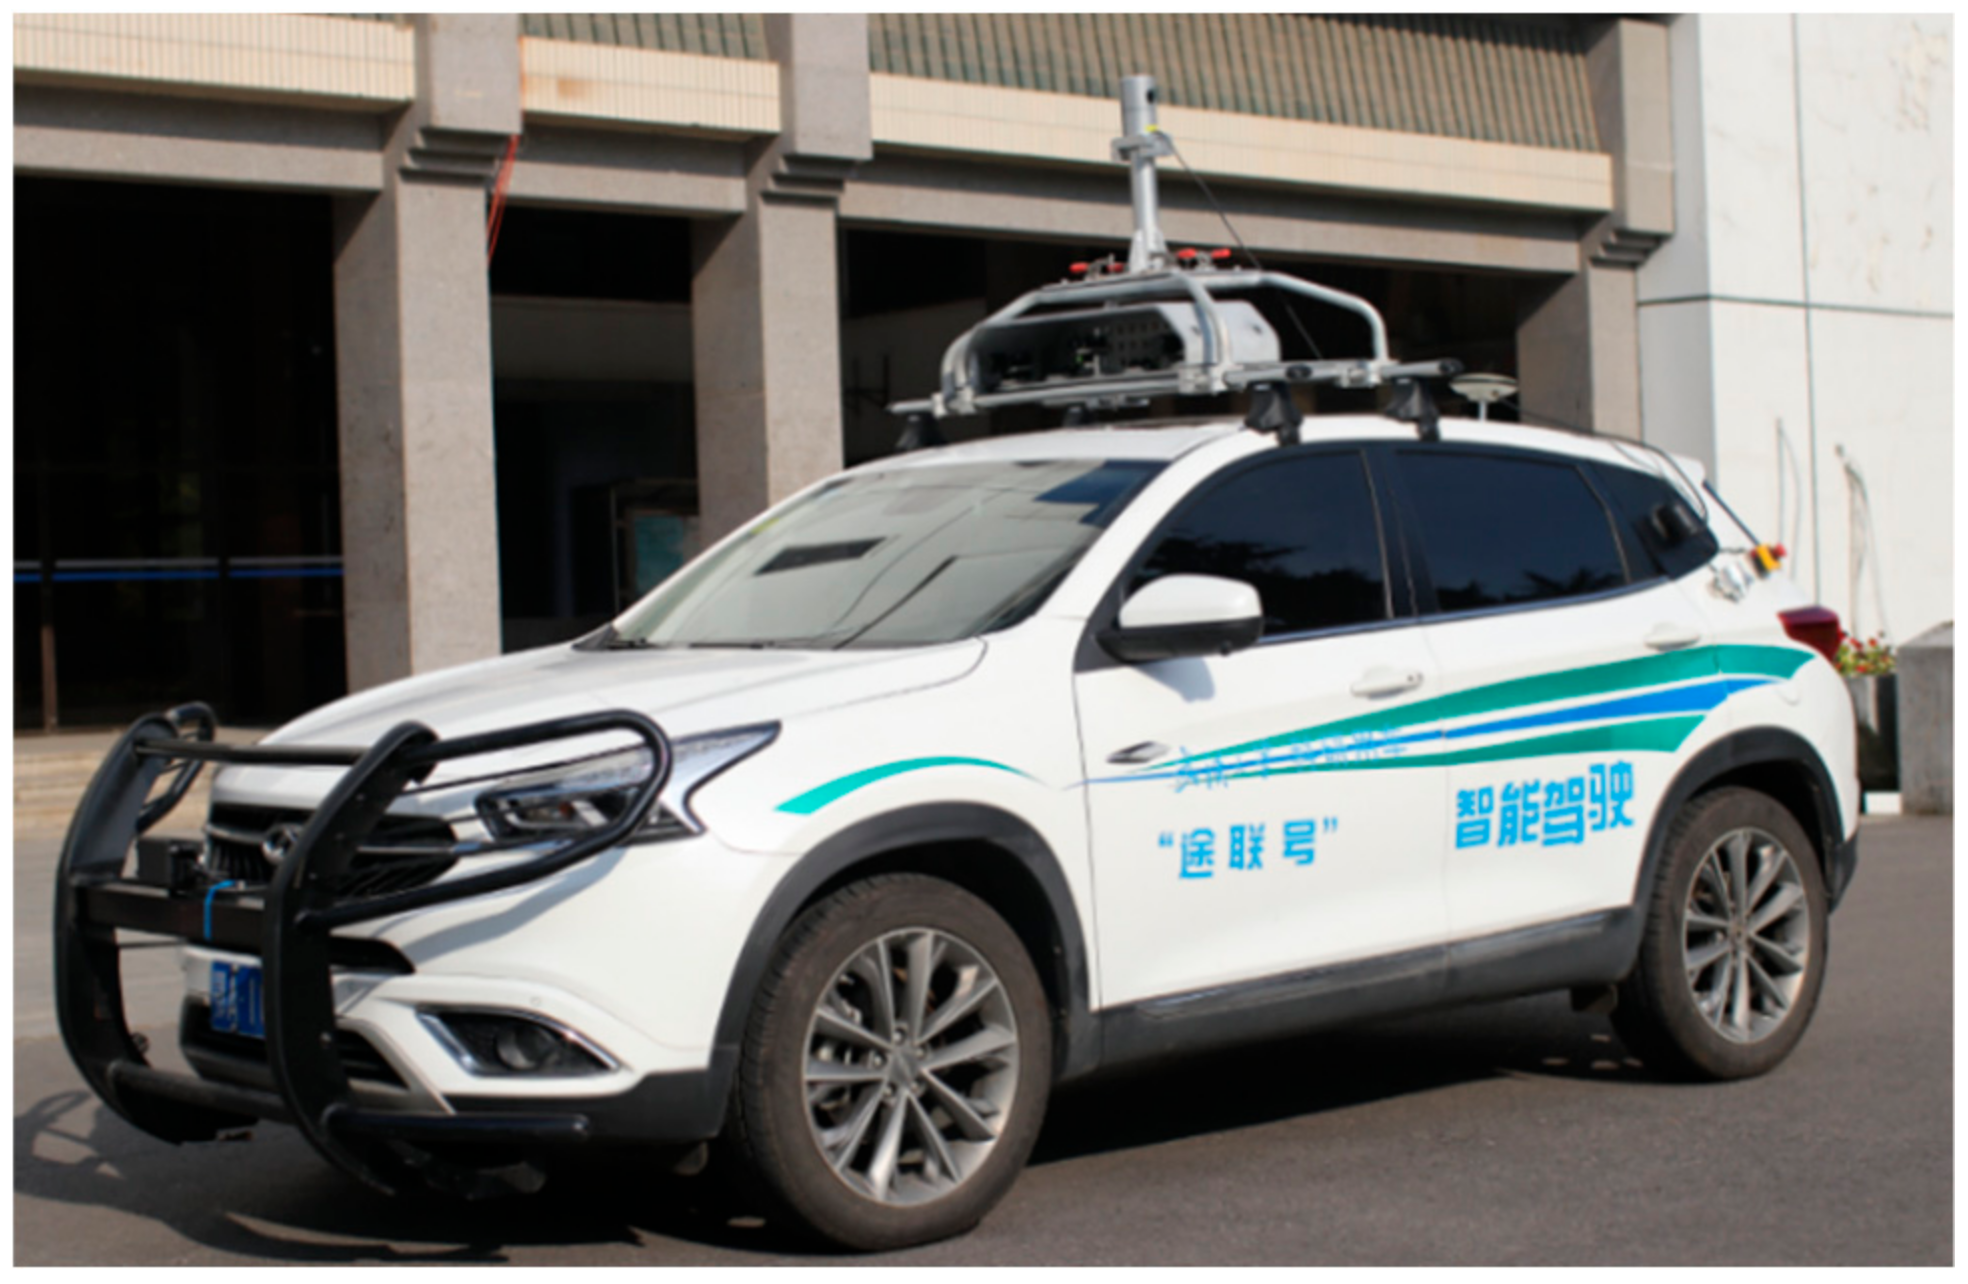
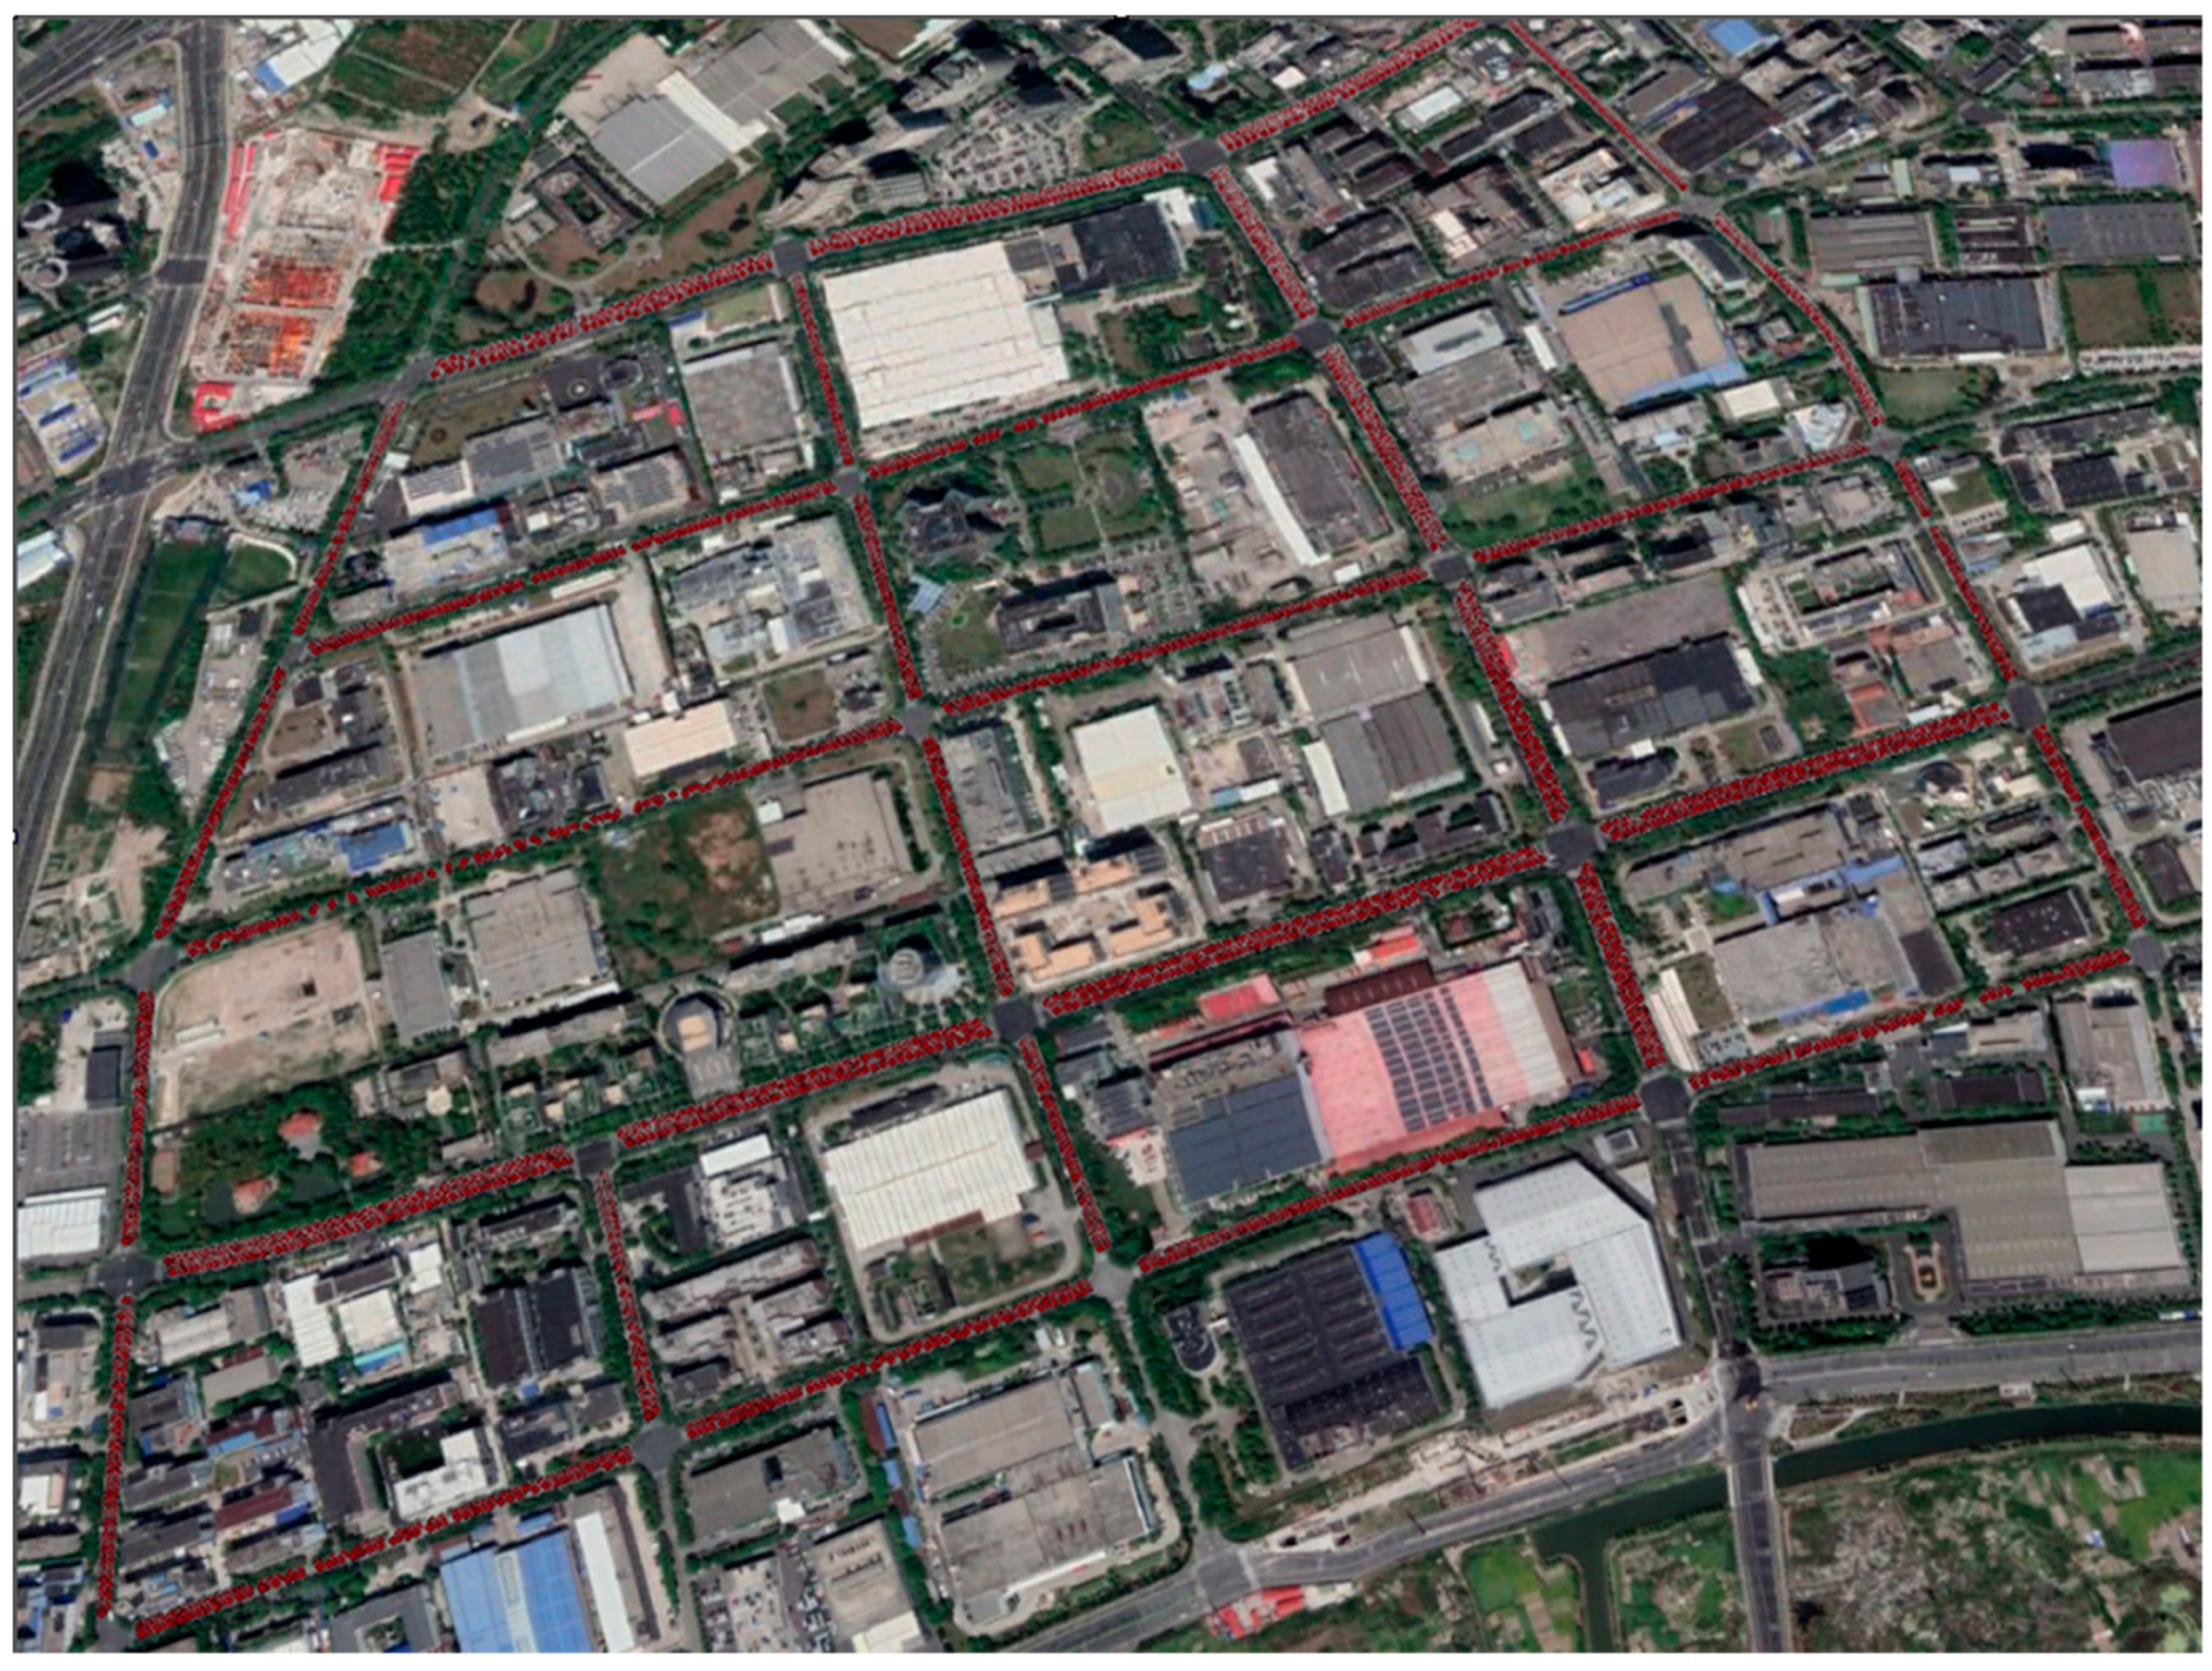
5.1. Data Collection

Our experimental data were collected with a mobile measuring vehicle equipped to collect HD road-network data. The vehicle, refitted by a Chery Tiggo 7 as shown in Figure 5, used the SPAN-FSAS inertial navigation system developed by NovAtel as the positioning system of the vehicle and a Sick DFS60 encoder. The NovAtel SPAN-FSAS system can provide accurate three-dimensional position, velocity and attitude using global navigation satellite system (GNSS) positioning and the stability of the inertial measurement unit (IMU) gyro and accelerometer. The positioning accuracy of this system can reach the centimeter level. Specifications of the IMU are shown in Table 2. The DFS60 is a high-resolution programmable encoder for sophisticated applications. Specifications of the encoder are shown in Table 3. The data-collection frequency for the experiments was 100 Hz. To minimize disturbances on the road when collecting data, we drove the vehicle at 20 km/h along the lane centerline. To preserve the effectiveness of the algorithm, we digitized the experimental area using the digitization technique of the HD road network and obtained the digitized lane-centerline data.

5.2. HDRNM Generation and Evaluation

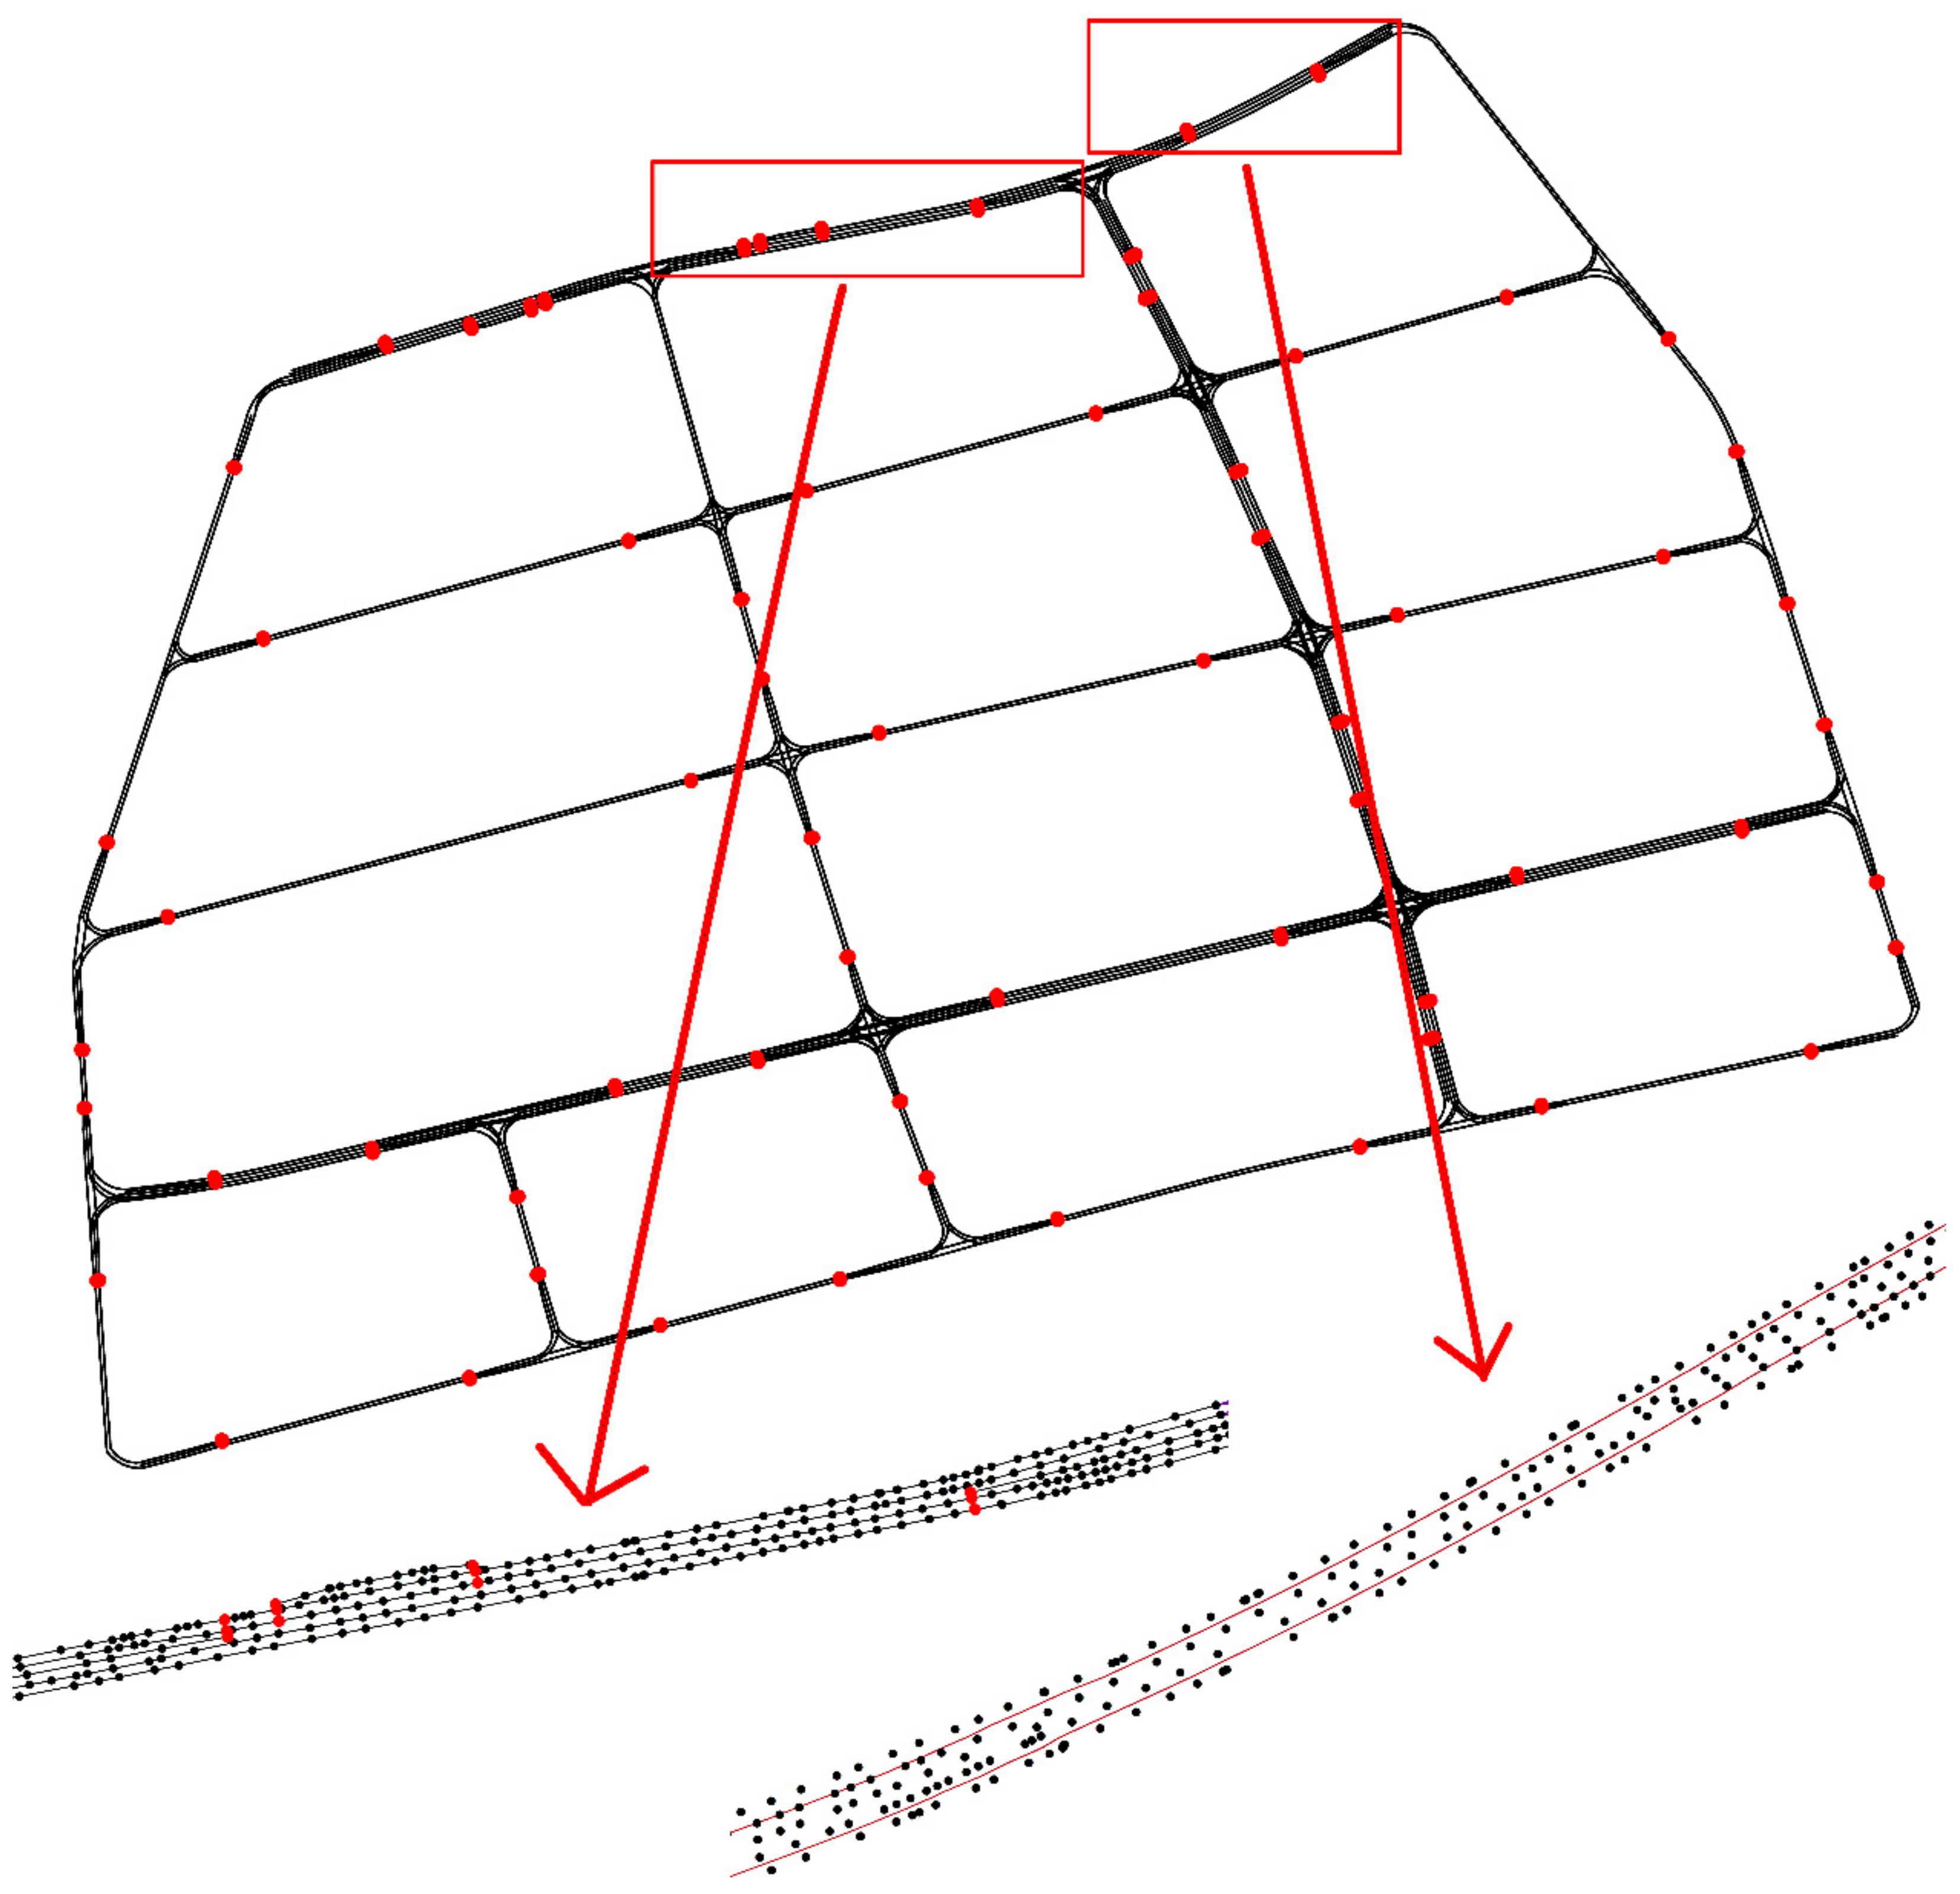
5.2.1. HDRNM Generation

To test our extraction algorithm, we collected road data from Shanghai, China. The study area consisted of 68 road segments over 24 km, for a total of 7559 points, as shown in Figure 6.
Figure 7 shows the final extracted road network. The right-hand inset is the enlarged part of the road network, showing details of the lane-level road network. To maintain the integrity of the road network, we manually connected the traffic-direction lines at intersections.

5.2.2. Generation of Linear Event Points under Different Angle Thresholds

Regarding different road areas, 30° was chosen to be our best search radius. To test how angular thresholds affect the results, 30° and 25° were used to compare the results. Figure 8 represents the linear event points of the lanes in a road segment.
In Figure 8, light orange indicates the lane centerlines L 1 , L 2 and L 3 on road segment R1. The red point M1 represents the linear event point of the lane in the road segment. The green lane represents the lane centerlines L 4 , L 5 and L 6 on road segment R2. The red point M2 represents the linear event point of the lane in the road segment. The road segment and lane data were connected, as shown in Table 4.
Owing to the restrictions of temporary license plates in Shanghai, self-driving vehicles are not allowed on roads from 7:00–10:00 a.m. daily. The permission function for the above lanes is:
P a s s i n g V a l u e ( t )   =   p ( t 7 )     p ( t 10 ) .

5.2.3. Evaluation of HDRNM Accuracy

We next calculated the precision of these results. True-positive indicated correctly-extracted results, and false-positive indicated incorrectly-extracted results with the proposed method, as shown in Equation (14):
P r e c i s i o n _ S c o r e = T p o s i t i v e T p o s i t i v e + F p o s i t i v e 100 % .
Table 5 presents the extraction results of road segments, lanes and points in the entire study area. In this experiment, we selected search radii of 25 and 30 m and an angular threshold of 25°.

6. Discussion

According to our experimental results, high precision and better representation of the topological relations between road segments and lanes of the HDRNM were achieved in the road-network data derived from mobile measuring vehicles. In addition, the construction of the HDRNM realized high extraction accuracy employing the method proposed in this study. These findings reveal an important new model and strategy for the expression of an HDRN designed for self-driving vehicles.
Our experimental results show that the extracted theoretical lane network appears to be entirely consistent with the real world. The HDRNM obtained presented higher precision than those reported earlier [15,21]. Moreover, based on empirical data from two lanes, the minimum search radius searchR should be greater than or equal to 20 m. In the case of six lanes, the minimum search radius should be greater than 25 m. The precision of road-segment extraction was 100%, and that for lane extraction was 97.4% when a search radius of 30 m was selected. Experimental results further indicate that when lanes were straight lines, the extraction was accurate. Most errors occurred when the sampling range of multiple lanes was large and the attributes changed drastically. The error for linear-event-point extraction was mainly caused by errors in the starting point of the lane.
Despite the significant advantages mentioned above, it should be noted that we examined only the case of a simple road-network structure in this study, one in which the number of lanes was less than or equal to six. In other words, we are unable to construct an HDRNM of more than six lanes from these data automatically. Unfortunately, we have not addressed all the problems of the model, such as a road network with dynamically-changing physical connections.

7. Conclusions

We have proposed an HDRNM for self-driving vehicles in this paper, the key contribution of which is the proposed projection relationship between road segments and lanes. The main conclusion that can be drawn is that our model has not only defined a road-segment layer and a lane layer, but has also defined relationships between lanes and road segments in detail. To represent the topological relations between road segments and lanes better, a PCA algorithm under multi-directional constraints was used to cluster multi-lane centerlines automatically. To establish the projection relationship between lanes and road segments and segment the lanes, linear metric values of road segments based on the linear benchmark were used to map the positions to the road and lane networks. Although the current study was based on a small sample area, the results suggest that the proposed approach enriches the details of the HD road network, satisfying the requirements for self-driving. Moreover, this method can also be applied to assess the results of an HD lane-level road network automatically.
However, the proposed method had high requirements for data accuracy and density; it is difficult to extract data from sparse lane centerlines. To reduce the dependency on the sampling-point data, future studies should be devoted to the development of the buffer search area based on the road direction, replacing the existing circular search area. Moreover, the data collected for this study were more than needed to model the road network; therefore, there is room for simplification of data storage. Consequently, simulating lane curves of segments might be an important future research direction.

Author Contributions

This research was completed jointly by all the authors. B.L. and L.Z. mainly conducted and designed the experiments. L.Z. performed the experiments and wrote the paper. H.Z. assisted with the experimental design. Y.S. and J.Z. conducted the data collection and analysis.

Funding

This research was funded by the National Natural Science Foundation of China (Grant Nos. 41671441, 41531177 and U1764262).

Conflicts of Interest

The authors declare no conflicts of interest.’

References

  1. Nedevschi, S.; Popescu, V.; Danescu, R.; Marita, T.; Oniga, F. Accurate ego-vehicle global localization at intersections through alignment of visual data with digital map. IEEE Trans. Intell. Transp. Syst. 2013, 14, 673–687. [Google Scholar] [CrossRef]
  2. Bétaille, D.; Toledo-Moreo, R. Creating enhanced maps for lane-level vehicle navigation. IEEE Trans. Intell. Transp. Syst. 2010, 11, 786–798. [Google Scholar] [CrossRef]
  3. Rohani, M.; Gingras, D.; Gruyer, D. A novel approach for improved vehicular positioning using cooperative map matching and dynamic base station DGPS concept. IEEE Trans. Intell. Transp. Syst. 2016, 17, 230–239. [Google Scholar] [CrossRef]
  4. Suganuma, N.; Uozumi, T. Precise Position Estimation of Autonomous Vehicle Based on Map-Matching. In Proceedings of the Intelligent Vehicles Symposium, Baden-Baden, Germany, 5–9 June 2011; pp. 296–301. [Google Scholar]
  5. Aeberhard, M.; Rauch, S.; Bahram, M.; Tanzmeister, G. Experience, results and lessons learned from automated driving on Germany’s highways. IEEE Intell. Transp. Syst. Mag. 2015, 7, 42–57. [Google Scholar] [CrossRef]
  6. Toledo-Moreo, R.; Betaille, D.; Peyret, F.; Laneurit, J. Fusing GNSS, dead-reckoning, and enhanced maps for road vehicle lane-level navigation. IEEE J. Sel. Top. Signal Process. 2009, 3, 798–809. [Google Scholar] [CrossRef]
  7. Driankov, D.; Saffiotti, A. Fuzzy Logic Techniques for Autonomous Vehicle Navigation; Physica: Heidelberg, Germany, 2013; Volume 61. [Google Scholar]
  8. Gaoya, G.; Damerow, F.; Flade, B.; Helmling, M.; Eggert, J. Camera to map alignment for accurate low-cost lane-level scene interpretation. In Proceedings of the Intelligent Transportation Systems (ITSC), Rio de Janeiro, Brazil, 1–4 November 2016; pp. 498–504. [Google Scholar]
  9. Gruyer, D.; Belaroussi, R.; Revilloud, M. Accurate Lateral Positioning from Map Data and Road Marking Detection; Pergamon Press, Inc.: Tarrytown, NY, USA, 2016; Volume 43, pp. 1–8. [Google Scholar]
  10. Hao, L.; Nashashibi, F.; Toulminet, G. Localization for intelligent vehicle by fusing mono-camera, low-cost GPS and map data. In Proceedings of the International IEEE Conference on Intelligent Transportation Systems, Funchal, Portugal, 19–22 September 2010; pp. 1657–1662. [Google Scholar]
  11. Bo, T.; Khokhar, S.; Gupta, R. Turn prediction at generalized intersections. In Proceedings of the Intelligent Vehicles Symposium (IV), Seoul, Korea, 28 June–1 July 2015; pp. 1399–1404. [Google Scholar]
  12. Kim, J.; Jo, K.; Chu, K.; Sunwoo, M. Road-model-based and graph-structure-based hierarchical path-planning approach for autonomous vehicles. Proc. Inst. Mech. Eng. Part D 2014, 228, 909–928. [Google Scholar] [CrossRef]
  13. Lozano-Perez, T. Autonomous Robot Vehicles; Springer Science & Business Media: Heidelberg, Germany, 2012. [Google Scholar]
  14. Jingnan, L.; Hangbin, W.; Chi, G.; Hongmin, Z.; Wenwei, Z.; Cheng, Y. Progress and consideration of high precision road navigation map. Eng. Sci. 2018, 20, 99–105. [Google Scholar] [CrossRef]
  15. Chunzhao, G.; Kidono, K.; Meguro, J.; Kojima, Y.; Ogawa, M.; Naito, T. A low-cost solution for automatic lane-level map generation using conventional in-car sensors. IEEE Trans. Intell. Transp. Syst. 2016, 17, 2355–2366. [Google Scholar] [CrossRef]
  16. Mattern, N.; Schubert, R.; Wanielik, G. High-accurate vehicle localization using digital maps and coherency images. In Proceedings of the 2010 IEEE Intelligent Vehicles Symposium (IV), San Diego, CA, USA, 21–24 June 2010; pp. 462–469. [Google Scholar]
  17. Gwon, G.-P.; Hur, W.-S.; Kim, S.-W.; Seo, S.-W. Generation of a precise and efficient lane-level road map for intelligent vehicle systems. IEEE Trans. Veh. Technol. 2017, 66, 4517–4533. [Google Scholar] [CrossRef]
  18. Gikas, V.; Stratakos, J. A novel geodetic engineering method for accurate and automated road/railway centerline geometry extraction based on the bearing diagram and fractal behavior. IEEE Trans. Intell. Transp. Syst. 2012, 13, 115–126. [Google Scholar] [CrossRef]
  19. Máttyus, G.; Wang, S.W.; Fidler, S.; Urtasun, R. HD maps: Fine-grained road segmentation by parsing ground and aerial images. In Proceedings of the IEEE Conference on Computer Vision and Pattern Recognition, Las Vegas, NV, USA, 27–30 June 2016; pp. 3611–3619. [Google Scholar]
  20. Xue, Y.; Luliang, T.; Le, N.; Xia, Z.; Qingquan, L. Generating lane-based intersection maps from crowdsourcing big trace data. Transp. Res. Part C Emerg. Technol. 2018, 89, 168–187. [Google Scholar] [CrossRef]
  21. Tao, Z.; Stefano, A.; Marco, G.; Dian-ge, Y.; Cheli, F. A lane-level road network model with global continuity. Transp. Res. Part C Emerg. Technol. 2016, 71, 32–50. [Google Scholar] [CrossRef]
  22. Tao, Z.; Diange, Y.; Ting, L.; Keqiang, L.; Xiaomin, L. An improved virtual intersection model for vehicle navigation at intersections. Transp. Res. Part C Emerg. Technol. 2011, 19, 413–423. [Google Scholar] [CrossRef]
  23. Jo, K.; Lee, M.; Kim, C.; Sunwoo, M. Construction process of a three-dimensional roadway geometry map for autonomous driving. Proc. Inst. Mech. Eng. Part D 2017, 231, 1414–1434. [Google Scholar] [CrossRef]
  24. Anning, C.; Ramanandan, A.; Farrell, J.A. High-precision lane-level road map building for vehicle navigation. In Proceedings of the 2010 IEEE/ION Position Location and Navigation Symposium (PLANS), Indian Wells, CA, USA, 4–6 May 2010; pp. 1035–1042. [Google Scholar]
  25. Karagiorgou, S.; Pfoser, D.; Skoutas, D. A layered approach for more robust generation of road network maps from vehicle tracking data. ACM Trans. Spat. Algorithm. Syst. 2017, 3, 3. [Google Scholar] [CrossRef]
  26. Xingzhe, X.; Wong, K.B.-Y.; Aghajan, H.; Veelaert, P.; Philips, W. Road network inference through multiple track alignment. Transp. Res. Part C Emerg. Technol. 2016, 72, 93–108. [Google Scholar] [CrossRef]
  27. Jia, Q.; Wang, R. Automatic extraction of road networks from GPS traces. Photogramm. Eng. Remote. Sens. 2016, 82, 593–604. [Google Scholar] [CrossRef]
  28. Jie, D.; Matthew, J.B. Next-generation automated vehicle location systems: Positioning at the lane level. IEEE Trans. Intell. Transp. Syst. 2008, 9, 48–57. [Google Scholar] [CrossRef]
  29. Crash Avoidance Metrics Partnership. Enhanced Digital Mapping Project: Final Report; Technical Report; Crash Avoidance Metrics Partnership: Washington, DC, USA, 2004. Available online: https://rosap.ntl.bts.gov/view/dot/3704 (accessed on 29 October 2018).
  30. Jia, Q.; Wang, R.W. Road map inference: A segmentation and grouping framework. ISPRS Int. J. Geo-Inf. 2016, 5, 130. [Google Scholar] [CrossRef]
  31. Lin, L.; Daigang, L.; Xiaoyu, X.; Fan, Y.; Wei, R.; Haihong, Z. Extraction of road intersections from GPS traces based on the dominant orientations of roads. ISPRS Int. J. Geo-Inf. 2017, 6, 403. [Google Scholar] [CrossRef]
  32. Framework Data Exchange Format for Navigation Electronic Map; Standards Press of China: Beijing, China, 2017.
  33. Jolliffe, I. Principal component analysis. In International Encyclopedia of Statistical Science; Springer: Berlin, Germany, 2011; pp. 1094–1096. [Google Scholar]
  34. Xuechen, L.; Hongchao, F.; Bisheng, Y.; Qiuping, L. Arterial Roads Extraction in Urban Road NetworksBased on Shape Analysis. Geomat. Inf. Sci. Wuhan Univ. 2014, 39, 327–331. [Google Scholar] [CrossRef]
Figure 1. Diagram of the proposed method.
Ijgi 07 00417 g001
Figure 2. Abstraction of real-world road-network and lane-network layers: (a) real world; (b) road-network layer; and (c) lane-network layer.
Ijgi 07 00417 g002
Figure 3. Example showing the impact of attribute-changing points on a self-driving (black lines are lane boundaries; black arrows indicate traffic direction; and red boxes are attribute-changing points): (a) compulsory lane-switching point; (b) optional lane-switching point; and (c) radius-changing point when turning.
Ijgi 07 00417 g003
Figure 4. Lane segmentation based on linear event points (solid black lines indicate the centerline of road segments, and dotted lines indicate the lane centerline): (a) real-world abstraction; (b) linear metric system with reference to the road segment; (c) linear metric system projected onto the lane in the same direction; and (d) segmenting lane based on linear event points of the lane.
Ijgi 07 00417 g004
Figure 5. Experimental data-collection vehicle equipped with high-precision positioning system.
Ijgi 07 00417 g005
Figure 6. Original survey area (red dots are collected data).
Ijgi 07 00417 g006
Figure 7. Extracted road-network map: Left, illustration of the lane-level road network of the study area, with red dots indicating the linear event points of each lane. Upper right-hand inset, enlarged part of a road-segment network, showing the details of the segment-level road network; red lines are segment lines, and black dots are original points. Lower right-hand inset, enlarged part of the lane network, showing details of the lane-level road network, with black lines indicating lane centerlines and red dots indicating linear event points of each lane.
Ijgi 07 00417 g007
Figure 8. Lane extraction with different thresholds: (a) searchR = 30 m and σ = 25° with the curve generated at linear time point; (b) searchR = 30 m and σ = 15° as an example of incorrect lane division (the red box indicates the wrong location from which to extract data).
Ijgi 07 00417 g008
Table 1. Segmenting lanes in each range based on linear metric measurements, as shown in Figure 4.
Road Segment From Measure (m)To Measure (m) Number of LanesLane Set
A030 2 L 1 ,   L 2
A30703 L 3 ,   L 4 ,   L 5
A701002 L 6 ,   L 7
Table 2. IMU specifications (RMS denotes root mean square).
RollPitchHeadingFrequencyAccuracy
0.015° RMS0.015° RMS 0.040° RMS200 Hz1 cm + 1 ppm
Table 3. Encoder specifications.
ResolutionOptionally ProgrammableElectrical InterfacesDiameter
Up to 16 bitsYes5 and 24 V60 mm
Table 4. Correspondence between road segments and lanes based on linear metric measurements.
SegmentLaneLane Length
R1 L 1 ,   L 2 ,   L 3 L 1   =   19.1   m ,   L 2   =   6.92   m ,   L 3 = 6.48 m
R2 L 4 ,   L 5 , L 6 L 4   =   19.3   m ,   L 5   =   6.23   m ,   L 6 = 6.22 m
Table 5. Comparison of actual and experimental results.
ItemsActual NumberTpositive NumberFpositive NumberPrecision (Precision_Score)
Road segment68680100%
Physically-connected, but
unsegmented lane
155151497.4%
Segmented lane2482401295.2%
Total input coordinate points755975203099.6%
Linear event point15668494%

