Article

Mapping Forest Species in the Central Middle Atlas of Morocco (Azrou Forest) through Remote Sensing Techniques

1
Department of Biology, Soil and Environnement Microbiology Team, Faculty of Sciences, Moulay Ismail University, BP11201, Zitoune, Meknès, Morocco
2
Department of Geology, Water Sciences and Environnement Engineering Team, Faculty of Sciences, Moulay Ismail University, BP11201, Zitoune, Meknès, Morocco
3
Earth Sciences Institute (ICT) and Department of Geosciences, Environment and Land Planning, Faculty of Sciences, University of Porto, 4169-007 Porto, Portugal
*
Author to whom correspondence should be addressed.
ISPRS Int. J. Geo-Inf. 2017, 6(9), 275; https://doi.org/10.3390/ijgi6090275
Submission received: 26 July 2017 / Revised: 12 August 2017 / Accepted: 29 August 2017 / Published: 3 September 2017

Abstract

:
The studies of forest ecosystems from remotely-sensed data are of great interest to researchers because of ecosystem services provided by this ecosystem, including protection of soils and vegetation, climate stabilization, and regulation of the hydrological cycle. In this context, our study focused on the use of a spectral angle mapper (SAM) classification method for mapping species in the Azrou Forest, Central Middle Atlas, Morocco. A Sentinel-2A image combined with ground reference data were used in this research. Four classes (holm oak, cedar forest, bare soil, and others-unclassified) were selected; they represent, respectively, 27, 11, 24, and 38% of the study area. The overall accuracy of classification was estimated to be around 99.72%. This work explored the potential of the SAM classification combined with Sentinel-2A data for mapping land cover in the Azrou Forest ecosystem.

1. Introduction

Forests play a range of services that are crucial for humans and different kinds of fauna. They can provide food and fiber; regulate the hydrological cycle; protect watersheds and their vegetation, water flows, and several types of ecological services [1,2,3,4,5]. However, natural equilibria in ecosystem services provided by our forests have been dramatically reduced because of natural and human-induced causes [6].
The Food and Agriculture Organization for United Nations [7] mentions that global forest area fell by 129 million hectares (3.1%) in the period 1990–2015, to just under 4 billion hectares.
Forest cover since the 1950s in the Mediterranean area has been lost at a rate of about 30% [8]. However, according to Hansen et al. [9] the dry tropical biome represented 20% of the total forest cover in 2000, and were being lost at rate of 2.9% between 2000 and 2005. In order to protect and to use those services, the National Forest Inventories have been used and applied in many countries in the world. Despite the role of National Forest Inventories for obtaining information on forest ecosystems, previous studies have shown that they are costly and time-consuming [10].
To overcome this, several authors have made serious efforts to seek and develop new approaches for the identification of degraded areas in forests [11,12], to map and classify different forest species through the use of satellite imagery [13,14,15].
Several classification methods have been applied in land cover mapping, commonly distinguished in a first approach: those focused on artificial intelligence, such as artificial neural networks (ANN) [16] and those oriented towards supervised or unsupervised algorithms, including maximum likelihood (ML) classification [17], decision tree (DT) classifier [18,19,20], the k-nearest neighbors (K-NN) method [21], and support vector machine (SVM) [22,23,24]. Among those algorithms, our approach was based on the spectral angle mapper (SAM) because of its quickness and ease of use, independence from illumination variations, as well as its use in several studies [25]. In addition, according to Bonn [15], mapping and monitoring species in forest ecosystems of the Middle Atlas Mountains of Morocco is complicated due to considerable physical and environmental variability; both at spatial and spectral scales. This variability limits the use of the conventional methods and spectral indices for this task. To better overcome these challenges, they have used ASTER (Advanced Spaceborne Thermal Emission and Reflection Radiometer) images to compare the performances of linear spectral mixture analysis (LSMA) and SAM for mapping and discrimination of species in this forest ecosystem. Hence, Sentinel-2A with high spatial, spectral, and temporal resolution combined with SAM can be used to improve discrimination of species in such areas of study.
Several authors employed different remotely-sensed data and different algorithms to map forest types in non-tropical areas. For instance, Shen et al. [26] investigated and demonstrated the mapping potential of the forest ecosystem at the tree species level from high spatial resolution hyperspectral images (Airborne Imaging Spectrometer for Applications—AISA), in Hachioji, Japan. The mapping performance of eight conventional classification methods were tested—including SAM, which achieved the best result. Additionally, Kachmar et al. [27] used Landsat 5 TM data, in order to classify dominant forest cover types in the Naeba Mountains of Japan considering the SAM classifier. Silva [28] used a dataset composed by a several Landsat-5 TM and Rapid-Eye images from the Paraíba Valley (Brazil). They used training data from 2011 to build a spectral reference library considering the Landsat-5 TM spectral signatures for each land use/land cover LULC (eight classes were considered). The spectral library was then used to classify the time series of Landsat-5 TM images (years 1985, 1994, 1995, 2005, and 2011) with SAM. Troyer et al. [29] aimed to create a higher spatial resolution LULC dataset for the entire Little Miami River watershed in Southeast Ohio for a number of studies being conducted by the U.S. Environmental Protection Agency (U.S. EPA). The LULC classification was derived from 82 flight lines of Compact Airborne Spectrographic Imager (CASI) hyperspectral imagery. They used several classification algorithms, including maximum likelihood classification (MLC), SAM, and the classification and regression tree (CART), however, no single algorithm alone proved to be capable of successfully classifying the hyperspectral data. Nevertheless, SAM produced the best results. However, in the works previously cited, none of them used Sentinel-2A data combined with SAM. SAM treats the spectra as vectors in a space with dimensionality equal to the number of bands used. Using the SAM classifier and spectrally-suitable forest training areas, forest cover types are classified and their accuracies are related to topographic correction methods, applied and localized land use, and land cover change occurring in the study area [27]. Moreover, SAM’s advantage over more ‘traditional’ classifiers is its relative insensitivity to illumination and albedo effects inherent with remotely-sensed imagery [30].
Until recently, the availability of Sentinel-2A as an instrument with high spatial, spectral, and temporal resolution has opened up other opportunities for this aim. This is the novelty presented in this work, the combination of Sentinel-2A data with SAM in order to map forest species in a non-tropical area.
The aim of this work was to map and classify the dominant forest species in the Azrou Forest in the Central Middle Atlas region of Morocco by using high spatial resolution satellite images (Sentinel -2A), based on the spectral angle mapping (SAM) supervised classification method. In this context, our methodology represents a powerful step because the use of SAM for this focus with Sentinel-2A has not yet been fully explored and has not been tested, until now, in this study area. Furthermore, this approach has valuable implications for forest cover mapping in other areas, specifically where field surveys and field data are costly and time consuming.

2. Materials and Methods
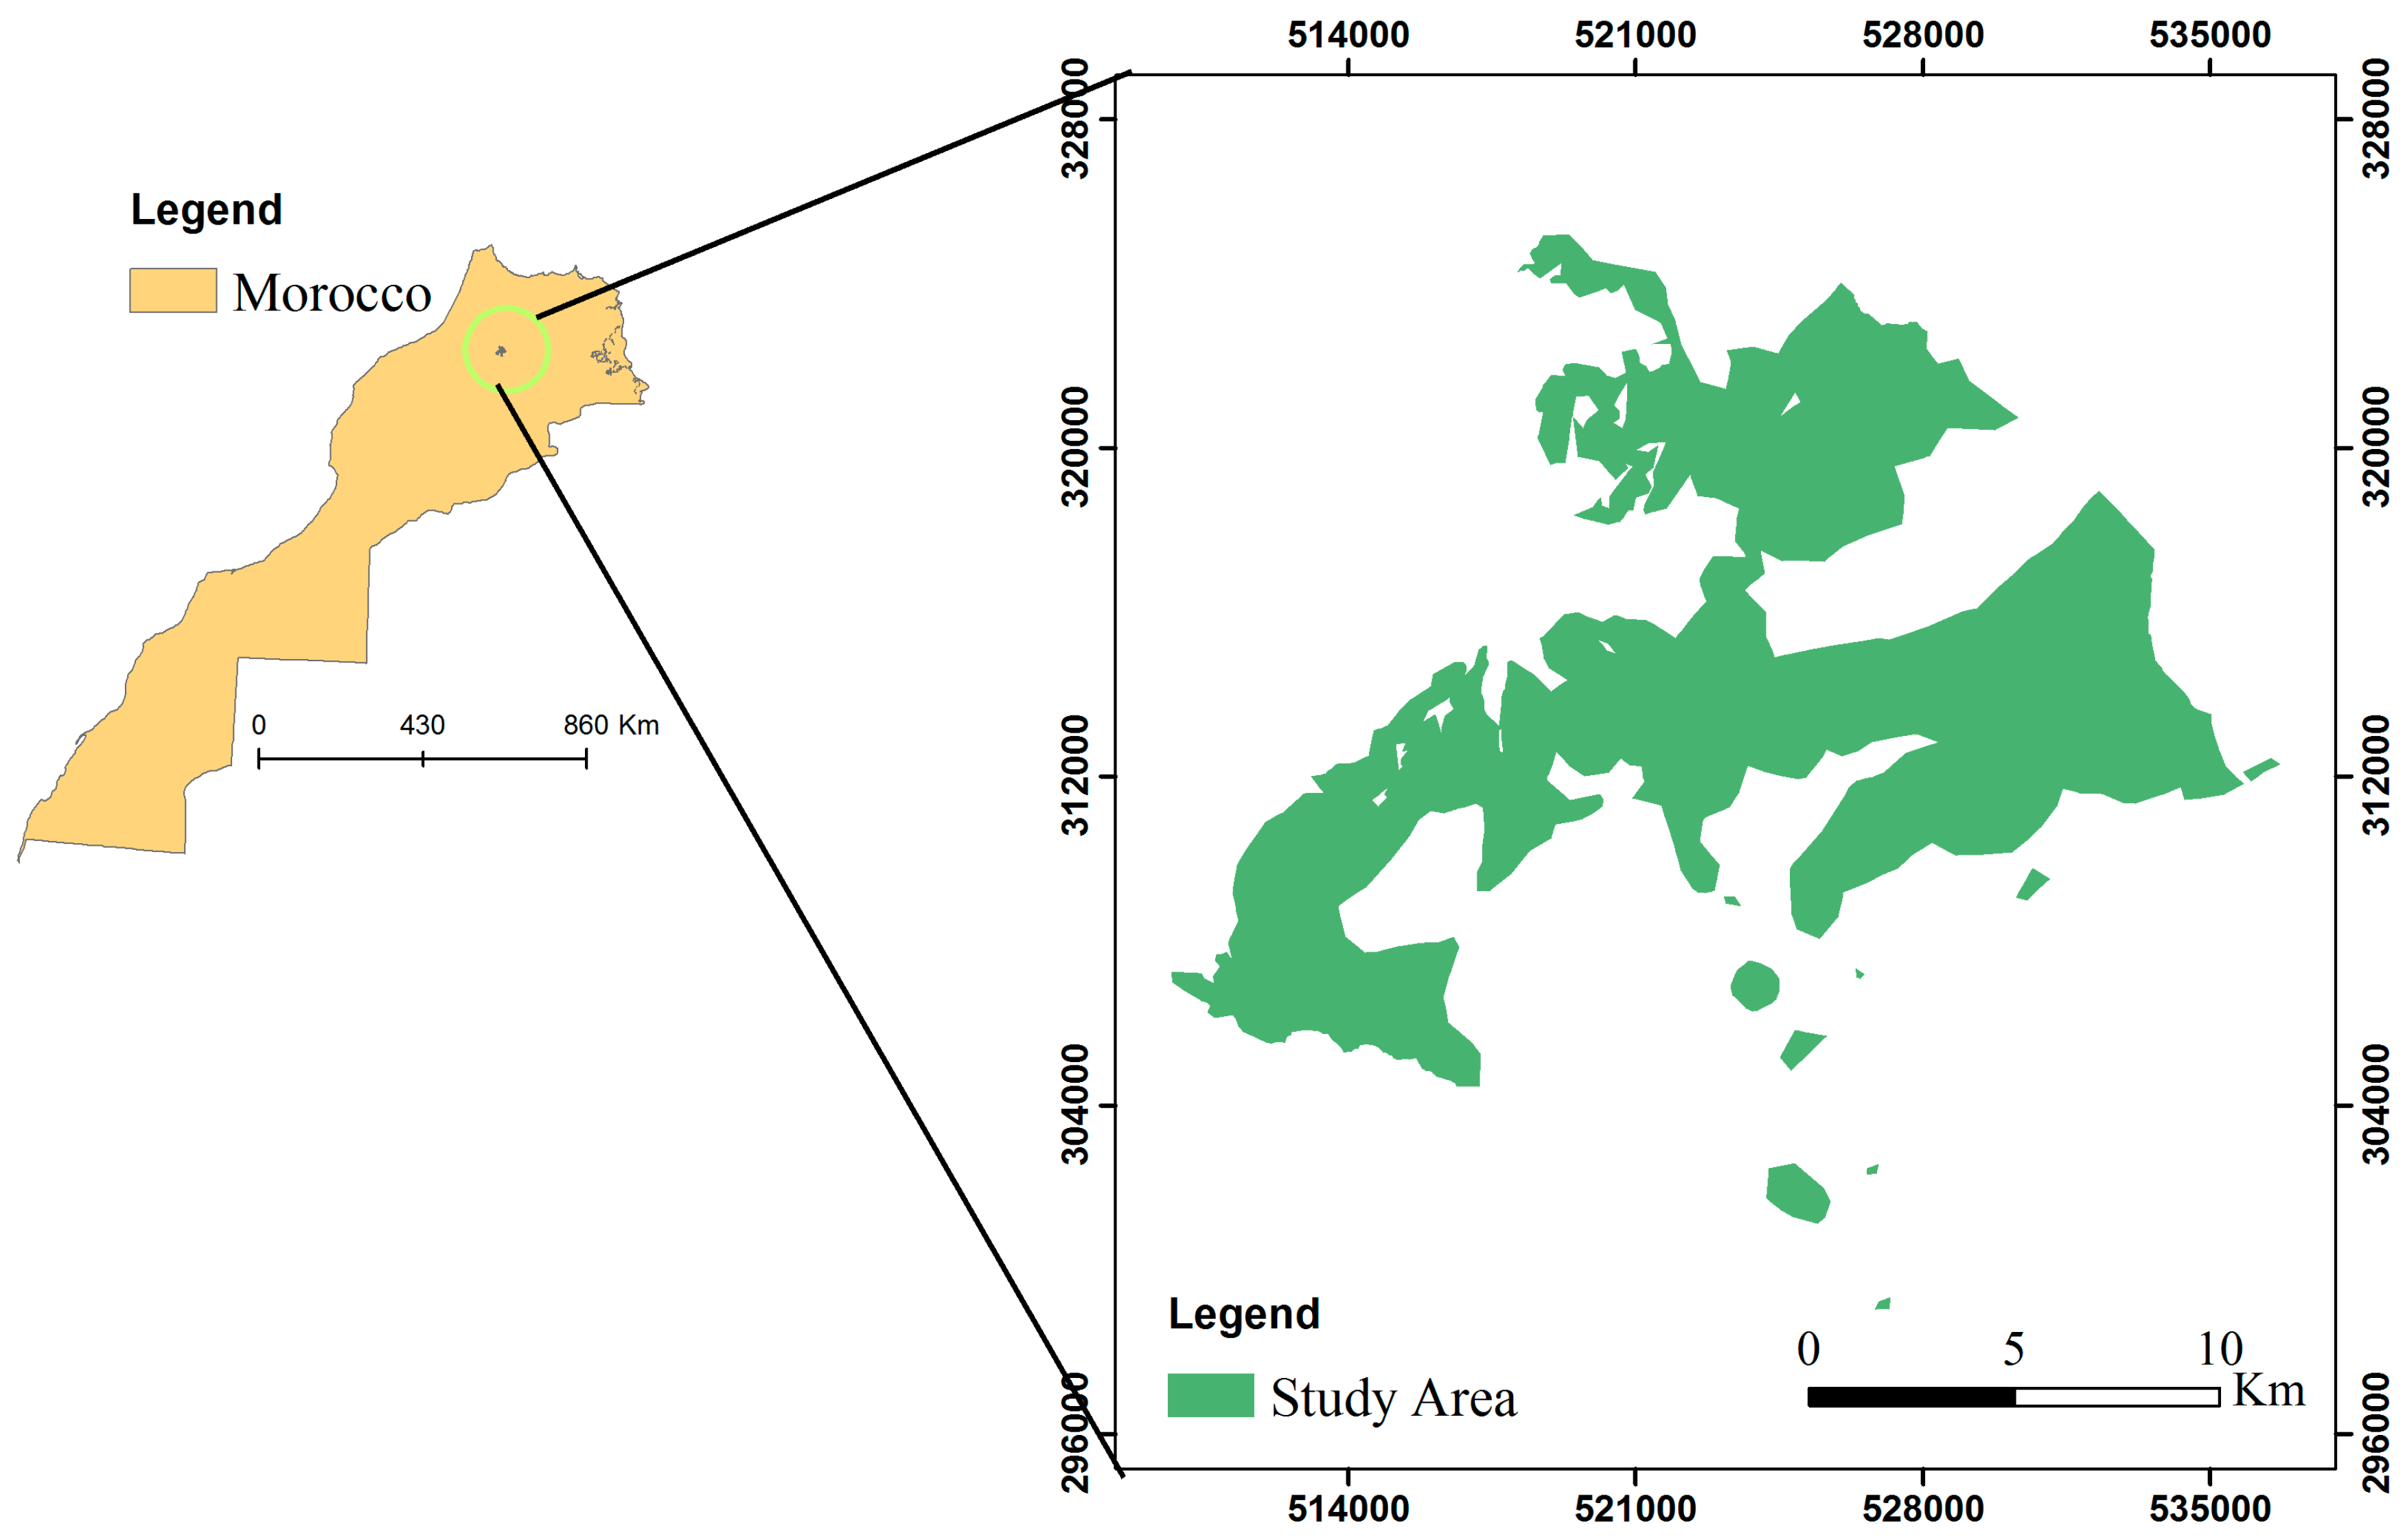
2.1. Study Area

The study area is located in the Central Middle Atlas of Morocco (Figure 1), between 5°34′1.415″ W/5°52′5.464″ W and 37°1′25.700″ N/36°59′27.554″ N, and it covers approximately 24,588 ha. The climate is typically Mediterranean with annual rainfall varying from 563 mm to 1122 mm, while the maximum temperature is around 30.3 °C at Ifrane Meteorological Station and 43 °C at Tagounit Meteorological Station. July and August are the driest months in the study area.
As a result of forest management plan, the species composition of the area is highly heterogeneous, mainly covered by evergreen cedar (Cedrus atlantica); pure stands or mixed with evergreen stands of (holm) oak (Quercus ilex L, and/or with Quercus canariensis).
Cedrus atlantica, known as a noble species, representing an important ecological and economic value in Morocco, covers an area of over 130,000 ha distributed in Morocco (Rif, Middle Atlas, and northeast of the High Atlas) and Algeria [31]. It grows in cool, moist environments at elevations between 1300 and 2600 m in the Rif, Middle Atlas, and High Atlas mountains [31,32,33], where the amount of annual rainfall ranges from 500 to 2000 mm and the minimum temperature of the coldest month is between −8 °C and −1 °C [31,34]. Whereas evergreen oak forest constitutes the natural vegetation under semi-arid climates [35].
Still, according to the same plan, the Azrou forest is composed of all types of substrates (limestone, dolomite, and basalt) combined with a wide variety of soils ranging from deep soils to shallow rocky soils.

2.2. Data Description

A Sentinel-2A image acquired on 28 August 2015 was used in this study. It consists of 13 spectral bands from the visible to the SWIR; of which 4 bands have a resolution of 10 m, 6 bands have a resolution of 20 m and 3 bands have a resolution of 60 m.

2.3. Pre-Processing Stage

The pre-processing of the Sentinel 2A image was performed under QGIS software, through the Semi-Automatic Classification Plugin (SCP) interface, developed by Luca Congedo [36]. The pre-processing stage consists of several steps, from the image download to the final image (map). The first step consists of converting the digital number (DN) to the top of atmospheric (TOA) reflectance, followed by the atmospheric correction, where the dark object subtraction (DOS) was considered. The DOS method assumes that atmospheric path radiance is the radiance value measured by the satellite for the darkest object within the image, usually clear water bodies or areas in complete shadow [37]. This model corrects only the atmospheric additive scattering component.

2.4. Supervised Classification
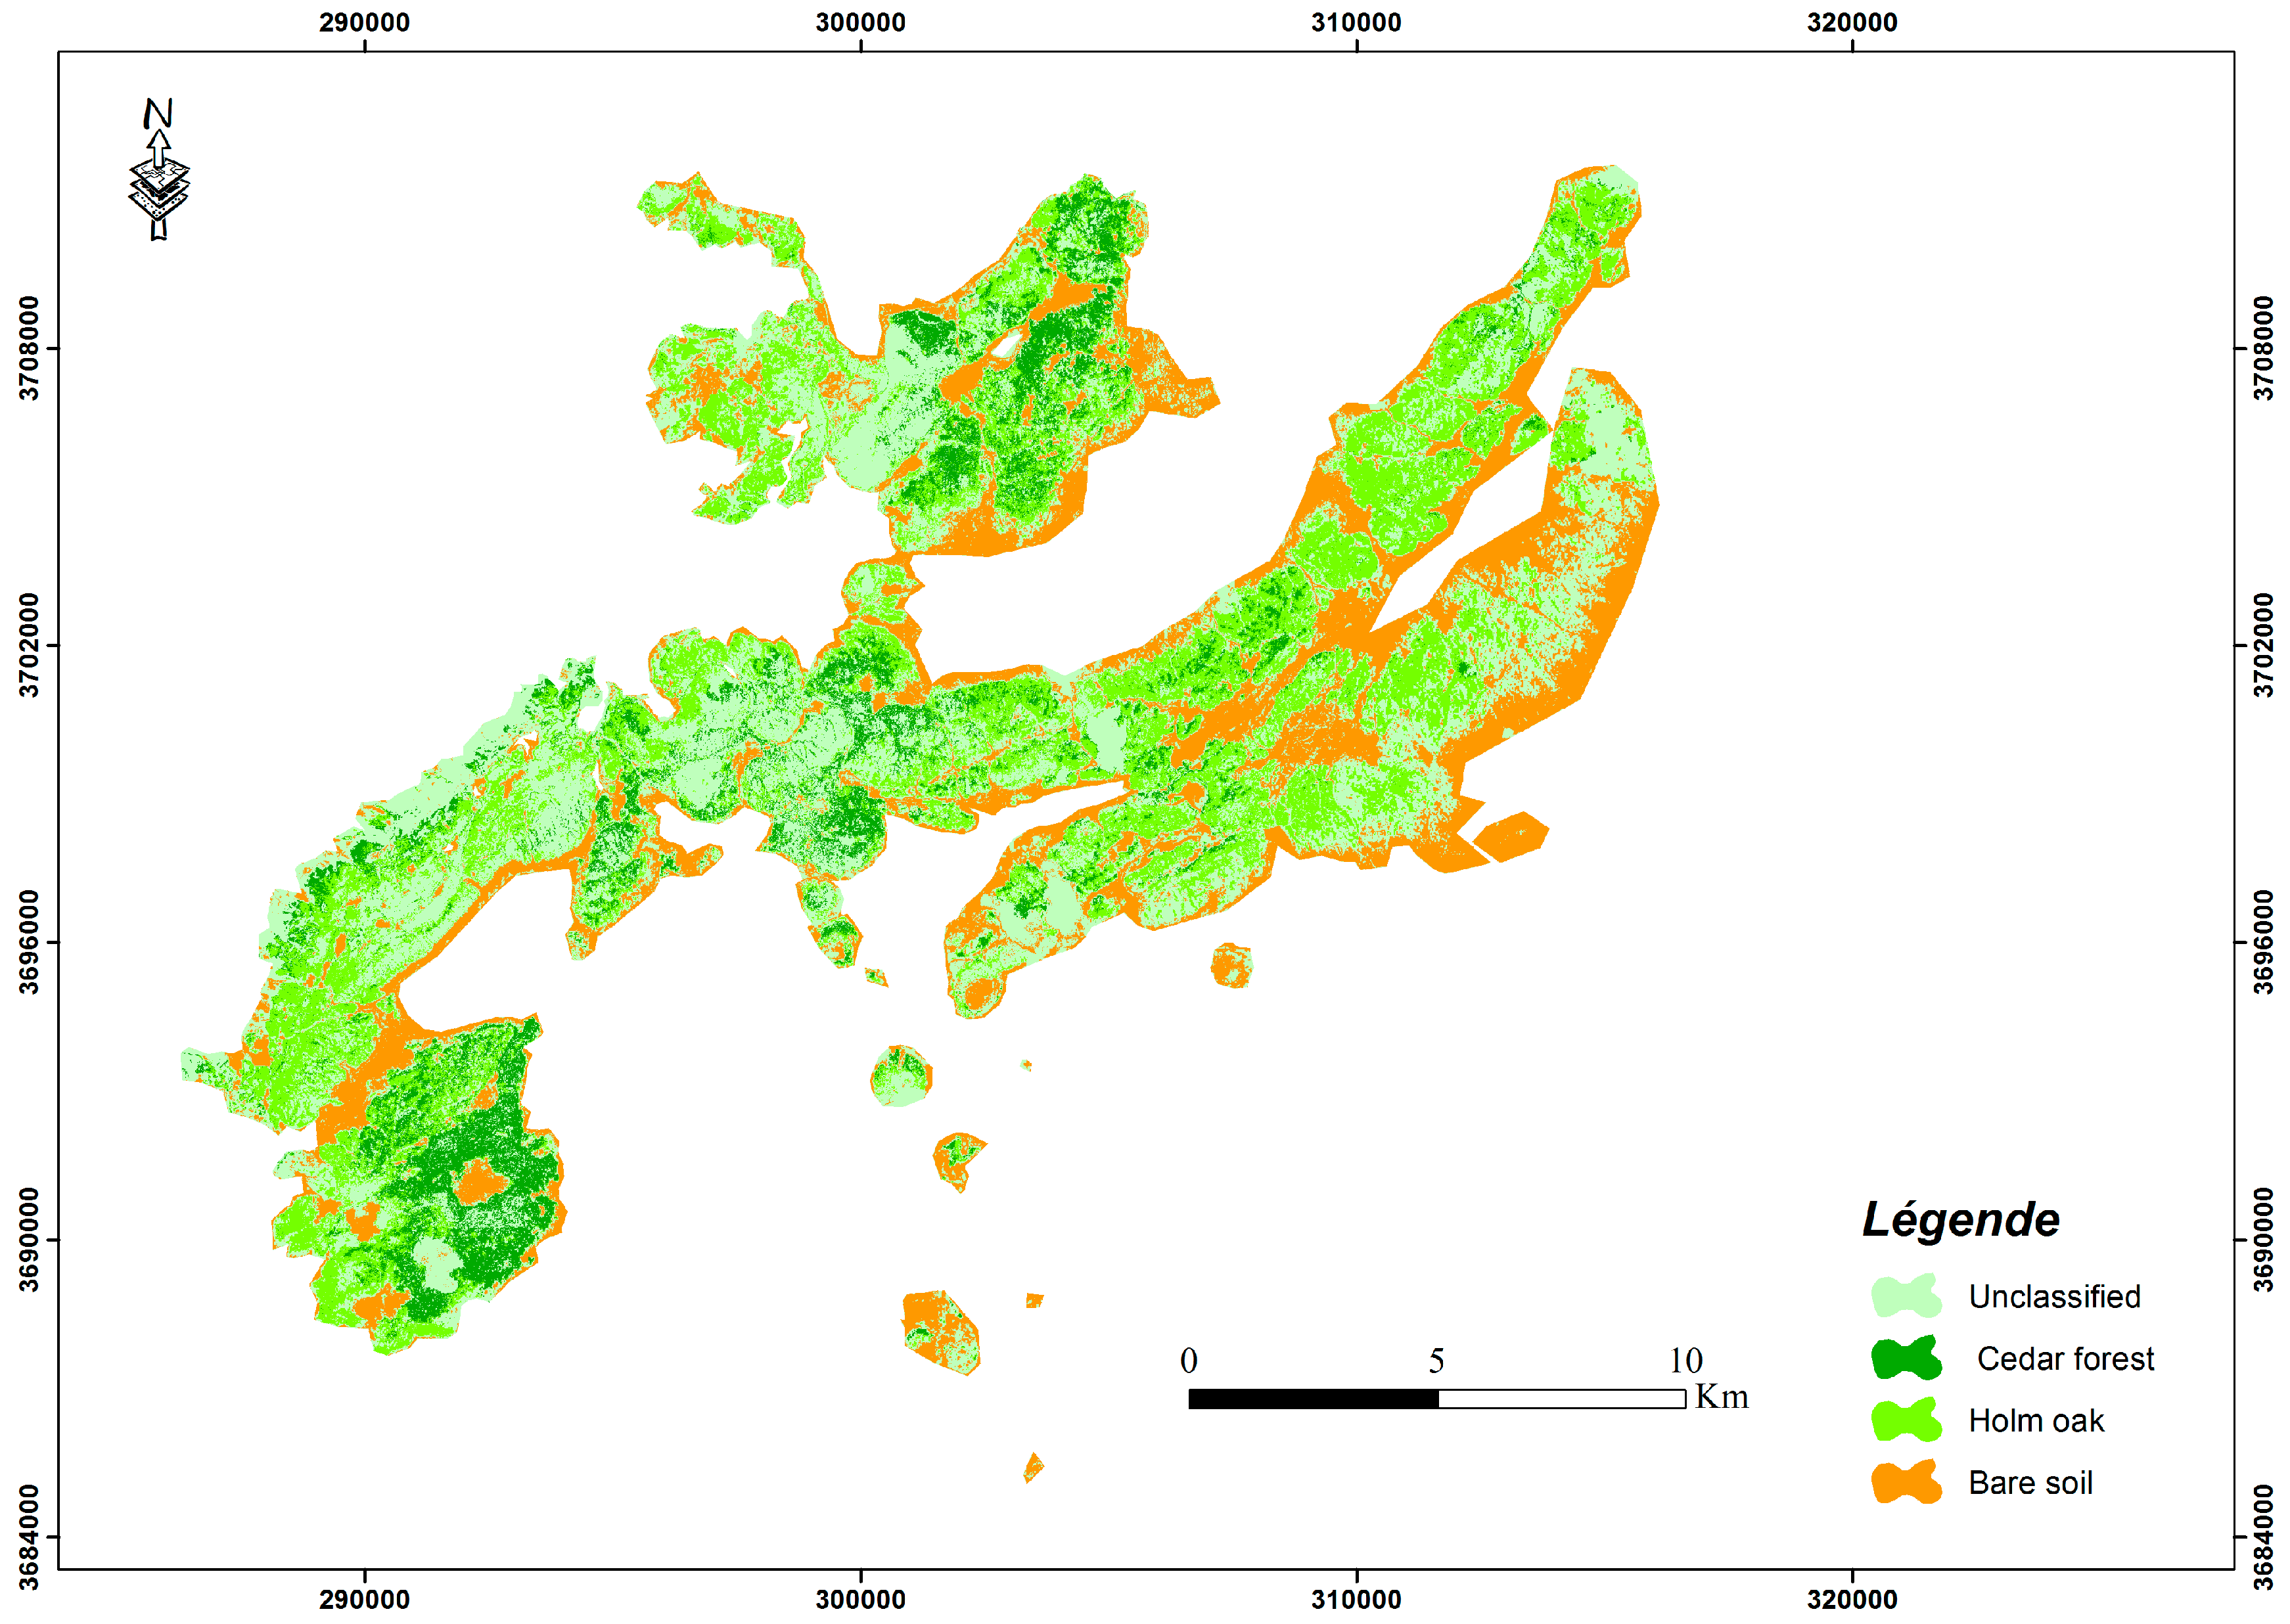
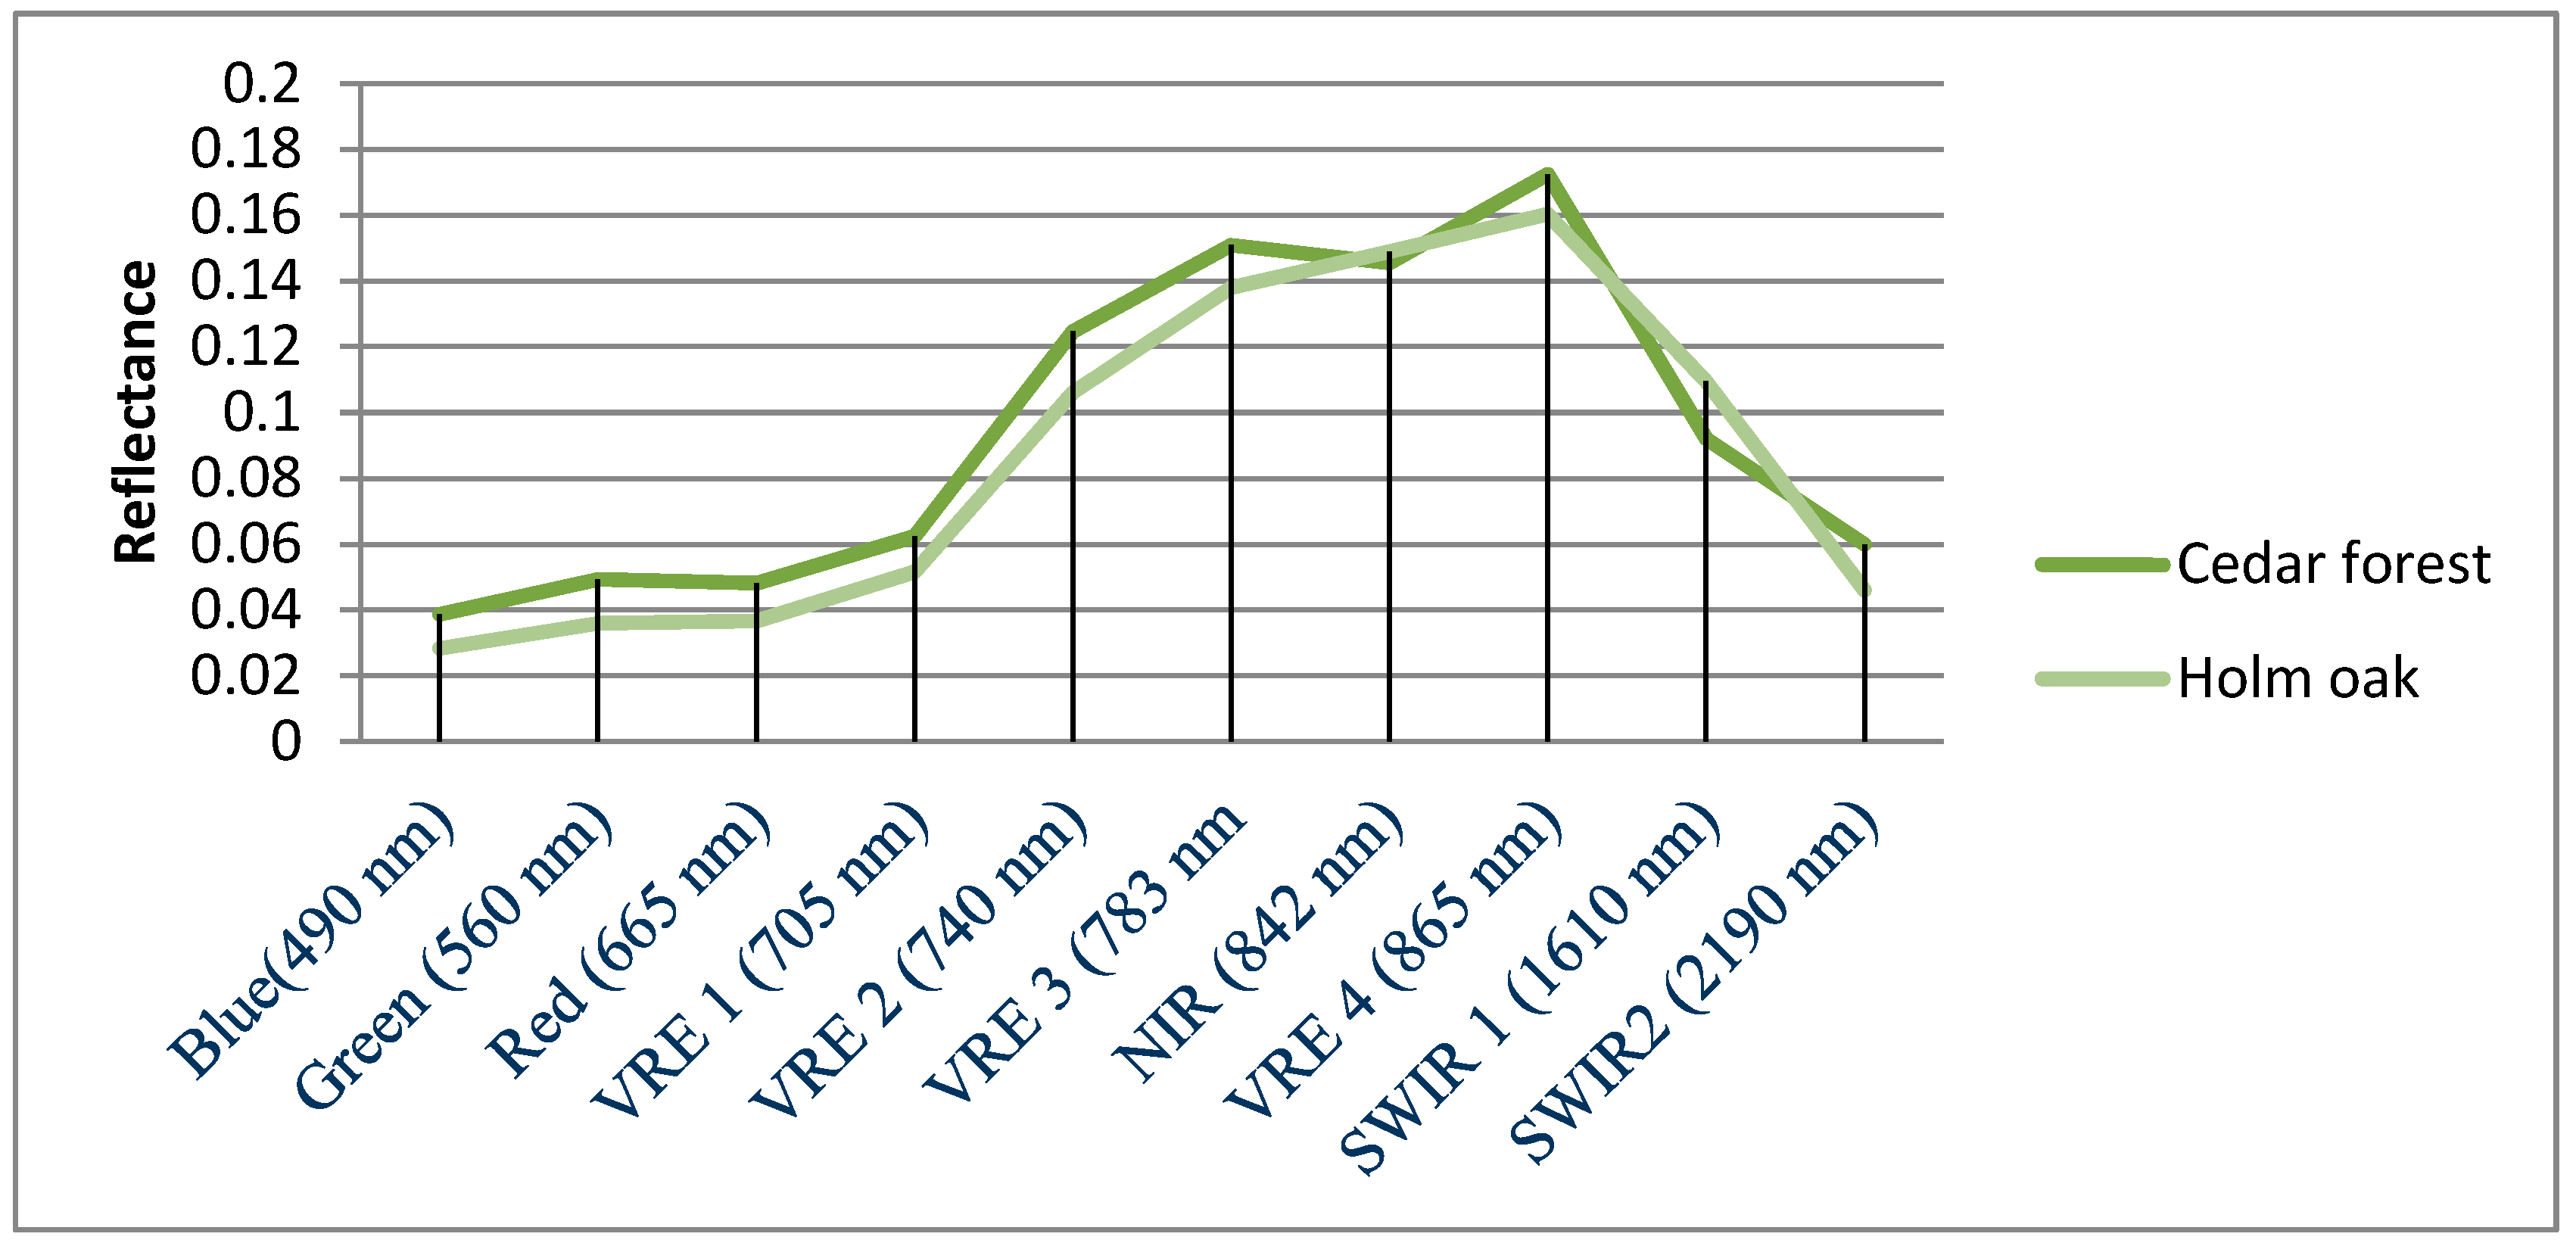
The SAM classification algorithm was used in this study. As a supervised classification technique, it is highly dependent on the identification of the training areas obtained from the observation of a field spectrometer, or are taken directly from a remote sensing image with sufficient field data, or from spectral libraries [30,38]. Developed by Kruse et al. [30], SAM determines rapidly and easily the spectral similarity between the image spectra to reference reflectance spectra (Figure 2) [38,39,40,41] and it is based on the number of bands used in the processed image [42,43,44]. Small angle values indicate greater similarity between pixel and reference spectra [45].
This method is relatively insensitive to changes in illumination in the scene [46]. Mathematically, SAM can be expressed by Equation (1)
α = c o s 1 X Y ( X ) 2 ( Y ) 2
where α is the angle formed between the reference spectrum and image spectrum; X is the image spectrum; and Y is the reference spectrum. Each pixel will be assigned to the class according to the lowest spectral angle value pixels are similar. Pixels with a measurement greater than the specified maximum divergence threshold are not classified [47].

3. Results

The SAM classification algorithm was applied to obtain a land cover classification map (Figure 3) from the high spatial resolution satellite image Sentinel-2A considered in this work. Figure 4 shows the spectral responses of the different classes selected extracted directly from the Sentinel-2A image.
In this study, 7419 pixels were considered as bare soil, 29,147 pixels as cedar forest, and 33,668 pixels as holm oak. The separability scores of the ROIs were calculated using the Jeffries–Matusita (J–M) distance between the ROIs. Therefore, all ROIs used in this study have good separability and are reasonable for use as training samples, as shown in Table 1.
The output classes considered in the classification process: holm oak, cedar forest, bare soil, and others. Of these, cedar forest makes up 11% (2747 ha) of the area; this mainly occurs in the northeast and southwest of the study area. However, holm oak makes up approximately 27% (6603 ha) of the land cover; this is represented throughout the region. Bare soil class accounts for approximately 24% of the Azrou forest and the unclassified class presents 38% of the land cover in the area.
Accuracy assessment is an important step in the classification process. The main objective is to determine how effectively pixels were grouped into the correct classes. A confusion matrix is a square array of numbers set out in rows and columns that express the number of sample units assigned to a particular category relative to the actual category as verified by ground truth information usually collected from ground visits, or aerial photographs and satellite images, or a reference dataset.
The kappa statistic gives a measure that indicates whether the confusion matrix is significantly different from a random result. Kappa analysis can also be used to compare different matrices from different classifiers and to determine whether one result is significantly better than another [48].
Classification accuracy statistics are summarized in Table 2. The overall accuracy (OA) of classification was 99.72% and the kappa statistics was 0.99.
A confusion matrix (Table 2) reveals that the forest classes were mapped with high accuracy. 8,286,532 out of 8,309,854 pixels were correctly classified. It further shows that the overall accuracy (99.72%) and individual class accuracies are encouraging. The commission and omission errors of the four classes are reported in Table 2 (in percent). The unclassified (others) class was classified with commission and omission errors of 0.07% and 0.08%, respectively. For the bare soil class, commission, and omission errors are 1.12% and 1.06%, respectively. For the holm oak class commission and omission errors are 0.93% and 0.95%, respectively, with most of the commission (2.04%) and omission (2.06%) occurring with the cedar forest class.
According to studies carried out in 2007 by the High Commission for Water and Forests and the fight against desertification [49], pure cedar stands occupy an area of 1497.41 ha, i.e., approximately 8.41% of the total forest area, and pure oak stands cover an area of 4419.77 ha, i.e., approximately 24.82% of the total area of the forest. The “other” section, which includes secondary species, represents a total area of 4392.45 ha, i.e., approximately 24.67% of the total area of the forest.
Comparing the present land cover SAM classification map to the study realized by the High Commission for Water, Forests, and for Combating Desertification in 2007, they also found the same results regarding the land cover map with similarity in the number of hectares for each class.
Our results and adopted method indicate that a SAM classification is a valuable and good method to map and classify forest regions. Moreover, our methodology represents a powerful step because the use of SAM for this focus with Sentinel-2A has not yet been fully explored and has not been tested until now in this study area.
In previous research, SAM has been successfully used [50,51,52,53]. Chikhaloui et al. [50] explains that using SAM sometimes mixed the slightly- and the moderately-degraded soils into homogeneous regions because of the spectral similarity approach of this method [54]. Additionally, this confusion can be due to the use of only one angular threshold (0.20 rad) for the different classes [50].
The results obtained by Matthew et al. [55] showed that the spectral angle mapper had poor performance (<51% OA) in comparison to linear discriminant analysis (LDA) and maximum likelihood (ML) classifiers for tropical rain forest trees. Similar results are found by Dhaval et al. [56].
Petropoulos et al. [57] found that the object-based classification outperformed the SAM by 7.91% OA for mapping land use/cover in the Mediterranean region. However, they noticed the required level of expertise and time in its implementation, as well as it being more expansive, in comparison to SAM.

4. Conclusions

The current study explored the potential of the SAM classification for mapping land cover in the Azrou forest ecosystem. The data used in this work are free and the software chosen for processing the data is open source, which allows other potential users to apply the same data and the same classification techniques to other locations. The results obtained from the application of the proposed method showed that the study area is mainly covered by four classes (holm oak, cedar forest, bare soil, and others—unclassified); they represent, respectively, 27, 11, 24, and 38% in the area of study. The OA of classification was estimated to be 99.72%. The results of this study show that the combination of Sentinel-2A data and SAM classification techniques may provide an inexpensive, easily implemented alternative to expensive, sample-based National Forest Inventories. Moreover, the results of this research, combined with other source data (e.g., field data) could be used in order to investigate the forest cover lost in the Mediterranean area.

Acknowledgments

The authors would like to thank the anonymous reviewers for their constructive comments and contribution to this study.

Author Contributions

Meriame Mohajane and Mohammed El Hafyani conducted and wrote the first draft of the manuscript under the supervision and the effective suggestions of Ali Essahlaoui, Fatiha Oudija and Ana Cláudia Teodoro. Ana Cláudia Teodoro provided important suggestions and reviews. All authors read, corrected and approved the final manuscript. Meriame Mohajane served as the corresponding author.

Conflicts of Interest

No potential conflict of interest was reported by the authors.

References

  1. Nasi, R.; Wunder, S.; Campos A., J.J. Forest Ecosystem Services: Can They Pay Our Way out of Deforestation? CIFOR for the Global Environmental Facility (GEF): Bogor, Indonesia, 2002; p. 33. [Google Scholar]
  2. White, A.; Martin, A. Who Owns the World’s Forests? Washington, DC: Forest Trends; Center for International Environmental Law: Washington, DC, USA, 2002. [Google Scholar]
  3. Pagiola, S.; Bishop, J.; Landell-Mills, N. Selling Forest Environmental Services : Market-Based Mechanisms for Conservation and Development; Earthscan Publications: London, UK, 2002; ISBN 1853838896. [Google Scholar]
  4. Gamfeldt, L.; Snäll, T.; Bagchi, R.; Jonsson, M.; Gustafsson, L.; Kjellander, P.; Ruiz-Jaen, M.C.; Fröberg, M.; Stendahl, J.; Philipson, C.D.; et al. Higher levels of multiple ecosystem services are found in forests with more tree species. Nat. Commun. 2013, 4, 1340. [Google Scholar] [CrossRef] [PubMed] [Green Version]
  5. Masek, J.G.; Hayes, D.J.; Joseph Hughes, M.; Healey, S.P.; Turner, D.P. The role of remote sensing in process-scaling studies of managed forest ecosystems. For. Ecol. Manag. 2015, 355, 109–123. [Google Scholar] [CrossRef]
  6. Uriarte, M.; Canham, C.D.; Thompson, J.; Zimmerman, J.K.; Murphy, L.; Sabat, A.M.; Fetcher, N.; Haines, B.L. Natural disturbance and human land use as determinants of tropical forest dynamics: Results from a forest simulator. Ecol. Monogr. 2009, 79, 423–443. [Google Scholar] [CrossRef]
  7. Food and Agriculture Organization of the United Nations. State of the World’s Forests 2016. Forests and Agriculture: Land-Use Challenges and Opportunities; FAO: Rome, Italy, 2016. [Google Scholar]
  8. Mace, G. Conditions and Trends Assessment of the Millennium Ecosystem Assessment. Biodiversity 2005, 1, 1209. [Google Scholar]
  9. Hansen, M.C.; Stehman, S.V.; Potapov, P.V. Quantification of global gross forest cover loss. Proc. Natl. Acad. Sci. USA 2010, 107, 8650–8655. [Google Scholar] [CrossRef] [PubMed]
  10. Hyyppä, J.; Hyyppä, H.; Inkinen, M.; Engdahl, M.; Linko, S.; Zhu, Y.-H. Accuracy comparison of various remote sensing data sources in the retrieval of forest stand attributes. For. Ecol. Manag. 2000, 128, 109–120. [Google Scholar] [CrossRef]
  11. Martinez del Castillo, E.; García-Martin, A.; Longares Aladrén, L.A.; de Luis, M. Evaluation of forest cover change using remote sensing techniques and landscape metrics in Moncayo Natural Park (Spain). Appl. Geogr. 2015, 62, 247–255. [Google Scholar] [CrossRef]
  12. Rujoiu-Mare, M.-R.; Mihai, B.-A. Mapping Land Cover Using Remote Sensing Data and GIS Techniques: A Case Study of Prahova Subcarpathians. Procedia Environ. Sci. 2016, 32, 244–255. [Google Scholar] [CrossRef]
  13. Asner, G.P.; Heidebrecht, K.B. Spectral unmixing of vegetation, soil and dry carbon cover in arid regions: Comparing multispectral and hyperspectral observations. Int. J. Remote Sens. 2002, 23, 3939–3958. [Google Scholar] [CrossRef]
  14. Buddenbaum, H.; Schlerf, M.; Hill, J. Classification of coniferous tree species and age classes using hyperspectral data and geostatistical methods. Int. J. Remote Sens. 2005, 26, 5453–5465. [Google Scholar] [CrossRef]
  15. Bonn, F.; Chillasse, L. Essai de Cartographie des Espèces Forestières Dominantes Dans le Moyen Atlas (Maroc) à L’aide des Données ASTER. Revue Télédétection, Numéro Spécial Dédié à Ferdinand Bonn 2007. Available online: http://www.abhatoo.net.ma/maalama-textuelle/developpement-economique-et-social/developpement-economique/agriculture/forets/essai-de-cartographie-des-especes-forestieres-dominantes-dans-le-moyen-atlas-maroc-a-l-aide-des-donnees-aster (accessed on 16 May 2017).
  16. Erbek, F.S.; Özkan, C.; Taberner, M. Comparison of maximum likelihood classification method with supervised artificial neural network algorithms for land use activities. Int. J. Remote Sens. 2004, 25, 1733–1748. [Google Scholar] [CrossRef]
  17. Huang, C.; Davis, L.S.; Townshend, J.R.G. An assessment of support vector machines for land cover classification. Int. J. Remote Sens. 2002, 23, 725–749. [Google Scholar] [CrossRef]
  18. Hansen, M.; Dubayah, R.; Defries, R. Classification trees: an alternative to traditional land cover classifiers. Int. J. Remote Sens. 1996, 17, 1075–1081. [Google Scholar] [CrossRef]
  19. Pal, M.; Mather, P.M. An assessment of the effectiveness of decision tree methods for land cover classification. Remote Sens. Environ. 2003, 86, 554–565. [Google Scholar] [CrossRef]
  20. Lawrence, R.; Bunn, A.; Powell, S.; Zambon, M. Classification of remotely sensed imagery using stochastic gradient boosting as a refinement of classification tree analysis. Remote Sens. Environ. 2004, 90, 331–336. [Google Scholar] [CrossRef]
  21. Franco-Lopez, H.; Ek, A.R.; Bauer, M.E. Estimation and mapping of forest stand density, volume, and cover type using the k-nearest neighbors method. Remote Sens. Environ. 2001, 77, 251–274. [Google Scholar] [CrossRef]
  22. Dalponte, M.; Bruzzone, L.; Vescovo, L.; Gianelle, D. The role of spectral resolution and classifier complexity in the analysis of hyperspectral images of forest areas. Remote Sens. Environ. 2009, 113, 2345–2355. [Google Scholar] [CrossRef]
  23. Paneque-Gálvez, J.; Mas, J.F.; Moré, G.; Cristóbal, J.; Orta-Martínez, M.; Luz, A.C.; Guèze, M.; Macía, M.J.; Reyes-García, V. Enhanced land use/cover classification of heterogeneous tropical landscapes using support vector machines and textural homogeneity. Int. J. Appl. Earth Obs. Geoinf. 2013, 23, 372–383. [Google Scholar] [CrossRef]
  24. Teodoro, A.C.; Araujo, R. Comparison of performance of object-based image analysis techniques available in open source software (Spring and Orfeo Toolbox/Monteverdi) considering very high spatial resolution data. J. Appl. Remote Sens. 2016, 10, 16011. [Google Scholar] [CrossRef]
  25. Petropoulos, G.P. A Comparison of Spectral Angle Mapper and Artificial Neural Network Classifiers Combined with Landsat TM Imagery Analysis for Obtaining Burnt Area Mapping. Sensors 2010, 10, 1967–1985. [Google Scholar] [CrossRef] [PubMed] [Green Version]
  26. Shen, G.; Sakai, K.; Hoshino, Y. High Spatial Resolution Hyperspectral Mapping for Forest Ecosystem at Tree Species Level. Inf. Res. 2010, 19, 71–78. [Google Scholar] [CrossRef]
  27. Kachmar, M.; Sanchez-Azofeifa, G.A.; Rivard, B.; Kakubari, Y. Improved forest cover classification in an industrialized mountain area in Japan. Mt. Res. Dev. 2005, 25, 349–356. [Google Scholar] [CrossRef]
  28. Da Silva, R.F.B.; Batistella, M.; Moran, E.F.; Lu, D. Land Changes Fostering Atlantic Forest Transition in Brazil: Evidence from the Paraíba Valley. Prof. Geogr. 2016, 124, 1–14. [Google Scholar] [CrossRef]
  29. Troyer, M.E.; Heo, J.; Ripley, H. Classification of High Spatial Resolution, Hyperspectral Remote Sensing Imagery of the Little Miami River Watershed in Southwest Ohio, USA; US Environmental Protection Agency: Washington, DC, USA, 2006.
  30. Kruse, F.A.; Lefkoff, A.B.; Boardman, J.W.; Heidebrecht, K.B.; Shapiro, A.T.; Barloon, P.J.; Goetz, A.F.H. The spectral image processing system (SIPS)—Interactive visualization and analysis of imaging spectrometer data. Remote Sens. Environ. 1993, 44, 145–163. [Google Scholar] [CrossRef]
  31. Cheddadi, R.; Fady, B.; François, L.; Hajar, L.; Suc, J.P.; Huang, K.; Demarteau, M.; Vendramin, G.G.; Ortu, E. Putative glacial refugia of Cedrus atlantica deduced from Quaternary pollen records and modern genetic diversity. J. Biogeogr. 2009, 36, 1361–1371. [Google Scholar] [CrossRef]
  32. Till, C.; Guiot, J. Reconstruction of precipitation in Morocco since 1100 A.D. Based on Cedrus atlantica tree-ring widths. Quat. Res. 1990, 33, 337–351. [Google Scholar] [CrossRef]
  33. Deil, U. La distribution actuelle et potentielle du cedre dans le haut Rif central. Revue Géographie du Maroc 1988, 12, 17–32. [Google Scholar]
  34. Benabid, A. Biogéographie phytosociologie et phytodynamique des cédraies de l’Atlas Cedrus atlantica (Manetti). Le cèdre de l’Atlas. Actes du séminaire international sur le cèdre de l’Atlas. Anna. Rech. For. Maroc 1994, 27, 62–76. [Google Scholar]
  35. Cheddadi, R.; Lamb, H.F.; Guiot, J.; Van Der Kaars, S. Holocene climatic change in Morocco: A quantitative reconstruction from pollen data. Clim. Dyn. 1998, 14, 883–890. [Google Scholar] [CrossRef]
  36. Congedo, L. Semi-Automatic Classification Plugin Documentation. Open Source Plugin. 2015. [Google Scholar] [CrossRef]
  37. Chavez, P.S. An improved dark-object subtraction technique for atmospheric scattering correction of multispectral data. Remote Sens. Environ. 1988, 24, 459–479. [Google Scholar] [CrossRef]
  38. Girouard, G.; Bannari, A. Validated spectral angle mapper algorithm for geological mapping: Comparative study between QuickBird and Landsat-TM. In Proceedings of the 20th ISPRS Congress, Geo-Imagery Bridging Continents, Istanbul, Turkey, 12–23 July 2004; pp. 599–604. [Google Scholar]
  39. Boardman, J.J.W. Automating Spectral Unmixing of AVIRIS data using Convex Geometry Concepts. In Proceedings of the Summaries of the 4th Annual JPL Airborne Geoscience Workshop, Washington, DC, USA, 25–29 October 1993; Volume 1, pp. 11–14. [Google Scholar]
  40. Leinonen, I.; Jones, H.G. Combining thermal and visible imagery for estimating canopy temperature and identifying plant stress. J. Exp. Bot. 2004, 55, 1423–1431. [Google Scholar] [CrossRef] [PubMed]
  41. Gürsoy, Ö.; Kaya, Ş. Detecting of Lithological Units by Using Terrestrial Spectral Data and Remote Sensing Image. J. Indian Soc. Remote Sens. 2017, 45, 259–269. [Google Scholar] [CrossRef]
  42. Rowan, L.C.; Mars, J.C.; Simpson, C.J. Lithologic mapping of the Mordor, NT, Australia ultramafic complex by using the Advanced Spaceborne Thermal Emission and Reflection Radiometer (ASTER). Remote Sens. Environ. 2005, 99, 105–126. [Google Scholar] [CrossRef]
  43. Massironi, M.; Bertoldi, L.; Calafa, P.; Visonà, D.; Bistacchi, A.; Giardino, C.; Schiavo, A. Interpretation and processing of ASTER data for geological mapping and granitoids detection in the Saghro Massif (Eastern Anti-Atlas, Morocco). Geosphere 2008, 4, 736. [Google Scholar] [CrossRef]
  44. Vicente, L.E.; de Souza Filho, C.R. Identification of mineral components in tropical soils using reflectance spectroscopy and advanced spaceborne thermal emission and reflection radiometer (ASTER) data. Remote Sens. Environ. 2011, 115, 1824–1836. [Google Scholar] [CrossRef]
  45. Dehaan, R.L.; Taylor, G.R. Field-derived spectra of salinized soils and vegetation as indicators of irrigation-induced soil salinization. Remote Sens. Environ. 2002, 80, 406–417. [Google Scholar] [CrossRef]
  46. Lillesand, T.M.; Kiefer, R.W.; Chipman, J.W. Remote Sensing and Image Interpretation; John Wiley & Sons: Hoboken, NJ, USA, 2014; p. 763. ISBN 9781118343289. [Google Scholar]
  47. Hadigheh, S.M.H.; Ranjbar, H. Lithological Mapping in the Eastern Part of the Central Iranian Volcanic Belt Using Combined ASTER and IRS data. J. Indian Soc. Remote Sens. 2013, 41, 921–931. [Google Scholar] [CrossRef]
  48. Congalton, R.G.; Green, K. Assessing the Accuracy of Remotely Sensed Data: Principles and Practices; CRC Press/Taylor & Francis: Boca Raton, FL, USA, 2009; ISBN 1420055135. [Google Scholar]
  49. TOBA Societe d'Etudes Techniques & d'Ingenierie (SOGREAH-TTOBA). Etudes d'Amenagement Concerte Des Forets et Parcours Collectifs De La Province d'Ifrane. Foret d'Azrou: Plan d'Amenagement; Royaume du Maroc—Haut-Commissariat aux Eaux et Forets, a la Lutte contre la Desertification, Direction Regionale des Eaux et Forets de Meknes: Rabat, Maroc, 2007. [Google Scholar]
  50. Chikhaoui, M.; Bonn, F.; Bokoye, A.I.; Merzouk, A. A spectral index for land degradation mapping using ASTER data: Application to a semi-arid Mediterranean catchment. Int. J. Appl. Earth Obs. Geoinf. 2005, 7, 140–153. [Google Scholar] [CrossRef]
  51. Sohn, Y.S.; Moran, E.; Gurri, F. Deforestation in north-central Yucatan (1985–1995): Mapping secondary succession of forest and agricultural land use in Sotuta using the cosine of the angle concept. Photogramm. Eng. Remote Sens. 1999, 65, 947–958. [Google Scholar]
  52. Sohn, Y.; Rebello, N.S. Supervised and unsupervised spectral angle classifiers. Photogramm. Eng. Remote Sens. 2002, 68, 1271–1280. [Google Scholar]
  53. Zhang, M.; Qin, Z.; Liu, X.; Ustin, S.L. Detection of stress in tomatoes induced by late blight disease in California, USA, using hyperspectral remote sensing. Int. J. Appl. Earth Obs. Geoinf. 2003, 4, 295–310. [Google Scholar] [CrossRef]
  54. Crósta, A.P.; Sabine, C.; Taranik, J.V. Hydrothermal alteration mapping at Bodie, California, using AVIRIS hyperspectral data. Remote Sens. Environ. 1998, 65, 309–319. [Google Scholar] [CrossRef]
  55. Clark, M.L.; Roberts, D.A.; Clark, D.B. Hyperspectral discrimination of tropical rain forest tree species at leaf to crown scales. Remote Sens. Environ. 2005, 96, 375–398. [Google Scholar] [CrossRef]
  56. Vyas, D.; Krishnayya, N.S.R.; Manjunath, K.R.; Ray, S.S.; Panigrahy, S. Evaluation of classifiers for processing Hyperion (EO-1) data of tropical vegetation. Int. J. Appl. Earth Obs. Geoinf. 2011, 13, 228–235. [Google Scholar] [CrossRef]
  57. Petropoulos, G.P.; Vadrevu, K.P.; Kalaitzidis, C. Spectral angle mapper and object-based classification combined with hyperspectral remote sensing imagery for obtaining land use/cover mapping in a Mediterranean region. Geocarto Int. 2013, 28, 114–129. [Google Scholar] [CrossRef]
Figure 1. Location of the study area (Central Middle Atlas of Morocco).
Ijgi 06 00275 g001
Figure 2. Spectral angle formed between the reference spectrum and the image spectrum (adapted from [30]).
Ijgi 06 00275 g002
Figure 3. Land cover classification maps of the study area in 2015.
Ijgi 06 00275 g003
Figure 4. Spectral signatures based on the selection of pixels selected in the present study.
Ijgi 06 00275 g004
Table 1. ROI pairs’ separability (Jeffries–Matusita distance).
ROI PairsSeparability
Holm oak/cedar forest1.71597
Holm oak/bare soil1.99647
Cedar forest/bare soil1.97217
Table 2. Error matrix for SAM classification result in the study area.
ClassGround Truth (Pixels)
UnclassifiedBare SoilHolm OakCedar ForestTotal
Unclassified6,790,5701869185012646,795,584
Bare soil2025572,87822502203579,331
Holm oak17752150654,0792194660,273
Cedar forest131421032194269,005274,666
Total6,795,684579,000660,360274,6798,309,854
ClassGround Truth (Percent)
UnclassifiedBare SoilHolm OakCedar ForestTotal
Unclassified99.92%0.32%0.28%0.46%81.78%
Bare soil0.03%98.94%0.34%0.80%6.97%
Holm oak0.03%0.37%99.05%0.80%7.95%
Cedar forest0.02%0.36%0.33%97.93%3.31%
Total100.00%100.00%100.00%100.00%100.00%
ClassGround Truth (Percent)
CommissionOmissionProducer’s AccuracyUser’s Accuracy
Unclassified0.07%0.08%99.92%99.93%
Bare soil1.12%1.06%98.94%98.89%
Holm oak0.93%0.95%99.05%99.06%
Cedar forest2.04%2.06%97.93%97.94%

