1. Introduction
Trajectory data constitutes the continuous records of moving objects (such as vehicles and pedestrians) in the spatial and temporal dimensions, serving as a fundamental digital footprint of urban systems and human activities [
1]. Trajectory representation learning aims to map the raw trajectory data into low-dimensional dense vectors through deep learning models, thus representing the semantics of the trajectories in the vector space [
2]. The learned vectors of trajectories have higher computational efficiency compared to the raw trajectory data, and can be directly used as input for urban intelligent systems, which are widely used in various applications such as smart cities, transportation systems, and personalized services [
3,
4]. Due to the high uncertainty and complexity inherent in trajectory raw data, learning high-quality trajectory representation vectors is of great research significance and highly challenging.
In recent years, researchers have proposed lots of trajectory representation methods, such as t2vec [
5], CL-Tsim [
6], TrajCL [
7], TransGTE [
8] and RSUTrajRec [
9]. These methods enhance the representation quality through different methods, achieving significant progress in the downstream tasks of trajectory representation. Additionally, multimodal data has been introduced into the trajectory representation learning process to enhance the quality of trajectory representations. For example, ST-GraphRL [
10] constructs an explicit weighted directed spatiotemporal trajectory graph and adopts a two-stage decoupled-fused encoder to jointly learn the spatial and temporal dependencies in the trajectories, thereby improving the quality of trajectory representations. PTrajM [
11] constructs a dual-channel complementary trajectory representation framework by fusing the motion dynamics modalities and the geographical semantic modalities. In practice, the spatiotemporal distribution of trajectory data is intrinsically shaped by the urban environment and human travel factors, including the road network structure, land-use patterns, and the distribution of Points of Interest (POIs) [
12]. This results in a fundamental heterogeneity—core urban areas and peak hours dominate the data, while peripheral regions and off-peak travel are underrepresented. Previous trajectory representation methods use random sampling or uniform training strategies to train models. Given the inherent spatiotemporal distribution bias in trajectory data, this paper hypothesizes that these methods may overfit frequent trajectory patterns, and thus fail to effectively support downstream tasks.
To address this issue, this paper proposes a new perspective, anchor-guided balanced learning, and an anchor-enhanced trajectory representation learning framework, AnchorTRL. Instead of passively fitting the empirical data distribution, AnchorTRL introduces anchors to proactively construct a balanced semantic space to achieve a more faithful and robust representation of urban mobility. This alleviates the negative impact of the non-uniform distribution of trajectory data and improves the quality of trajectory representation. Specifically, AnchorTRL designs a spatiotemporal anchor identification algorithm to recognize trajectory anchors that comprehensively cover the data manifold. And, it proposes a calculation method to measure all trajectories’ semantic similarity with anchors. Additionally, it develops an anchor-based balanced sampling strategy to mitigate the dominance of frequent patterns and steer the model towards learning a more balanced representation. Finally, it constructs a multi-task contrastive learning objective with adaptive constraints to enhance the aggregation of semantically similar trajectories. To the best of our knowledge, this paper is the first to actively adapt to the spatiotemporal distribution deviation with anchor to improve trajectory representation learning. In summary, the main contributions of this paper are as follows.
- (1)
A Novel Learning Perspective. This paper proposes the concept of anchor-guided balanced learning, a principled approach to mitigate the systematic performance decline on spatiotemporally unpopular trajectories caused by empirical distribution skew. This perspective shifts the paradigm from passively fitting the biased data distribution to proactively constructing a balanced semantic space that more faithfully represents the full diversity of urban mobility.
- (2)
A framework addressing urban data bias in trajectory learning. This paper instantiates this perspective into the AnchorTRL framework, which integrates several novel components: a spatiotemporal anchor identification algorithm for comprehensive data manifold coverage, a hybrid similarity measurement for robust semantic alignment, and an anchor-based balanced sampling strategy to counteract pattern dominance.
- (3)
Extensive Validation. Through rigorous experiments on two real-world city datasets, this paper demonstrates that AnchorTRL significantly advances the state-of-the-art in tasks like travel time estimation and similar trajectory query.
The rest of this paper is organized as follows.
Section 2 presents a literature review of trajectory representation learning and anchor-enhanced representation learning.
Section 3 defines the key concepts of TRL in this paper.
Section 4 shows the methodology framework of the proposed approach.
Section 5 shows the experiment details and overall results.
Section 6 takes some discussions, demonstrating the effectiveness of AnchorTRL. Finally, the conclusion and future works are represented in
Section 7.
2. Related Work
The related work to this paper can be classified into two categories: trajectory representation learning and anchor-enhanced representation learning.
2.1. Trajectory Representation Learning
Early researchers adapt generic graph embedding techniques [
13,
14,
15] to encode road segments and represent trajectories as the average of segment embeddings. Building upon these, early trajectory representation learning methods, such as t2vec [
5], Traj2vec [
16], CL-Tsim [
6] and Trembr [
17] mainly adopted self-supervised learning approaches, learning the representation of trajectories by generating similar trajectory pairs. While this paradigm demonstrates effectiveness in capturing local spatiotemporal dependencies, its reliance on reconstructing local segments often limits the model’s capacity to learn holistic trajectory semantics, particularly for understanding high-level travel behaviors and intentions. To solve this problem, some researchers began to explore contrastive learning methods, such as TrajRCL [
18] and PIM [
19], by constructing positive and negative sample pairs to learn discriminative trajectory representations. START [
20] further incorporates temporal regularities and travel semantics as self-supervised signals. Toast [
21] combines Skip-gram pre-training with masked language modeling to learn road segment embeddings from trajectory co-occurrence patterns. However, this shift in methodology introduces a new critical challenge: the performance of contrastive learning heavily depends on the quality and semantic rationality of the sample pair construction.
To provide a richer semantic foundation for constructing high-quality positive and negative sample pairs, some researchers have also begun to explore the combination of multimodal data to enhance geographical spatial semantic modeling [
22] and improve the quality of trajectory representations. For instance, TriSR [
23] integrates trajectory data with image data, leveraging the semantic information in the image data to enhance the representation of the trajectory. JGRM [
24] jointly models GPS and route views through a dual-view encoder to learn unified trajectory representations. Furthermore, the GREEN framework explores the complementarity of grid and road trajectory expressions, designing dual encoders and cross-modal interactions to fuse these two representations for learning richer trajectory semantics [
25]. These multimodal fusion approaches can effectively improve the quality of trajectory representations. However, while incorporating additional modalities addresses certain aspects of semantic sparsity, it does not fundamentally resolve the core issue of spatiotemporal distribution bias in trajectory data. The fusion process itself may even amplify these biases if the auxiliary data (e.g., street-view images) is unevenly distributed, thereby limiting the model’s ability to learn balanced and robust trajectory representations.
Additionally, some researchers have also begun to explore the use of graph structures to enhance the quality of trajectory representations. For instance, TrajGAT [
26] models trajectory data as a graph and utilizes graph neural networks to learn the representations of trajectories. JCRLNT [
27] jointly learns road network and trajectory representations via multi-task contrastive learning. Path-LLM [
28] incorporates large language models to learn path representations by fusing topological and textual multi-modal data. GeoAvatar [
29] generates personalized human mobility trajectories by constructing individual heterogeneous life-pattern graphs that incorporate demographic characteristics and spatiotemporal constraints. These methods of graph structure modeling can effectively capture the spatiotemporal dependencies of trajectories.
Although the trajectory representation learning methods have made great progress in improving the quality of trajectory representations, they assume that the trajectory data is uniformly distributed in the spatial and temporal dimensions. Since they ignore the uneven distribution of inherent spatiotemporal patterns in real scenarios, their trajectory representation tends to be biased and perform poorly in downstream tasks.
2.2. Anchor-Enhanced Representation Learning
The anchor-based mechanism, as a form of structured prior knowledge, has been widely applied to address various data imbalance challenges. Existing studies demonstrate that by introducing representative anchor samples, the model’s generalization capability across diverse data distributions can be significantly enhanced.
In the field of object detection, Ren et al. [
30] proposed Faster R-CNN, which provides reference scales for imbalanced target distribution by presetting anchor boxes, effectively addressing the positioning challenge of small targets. Subsequent works such as FCOS [
31] further refined this concept by adopting anchor points instead of anchor boxes, enabling multi-scale predictions across regions with varying feature density through the feature pyramid network. For image segmentation tasks, Kirillov et al. [
32] introduced anchor-guided ROIAlign operation in Mask R-CNN, effectively alleviating the problem of insufficient feature extraction in edge regions. These methods collectively demonstrate that anchors can serve as structural “signposts” for spatial organization, enhancing the model’s capacity to perceive and represent spatially imbalanced patterns.
In the task of text representation learning, Gao et al. [
33] proposed to construct the semantic skeleton of documents through keyword anchors, significantly improving the performance of short text classification. Chen et al. [
34] further introduced the anchor mechanism into the cross-language representation alignment task, selecting bilingual co-occurring words as semantic anchors to achieve more robust cross-language semantic mapping in low-resource language environments. Additionally, Wang et al. [
35] utilized sentiment-polarized keywords as anchors to guide the model to better capture semantic deviations and context associations in fine-grained sentiment analysis. Beyond textual data, the anchor mechanism also proves effective in structuring complex multi-view data, as seen in the EAGL method [
36] for incomplete multi-view clustering, which leverages anchors to recover missing views and construct consensus representations.
Overall, anchors serve as pivotal references across various data types, demonstrating significant effectiveness in improving representation learning for imbalanced data distributions. However, the unique characteristics of spatiotemporal data—particularly the complex temporal dependencies, spatial heterogeneity, and uneven semantic distribution inherent in trajectory data—present distinctive challenges that prevent direct application of existing anchor-based methods to raw trajectory representation learning.
3. Definition
Road network: Given a directed road network graph , where represents the set of road segment (including spatial coordinate attributes ), and represents the road connection relationship, the edge weight encodes the traffic constraints (such as one-way street restrictions).
Trajectory: In this paper, two complementary forms of trajectory data are used. Specifically, a route trajectory is a sequence of road segments at the timestamp , where , and it satisfies the road network connectivity . For a trajectory , its road set is defined as the set of road segments in its route view: . A GPS trajectory is a sequence of raw GPS points, where denotes the longitude–latitude coordinates at timestamp , without explicit assignment to road network elements.
The trajectory representation learning task: By inputting the road network , trajectory set , output the low-dimensional representation .
To quantitatively describe the spatiotemporal distribution deviation of trajectory data, we further define the popular and unpopular attributes of trajectories from both spatial and temporal dimensions.
Spatial dimension. The frequency of a road segment is defined as the total number of times all trajectories in the training set pass through that road segment. Road segments are divided into popular and unpopular ones based on the median of the frequency of all road segments. For any trajectory , let the set of road segments it passes through be , and the number of popular road segments be . If , then is called a spatially popular trajectory; otherwise, it is called a spatially unpopular trajectory.
Time dimension. Divide a day into equal-length time periods, and define the popularity of a time period as the total number of occurrences of all GPS points in the training set within that period. Using the median of the popularity of all time periods as the boundary, the time periods are divided into popular and unpopular time periods. Let the starting time period of trajectory be . If belongs to a popular time period, then is called a temporally popular trajectory; otherwise, it is called a temporally unpopular trajectory.
4. Method
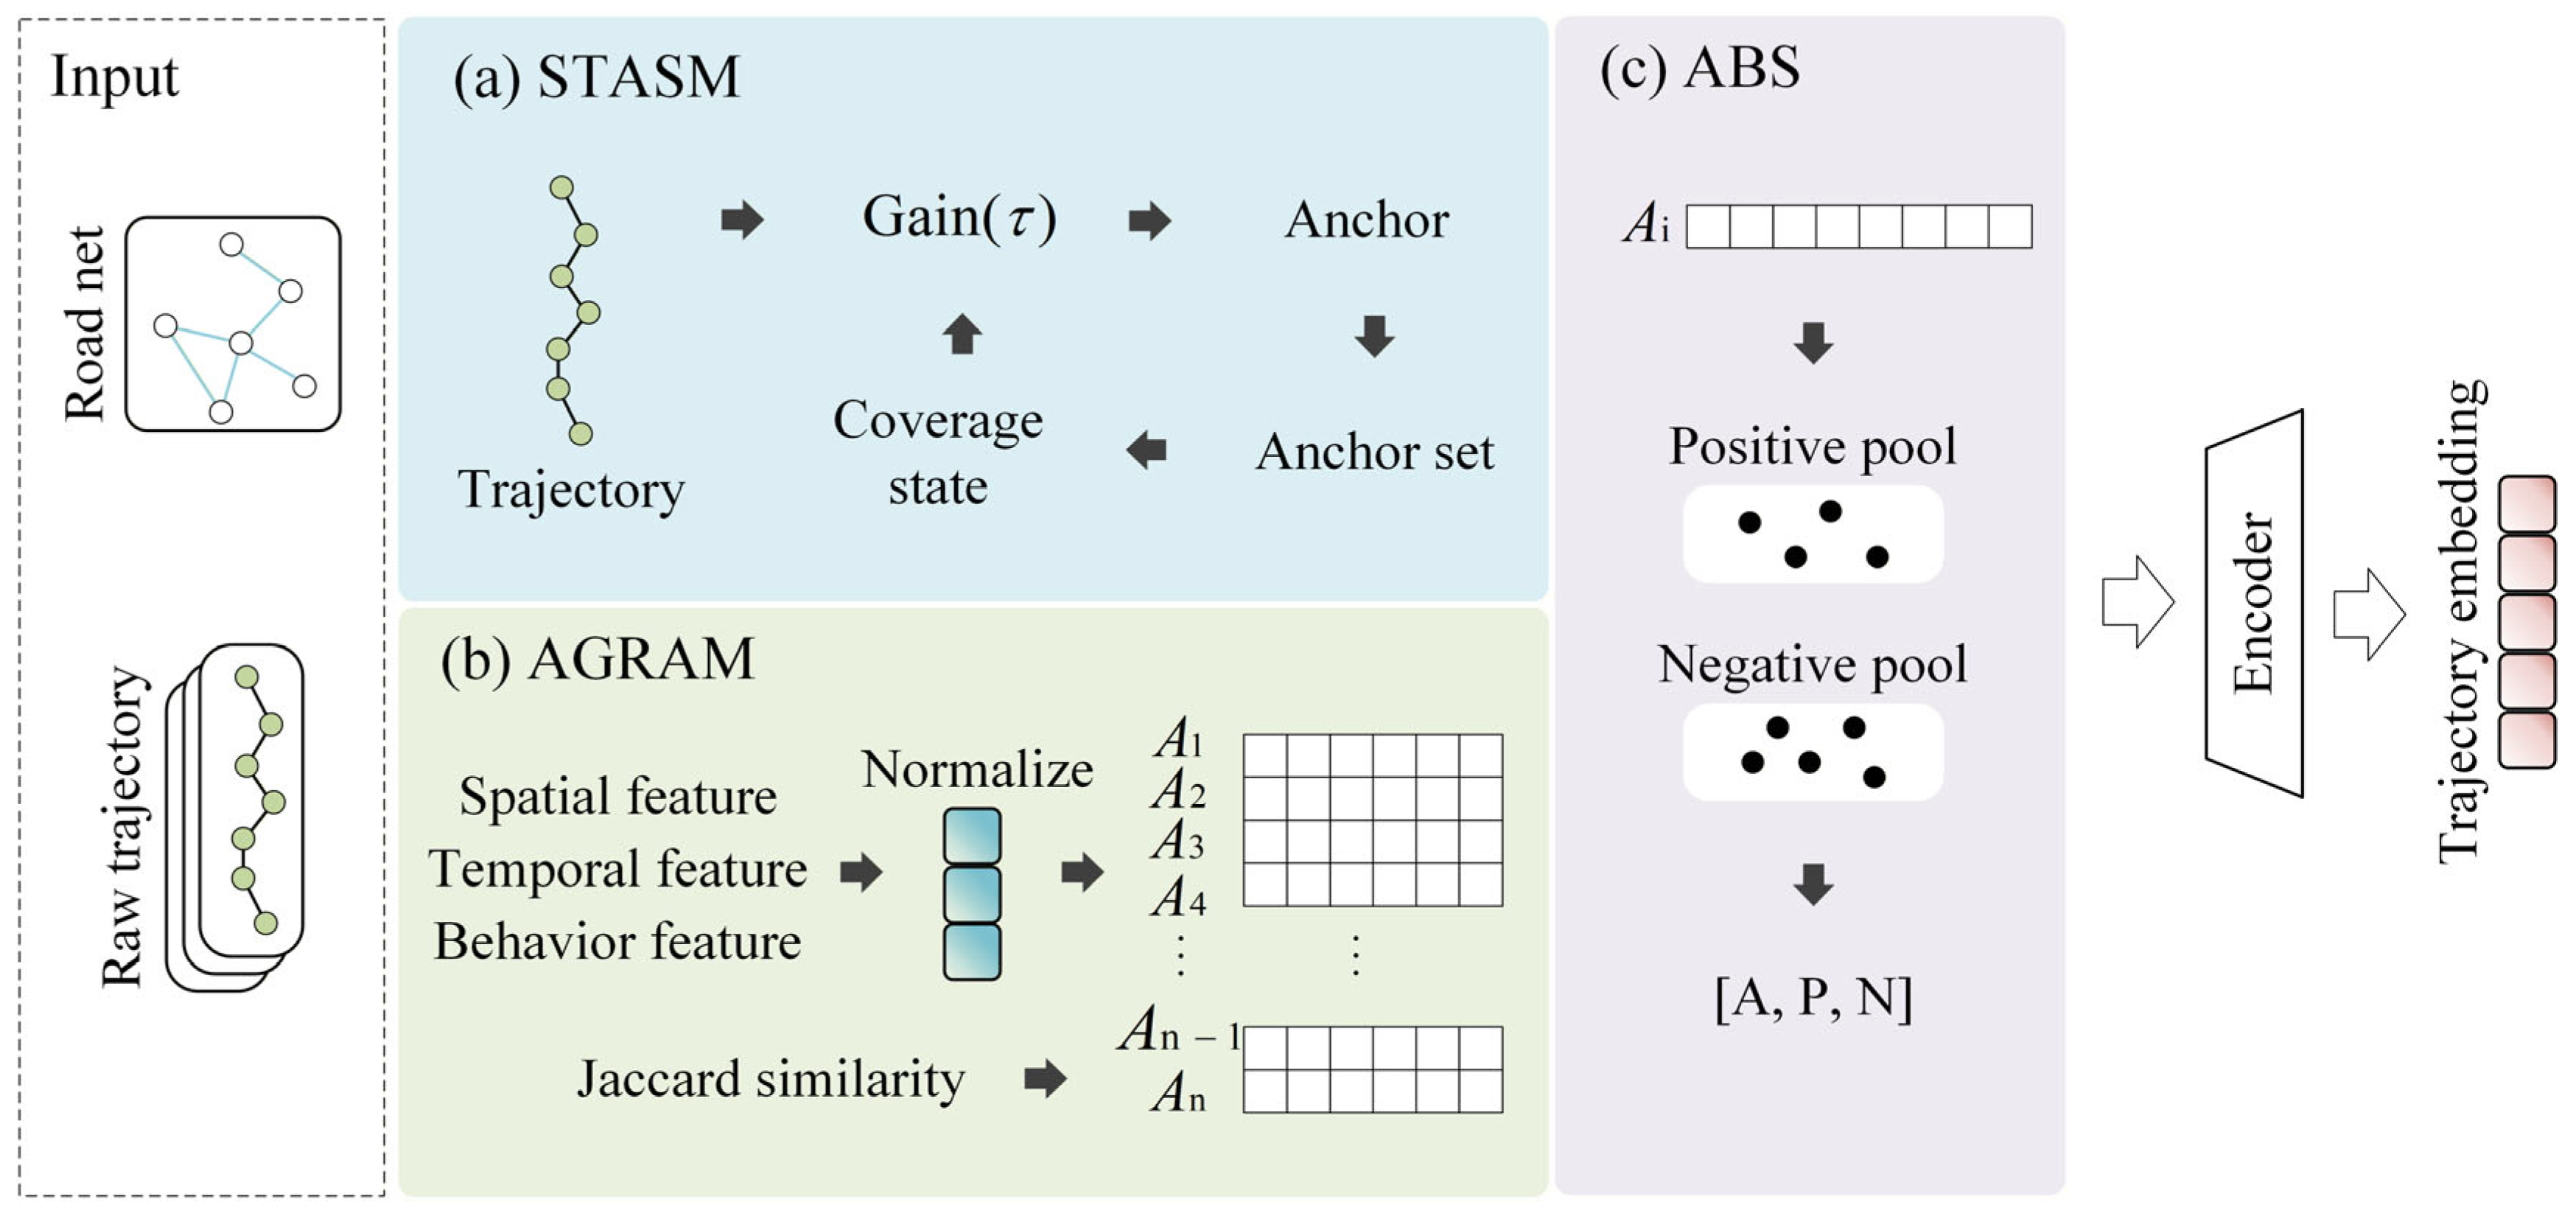
The trajectory representation learning framework proposed in this paper is based on spatiotemporal anchors, which seek to enhance performance through multidimensional feature fusion and a dynamic sampling mechanism. As shown in
Figure 1, the framework consists of three modules, including a spatiotemporal anchor selection module, an anchor-guided representation alignment module, and a contrastive learning optimization module. Specifically, the spatiotemporal anchor selection module (STASM) selects the anchor trajectories of different patterns with spatiotemporal features. The anchor-guided representation alignment module(AGRAM) extracts features based on three types of features: behavior, space, and time, and combines feature similarity measurement and greedy strategy to select key and comprehensive trajectories as anchors, achieving perception of trajectory distribution. Anchor-based balanced sampling(ABS) designs static and dynamic sampling strategies, generates positive and negative samples based on the similarity of anchor trajectories, and introduces a usage frequency adjustment mechanism to alleviate the problem of data imbalance. Finally, this paper uses the dual-view encoder of the JGRM [
24] model to encode the trajectory data and obtain the trajectory representation vectors. In the training process, contrastive learning optimization is introduced with an improved triplet loss function to strengthen the aggregation of positive samples, thereby obtaining more discriminative trajectory embedding representations.
4.1. Spatiotemporal Anchor Selection Module (STASM)
This module aims to select key anchor trajectories from large-scale trajectory data, which are used to construct a stable reference system to alleviate the impact of uneven data distribution. Specifically, this method takes into account the diversity in spatial coverage and time distribution of the trajectories. Through a greedy gain optimization strategy, it gradually selects key samples from the trajectory set. The selected anchor set not only covers more road segments and time intervals, but also maintains various semantic features, thereby providing a basis for constructing high-quality positive and negative samples for the subsequent process.
This module defines a gain function to measure the contribution of the candidate trajectory as an anchor. The gain function consists of two parts: one is the spatial gain, which is used to measure the number of newly covered road segments by the trajectory. The other is the temporal gain, which adjusts the contribution of the trajectory in the uncovered time period through a weighting factor. The formal definition is as follows:
where
represents the set of road segments in the trajectory,
and
are the current sets of covered road segments and time periods respectively, and
is the adjustment factor for the time dimension, set to the average trajectory length (in terms of number of road segments) of the corresponding dataset.
Additionally, STASM employs a greedy iterative strategy to gradually expand the anchor set. In each iteration, the trajectory with the highest gain function value is selected from those that have not been selected and added to the anchor set, while the covered space and time sets are updated. When the space coverage reaches the set threshold or when no trajectory can provide additional gain, the iteration process terminates. This process is shown in Algorithm 1, improving the balance of the anchor set in both the spatial and temporal dimensions.
| Algorithm 1 Spatiotemporal anchor selection |
Input: trajectory set T, minimum coverage rate θ, time weight α
Output: anchor set A
1: A = ∅, = ∅, = ∅
2: while ||/|| < θ do
3: = arg maxt∈T\A
4: if > 0 then
5: A = A ∪ {}
6: = ∪
7: = ∪
8: else break
9: return A |
To address the bias introduced by the uneven distribution of the original data, this module selects representative anchor trajectories based on spatial, temporal, and behavioral characteristics. These anchors serve as references to construct a stable and diverse reference system for trajectory representation learning. By ensuring sufficient coverage and diversity, the anchor set enables the generation of reliable positive and negative samples and facilitates the model in learning multi-dimensional semantic information during the contrastive learning process.
The greedy selection strategy employed to construct this anchor set is not merely a heuristic convenience; it is theoretically grounded in the properties of the gain function defined in Equation (1). Specifically, the gain function is monotone submodular—the spatial coverage term exhibits diminishing returns as the covered set expands, while the temporal term is a modular (additive) function, and their sum preserves submodularity. A classical result in combinatorial optimization [
37] guarantees that for monotone submodular maximization under a cardinality constraint, a greedy algorithm achieves a (1 − 1/e)-approximation to the optimal solution. This theoretical foundation has been widely adopted in modern machine learning applications, including sensor placement and data summarization [
38]. While our algorithm terminates upon reaching a coverage threshold
θ rather than a fixed cardinality, the greedy approach still provides a principled and provably near-optimal strategy for incrementally constructing a balanced anchor set that comprehensively spans the spatiotemporal support of the trajectory data.
4.2. Anchor-Guided Representation Alignment Mechanism (AGRAM)
To better model the semantic relationships between trajectories in representation learning, this paper proposes a measure method based on multi-dimensional features. This method depicts the comprehensive characteristics of trajectories in terms of behavior, space, time, and scale. Specifically, for each trajectory , behavioral statistics such as velocity, acceleration, and angle changes are extracted as behavioral features, the starting and ending point’s longitude and latitude are used as spatial features, the sine and cosine encoding of the departure time are used as time features, and the total length and total duration of the trajectory are combined as scale features. Through these features, the trajectories are mapped to a multimodal representation space, thereby calculating the semantic distance between trajectories.
In order to achieve the guiding and anchoring effect of the anchor trajectory on other trajectories, AGRAM calculates the similarity between each anchor and other trajectories. The calculation of semantic feature similarity can measure the relationship between the overall features of trajectories. However, it lacks the ability to capture the crucial sequence information and spatial topological information of trajectories. To preserve the structural relationships between trajectory sequences and comprehensively measure the differences between trajectories, this paper proposes a hybrid similarity measurement method. Specifically, this method combines the cosine similarity based on feature vectors with the Jaccard similarity based on path sets:
where
and
represent non-anchor and anchor trajectory, respectively. And
represent the multi-dimensional feature vectors of the trajectories, and
represent the road sets of trajectories. The cosine similarity is used to measure the similarity of two trajectories at the behavioral feature level. By calculating the cosine similarity of these feature vectors, it is possible to determine whether two trajectories are similar in terms of driving style, movement patterns, etc. For example, two trajectories with sharp acceleration and frequent lane changes will be more similar in the behavioral feature space. The Jaccard similarity, on the other hand, focuses on measuring the overlap degree of the two trajectories in the spatial path, defined as the ratio of the intersection size of the two trajectories passing through the road section set to the union size. This measurement can effectively capture the similarity of trajectories in the topological structure of the road network, avoiding the neglect of overall path consistency due to local behavioral fluctuations. For example, even if the speed distribution of two trajectories is slightly different, if most road sections overlap, they will still be considered to have a high spatial similarity. AGRAM integrates both, considering both dynamic behavioral features and static path structures, avoiding the deviation that a single measurement may bring. Such a design captures the overall semantic similarity of trajectories while retaining their structural differences in the spatial path, thereby achieving multi-level semantic alignment, and helps to more comprehensively and accurately evaluate the true semantic similarity between trajectories. What is more, the multiplicative form in Equation (2) imposes a strict joint condition, requiring high similarity in both behavioral and structural dimensions simultaneously [
39]. This design enables more accurate reflection of the complex semantic relationships of trajectories in the real world, and facilitates better discrimination among massive trajectory data.
4.3. Anchor-Based Balanced Sampling (ABS)
To alleviate the uneven distribution of trajectory data, this module proposes a dynamic batch construction mechanism based on anchor guidance, as shown in Algorithm 2. This mechanism utilizes the pre-computed trajectory similarity matrix to achieve structure-aware sample organization. Specifically, a global similarity matrix is first computed between trajectories and anchor trajectories to establish a similarity ranking list for anchors. For each anchor, the top-K most similar trajectories are retained to construct a positive sample candidate pool, while negative samples are drawn from trajectories with lower similarity scores or those below a predefined threshold .
During training, this mechanism dynamically selects anchor trajectories and constructs batches according to the following strategy. Anchor trajectories are first chosen from the predefined anchor set. Positive samples are then prioritized from their corresponding positive candidate pools, while sampling is balanced by considering the usage frequency of each trajectory. Negative samples are drawn from trajectories with low similarity scores to ensure sufficient distinction from the anchors. Through this combination of static ranking and dynamic sampling, each training batch consists of anchor trajectories, positive samples, and negative samples, formally defined as
, where
denotes the anchor trajectories,
represents the positive sample set drawn from similar trajectories, and
denotes the negative sample set containing trajectories significantly different from the anchors.
| Algorithm 2 Dynamic batch construction |
Input: trajectory set T, anchor set similarity matrix threshold , batch size
Output: training batch 𝓑
1: 𝓑 = ∅
2: for each epoch do
3: select anchor trajectory ∈ A
4: Pos = {|S(, ) > τ and has a low usage frequency}
5: Neg = {|S(, ) < τ}
6: if |Neg| < then
7: Neg = Neg ∪ Random sampling of global trajectories
8: end if
9: 𝓑 = {, Pos, Neg}
10: return 𝓑 |
This organizational approach provides a clear optimization objective for contrastive learning. By dynamically reorganizing batches across different training rounds, this strategy enhances the diversity and balance of samples while maintaining the semantic relevance of positive and negative samples. This contributes to enhancing training stability and improving the discriminative power of the learned representations, thereby effectively mitigating modeling biases caused by the uneven spatiotemporal distribution of trajectory data.
The threshold-based splitting may occasionally misclassify trajectories sharing similar high-level travel intentions as negatives. As a comprehensive approach, the hybrid similarity measure combines both behavioral and structural information, reducing the likelihood of such cases. Additionally, contrastive learning helps to tolerate a moderate fraction of false negatives [
40].
4.4. Contrastive Learning Optimization
A contrastive learning mechanism is introduced into the optimization objective to enhance the consistency and discriminability of the model’s representations across different trajectory perspectives. For the reconstruction of trajectory sequences, this paper designed mask language modeling (
) losses for both path trajectories and GPS trajectories. By randomly masking some elements in the trajectory sequence and using the model to make predictions, it is possible to effectively enhance the model’s context modeling ability, thereby improving its understanding of trajectory semantics.
The overall optimization function after the introduction of contrastive learning consists of multi-task joint components, including masked language modeling losses for path trajectories and GPS trajectories, trajectory matching losses, and dual contrastive learning losses. On this basis, a dynamic weight strategy is adopted to balance each part, resulting in the final overall loss function.
Secondly, this paper introduces a trajectory matching loss to explicitly align the representations of the GPS and path trajectory perspectives. This part uses the contrastive target based on InfoNCE, enabling the model to learn consistency and discriminability in the cross-modal representation space, thereby ensuring that the two trajectory representations remain aligned at the semantic level.
Based on this, this paper further designed a dual contrast learning objective, which was applied to both GPS trajectories and path trajectories. Specifically, for each anchor trajectory representation, the model needs to distinguish positive and negative samples in the similarity space, maximize the consistency between the anchor and the positive sample, and minimize its similarity to the negative sample. This not only enhances the discriminative ability under the same trajectory perspective, but also strengthens the model’s ability to model complex trajectory relationships at the structural perception level.
Furthermore, to prevent the contrastive learning from overly dominating the optimization process in the early stages of training, this paper employs a linear decay strategy to dynamically adjust the weights of contrastive learning. As the training progresses, the relative weight of the contrastive learning loss gradually decreases, enabling the model to focus more on the reconstruction and cross-modal alignment tasks in the later stages.
Finally, before calculating the contrastive learning loss, all trajectory embedding representations are normalized by L2 to improve the stability of similarity calculation and the consistency of the numerical scale.
5. Experiment
5.1. Dataset
To verify the effectiveness and generalization ability of the AnchorTRL model, this paper selected two publicly available real urban trajectory datasets, Chengdu and Xi’an, as the experimental datasets. As shown in
Table 1, both of these datasets are derived from real ride-hailing operation records, and cover rich urban road network structures and diverse vehicle movement behaviors.
The trajectory data have all undergone preprocessing, including map matching, outlier removal, time alignment, etc., so as to achieve that each trajectory consists of a continuous sequence of road segments and is accompanied by accurate timestamp information. In addition, the dataset also contains rich contextual information, such as the departure time, travel duration, and passing road sections of each trajectory, providing a foundation for multi-dimensional feature extraction and semantic modeling.
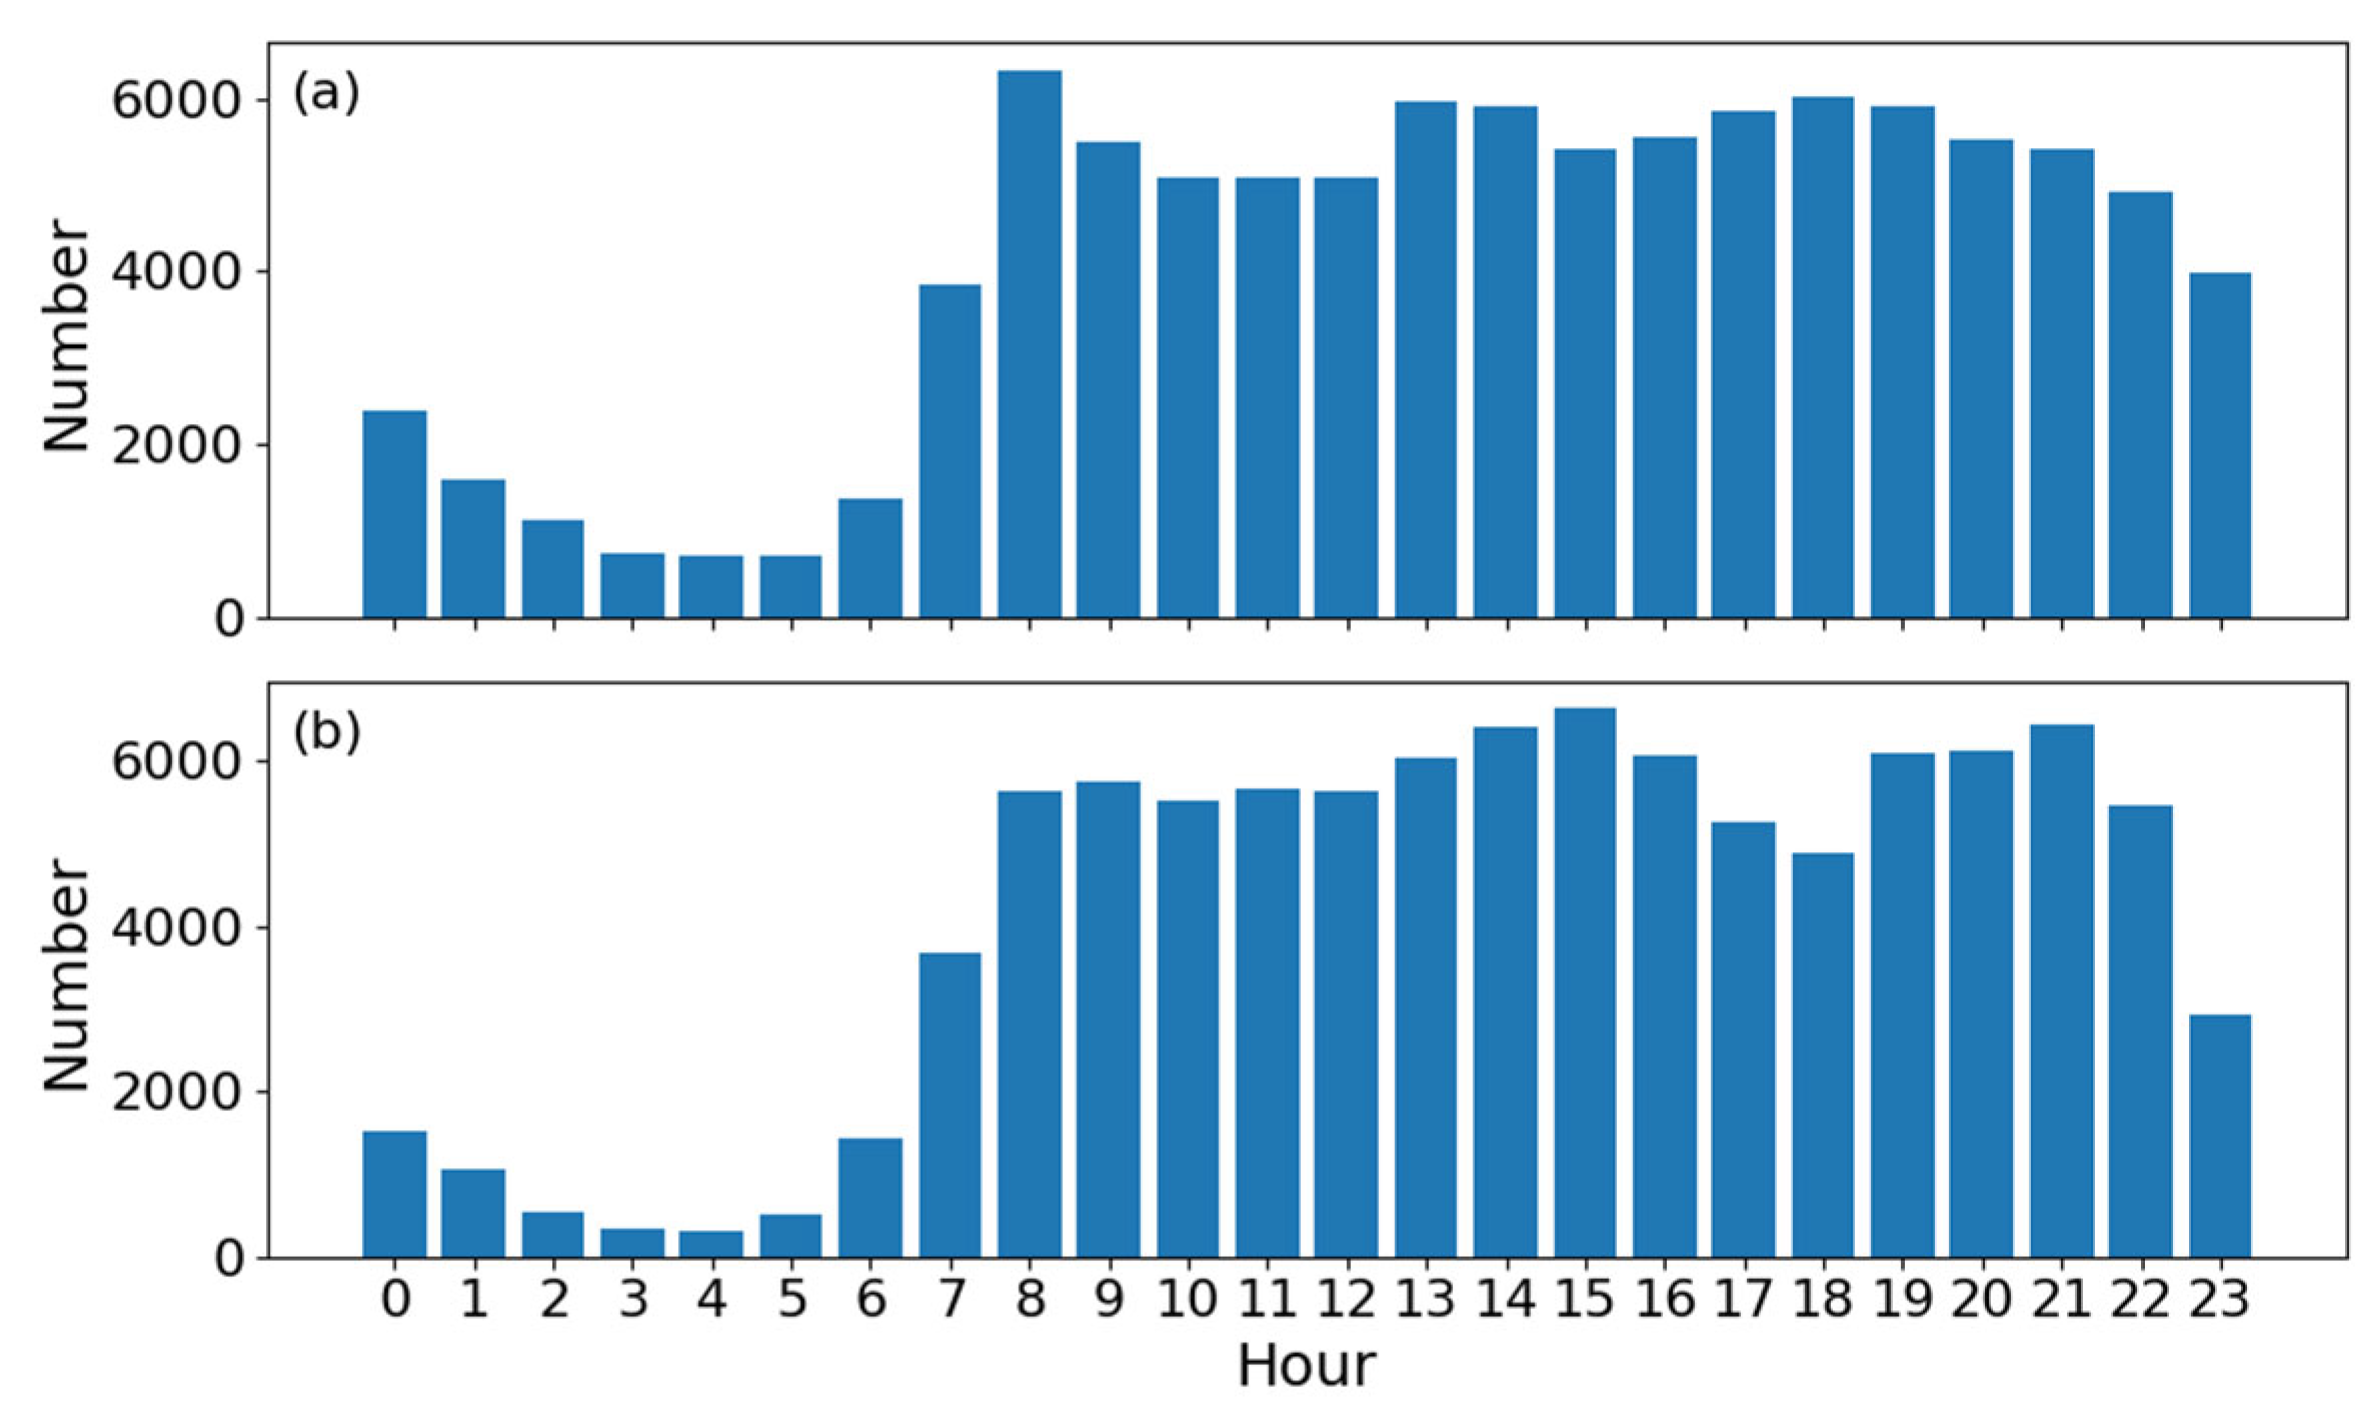
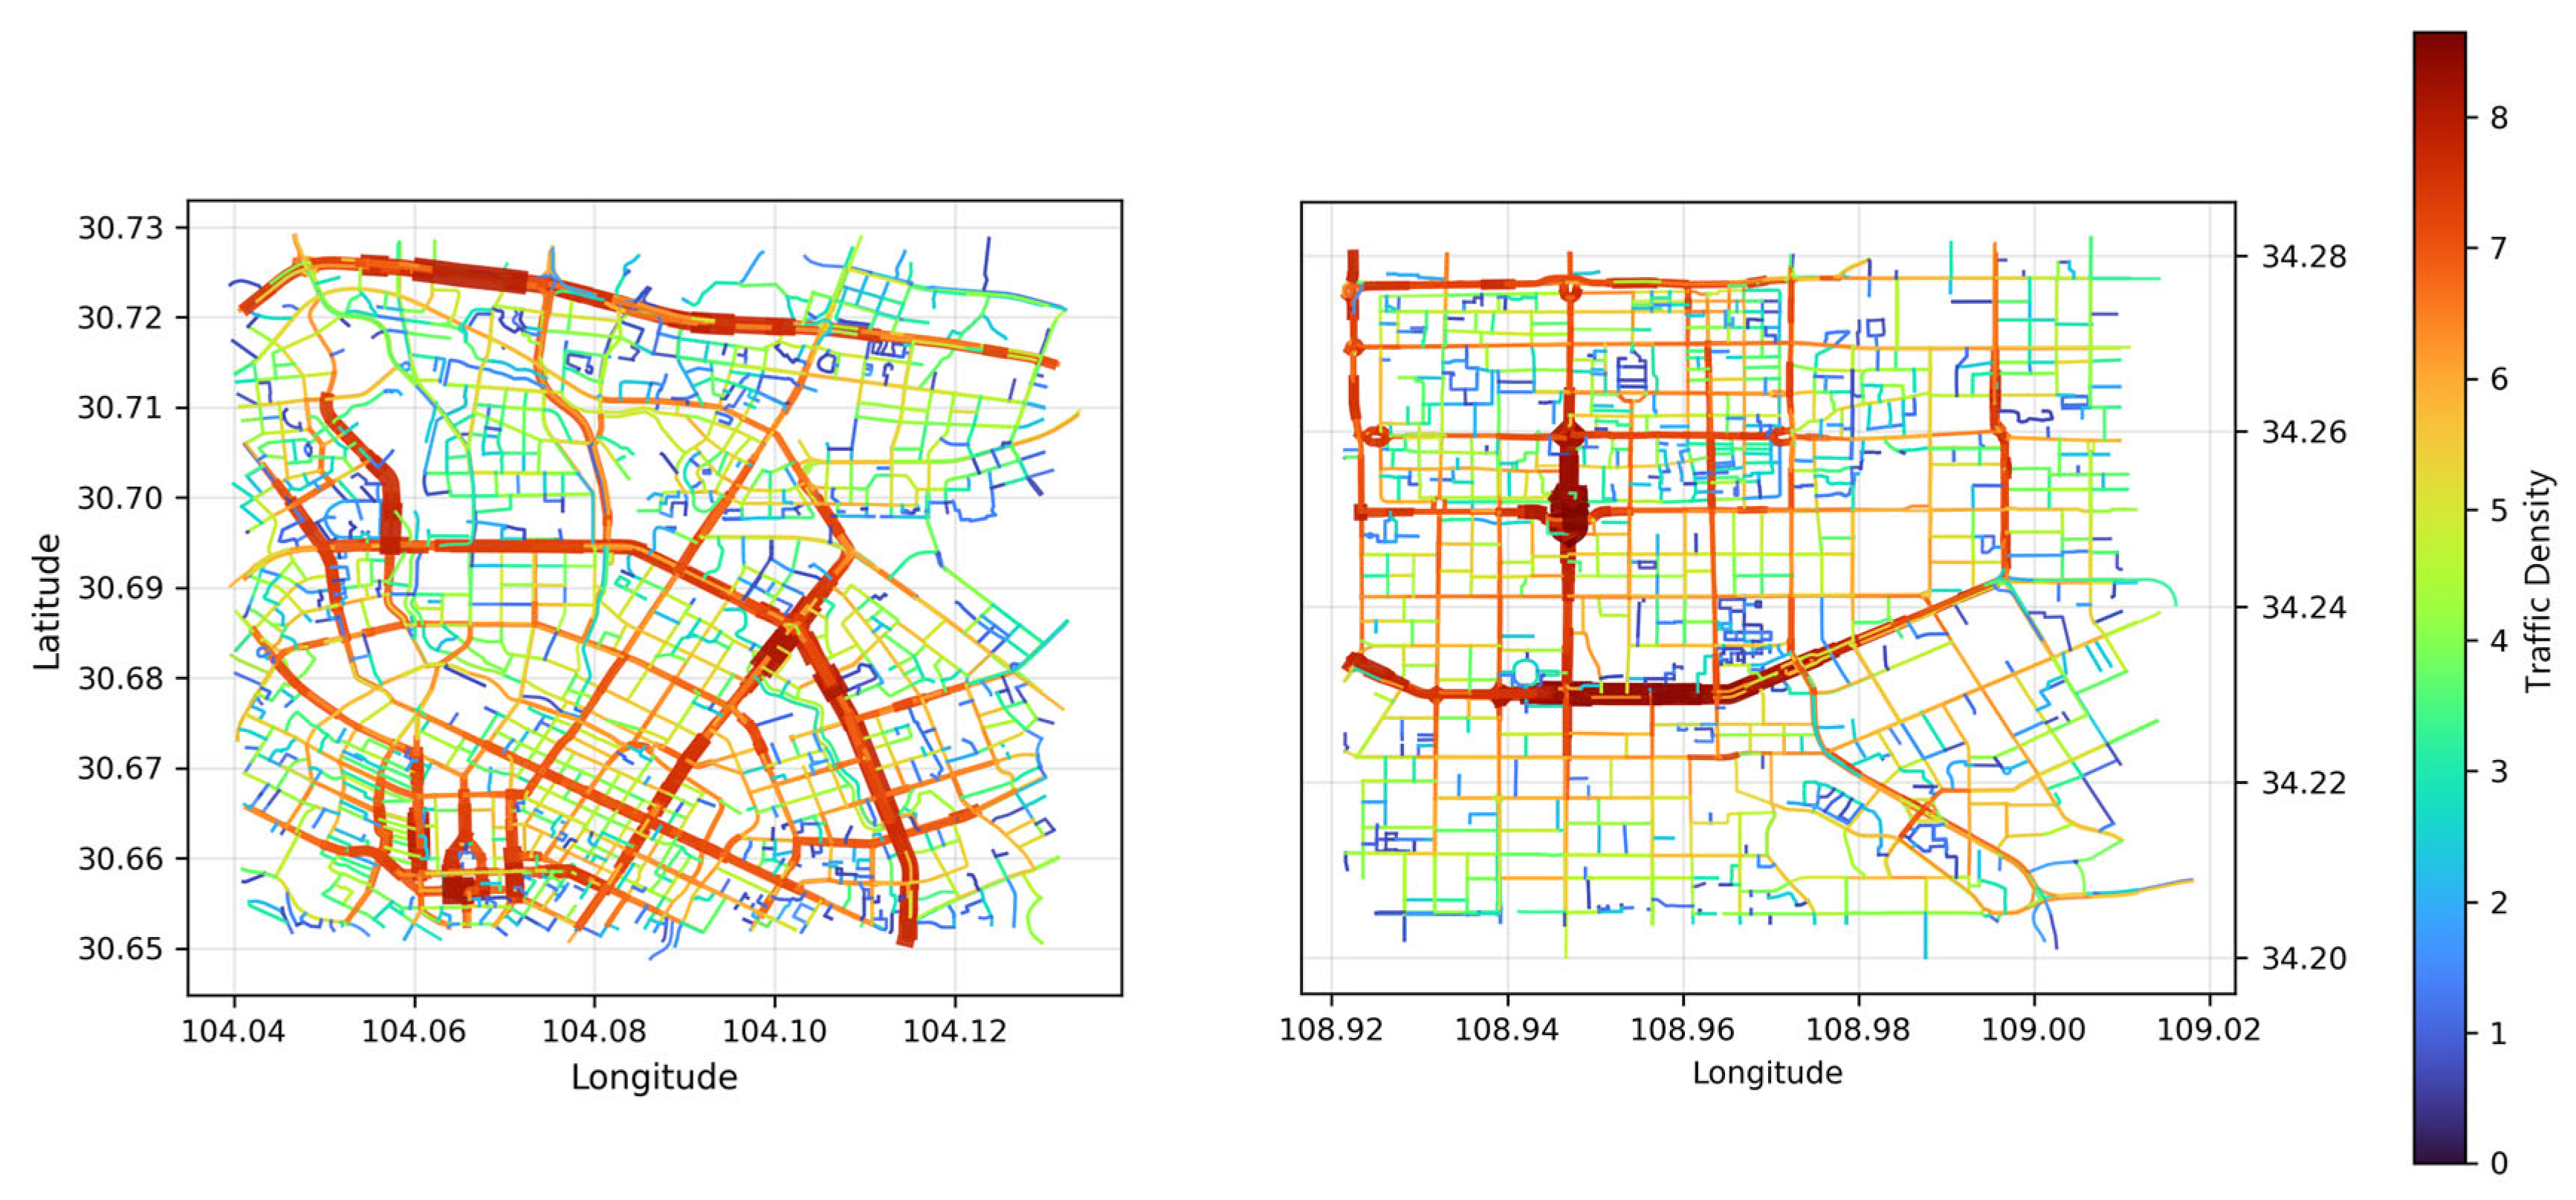
This paper conducted a statistical analysis and visualization of the trajectory dataset to illustrate the uneven distribution of trajectory data across urban space and time. As shown in
Figure 2 and
Figure 3, the trajectory data in Chengdu and Xi’an exhibit pronounced non-uniform characteristics in the spatiotemporal dimension. Spatially, the trajectories are highly concentrated within the core urban road networks and main arterial roads, forming distinct hotspots, while peripheral areas display sparse data coverage. Temporally, the trajectory flow demonstrates a typical bimodal pattern, with dense activity during morning and evening commuting peaks and significantly fewer trajectories during nighttime and early morning hours. This inherent distributional imbalance underscores the limitations of traditional uniform-sampling models and validates the necessity of the anchor enhancement method proposed in this paper.
5.2. Evaluation Metrics
To evaluate the quality of the trajectory representations output, this paper employs travel time estimation and a similar trajectory query for assessment. In the travel time estimation task, the model takes the vector representation of the trajectory as input and predicts its total travel time through a regression layer. The performance of this task is measured by two metrics, mean absolute error (MAE) and root mean square error (RMSE). The lower the values of these metrics, the more effective the spatiotemporal features captured by the model are for time prediction.
In the similar trajectory query task, the aim is to test the model’s perception and generalization ability of the high-level semantics of trajectories. Given a query trajectory, the pre-trained model encodes it into a low-dimensional vector, and then retrieves the top-k trajectories with the highest cosine similarity from a large trajectory database. To construct a test set with semantic challenges, this task adopts a key trajectory generation method based on detour strategies, which constructs trajectory pairs that are different in specific paths but similar in travel intentions by replacing local sub-paths in the original trajectory while keeping the start and end points unchanged. Ultimately, this task comprehensively evaluates the model’s semantic discrimination ability by calculating the mean rank (MR), defined as the average of the 0-indexed positions (i.e., the top match has rank 0) of the ground-truth trajectory among queries that are successfully retrieved in the top-K results. This ensures that MR reflects the average retrieval quality only for successfully retrieved queries. The top-10 hit rate (HR@10) and the number of completely missed hits (No Hit) are also reported for these trajectories in the retrieval results. The No Hit count is an absolute count (not a ratio) of query trajectories whose top-K predictions fail to match any ground-truth trajectory, and it is averaged over all evaluation splits. The lower the average rank and the higher the hit rate, the more robust the model’s representation of trajectory behavior semantics and the stronger its generalization ability.
5.3. Experiment Setting
This paper evaluated AnchorTRL and the baseline on a server equipped with Intel Core i7-10700 CPU @ 2.90 GHz and NVIDIA GeForce RTX 3090 with 24 GB memory. All models were implemented using Python 3.8 and Pytorch 1.10.0. The experiments were conducted on Ubuntu 18.04 and CUDA 11.1. For the anchor selection module, α is set to the average trajectory length of each dataset, which is 15 in Chengdu and Xi’an.
5.4. Baselines
This paper selects nine trajectory representation learning models as the baselines, including three types of baselines: graph-based trajectory representation learning, GPS-based trajectory representation learning, and route-based trajectory representation learning. Moreover, these baselines are chosen to cover classic embedding methods, early deep learning approaches, and recent state-of-the-art models. This diverse selection enables a comprehensive evaluation of AnchorTRL against methods with different architectural designs and learning objectives. All the baseline hyperparameters are set according to the recommended values from original papers.
The representational ability of graph-based representation learning methods mainly stems from the graph structure of the road network topology. Specifically, Word2vec [
13] regards road segments as “words” and learns embeddings based on co-occurrence relationships using the Skip-gram model, while trajectories are represented as the average of road segment embeddings. Node2vec [
14] generates random walk sequences on the road network graph to learn node embeddings, and trajectories are represented as the average of road segment embeddings. GAE [
15] learns node embeddings by reconstructing the adjacency matrix through a graph autoencoder, and trajectories are represented as the average of road segment embeddings.
The representational ability of the trajectory representation learning method based on GPS stems from the learning of sequential information from individual trajectory data. Specifically, Traj2vec [
16] uses a Seq2Seq model to directly encode the feature sequences of GPS points to generate trajectory representations.
Based on the route-based trajectory representation learning, the integration of road network topology and sequence dependence enhances the representation ability of trajectories. Specifically, Toast [
21] combines Skip-gram pre-training with masked language model (MLM) and trajectory discrimination task to learn road segment embeddings, and the trajectory representation is the average of road segment embeddings. PIM [
19] learns road segment embeddings through contrastive learning (the shortest path as positive samples, node swapping as negative samples), and the trajectory representation is the average of road segment embeddings. START [
20] integrates travel semantics and temporal continuity, and optimizes through self-supervised tasks, and the trajectory representation is output by Transformer encoding. JCRLNT [
27] combines a graph encoder and trajectory encoder, and learns through three contrastive tasks, and the trajectory representation is the output of joint encoding. JGRM [
24] uses a graph encoder and trajectory encoder to jointly model GPS information and Route information, learns a unified representation, and finally generates trajectory embeddings that integrate spatiotemporal and topological information. GREEN [
25] exploits the complementarity of grid trajectories and road network trajectories for multimodal fusion through dual encoders and contrastive learning.
5.5. Overall Results
Table 2 and
Table 3 respectively present the experimental results of the proposed model and baselines on two real traffic datasets from Chengdu and Xi’an. The results show that AnchorTRL has achieved improvements in both the travel time estimation task and the similarity query task, showing the advantages of this framework in terms of trajectory representation quality and multi-tasking. This can be explained by the introduction of anchor trajectories that cover the spatiotemporal and behavioral diversity within the trajectory distribution. By balancing the learning degree of multi-dimensional data distributions through the AGRAM module, the overall performance of the model is thereby enhanced.
In the travel time estimation task, the AnchorTRL model achieved the best performance among all baselines. It outperformed the comparison methods by improving MAE by 19% and RMSE by 15% on the Chengdu dataset, and by 17% (MAE) and 13% (RMSE) on the Xi’an dataset. Since AnchorTRL builds upon the same dual-view encoder architecture as JGRM, the consistent and substantial gains observed across both datasets can be largely attributed to the anchor-guided learning strategy. During training, the anchor-guided mechanism effectively compressed the distance between similar trajectories in the representation space through contrastive learning, facilitating the learning of more consistent trajectory embeddings. This anchor-driven clustering effect directly enhanced the stability and accuracy of travel time estimation. Moreover, the path coverage objective of the anchors ensured that trajectories across different spatial regions and temporal periods were sufficiently represented during training. As a result, the model mitigated overfitting to specific frequent routes and demonstrated superior overall generalization performance.
In the similarity query task, GREEN incorporates a deep bidirectional alignment mechanism for grids and roads, which enables it to outperform JGRM. AnchorTRL still outperformed it in terms of the MR and HR@10 metrics on the Chengdu dataset by 53.6% and 1.5%, respectively, and by 57.0% and 3.3% on the Xi’an dataset. This is mainly because AnchorTRL better captures the overall semantics of trajectories, and AGRAM provides a robust similarity calculation strategy. AnchorTRL uses cosine similarity to measure the similarity of trajectories in multi-dimensional behavioral features such as speed, acceleration, and steering angle, capturing the dynamic patterns of the trajectories. Additionally, AnchorTRL introduces path-level Jaccard overlap, emphasizing the structural similarity of trajectories at the road topology level. This approach makes the model learn more comprehensive trajectory similarity relationships, thereby improving its performance in downstream tasks.
6. Discussion
6.1. Ablation Study
In this paper, AnchorTRL introduces multiple modules or strategies to enhance the representation of trajectories. To examine their contributions to the overall performance, a set of ablation experiments is designed in this paper on the Chengdu dataset. Specifically, w/o STASM means removing anchor selection during the batch construction stage, which randomly selects trajectories as references; w/o Jaccard means removing the path overlap degree from the similarity calculation and only retaining the feature similarity; w/o similarity means removing the feature similarity from the similarity calculation and only retaining the Jaccard path overlap degree; w/o AGRAM means canceling the greedy anchor selection algorithm based on coverage gain and replacing it with random generation of training batches; w/o cl means removing the contrastive learning loss and relying only on the basic representation for training; w/o cl_weight means removing the weight decay mechanism in contrastive learning and treating positive and negative samples equally; w/o temporal gain sets as 0, which means removing the temporal gain in the STASM.
Table 4 shows the performance of each variant in the final task. From the experimental results, the complete model has the best performance, indicating that the collaborative effect of each module significantly improves the representation quality. After removing STASM, MAE and RMSE significantly increase, MR increases from 0.70 to 2.55, and No Hit reaches 5.5. This simulates the typical failure scenario of traditional methods when dealing with complexly distributed data. It shows that the anchor selection based on coverage is the foundation for constructing a stable and unbiased representation space. When Jaccard is removed, although MAE and RMSE increase slightly, MR decreases to 0.48. This indicates that the path overlap degree is important in spatial consistency modeling, but semantic discrimination mainly relies on feature similarity. Removing feature similarity leads to MR rising to 1.81 and HR@10 dropping to 0.958, indicating that relying solely on path overlap degree is difficult to ensure semantic discrimination. Removing AGRAM results in the worst MAE/RMSE, indicating that the greedy strategy based on coverage gain can effectively avoid data bias caused by random sampling. Removing contrastive learning also causes a significant performance drop, with MR rising to 2.02 and HR@10 dropping to 0.953. This shows that contrastive optimization is the key to strengthening discrimination. Removing the cl_weight only results in overall performance close to the complete model, but MR and No Hit increase slightly, indicating that the hard example weighting mechanism can further improve stability. The w/o temporal gain result confirms that the temporal prior, while not the primary driver, still offers complementary value in anchor selection.
6.2. Effectiveness on Underrepresented Spatiotemporal Trajectories
To validate the robustness of AnchorTRL in handling spatiotemporally imbalanced data, this section further divides the Chengdu test set trajectories into four subsets based on the definitions of trajectory popularity attributes presented in
Section 3: Spatially Unpopular, Spatially Popular, Temporally Unpopular, and Temporally Popular.
Table 5 presents the performance comparison between AnchorTRL and the baseline model JGRM on these subsets for the tasks of travel time estimation and similar trajectory query, evaluated via MAE and MR respectively.
The experimental results indicate that AnchorTRL achieves significant performance improvements over JGRM across all four subsets. Notably, on the Spatially Unpopular and Temporally Unpopular subsets, AnchorTRL reduces MAE by 23.1% and 23.0%, and MR by 70.1% and 71.4%, respectively. These results strongly demonstrate that AnchorTRL effectively mitigates model bias caused by uneven data distribution and substantially enhances the model’s ability to perceive and model underrepresented trajectories. Meanwhile, on the Spatially Popular and Temporally Popular subsets, AnchorTRL also reduces MAE by 16.7% and 15.6%, and MR by 64.0% and 64.3%, respectively, indicating that the anchor-guided balanced learning strategy universally improves overall representation quality.
6.3. Influence of Anchor Selection Strategy
This paper compared the effects of different anchor generation methods to the performance of AnchorTRL on the Chengdu dataset. Specifically, AnchorTRL uses the greedy anchor selection algorithm based on coverage gain proposed in this paper. Random means randomly selecting anchors from the trajectory set. Frequency means prioritizing trajectories with high occurrence frequency or a large number of covered sections as anchors; K-Means means first running K-Means clustering in the trajectory feature space, and then replacing the cluster centers with the closest real trajectories as anchors.
The experimental results in
Table 6 show that AnchorTRL achieved the best performance in both travel time estimation and similar trajectory query tasks. This can be explained that the greedy selection driven by coverage gain can provide high-quality references while ensuring spatiotemporal diversity and semantic coverage. In contrast, random was slightly inferior to AnchorTRL, indicating that random selection lacks keyness. However, it still ensures a certain baseline performance when the data volume is sufficient. Frequency performed the worst, especially in similar queries, with MR reaching 7.39 and HR@10 dropping to 0.871. This shows that over-reliance on high-frequency trajectories leads to severe bias towards common patterns, thereby weakening the model’s ability to model the long-tail or low-frequency behaviors. K-Means performed better than random and frequency, but still lagged behind AnchorTRL. The reason is that although clustering can ensure the coverage of anchors, K-Means is based only on geometric features and ignores the spatiotemporal semantic diversity of trajectories, thus still having deviations. Overall, the experimental results indicate that the greedy anchor selection strategy of AnchorTRL can achieve a balance between randomness, coverage, and keyness, thereby ensuring the superior performance of the model in downstream tasks.
6.4. Migration Experiments Across Cities
The migration experiments in this paper aim to verify the generalization ability of AnchorTRL in cross-city scenarios. That is, it examines whether the model can transfer the trajectory representations learned in the source city to the target city, thereby improving the prediction performance in cases where the data distribution is different. Specifically, using the real city trajectory datasets of Chengdu and Xi’an as the experimental objects, two transfer modes, namely zero-shot (training directly in the source city and then testing in the target city) and fine-tuning (performing a small amount of fine-tuning on the target city before testing), were set. The transfer effect of the model was evaluated through the travel time estimation task. For fine-tuning, we randomly sample 5000 trajectories from the target city and train for 20 epochs using the same composite loss in Equation (3) as in pre-training. The road embedding layer and MLM heads are re-initialized to match the target city’s vocabulary size, while other parameters are initialized from the source-city pre-trained weights. MAE and RMSE are used only for downstream evaluation, not as training objectives.
As shown in
Table 7, in the zero-shot scenario, the model had larger MAE and RMSE values for the “Chengdu→Xi’an”, which were 82.77 and 114.31, respectively. While the error for the “Xi’an→Chengdu” direction was relatively lower. This indicates that the data distribution in Chengdu is more complex, and direct cross-domain transfer is more challenging. After fine-tuning, the indicators for both transfer directions have improved to varying degrees. Among them, the error for “Chengdu→Xi’an” decreased significantly. This indicates that the trajectory representation learned by AnchorTRL exhibits cross-domain transferability, and that fine-tuning effectively alleviates the impact of inter-city distribution discrepancies. These results indicate the robustness and out-of-distribution generalization ability of AnchorTRL.
6.5. Effect of Training Data Size
This section focuses on examining the impact of the size of the training data on the performance of the AnchorTRL model. Specifically, the experiment selected the trajectory data of Chengdu city from 1 November to different end dates as the training set, gradually increasing the number of days, and evaluated the performance of travel time estimation and similar trajectory queries on a unified test set. As the number of training data days increased, the performance differences of the model under different scale data reflected the sensitivity of AnchorTRL to the data size.
Table 8 shows that as the training data increased, the model performance steadily improved and gradually converged. In travel time estimation, MAE and RMSE fluctuated around 70 in the early stages but dropped below 68 after 10 November, reaching the best results on 14 November, suggesting that larger-scale data helps the model learn more stable spatiotemporal features. In the similar trajectory query task, the MR value decreased rapidly with more data, reaching 0.34 on 13 November, while HR@10 remained around 0.99 and No Hit approached 0. These results indicate that AnchorTRL benefits from larger and more diverse training data, which enhances the robustness and semantic coverage of its anchor system, demonstrating the model’s scalability and stability under data expansion.
6.6. Training Convergence Curve
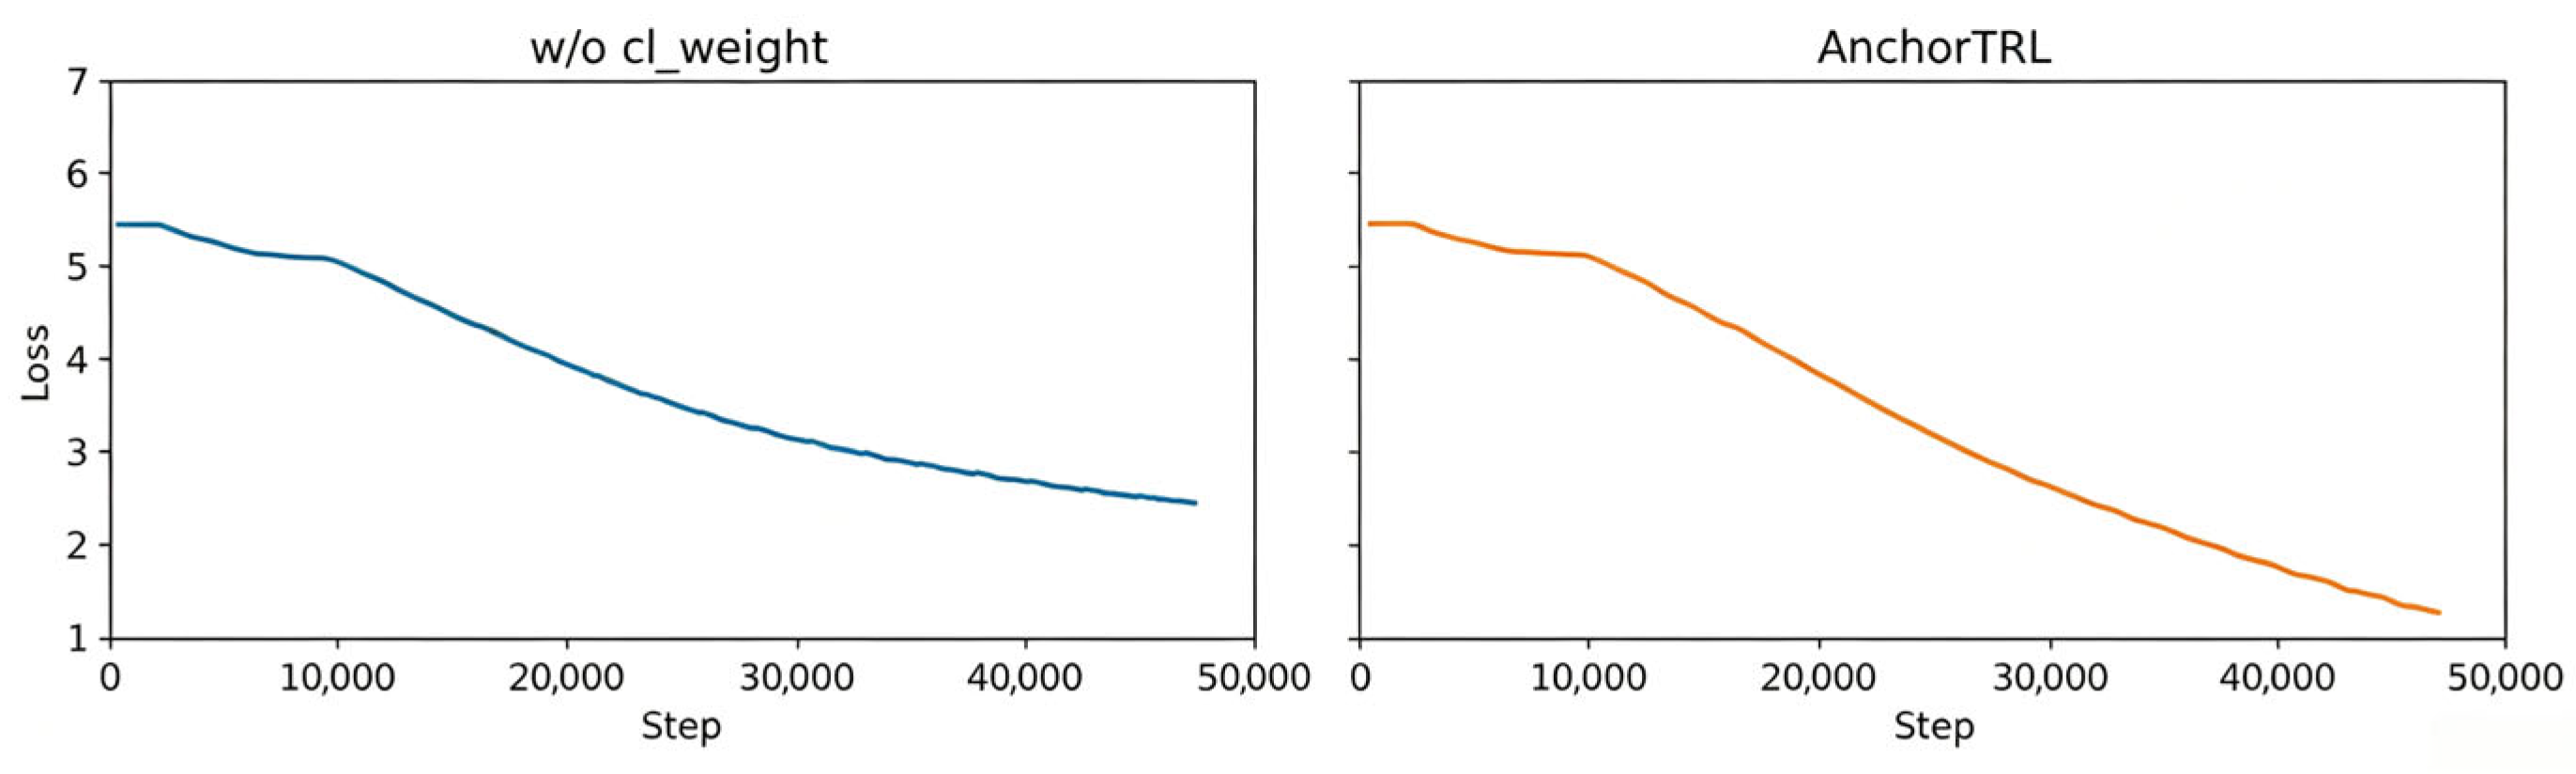
To evaluate the training stability and convergence efficiency of the AnchorTRL model, this paper monitored the total loss change curve during its training process, as shown in
Figure 4. The experiment compared two configurations. The left figure shows the convergence situation of the w/o cl_weight, which is mentioned in the
Section 6.1, while the right figure shows the convergence situation of the model with the introduced linearly decaying weight mechanism for the contrast loss. The vertical axis represents the total loss value, and the horizontal axis represents the number of training steps.
In the early training stage, both configurations exhibited similar downward trends, as the contrastive loss dominated the optimization and guided the model to learn the global semantic structure of trajectories. In the later stage, the curves began to diverge, with the decay mechanism leading to smoother and faster convergence. After 20,000 steps, AnchorTRL exhibited a more pronounced downward trend in loss compared to the variant without decay. By gradually reducing the weight of the contrastive loss, the model achieves adaptive gradient balancing, allowing it to better capture local contextual and fine-grained semantic features, thereby improving generalization.
6.7. Efficiency Analysis
To further examine the model’s performance, this section evaluates the computational efficiency of AnchorTRL against JGRM across five metrics on the Chengdu dataset, including preprocessing time, training time per epoch, inference time per trajectory, and memory consumption, as summarized in
Table 9.
As shown in the table, AnchorTRL’s offline preprocessing time takes 41.32 min due to adopting the greedy anchor selection algorithm and similarity matrix construction, which is significantly longer than the baseline model’s 1.10 min. Note that the operation is executed only once before training, and its outputs are stored for later use during training. In return, AnchorTRL achieves a training time of 22.01 min/epoch, reducing the baseline’s 26.49 min/epoch by 16.9%. This speedup stems from pre-generated batch indices that eliminate online sampling overhead. For model inference, AnchorTRL maintains virtually identical latency to the baseline, as the anchor mechanism is decoupled from the inference pipeline and introduces no additional online delay. Regarding memory, AnchorTRL uses 4.23 GB of GPU memory, only 2.7% more than the baseline, while CPU memory increases by 20.7% to 8.57 GB, primarily due to the persistently stored similarity matrix and pre-generated batch lists. These results indicate that the anchor-guided strategy effectively shifts computational overhead from online training to offline preparation, yielding 16.9% per-epoch acceleration without compromising inference efficiency. This characteristic is particularly advantageous for large-scale pre-training scenarios where the one-time preprocessing cost is well amortized.
7. Conclusions
This paper identifies the critical yet under-explored challenge of spatiotemporal distribution bias in urban trajectory data, which leads to biased representations and poor performance in urban downstream tasks. To address this fundamental issue, this paper introduces AnchorTRL, a novel trajectory representation learning framework built upon the perspective of anchor-guided balanced learning. AnchorTRL establishes a stable reference system through spatiotemporal anchors, employing an anchor-guided contrastive learning strategy and a dynamic balanced sampling mechanism to steer the model towards learning balanced and distribution-invariant representations for robust urban environment perception. This paper provides a foundational step towards constructing more reliable and robust trajectory intelligence systems for real-world deployment.
One limitation of this paper lies in that it has only been validated on two city datasets. Future work should test its generalization ability in more heterogeneous urban environments and spatial contexts. Additionally, it is worthwhile to explore the introduction of multimodal signals and context-aware mechanisms to further enhance the depth and practicality of trajectory semantic understanding.
Author Contributions
Conceptualization, Kaiyue Liu; methodology, Kaiyue Liu; writing—original draft preparation, Kaiyue Liu; writing—review and editing, Kaiyue Liu, Hang Zhou, Zhouzheng Xu, Bingyi Li, Yuxing Wu, Chaofan Fan, Junfang Gong and Shengwen Li; supervision, Shengwen Li; funding acquisition, Shengwen Li. All authors have read and agreed to the published version of the manuscript.
Funding
National Natural Science Foundation of China: 42371420; The Deep Earth Probe and Mineral Resources Exploration National Science and Technology Major Project Grant 2025ZD1008204.
Data Availability Statement
The raw data supporting the conclusions of this article will be made available by the authors on request.
Conflicts of Interest
The authors declare no conflict of interest.
References
- Graser, A.; Jalali, A.; Lampert, J.; Weißenfeld, A.; Janowicz, K. MobilityDL: A Review of Deep Learning from Trajectory Data. Geoinformatica 2025, 29, 115–147. [Google Scholar] [CrossRef]
- Han, C.; Wang, J.; Wang, Y.; Yu, X.; Lin, H.; Li, C.; Wu, J. Bridging Traffic State and Trajectory for Dynamic Road Network and Trajectory Representation Learning. In Proceedings of the AAAI Conference on Artificial Intelligence; AAAI Press: Washington, DC, USA, 2025; Volume 39, pp. 11763–11771. [Google Scholar]
- Wang, D.; Cao, W.; Li, J.; Ye, J. DeepSD: Supply-Demand Prediction for Online Car-Hailing Services Using Deep Neural Networks. In Proceedings of the 2017 IEEE 33rd International Conference on Data Engineering (ICDE); IEEE: Piscataway, NJ, USA, 2017; pp. 243–254. [Google Scholar]
- Wang, C.; Lin, Z.; Dong, S.; Jin, X.; Wu, S.; Wu, Y.; Du, Z. An Urban Community Discovery Method from a Line Graph Perspective Based on Trajectory Data. J. Geovis. Spat. Anal. 2025, 9, 41. [Google Scholar] [CrossRef]
- Li, X.; Zhao, K.; Cong, G.; Jensen, C.S.; Wei, W. Deep Representation Learning for Trajectory Similarity Computation. In Proceedings of the 2018 IEEE 34th International Conference on Data Engineering (ICDE); IEEE: Piscataway, NJ, USA, 2018; pp. 617–628. [Google Scholar]
- Deng, L.; Zhao, Y.; Fu, Z.; Sun, H.; Liu, S.; Zheng, K. Efficient Trajectory Similarity Computation with Contrastive Learning. In Proceedings of the 31st ACM International Conference on Information & Knowledge Management; ACM: New York, NY, USA, 2022; pp. 365–374. [Google Scholar]
- Chang, Y.; Qi, J.; Liang, Y.; Tanin, E. Contrastive Trajectory Similarity Learning with Dual-Feature Attention. In Proceedings of the 2023 IEEE 39th International Conference on Data Engineering (ICDE); IEEE: Piscataway, NJ, USA, 2023; pp. 2933–2945. [Google Scholar]
- Qin, Z.; Zhang, P.; Zhang, Q.; Gao, K.; Ma, Z. TransGTE: A Transformer-Based Model with Geographical Trajectory Embedding for the Individual Trip Destination Prediction. Expert Syst. Appl. 2025, 287, 128159. [Google Scholar] [CrossRef]
- Wu, X.; Chu, X.; Wang, J.; Zhao, S. RSUTrajRec: Multi-Granularity Trajectory Recovery Based on Roadside Units Sensing. Expert Syst. Appl. 2026, 298, 129780. [Google Scholar] [CrossRef]
- Huang, F.; Lv, J.; Yue, Y. Jointly Spatial-Temporal Representation Learning for Individual Trajectories. Comput. Environ. Urban Syst. 2024, 112, 102144. [Google Scholar] [CrossRef]
- Lin, Y.; Liu, Y.; Zhou, Z.; Wen, H.; Zheng, E.; Guo, S.; Lin, Y.; Wan, H. PTrajM: Efficient and Semantic-Rich Trajectory Learning with Pretrained Trajectory-Mamba. arXiv 2024, arXiv:2408.04916. [Google Scholar]
- Zheng, Y. Trajectory Data Mining: An Overview. ACM Trans. Intell. Syst. Technol. 2015, 6, 1–41. [Google Scholar] [CrossRef]
- Mikolov, T.; Chen, K.; Corrado, G.; Dean, J. Efficient Estimation of Word Representations in Vector Space. In Proceedings of the 1st International Conference on Learning Representations, ICLR 2013, Scottsdale, AZ, USA, 2–4 May 2013. [Google Scholar]
- Grover, A.; Leskovec, J. Node2vec: Scalable Feature Learning for Networks. In Proceedings of the 22nd ACM SIGKDD International Conference on Knowledge Discovery and Data Mining; ACM: New York, NY, USA, 2016; pp. 855–864. [Google Scholar]
- Kipf, T.N.; Welling, M. Variational Graph Auto-Encoders. arXiv 2016, arXiv:1611.07308. [Google Scholar]
- Yao, D.; Zhang, C.; Zhu, Z.; Huang, J.; Bi, J. Trajectory Clustering via Deep Representation Learning. In Proceedings of the 2017 International Joint Conference on Neural Networks (IJCNN); IEEE: Piscataway, NJ, USA, 2017; pp. 3880–3887. [Google Scholar]
- Fu, T.-Y.; Lee, W.-C. Trembr: Exploring Road Networks for Trajectory Representation Learning. ACM Trans. Intell. Syst. Technol. 2020, 11, 1–25. [Google Scholar] [CrossRef]
- Li, S.; Chen, W.; Yan, B.; Li, Z.; Zhu, S.; Yu, Y. Self-Supervised Contrastive Representation Learning for Large-Scale Trajectories. Future Gener. Comput. Syst. 2023, 148, 357–366. [Google Scholar] [CrossRef]
- Yang, S.B.; Guo, C.; Hu, J.; Tang, J.; Yang, B. Unsupervised Path Representation Learning with Curriculum Negative Sampling. arXiv 2021, arXiv:2106.09373. [Google Scholar]
- Jiang, J.; Pan, D.; Ren, H.; Jiang, X.; Li, C.; Wang, J. Self-Supervised Trajectory Representation Learning with Temporal Regularities and Travel Semantics. In Proceedings of the 2023 IEEE 39th International Conference on Data Engineering (ICDE); IEEE: Piscataway, NJ, USA, 2023; pp. 843–855. [Google Scholar]
- Chen, Y.; Li, X.; Cong, G.; Bao, Z.; Long, C.; Liu, Y.; Chandran, A.K.; Ellison, R. Robust Road Network Representation Learning: When Traffic Patterns Meet Traveling Semantics. In Proceedings of the 30th ACM International Conference on Information & Knowledge Management; ACM: New York, NY, USA, 2021; pp. 211–220. [Google Scholar]
- You, Y.; Lai, W.; Huang, L. Measuring Street Spatial Form Using Street View Imagery and Computer Vision: A Case Study of the Greater Bay Area, China. J. Geovis. Spat. Anal. 2026, 10, 20. [Google Scholar] [CrossRef]
- Wang, Z.; Long, C.; Cong, G.; Ju, C. Effective and Efficient Sports Play Retrieval with Deep Representation Learning. In Proceedings of the 25th ACM SIGKDD International Conference on Knowledge Discovery & Data Mining; ACM: New York, NY, USA, 2019; pp. 499–509. [Google Scholar]
- Ma, Z.; Tu, Z.; Chen, X.; Zhang, Y.; Xia, D.; Zhou, G.; Chen, Y.; Zheng, Y.; Gong, J. More Than Routing: Joint GPS and Route Modeling for Refine Trajectory Representation Learning. In Proceedings of the ACM Web Conference 2024; ACM: New York, NY, USA, 2024; pp. 3064–3075. [Google Scholar]
- Zhou, S.; Shang, S.; Chen, L.; Han, P.; Jensen, C.S. Grid and Road Expressions Are Complementary for Trajectory Representation Learning. In Proceedings of the 31st ACM SIGKDD Conference on Knowledge Discovery and Data Mining V.1; ACM: New York, NY, USA; pp. 2135–2146.
- Yao, D.; Hu, H.; Du, L.; Cong, G.; Han, S.; Bi, J. TrajGAT: A Graph-Based Long-Term Dependency Modeling Approach for Trajectory Similarity Computation. In Proceedings of the 28th ACM SIGKDD Conference on Knowledge Discovery and Data Mining; ACM: New York, NY, USA, 2022; pp. 2275–2285. [Google Scholar]
- Mao, Z.; Li, Z.; Li, D.; Bai, L.; Zhao, R. Jointly Contrastive Representation Learning on Road Network and Trajectory. In Proceedings of the 31st ACM International Conference on Information & Knowledge Management; ACM: New York, NY, USA, 2022; pp. 1501–1510. [Google Scholar]
- Wei, Y.; Lin, Y.; Gao, H.; Xu, R.; Yang, S.B.; Hu, J. Path-LLM: A Multi-Modal Path Representation Learning by Aligning and Fusing with Large Language Models. In Proceedings of the ACM on Web Conference 2025; ACM: New York, NY, USA, 2025; pp. 2289–2298. [Google Scholar]
- Li, P.; Zhang, H.; Li, W.; Huang, D.; Guo, Z.; Chen, J.; Zhang, J.; Song, X.; Zhao, P.; Yan, J.; et al. GeoAvatar: A Big Mobile Phone Positioning Data-Driven Method for Individualized Pseudo Personal Mobility Data Generation. Comput. Environ. Urban Syst. 2025, 119, 102252. [Google Scholar] [CrossRef]
- Ren, S.; He, K.; Girshick, R.; Sun, J. Faster R-CNN: Towards Real-Time Object Detection with Region Proposal Networks. arXiv 2015, arXiv:1506.01497. [Google Scholar]
- Tian, Z.; Shen, C.; Chen, H.; He, T. FCOS: Fully Convolutional One-Stage Object Detection. In Proceedings of the 2019 IEEE/CVF International Conference on Computer Vision; IEEE: Piscataway, NJ, USA, 2019; pp. 9627–9636. [Google Scholar]
- Kirillov, A.; Girshick, R.; He, K.; Dollár, P. Panoptic Feature Pyramid Networks. In Proceedings of the 2019 IEEE/CVF Conference on Computer Vision and Pattern Recognition; IEEE: Piscataway, NJ, USA, 2019; pp. 6399–6408. [Google Scholar]
- Guo, J.; Ye, J. Anchors Bring Ease: An Embarrassingly Simple Approach to Partial Multi-View Clustering. In Proceedings of the AAAI Conference on Artificial Intelligence; AAAI Press: Washington, DC, USA, 2019; Volume 33, pp. 118–125. [Google Scholar]
- Artetxe, M.; Ruder, S.; Yogatama, D. On the Cross-Lingual Transferability of Monolingual Representations. In Proceedings of the 58th Annual Meeting of the Association for Computational Linguistics; Jurafsky, D., Chai, J., Schluter, N., Tetreault, J., Eds.; Association for Computational Linguistics: Online, 2020; pp. 4623–4637. [Google Scholar]
- Liang, B.; Su, H.; Gui, L.; Cambria, E.; Xu, R. Aspect-Based Sentiment Analysis via Affective Knowledge Enhanced Graph Convolutional Networks. Knowl.-Based Syst. 2022, 235, 107643. [Google Scholar] [CrossRef]
- Song, P.; Mu, J.; Cheng, Y.; Liu, Z.; Zheng, W. Essential Anchor Graph Learning for Incomplete Multi-View Clustering. Eng. Appl. Artif. Intell. 2025, 145, 110194. [Google Scholar] [CrossRef]
- Nemhauser, G.L.; Wolsey, L.A.; Fisher, M.L. An Analysis of Approximations for Maximizing Submodular Set Functions—I. Math. Program. 1978, 14, 265–294. [Google Scholar] [CrossRef]
- Krause, A.; Golovin, D. Submodular Function Maximization. Tractability 2014, 3, 3. [Google Scholar]
- Mitchell, J.; Lapata, M. Vector-Based Models of Semantic Composition. In Proceedings of ACL-08: HLT; Moore, J.D., Teufel, S., Allan, J., Furui, S., Eds.; Association for Computational Linguistics: Columbus, OH, USA, 2008; pp. 236–244. [Google Scholar]
- Huynh, T.; Kornblith, S.; Walter, M.R.; Maire, M.; Khademi, M. Boosting Contrastive Self-Supervised Learning with False Negative Cancellation. In Proceedings of the IEEE/CVF Winter Conference on Applications of Computer Vision; IEEE: Piscataway, NJ, USA, 2022; pp. 2785–2795. [Google Scholar]
| Disclaimer/Publisher’s Note: The statements, opinions and data contained in all publications are solely those of the individual author(s) and contributor(s) and not of MDPI and/or the editor(s). MDPI and/or the editor(s) disclaim responsibility for any injury to people or property resulting from any ideas, methods, instructions or products referred to in the content. |
© 2026 by the authors. Published by MDPI on behalf of the International Society for Photogrammetry and Remote Sensing. Licensee MDPI, Basel, Switzerland. This article is an open access article distributed under the terms and conditions of the Creative Commons Attribution (CC BY) license.




 ,
,