


Abstract
Tourism destinations increasingly serve both domestic and international visitors whose geographic behaviors may differ substantially, yet most analytical frameworks treat visitor distributions as spatially homogeneous. Few studies compare how domestic and international tourists cluster spatially within the same destination. Those differences matter enormously for destinations where visitor segments follow distinct geographic patterns. We analyzed 1547 bilingual TripAdvisor reviews from Chanthaburi Province, Thailand (2014–2023), combining Random Forest classification (83.26% accuracy for Thai, 96.45% for English) with Incremental Spatial Autocorrelation (ISA), Global Moran’s I, and Getis-Ord Gi* hotspot analysis. International visitors clustered more intensely overall (I = 0.253 vs. 0.213), but domestic visitors spread across all six tourism areas including agrotourism, while international visitors were concentrated in heritage, coastal recreation, and nature-temple zones with agrotourism absent. Both segments clustered strongly at cultural heritage sites and at beach destinations, contradicting the common assumption that coastal areas primarily serve international visitors, while agrotourism clustered exclusively among domestic visitors despite active policy promotion. These patterns reflect differential information access rather than attraction quality. The zone-level framework is transferable to secondary heritage destinations across Southeast Asia, where platform-based monitoring offers a practical alternative to large-scale visitor surveys.
1. Introduction
Tourism drives economic development in Chanthaburi Province, Thailand, where cultural heritage sites and natural landscapes attract both domestic and international visitors. The rise of platforms such as TripAdvisor has transformed how tourists share experiences and how researchers access feedback at scale [1,2,3]. These user reviews reveal not just what visitors liked or disliked but where reviews were posted, which is information that destination managers need to improve services and plan infrastructure. However, manually analyzing thousands of multilingual reviews across multiple sites remains impractical, creating demand for automated analytical approaches.
Natural language processing (NLP) and machine learning have become essential for handling large-scale review data [4]. Multilingual sentiment analysis has gained attention as tourism destinations increasingly serve diverse language groups [5]. Random Forest classifiers, in particular, work well for sentiment classification in tourism contexts, achieving high accuracy even with multilingual datasets [6,7,8,9]. However, sentiment alone tells an incomplete story. Understanding visitor spatial behavior requires knowing not just review content but where different visitor segments concentrate geographically and whether their spatial clustering patterns differ, which is information essential for targeted destination management.
Spatial methods address this limitation—the inability of sentiment-only analysis to reveal where different visitor segments concentrate geographically [10,11]. By testing whether visitor concentrations cluster or distribute randomly, these techniques enable managers to identify significant geographic patterns rather than dismiss them as random variation [12,13]. Moran’s I statistics quantify overall clustering strength [14], while Getis-Ord Gi* identifies statistically significant hotspots [15]. García-Palomares et al. [16] identified tourist hotspots in European cities using photo-sharing services and geographic information systems (GISs), while Paolanti et al. [17] combined sentiment analysis with geo-location data for destination management. Ferreira et al. [18] showed how social sensing reveals spatiotemporal patterns of tourist mobility. Recent advances in spatial point pattern analysis enable researchers to test whether observed concentrations represent statistically significant clustering, providing rigorous evidence for spatial differentiation in visitor distributions [19].
Despite these advances, three gaps limit our understanding of visitor spatial behavior. First, while recent studies have begun integrating sentiments with spatial data, they focus on overall tourist flows rather than systematically comparing how spatial clustering patterns differ between domestic and international visitor segments within destinations [20,21]. Whether clustering operates uniformly within destinations or varies geographically depending on visitor origin remains an open question—one critical for destinations serving diverse markets.
Second, the research concentrates on major cities—Tokyo, Singapore, Barcelona—leaving secondary heritage destinations understudied. Places like Chanthaburi matter because they attract diverse visitors (domestic weekenders, international tourists) to mixed attraction types (temples, markets, beaches, orchards) without the infrastructure maturity of primary destinations [22]. This creates uneven service quality and diverse visitor preferences that aggregate metrics cannot capture. Understanding these patterns advances theory by demonstrating that destination competitiveness operates not only between provinces but within them. Third, multilingual studies typically analyze languages separately rather than comparing spatial patterns across visitor groups. Ainin et al. [5] examined multilingual sentiment on halal tourism, but spatial comparison between language groups remains rare. Whether a temple district attracts Thai and foreign visitors equally and whether different visitor segments cluster in the same geographic areas remain unanswered questions with direct implications for destinations serving multiple markets.
These gaps become particularly evident when examining existing work on Chanthaburi Province. While sentiment analysis has been applied to this destination, including our previous conference paper [23], that work focused on classification accuracy without examining spatial patterns. The present study extends this foundation by integrating spatial statistical methods—specifically Global Moran’s I for detecting overall clustering and Getis-Ord Gi* for identifying significant hotspots—to reveal where different visitor segments concentrate geographically and whether spatial clustering patterns differ between domestic and international tourists.
We address these gaps by analyzing TripAdvisor reviews about Chanthaburi Province from 2014 through 2023. Random Forest models classify each review’s sentiment to enable language-based visitor segmentation, and spatial statistical methods identify significant clustering patterns and hotspots across the province’s ten districts. The decade-long timeframe captures tourism evolution, including COVID-19’s impacts. Three research questions guide our analysis: (1) How accurately can machine learning classify sentiment in bilingual Thai–English tourism reviews for visitor segmentation? (2) Where do different visitor segments concentrate geographically, and are these patterns statistically significant? (3) Do domestic and international tourists exhibit different spatial clustering patterns?
We demonstrate three contributions. Methodologically, we integrate sentiment classification with spatial statistics, where sentiment classification serves as a segmentation tool enabling language-based categorization (Thai-language reviews as a proxy for domestic tourists, English-language reviews as a proxy for international tourists) and spatial statistics quantify clustering patterns, revealing segment-specific geographic concentrations invisible to either technique alone. Theoretically, we demonstrate that destination competitiveness operates at sub-destination scales, with different visitor segments exhibiting distinct spatial clustering patterns shaped by cultural proximity and differential information access. Practically, these findings advance tourism informatics by enabling segment-specific, evidence-based resource allocation rather than province-wide interventions [24], providing destination authorities with actionable geographic intelligence aligned with smart tourism development principles that leverage information technology to enhance visitor experiences and destination sustainability [25].
2. Materials and Methods
Our methodology integrates sentiment classification with spatial statistics to reveal segment-specific clustering patterns. Machine learning enables language-based visitor segmentation, while spatial statistical methods quantify clustering intensity and identify significant concentration zones.
2.1. Sentiment Analysis
We classified 1547 TripAdvisor reviews by sentiment polarity (positive, neutral, negative) using Random Forest models. Review language, specifically Thai versus English, served as the primary basis for visitor-origin segmentation: Thai-language reviews as a proxy for domestic tourists and English-language reviews as a proxy for international tourists. Sentiment classification functions as an auxiliary descriptive analysis, characterizing the emotional tone of each segment’s reviews; it is not a prerequisite for spatial analysis, which relies directly on the language-based segmentation. Classification involved four stages: data collection, preprocessing with language-specific tokenization, manual labeling, and model training, each described in the subsections that follow.
2.1.1. Data Collection
We collected 1547 TripAdvisor reviews concerning tourism in Chanthaburi Province across the decade 2014–2023. The dataset comprises 868 Thai-language reviews (56.11%) and 679 English-language reviews (43.89%)—a distribution enabling comparison between visitor segments. Review language serves as a proxy for visitor origin: Thai-language reviews predominantly represent domestic tourists, while English-language reviews predominantly represent international tourists, though this proxy relationship remains imperfect given TripAdvisor’s lack of verified nationality data. We selected TripAdvisor because travelers routinely document detailed destination experiences on the platform, providing rich textual data suitable for sentiment classification and subsequent segmentation [26,27].
Data collection followed TripAdvisor’s terms of service and robots.txt guidelines, with automated scraping rate-limited to avoid server overload. Only review text, posting dates, attraction names, and star ratings were extracted, no personally identifiable information. Data were stored on secure institutional servers and analyzed at the aggregate level, consistent with standard practice for platform-based tourism research.
2.1.2. Data Preprocessing
From the 1547 reviews collected, we drew a stratified sample of 328 reviews for manual sentiment labeling: 187 Thai-language and 141 English-language reviews (21.2% of the total). Stratification ensured balanced representation across time periods (2014–2023), attraction types, and rating levels while maintaining manageable annotation workload. These manually labeled reviews provided the training and testing dataset for Random Forest model development. The trained model was then applied to classify all 1547 reviews, producing the language-based segments used in spatial analysis.
We applied standard text preprocessing procedures adapted for bilingual data [28,29]. Special characters, numbers, URLs, and HTML tags were removed while preserving language-specific scripts. Thai reviews retained only Thai characters; English reviews were converted to lowercase with punctuation removed. For tokenization, the Thai text was segmented using PyThaiNLP (v4.0.2) with the newmm (Maximum Matching) algorithm [30], whereas English text was tokenized using NLTK’s word tokenize function [31]. All machine learning models were implemented using scikit-learn (v1.3.0).
Stopword removal eliminated common words with minimal sentiment value. For Thai, we used PyThaiNLP’s stopword list supplemented with tourism-specific terms. For English, NLTK’s stopword list was applied, but negation terms (not, no, never) were retained because they reverse the sentiment polarity. English tokens were lemmatized to base forms using NLTK’s WordNetLemmatizer. The Thai text required no lemmatization given its isolating language structure where words do not inflect.
The text was converted to numerical features using Term Frequency–Inverse Document Frequency (TF-IDF), which weights terms by their frequency within documents relative to their rarity across the corpus [32]. TF-IDF vectorization used scikit-learn’s TfidfVectorizer [33] with parameters selected to balance vocabulary coverage and computational efficiency: max_features = 5000 and ngram_range = (1,2) to capture unigrams and bigrams such as “not good”, min_df = 3, max_df = 0.8, and sublinear_tf = True for logarithmic term frequency scaling. These settings produced feature matrices of 187 × 5000 for Thai reviews and 141 × 5000 for English reviews.
Three domain experts in tourism and linguistics independently labeled each review into positive (class 0), neutral (class 1), or negative (class 2) categories. The inter-annotator agreement as measured by Cohen’s kappa was 0.82 for Thai and 0.86 for English, indicating substantial agreement. The final labels were determined by majority vote. The resulting dataset showed the class imbalance typical of online tourism reviews, where positive feedback dominates. Thai reviews were distributed with a ratio of 141:37:9 (positive/neutral/negative), i.e., 15.7:4.1:1. English reviews were distributed with a ratio of 127:11:3, i.e., 42.3:3.7:1. To address this imbalance during model training, we applied class weighting in the Random Forest classifier, assigning inverse frequency weights to each class so that the minority classes received proportionally higher influence in the learning process.
Table 1 presents four illustrative examples from the training dataset (n = 328), showing preprocessed tokens and manually assigned sentiment labels for both language groups.
Table 1.
Representative examples from the labeled training dataset (n = 328) illustrating preprocessed tokens following stopword removal and lemmatization (English only) and manually assigned sentiment labels.
2.1.3. Machine Learning Approach
We evaluated four algorithms—Naïve Bayes, AdaBoost, Gradient Boosting, and Random Forest—to identify the optimal approach for bilingual sentiment classification. Random Forest substantially outperformed alternatives across both languages (Table 2).
Table 2.
Algorithm performance comparison for Thai and English sentiment classification across four machine learning approaches.
For Thai-language reviews, Random Forest achieved 83.26% accuracy with 61.62% F1-score, compared with the next-best performer, Naïve Bayes, at 78.74% accuracy and 51.02% F1. English-language results exhibited an even larger performance gap: Random Forest achieved 96.45% accuracy and 86.78% F1, while Naïve Bayes reached 90.71% accuracy and 72.46% F1. These F1-score differences demonstrate Random Forest’s superior minority class handling—critical given our severe class imbalance. AdaBoost performed poorly across both languages. Beyond accuracy, Random Forest provides two practical advantages: its ensemble structure reduces overfitting risk with limited training data, and it generates feature importance scores revealing which terms most influence sentiment predictions [8,34].
Given the fundamental structural differences between Thai and English, we developed separate classification models for each language. Thai text requires specialized tokenization because words appear without spacing, necessitating PyThaiNLP’s Maximum Matching algorithm. English text employs standard space-based tokenization through NLTK [31]. Each language maintained its own 5000-feature TF-IDF vocabulary, preventing cross-language term weight contamination while enabling subsequent language-based visitor segmentation.
Optimal hyperparameters were identified through grid search with 5-fold cross-validation across 480 combinations [35], exploring tree counts (50, 100, 200), maximum depths (10, 15, 20, unlimited), and node split rules (5–20 samples to split, 2–8 per leaf). The best configuration used 200 trees, depth of 15, minimum 10 samples to split nodes, minimum 4 samples per leaf, sqrt feature sampling (~71 of 5000 features per split), balanced class weights, and Gini impurity criterion.
We partitioned the 328 labeled reviews into 70% training and 30% testing sets using stratified sampling to preserve class proportions. As Section 2.1.2 describes, the data exhibited severe imbalance favoring positive reviews. Applying the balanced weighting formula w_j = n/(c × n_j), Thai-language class weights were 0.44 (positive), 1.68 (neutral), and 6.91 (negative). This weighting strategy is widely applied in Random Forest implementations to mitigate class imbalance [36].
The performance metrics included accuracy, precision, recall, and F1-score [37], plus false alarm ratio (FAR) and critical success index (CSI) for evaluating practical utility.
Following model training and validation on the 328-review labeled dataset, we deployed the optimized Random Forest models to classify all 1547 reviews. Each review underwent identical preprocessing before classification into positive, neutral, or negative categories. Applying a 0.60 confidence threshold for quality control, classification produced: Thai-language reviews—640 positive, 197 neutral, 31 negative (868 total); English-language reviews—602 positive, 58 neutral, 19 negative (679 total). Strong model performance (83.26% Thai-language accuracy, 96.45% English-language accuracy) ensured reliable sentiment labels. These sentiment-classified reviews, organized by language, provided the foundation for subsequent spatial analysis comparing domestic (Thai-language) versus international (English-language) visitor clustering patterns.
2.2. Spatial Statistical Analysis
Spatial analysis examined whether domestic (Thai-language) and international (English-language) visitor segments exhibited distinct geographic clustering patterns. Three complementary methods—Incremental Spatial Autocorrelation (ISA), Global Moran’s I, and Getis-Ord Gi*—detected and quantified clustering intensity and locations.
2.2.1. Spatial Data Preparation and Grid Sensitivity Testing
TripAdvisor reviews do not carry GPS coordinates; each review is linked to a named attraction selected by the reviewer at the time of posting. Attraction names were extracted from each review record and geocoded to geographic coordinates using the Google Maps Geocoding API (googlemaps v4.10.0), with all 1547 reviews assigned the coordinates of their respective attraction. Coordinates for high-volume sites (>10 reviews) were verified against satellite imagery. The resulting georeferenced points were subsequently aggregated into fishnet grid cells for spatial autocorrelation and hotspot analysis.
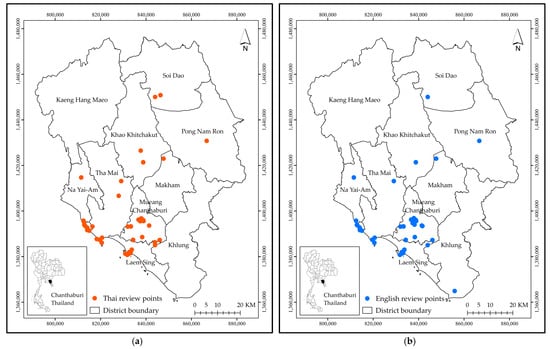
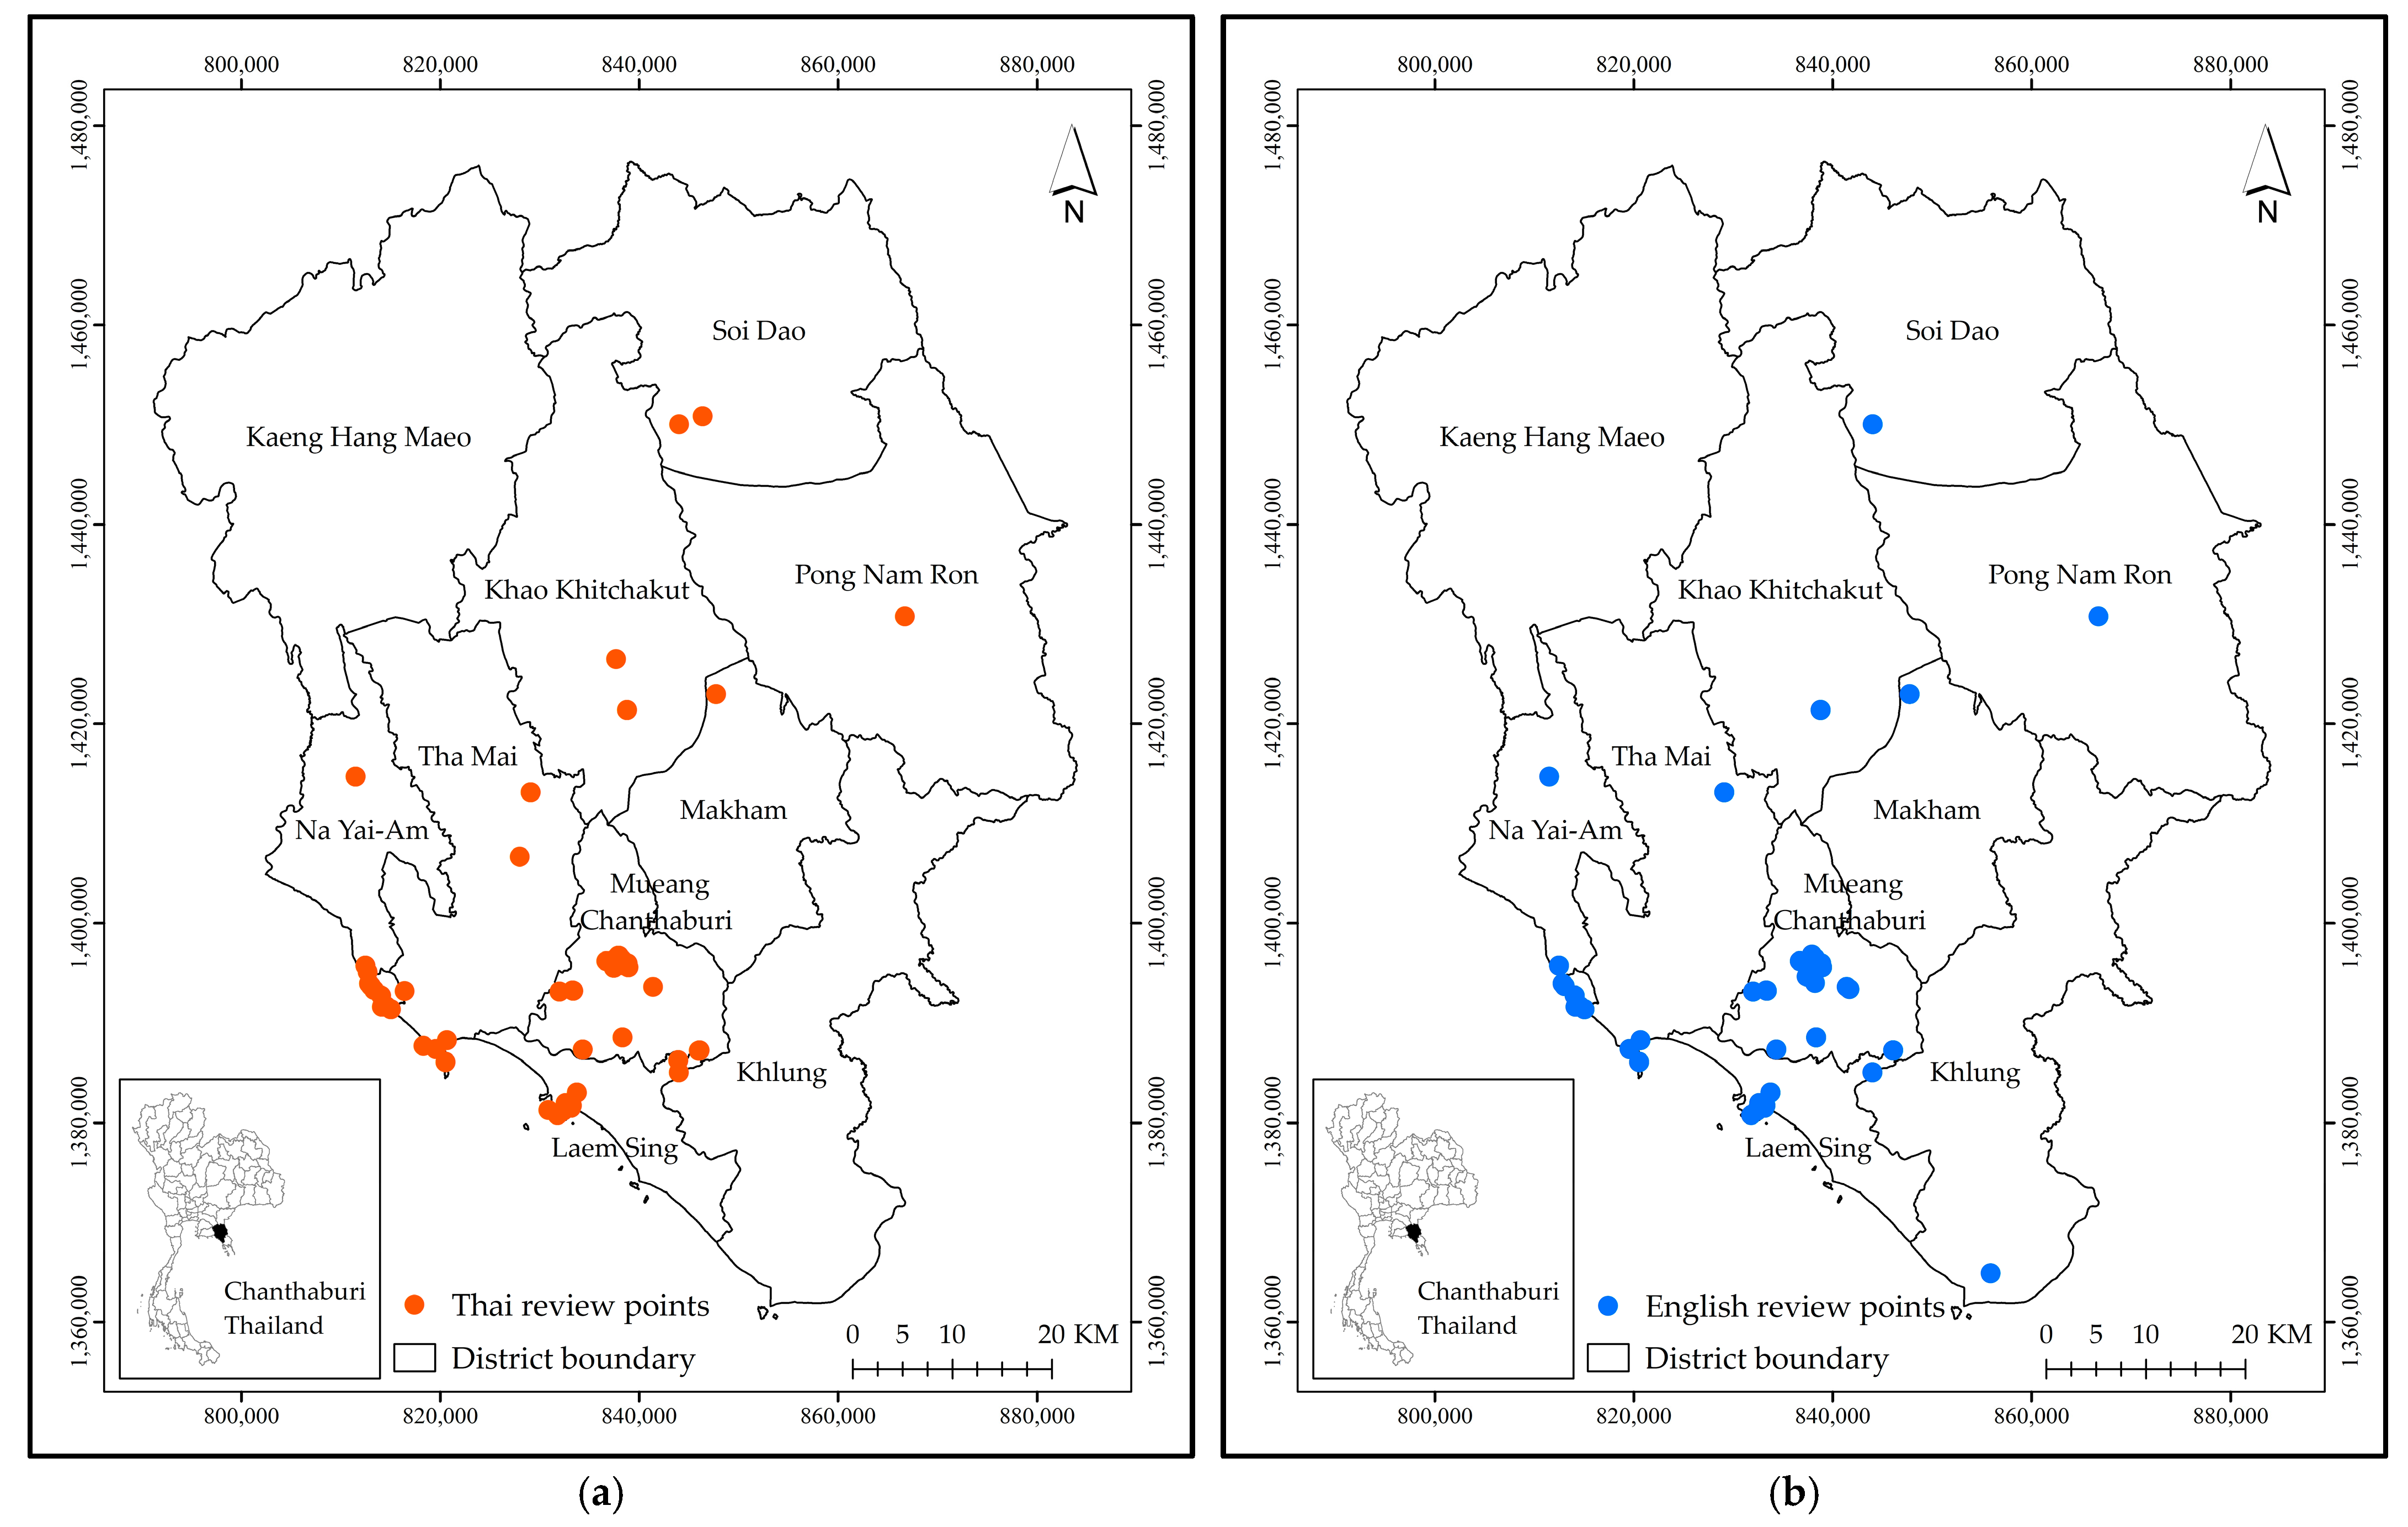
Reviews concentrate at approximately ten major documented attractions—temples, markets, beaches, and national parks (Figure 1)—rather than distributing continuously across provincial space. This pattern reflects TripAdvisor’s site-based review structure, in which analysis identifies clustering among established destinations rather than discovering previously unknown tourism activity.
Figure 1.
Spatial distribution of (a) Thai-language and (b) English-language review points across Chanthaburi Province prior to grid aggregation. Reviews are concentrated at approximately 10 major attractions rather than distributing continuously across provincial space.
Spatial statistics require aggregating point data into areal units. Grid cell size critically affects pattern detection—excessively fine resolution creates instability from sparse data, while excessively coarse resolution over-smooths meaningful variation [38]. We tested four fishnet grids covering Chanthaburi Province to determine optimal spatial resolution: 500 m × 500 m (26,304 cells), 1000 m × 1000 m (6725 cells), 1500 m × 1500 m (3051 cells), and 2000 m × 2000 m (1752 cells). For each resolution, we counted Thai-language and English-language reviews per cell using Spatial Join in ArcGIS Desktop 10.5. Optimal grid size emerged from ISA analysis (Section 3.3.1).
2.2.2. Incremental Spatial Autocorrelation (ISA): Determining Optimal Distance Bands
We determined optimal distance bands through ISA, which computes Global Moran’s I at successive distance thresholds to identify where spatial clustering peaks. This approach provides empirical justification for distance parameter selection rather than relying on arbitrary specification.
The distance corresponding to the first statistically significant peak in the z-score curve was interpreted as the dominant spatial scale of clustering and selected as the distance band for subsequent spatial analyses. Grid resolutions that did not exhibit a distinct first peak were considered to lack a characteristic interaction distance at that scale. This procedure follows established spatial analytical practices for defining distance parameters in spatial autocorrelation and hotspot analyses [39,40].
2.2.3. Spatial Clustering Detection and Hotspot Analysis
Global Moran’s I
Global Moran’s I measures spatial autocorrelation across the study area (Equation (1)):
where n = number of grid cells; = review count in cell ; = mean review count across all cells; and = spatial weight between cells and . We defined weights using inverse distance within the optimal threshold identified by ISA.
We calculated Moran’s I separately for Thai and English review counts to test whether each group clusters spatially and whether clustering strength differs between visitor origins.
Getis-Ord Gi* Hotspot Analysis
We applied Getis-Ord Gi* to identify specific hotspots for Thai and English reviews (Equation (2)):
where = standard deviation of review counts, and other terms are defined as above. The statistics yield a z-score for each cell, which we classified using standard thresholds:
z > 2.58 (p < 0.01): High-confidence hotspot.
z > 1.96 (p < 0.05): Moderate-confidence hotspot.
−1.96 < z < 1.96: Not significant.
z < −1.96 (p < 0.05): Moderate-confidence coldspot.
z < −2.58 (p < 0.01): High-confidence coldspot.
All spatial analyses used ArcGIS Desktop 10.5 with WGS 1984 UTM Zone 47N projection. Tools included: Fishnet creation, Spatial Join for counting reviews per cell, ISA, Global Moran’s I, and Getis-Ord Gi*.
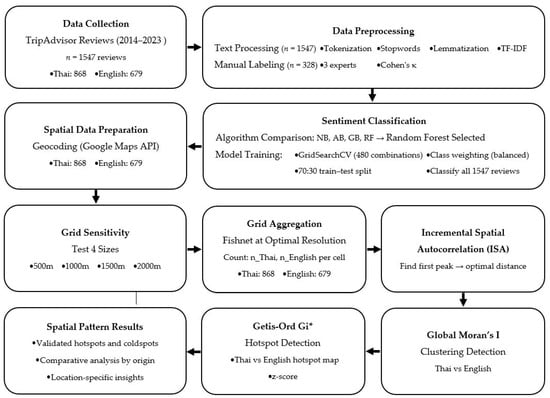
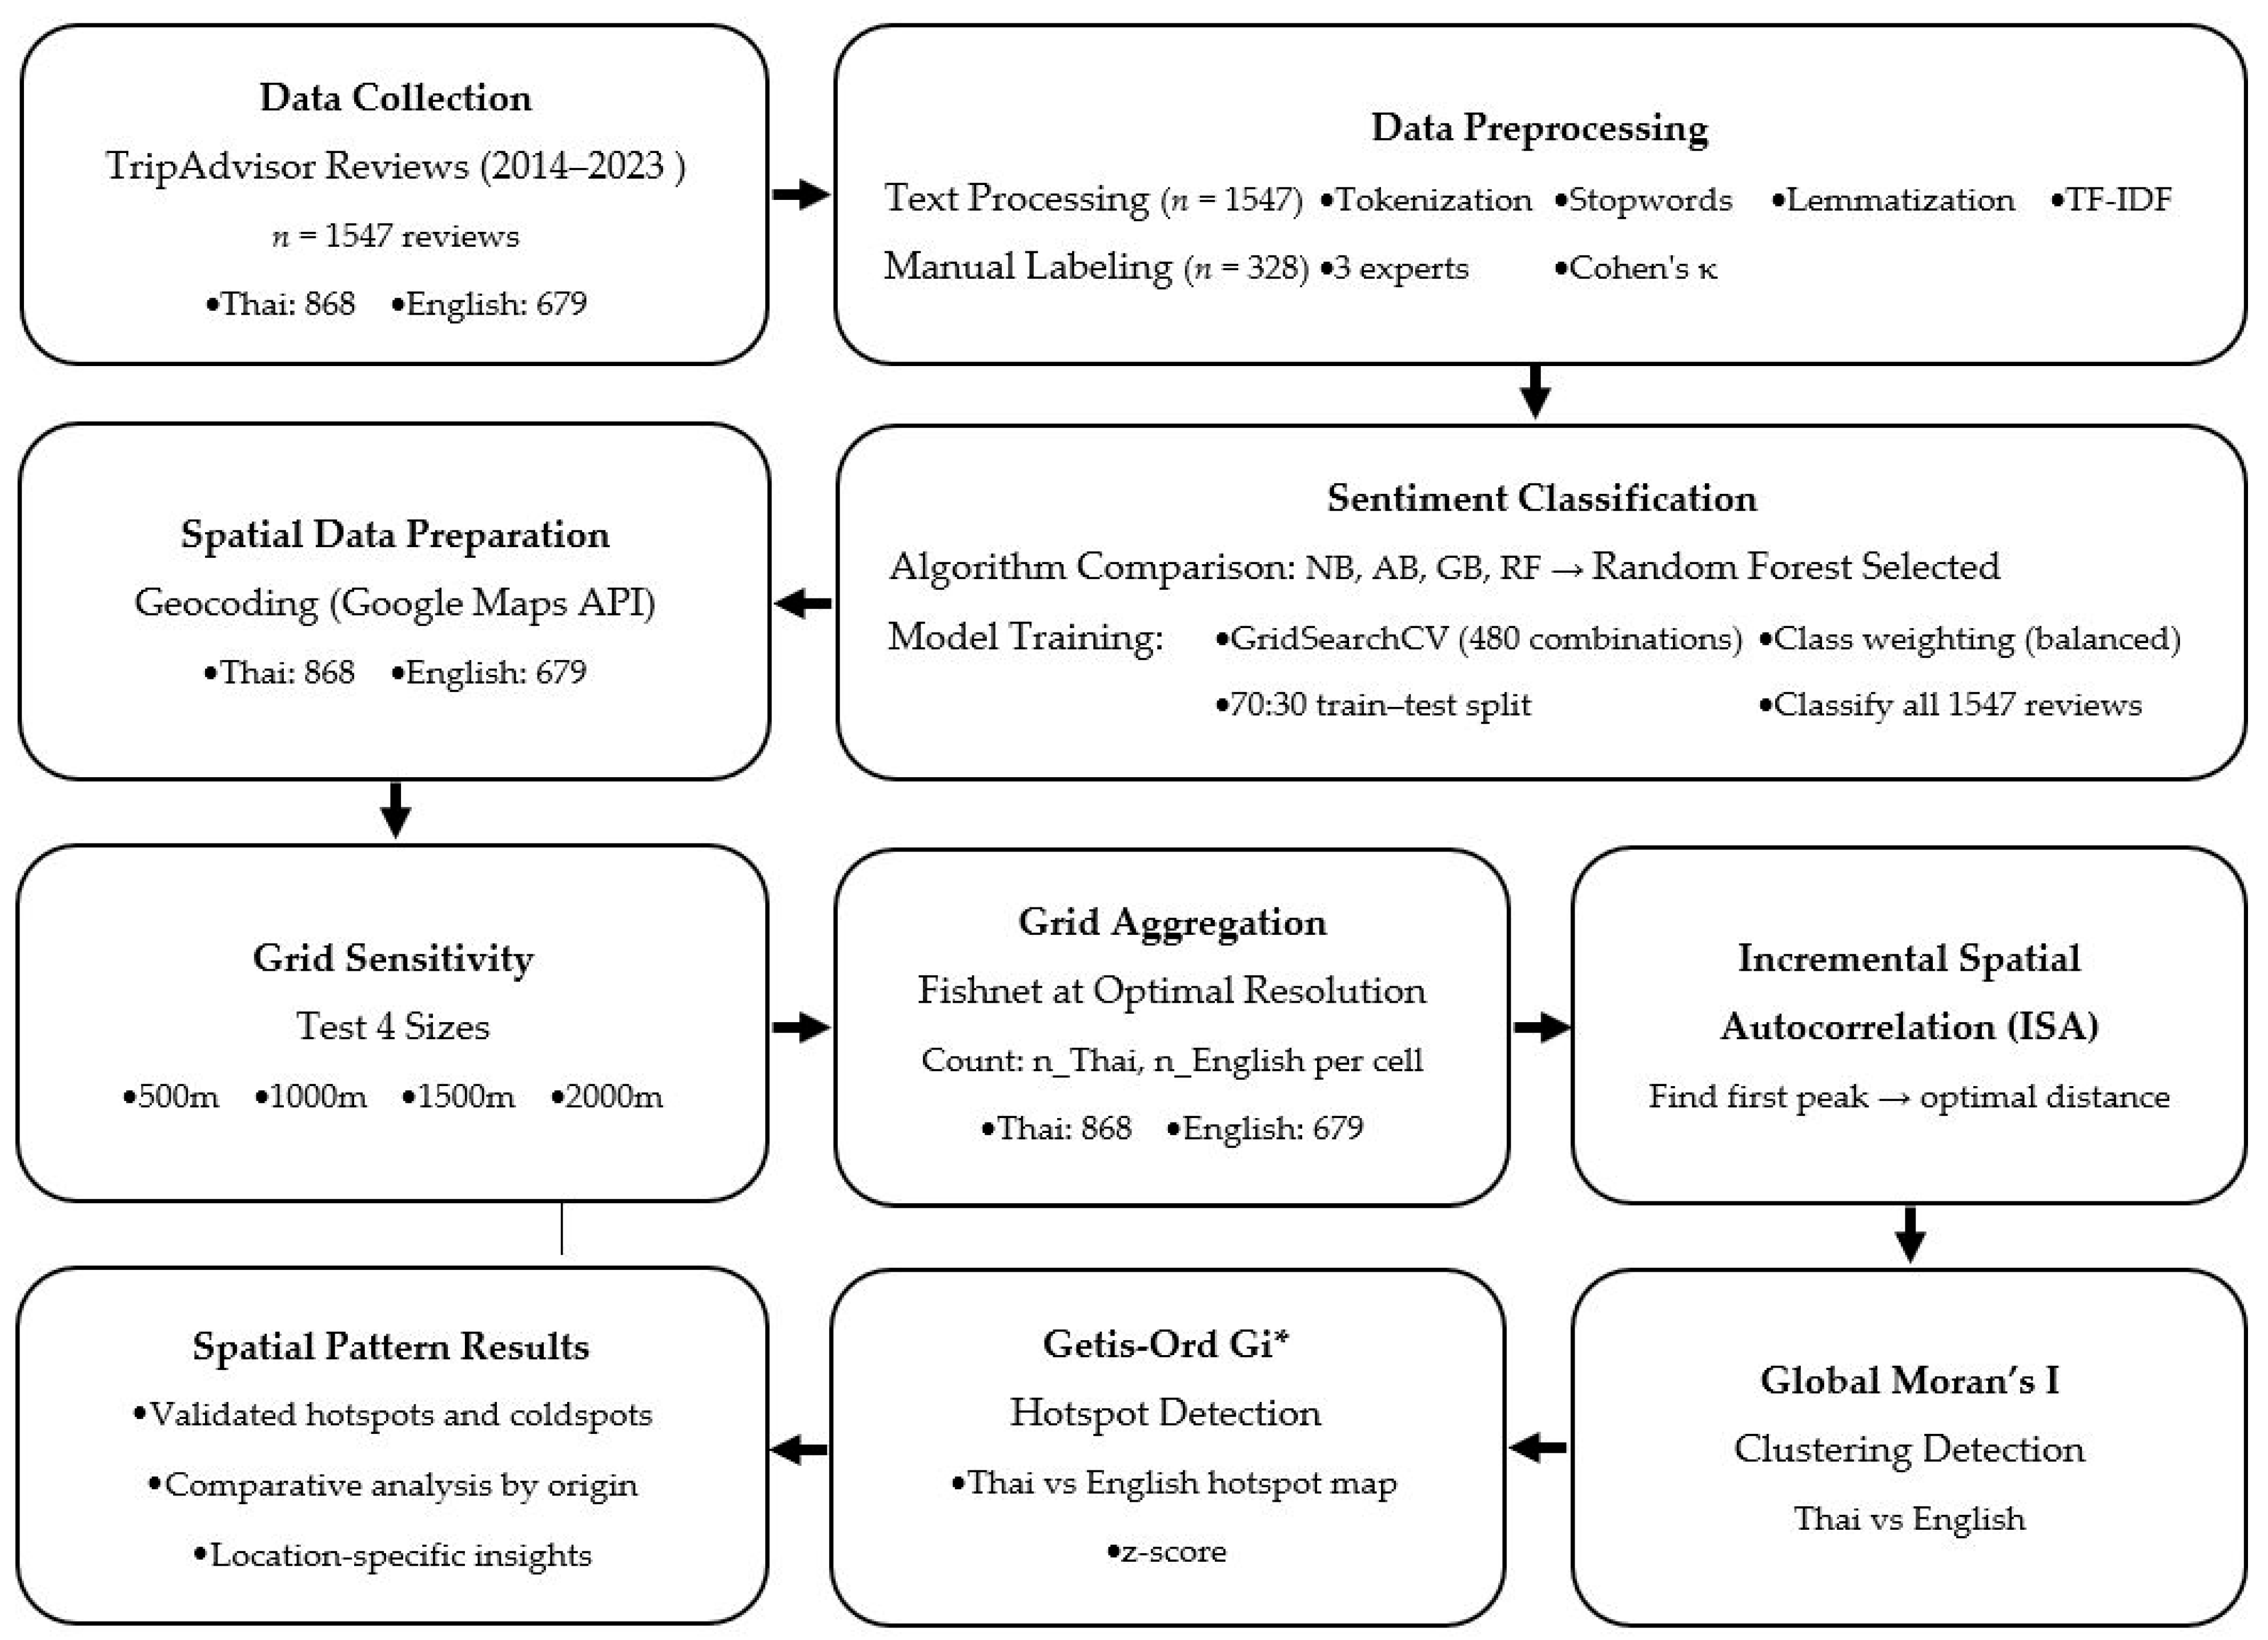
Figure 2 summarizes our complete methodology from data collection to spatial analysis.
Figure 2.
Methodology framework: data collection (n = 1547), preprocessing and labeling (n = 328), Random Forest classification, grid sensitivity testing (4 sizes), grid aggregation, and spatial statistical analysis (ISA, Moran’s I, Gi*) for identifying clustering patterns and hotspots.
3. Results
Classification achieved high accuracy for visitor segmentation, spatial analysis revealed distinct clustering patterns between domestic and international tourists, and discussion addresses implications for theory and practice.
3.1. Number of Reviews
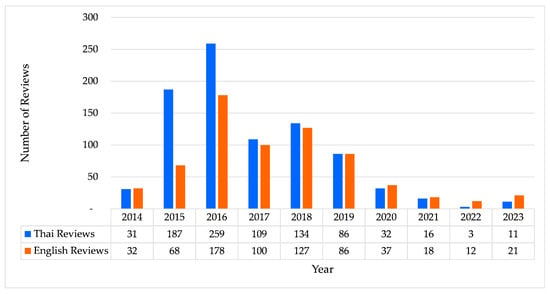
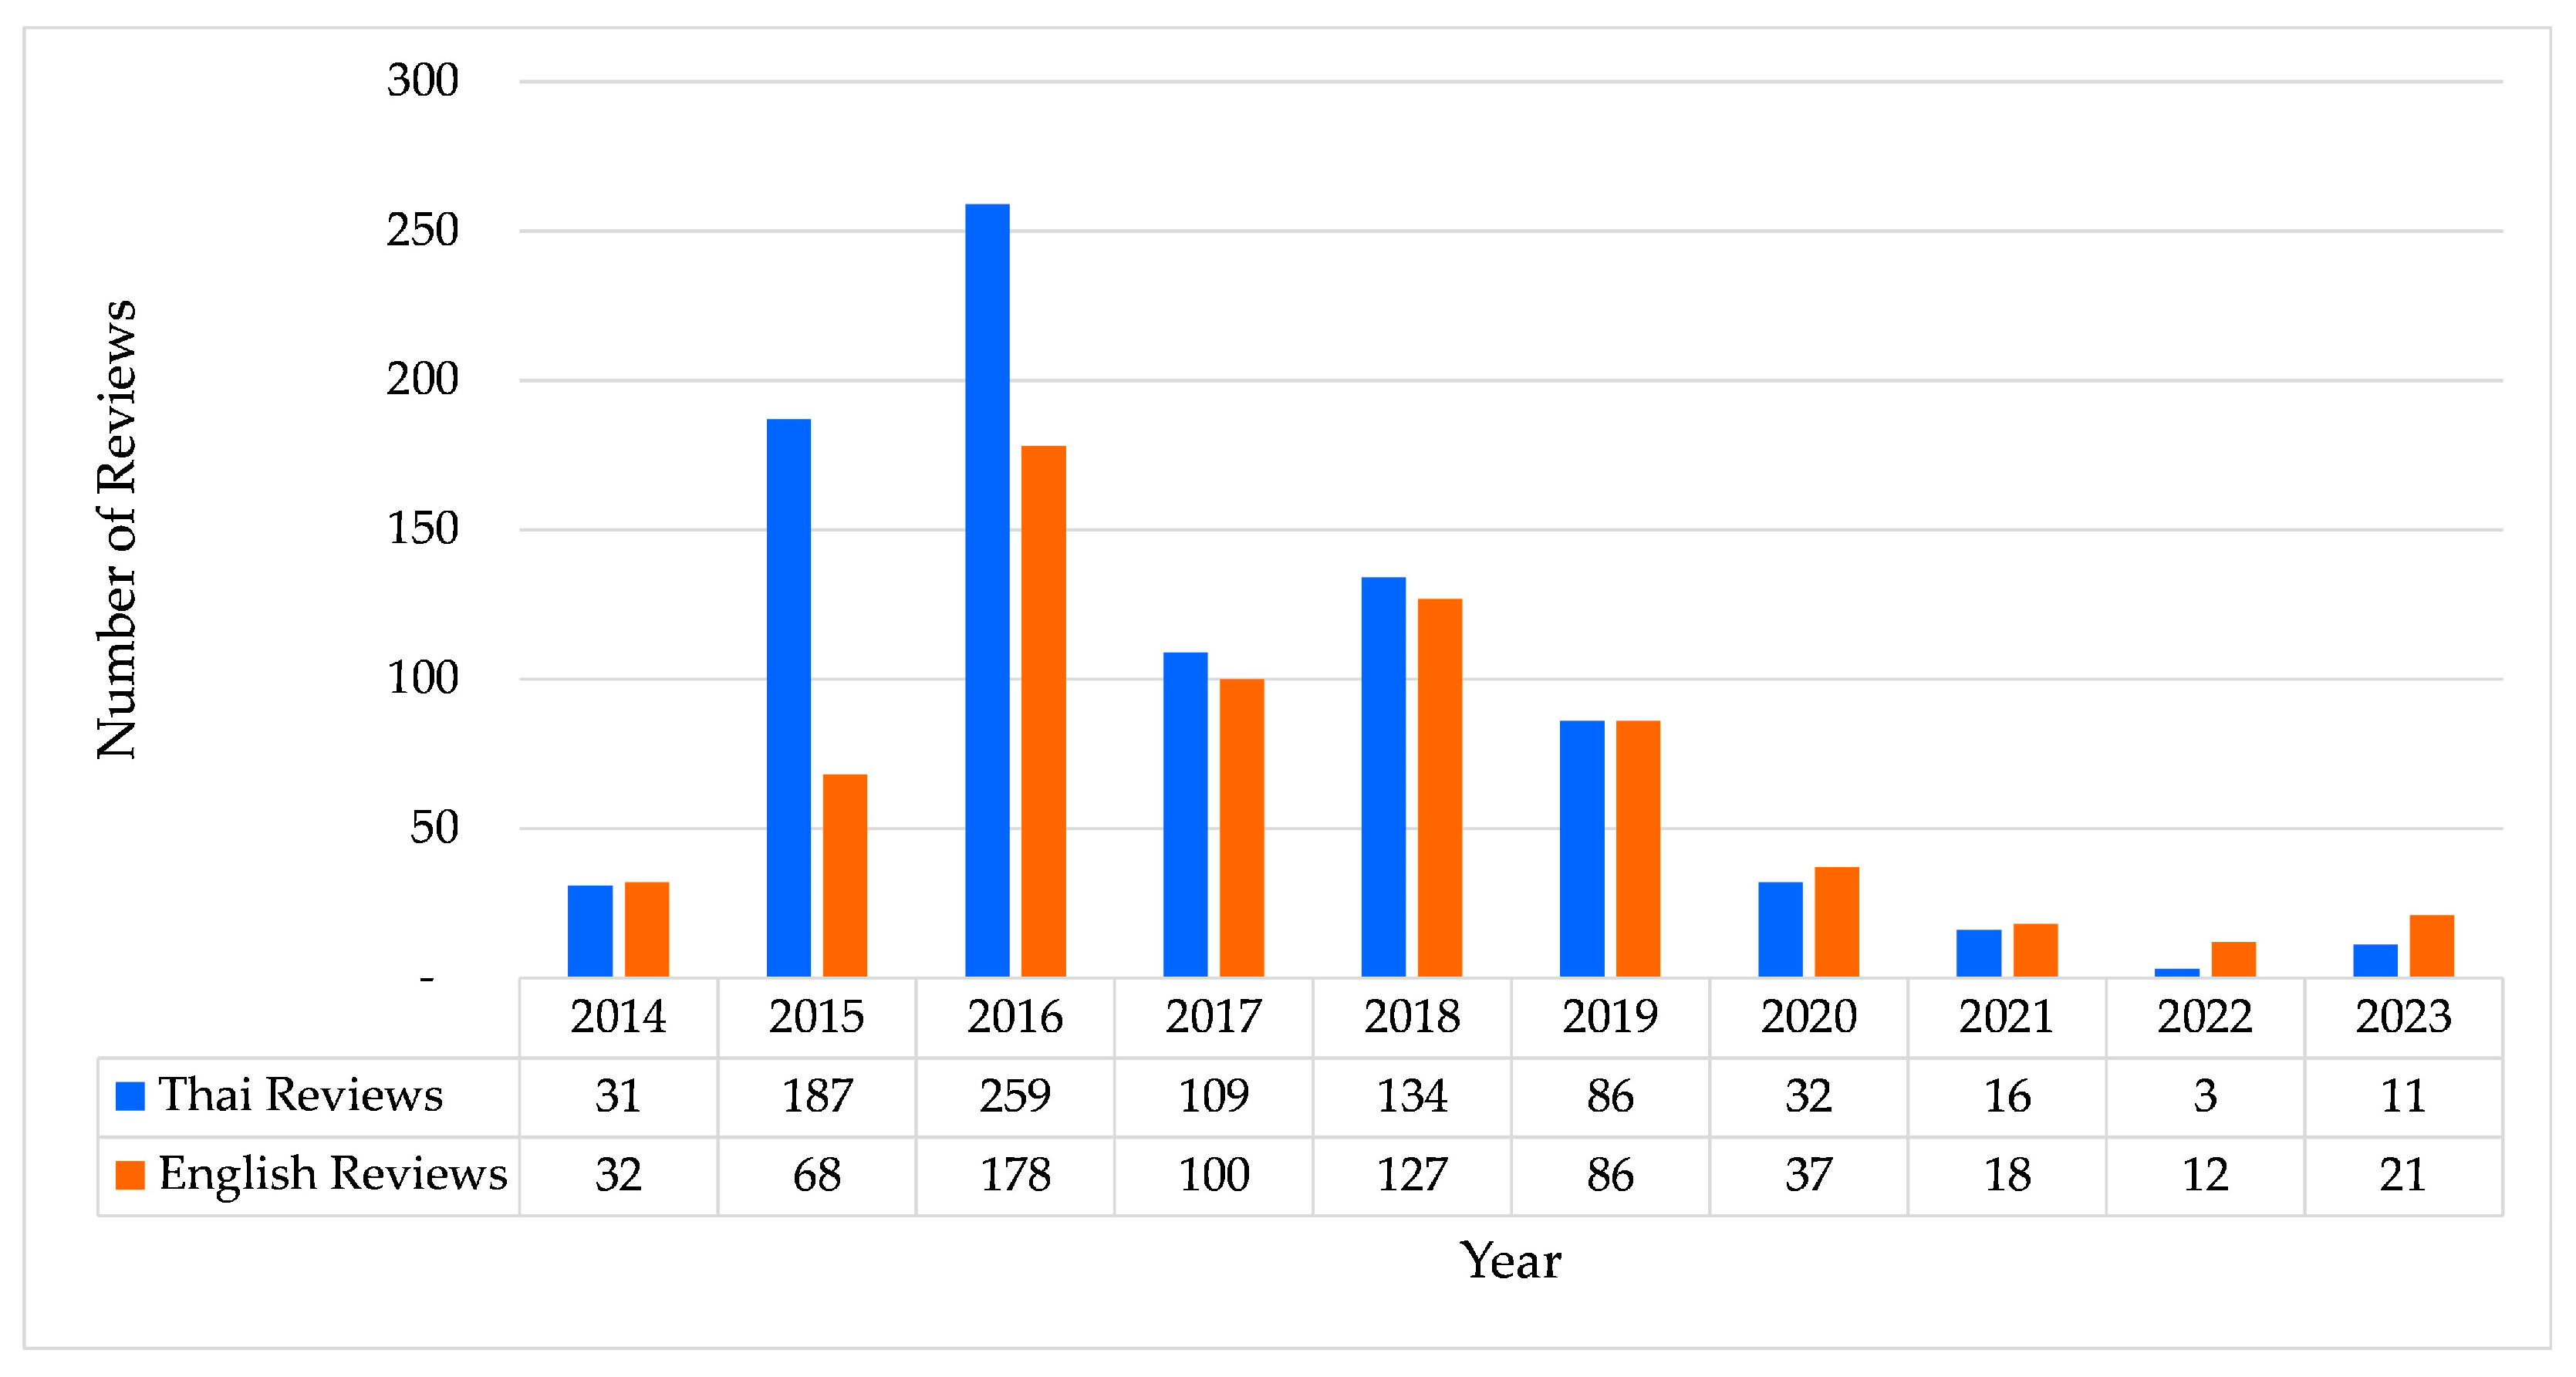
Our dataset comprises 1547 TripAdvisor reviews concerning Chanthaburi Province across 2014–2023. Thai-language reviews constitute 56.11% (n = 868), while English-language reviews constitute 43.89% (n = 679). These language groups serve as proxies for domestic and international visitor segments, respectively, in subsequent spatial analysis. Figure 3 illustrates temporal distribution across the decade.
Figure 3.
Temporal distribution of TripAdvisor reviews (2014–2023, n = 1547). Thai- (n = 868, 56.11%) and English-language reviews (n = 679, 43.89%) peak in 2016 and decline post-2018, with the sharpest drop from 2020 attributed to COVID-19 disruptions.
Review volume peaked sharply in 2016 with 437 submissions and then declined substantially after 2018, reaching a nadir of 15 reviews in 2022 (Figure 3). The sharpest decline occurred from 2020 onward, coinciding with the COVID-19 pandemic period. While review volumes recovered partially after 2022, the dataset captures primarily pre-pandemic spatial patterns given the concentration of reviews in earlier years. The 56:44 Thai-to-English ratio reflects the bilingual composition of the dataset. This study’s spatial analysis aggregates reviews across the full 2014–2023 period to capture overall spatial patterns rather than track temporal evolution.
3.2. Sentiment Analysis Using Random Forest
After selecting Random Forest through algorithm comparison, we classified all 1547 reviews by sentiment. Table 3 shows the performance metrics for both languages.
Table 3.
Classification performance metrics for Thai (test set n = 187) and English (test set n = 141) reviews.
English-language classification outperformed Thai-language classification across all metrics (Table 3). Macro F1-scores diverged by 25 percentage points (English: 86.78%; Thai: 61.62%), while CSI exhibited an even larger gap (77.81% versus 48.82%). Both models maintained comparable false alarm rates (Thai: 16.07%; English: 15.52%). Class imbalance was more pronounced in Thai-language data, with positive:neutral:negative ratios of 15.7:4.1:1 (141:37:9 samples) compared to 42.3:3.7:1 (127:11:3) for English.
Thai-language classification performance varied across sentiment classes (Table 4). Positive reviews achieved 88.65% recall (125/141) with confidence intervals of 82.27–93.62%. Neutral classification reached 64.86% recall (24/37), with 10 instances misclassified as positive. Negative sentiment reached 33.33% recall (3/9), with four instances misclassified as positive and confidence intervals of 7.49–70.07%.
Table 4.
Confusion matrix and classification performance metrics for Thai-language sentiment classification (test set, n = 187). Values in parentheses indicate row percentages.
English-language classification results are presented in Table 5. Positive recall reached 98.43% (125/127) with confidence intervals of 94.49–99.80%. Neutral classification reached 72.73% recall (8/11). Negative classification reached 100% recall (3/3) with confidence intervals of 29.24–100.00%.
Table 5.
Confusion matrix and classification performance metrics for English-language sentiment classification (test set, n = 141). Values in parentheses indicate row percentages.
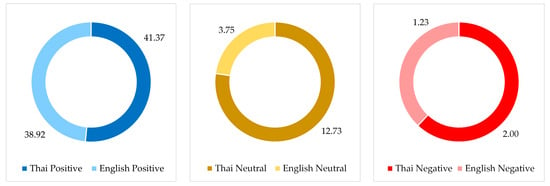
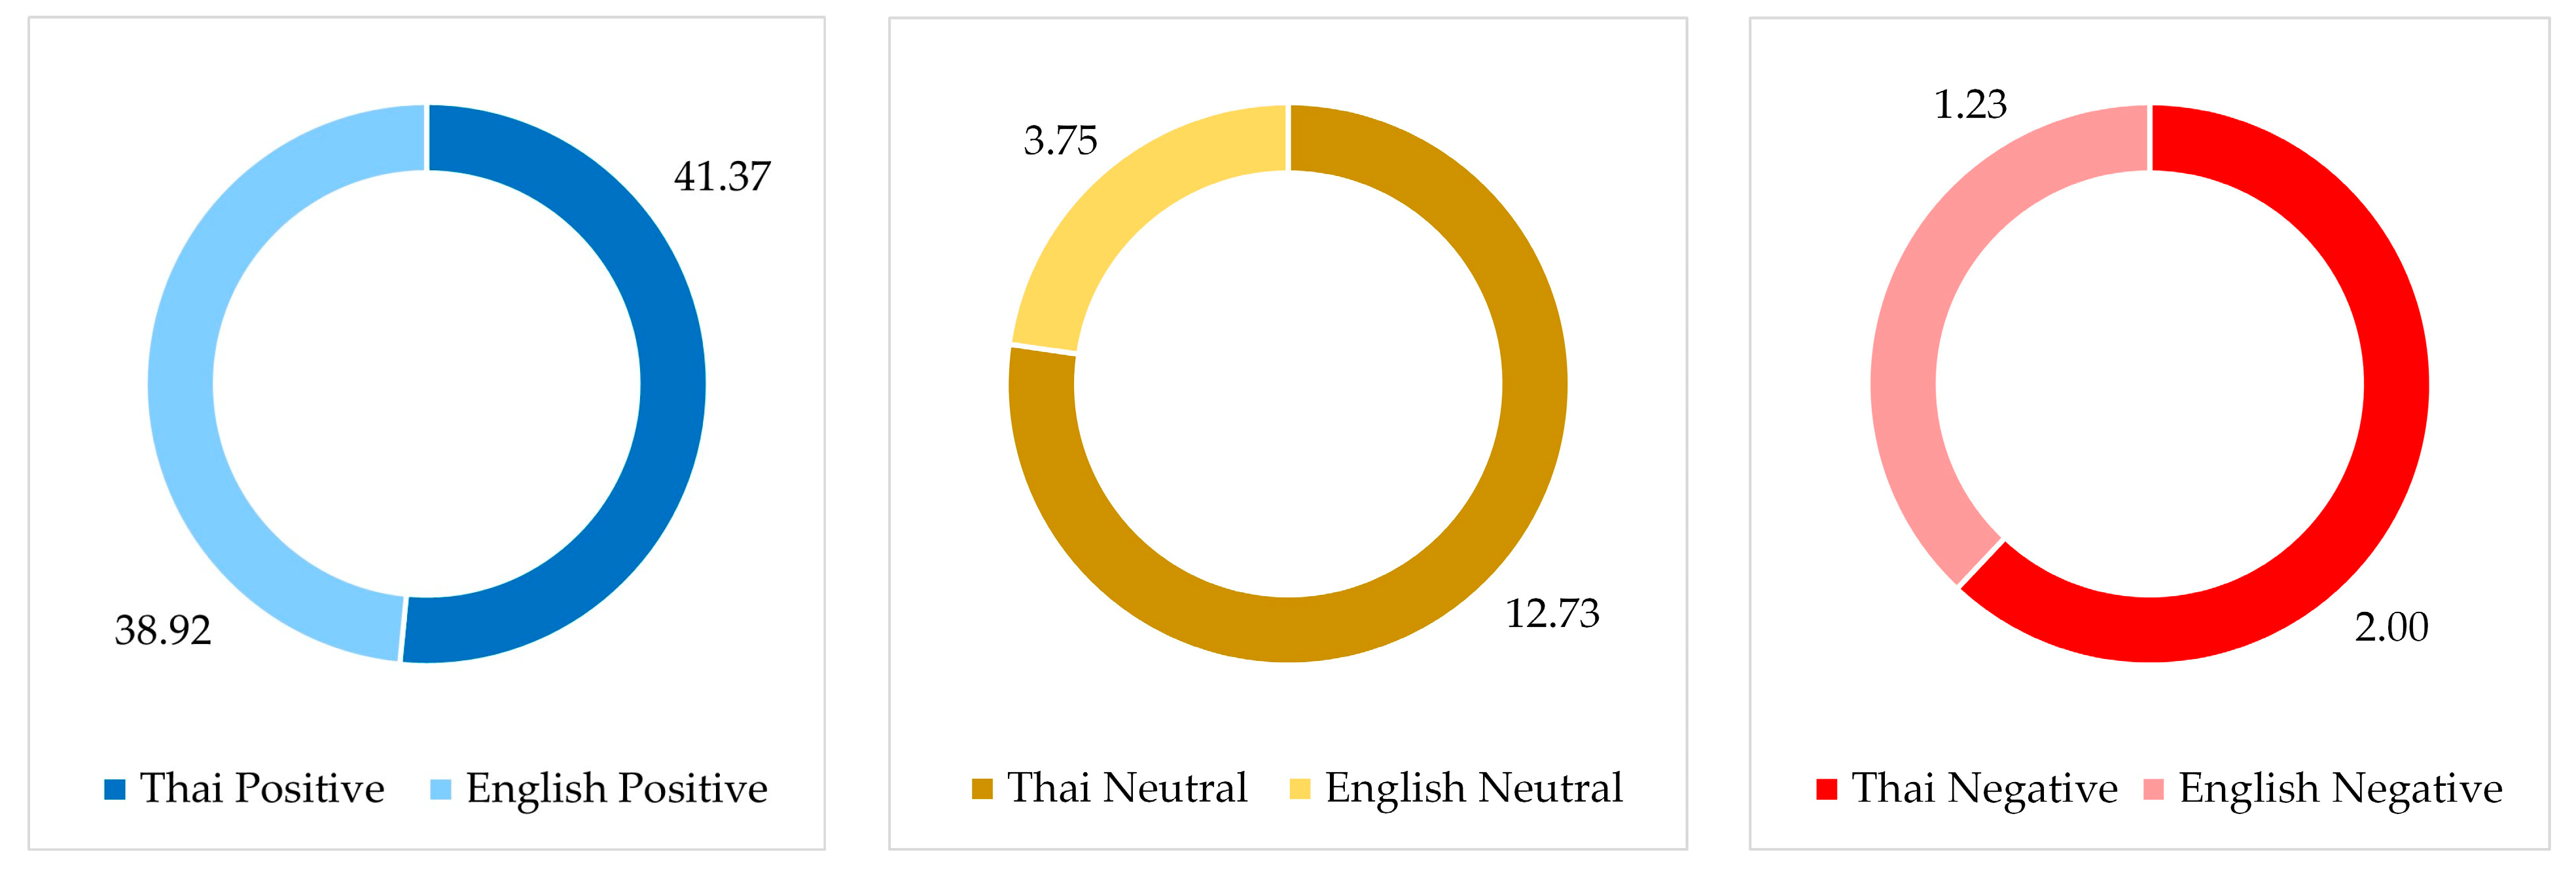
Positive sentiment dominated all 1547 classified reviews (Figure 4). Thai-language reviews comprised 640 positive (41.37%), 197 neutral (12.73%), and 31 negative (2.00%). English-language reviews comprised 602 positive (38.92%), 58 neutral (3.75%), and 19 negative (1.23%).
Figure 4.
Sentiment distribution of Thai-language (n = 868) and English-language (n = 679) reviews across 1547 classified TripAdvisor reviews. Both groups show strong positive bias typical of tourism platforms, with negative sentiment below 4% of total.
Final classification accuracy reached 83.26% for Thai-language and 96.45% for English-language reviews. These results establish two language-based visitor segments for subsequent spatial analysis: 868 Thai-language reviews representing domestic visitors and 679 English-language reviews representing international visitors.
These classification results establish two language-based visitor segments for spatial analysis: 868 Thai-language reviews representing domestic visitors and 679 English-language reviews representing international visitors.
3.3. Clustering Patterns of Thai and International Tourists
Spatial analysis reveals whether domestic and international visitor segments exhibit distinct clustering patterns and where concentrations occur. Three methods operate sequentially: ISA determined optimal distance bands, Global Moran’s I quantified clustering intensity, and Getis-Ord Gi* identified specific hotspot zones.
3.3.1. Incremental Spatial Autocorrelation (ISA)
ISA tested clustering patterns across four grid resolutions. The 500 m and 1000 m grids exhibited high initial z-scores (Thai-language: z = 50.57 at 500 m; English-language: z = 42.78 at 799 m) but monotonic decay without identifiable peaks, with 26,304 and 6725 cells, respectively, most containing zero or one review.
Clear peaks emerged at 1500 m resolution, with both language groups peaking at 2928 m (Thai: z = 15.50, I = 0.117; English: z = 21.29, I = 0.153). English-language reviews showed 31% stronger autocorrelation at this resolution (I = 0.153 versus 0.117). The 2000 m grid produced peaks at substantially longer distances (16,045 m) with weaker Moran’s I values (Thai-language: 0.016; English-language: 0.018), an 85% reduction from 1500 m resolution. All grid configurations exhibited strong statistical significance (p < 0.001).
The 1500 m × 1500 m resolution was selected based on three criteria: (1) identifiable first peaks rather than monotonic decay, (2) sufficient non-empty cells for statistical stability (72%), and (3) preservation of spatial heterogeneity absent at coarser resolutions. The 2928 m distance band identified through ISA was carried forward as the neighborhood threshold for Global Moran’s I and Getis-Ord Gi* analyses.
3.3.2. Global Moran’s I: Testing Overall Clustering
Global Moran’s I results for both language groups are presented in Table 6. Thai-language reviews exhibited I = 0.213 (z = 18.61, p < 0.001, variance = 0.000132); English-language reviews exhibited I = 0.253 (z = 23.26, p < 0.001, variance = 0.000119). Both values exceed the expected value under spatial randomness (I = −0.000328), with z-scores surpassing the 2.58 threshold for 99% confidence. Spatial weights were computed using inverse distance within the 1500.15 m threshold derived from ISA. English-language reviews clustered 19% more strongly than Thai-language reviews (I = 0.253 vs. 0.213). Relative to the expected value under spatial randomness, observed Moran’s I values are approximately 650 times (Thai) and 770 times (English) larger. Getis-Ord Gi* analysis was subsequently applied to identify specific geographic concentration zones for each segment.
Table 6.
Global Moran’s I results for Thai and English reviews at 1500 m grid resolution.
3.3.3. Getis-Ord Gi* Hotspot Analysis
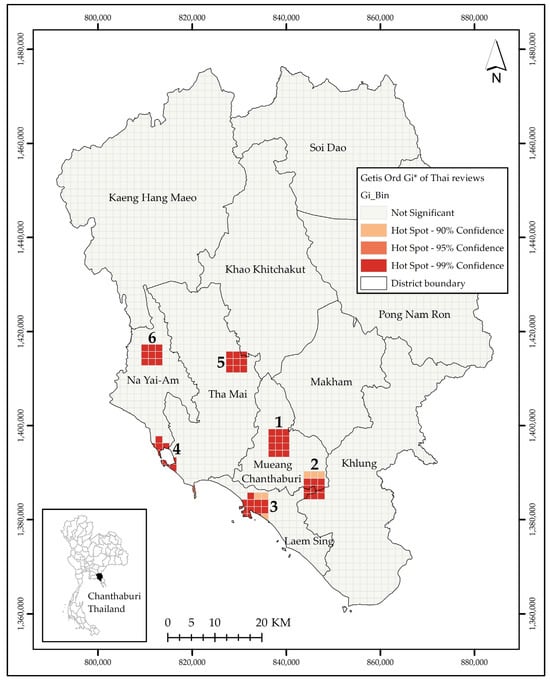
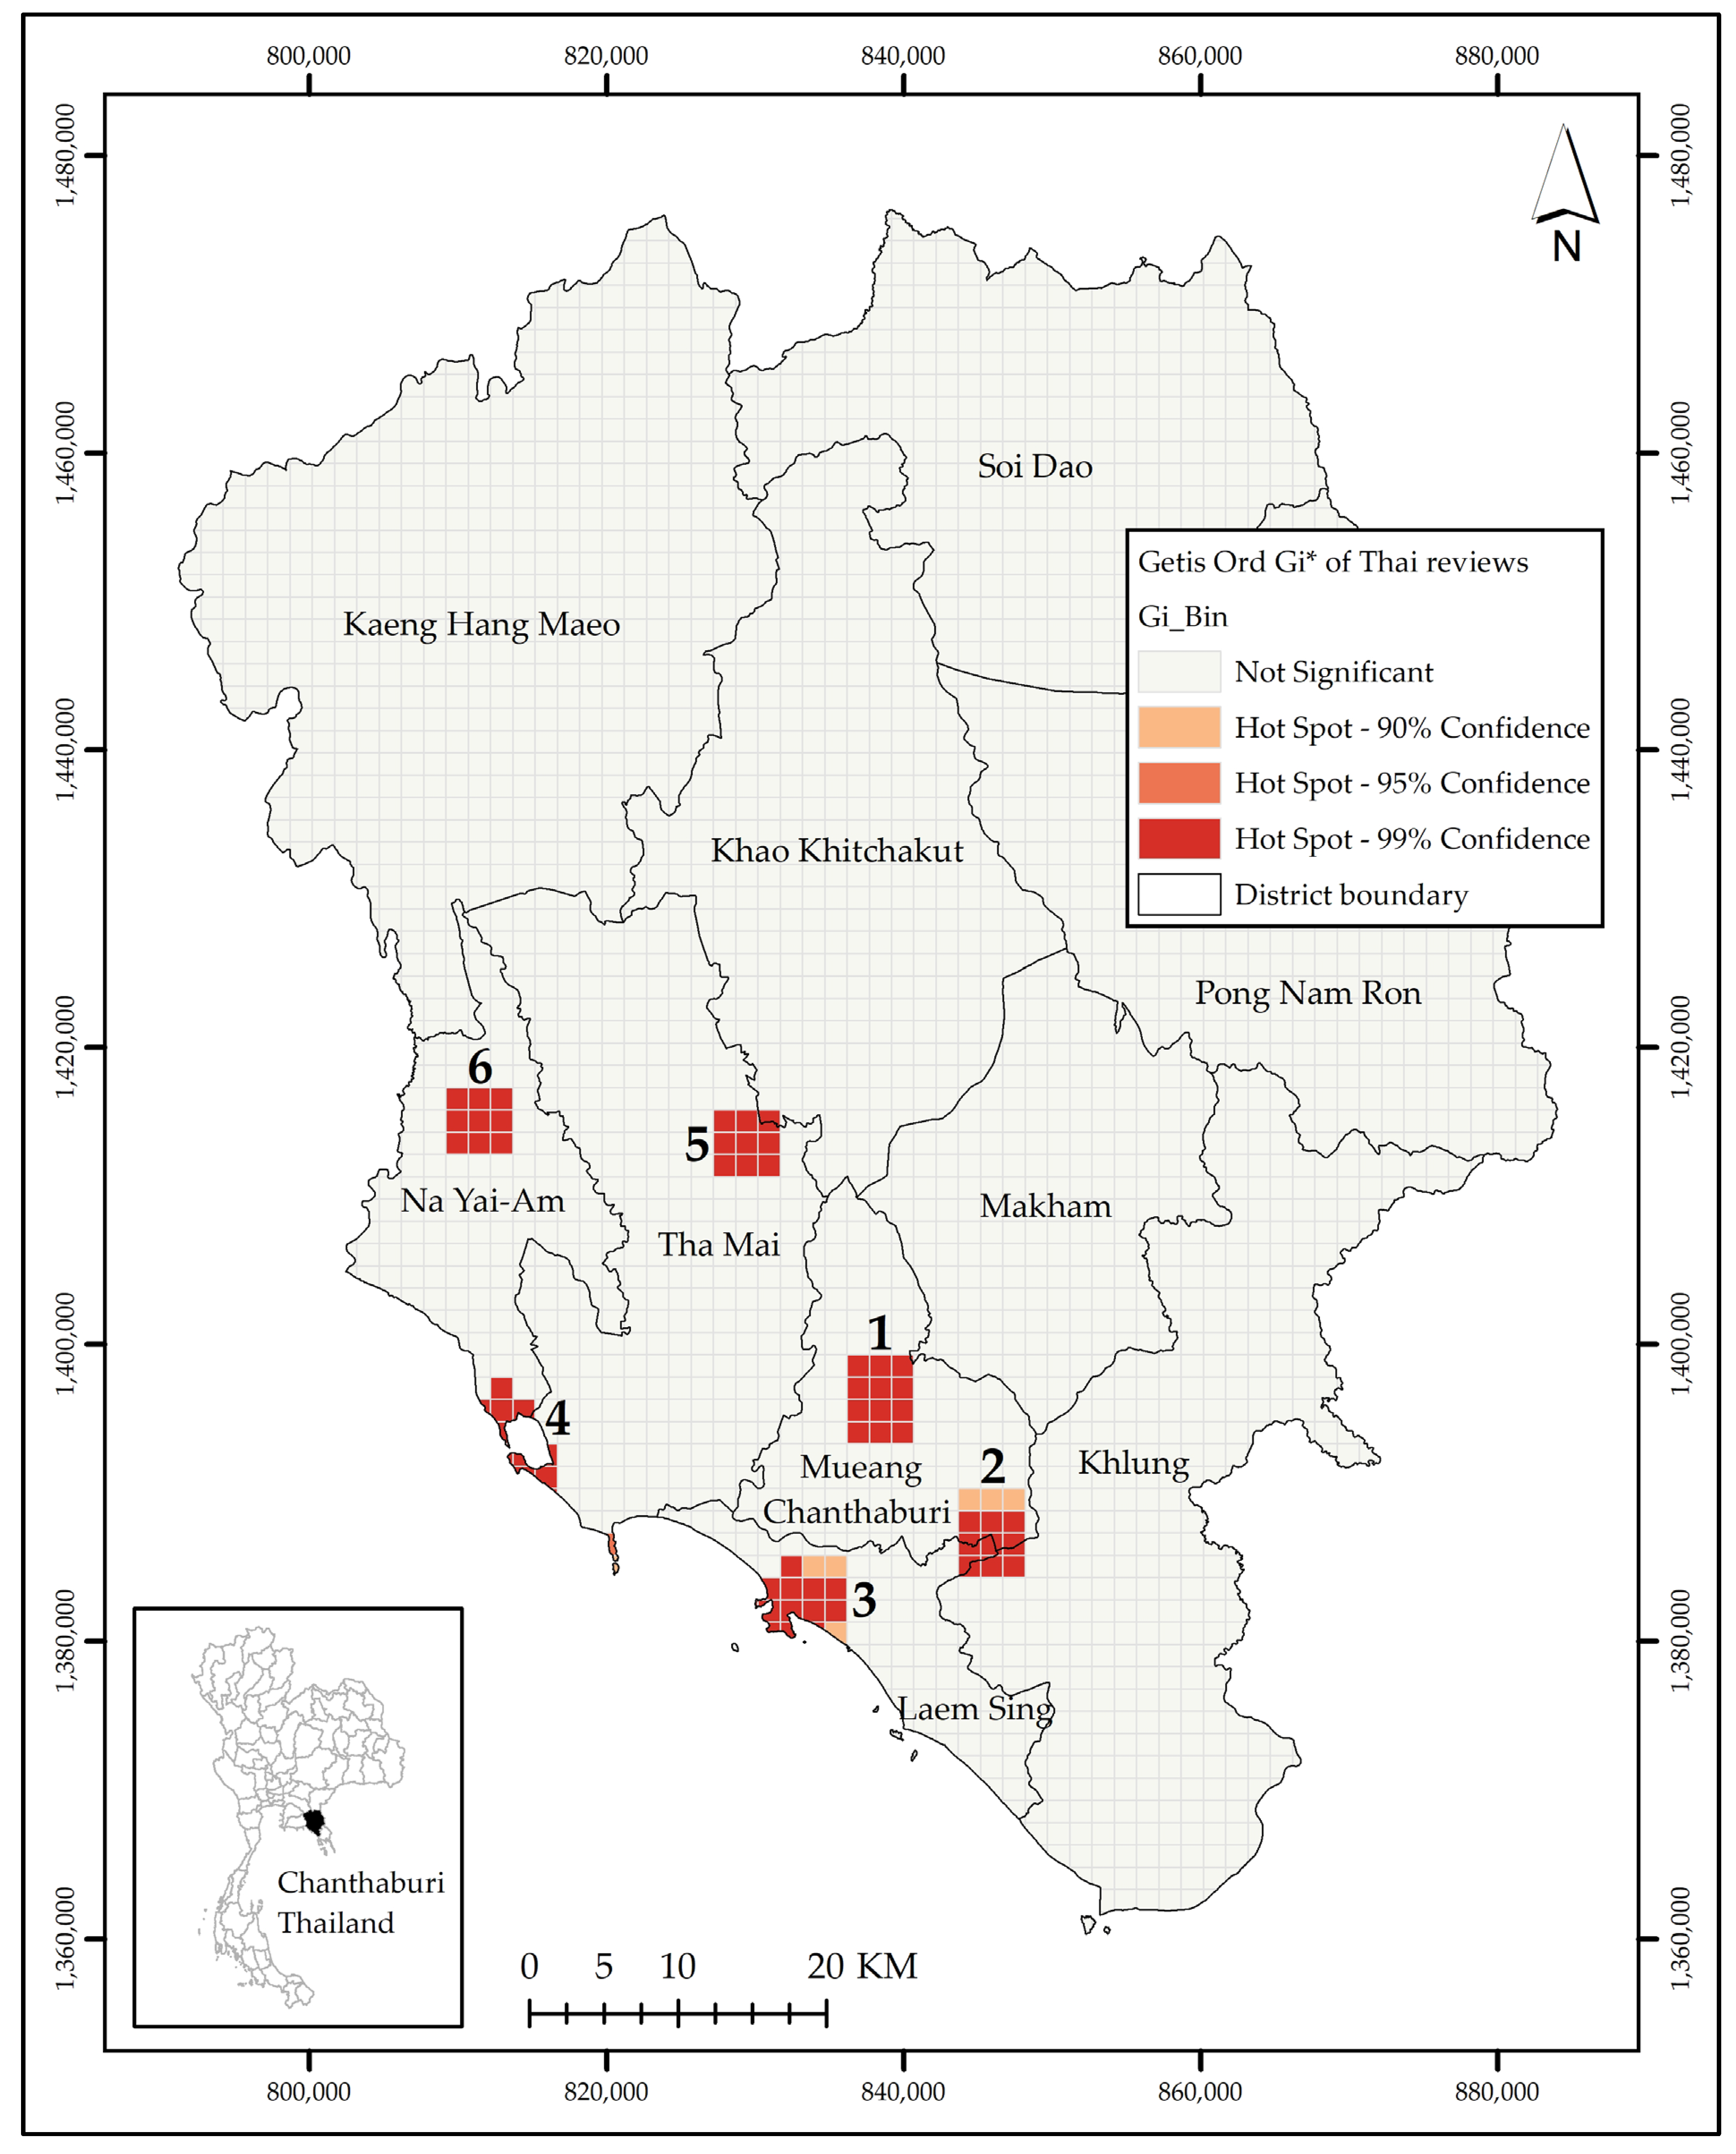
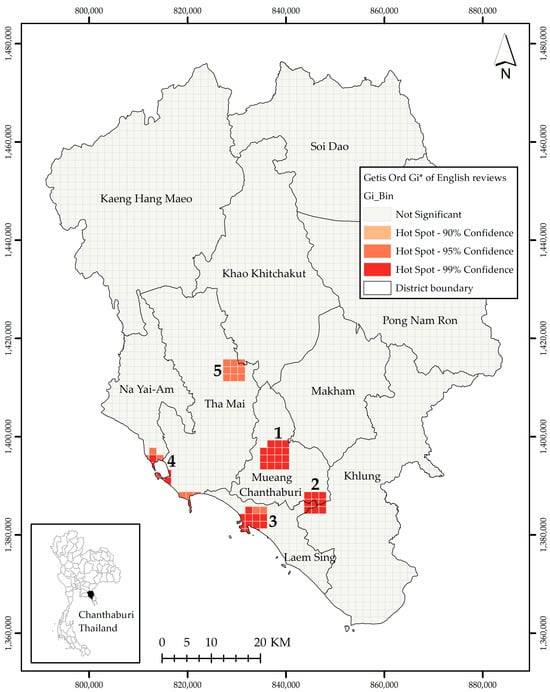
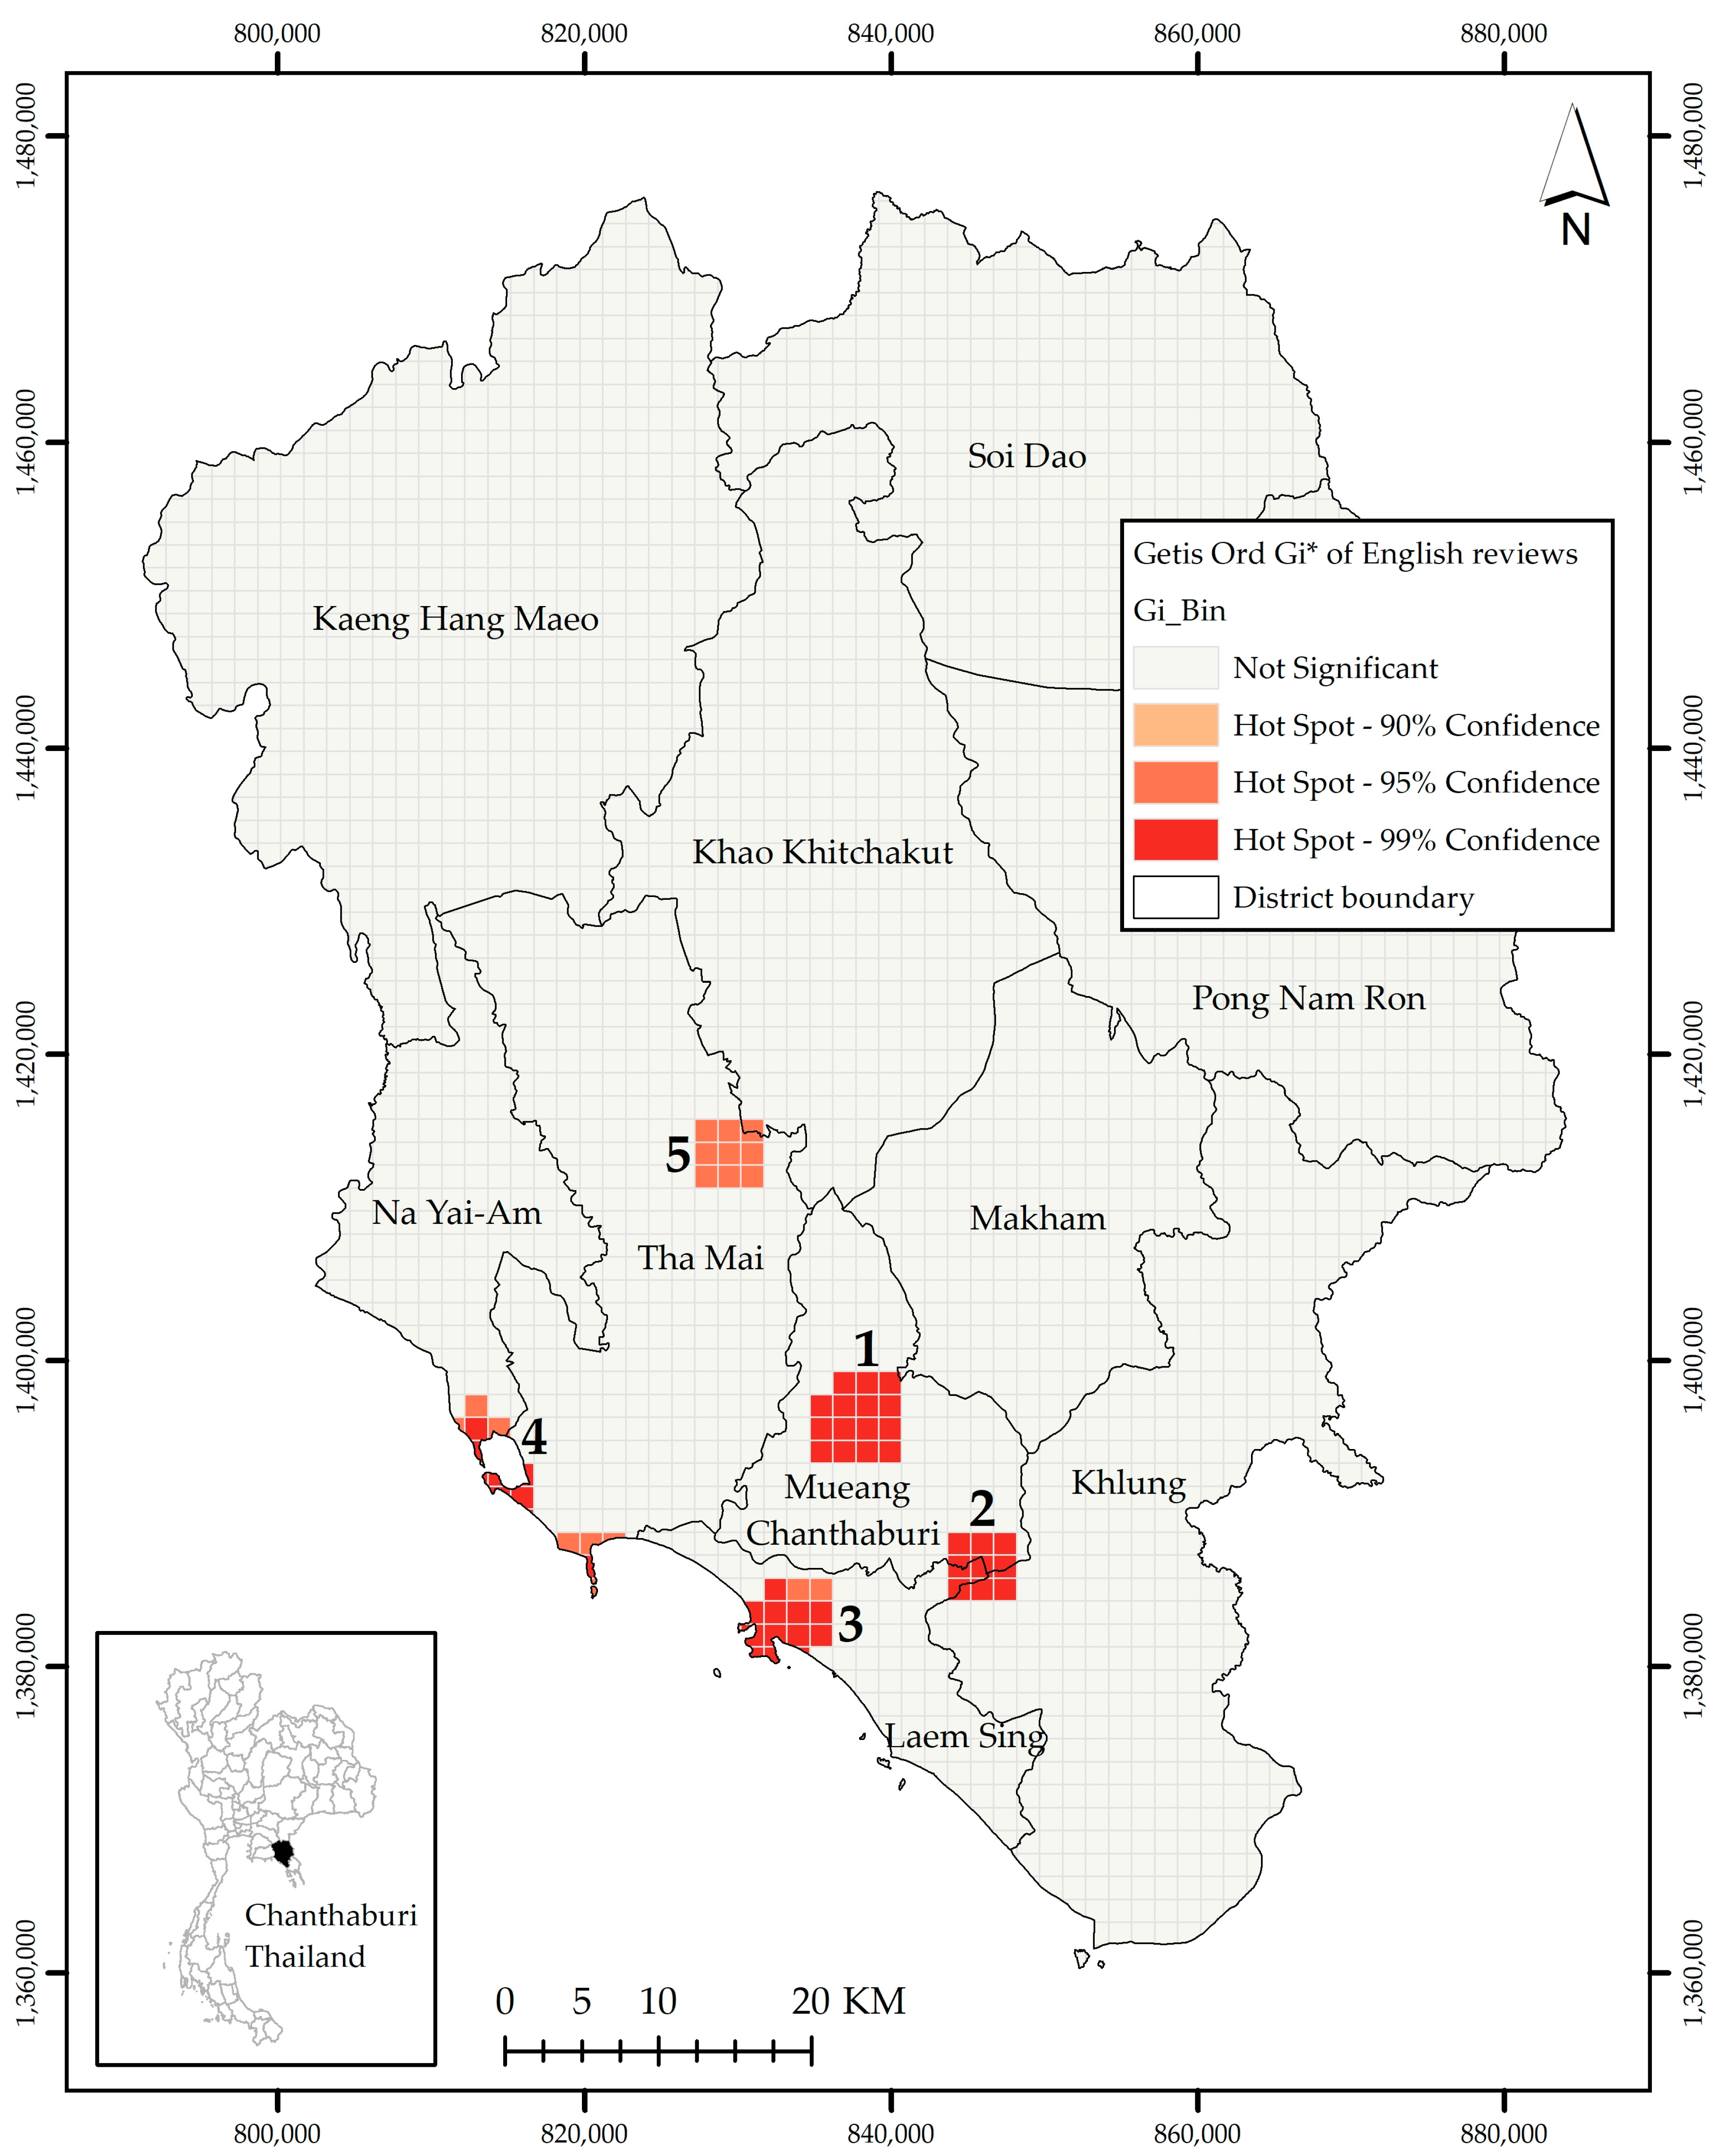
Six tourism zones emerged from the analysis based on geographic proximity and thematic character (Figure 5 and Figure 6): Zone 1 (Mueang Cultural Heritage Corridor), Zone 2 (Phlio Nature-Temple Zone), Zone 3 (Eastern Heritage Coast), Zone 4 (Southern Beach Corridor), Zone 5 (Khao Sukim Mountain Temple), and Zone 6 (Foresta Agrotourism Area).
Figure 5.
Getis-Ord Gi* hotspot analysis of Thai-language reviews (n = 868). Zone numbers indicate tourism zones: 1 = Mueang Cultural Heritage Corridor, 2 = Phlio Nature-Temple Zone, 3 = Eastern Heritage Coast, 4 = Southern Beach Corridor, 5 = Khao Sukim Mountain Temple, 6 = Foresta Agrotourism Area. Strong hotspots (99% confidence) in Zones 1, 2, 4, and 5; moderate-to-strong clustering (95–99%) in Zones 3 and 6. Gray areas indicate no significant clustering (|z| < 1.96). Zone 6 clusters domestically but shows no international equivalent (cf. Figure 6).
Figure 6.
Getis-Ord Gi* hotspot analysis of English-language reviews (n = 679). Zone numbers follow the same designation as Figure 5. Strong hotspots (99% confidence) in Zones 1, 2, and 3; moderate-to-strong clustering (95–99%) in Zone 4; moderate clustering (95%) in Zone 5. No significant clustering in Zone 6, in contrast to the domestic pattern in Figure 5. Gray areas indicate no significant clustering (|z| < 1.96).
Thai-language reviews exhibited statistically significant hotspots across all six zones (Figure 5). Zone 1 showed the strongest clustering (99% confidence; z = 21.92) around the Cathedral of the Immaculate Conception, Chantaboon Waterfront, and the gems market. Zone 2 showed strong clustering at Namtok Phlio National Park (99% confidence). Zone 3 showed moderate-to-strong clustering at Laem Sing heritage sites (95–99% confidence), with most grid cells exceeding the 99% threshold (z > 2.58) while boundary cells remained non-significant. Zone 4 exhibited strong clustering across all grid cells (99% confidence; z = 5.30–6.95, p < 0.01). Zone 5 registered strong clustering at Wat Khao Sukim (99% confidence; z = 2.99). Zone 6 registered moderate clustering at Foresta agrotourism sites (95–99% confidence).
English-language reviews exhibited statistically significant hotspots across five zones (Figure 6). Zone 1 showed the strongest clustering (99% confidence; z = 17.76) at the Cathedral and Chantaboon Waterfront Community. Zone 2 produced strong clustering at Namtok Phlio National Park (99% confidence; z = 6.13–6.61). Zone 3 showed strong clustering at coastal heritage sites (99% confidence; z > 2.58). Zone 4 showed moderate-to-strong clustering at Chao Lao and Kung Wiman beaches (95–99% confidence), with most grid cells exceeding the 99% threshold while boundary cells reached 95% confidence. Zone 5 reached moderate clustering at Wat Khao Sukim (95% confidence; z = 2.07, p = 0.038). Zone 6 showed no statistically significant clustering.
Cross-segment comparison reveals zone-level overlap and divergence between visitor segments (Table 7). Both segments clustered strongly in Zone 1 (99% confidence), with Thai-language reviews reaching marginally higher peak intensity (z = 21.92 vs. 17.76). Zone 2 drew strong clustering from both segments (99% confidence). Zone 3 clustered strongly for both groups, with English-language reviews slightly stronger (99% vs. 95–99%). Zone 4 attracted both segments: Thai at 99% confidence (z = 5.30–6.95), English at 95–99%. Zone 5 showed stronger domestic clustering (99%; z = 2.99) than international (95%; z = 2.07). Zone 6 clustered only for Thai-language reviews (95–99% confidence), with no significant clustering for English-language reviews.
Table 7.
Getis-Ord Gi* hotspot clustering comparison between domestic (Thai-language) and international (English-language) visitor segments across six tourism zones in Chanthaburi Province.
4. Discussion
The results reveal systematic geographic differentiation between domestic and international visitor segments that aggregate province-wide metrics would not capture. The following sections interpret these patterns against prior research, examine their methodological and theoretical significance, and draw out practical implications for destination management.
4.1. Visitor Segmentation and Classification Performance
Review volume peaked in 2016 and declined substantially after 2018, with the sharpest drop from 2020 attributable to COVID-19 disruption, a pattern documented across tourism platforms worldwide during this period [41]. Beyond pandemic effects, two platform-level trends likely contributed to the sustained decline: tourists increasingly favor alternatives such as Google Maps and Instagram over traditional review platforms [42], and TripAdvisor’s intensified review filtering protocols may have excluded legitimate submissions. The 56:44 Thai-to-English ratio reflects typical review behavior wherein domestic tourists generate higher volumes due to greater familiarity and visit frequency [43]. Positive sentiment dominated both language groups, consistent with tourism platforms’ well-documented positive skew as visitors share favorable experiences more readily than unfavorable ones [44]. Small negative sample sizes—31 Thai and 19 English from 1547 total reviews, under 4% combined—preclude sentiment-specific spatial analysis. Spatial statistics therefore operate on language-based segments aggregating all sentiment categories, locating where segments go rather than where satisfaction varies. Analyzing positive versus negative spatial patterns separately remains outside this study’s scope and constitutes a direction for future work.
Random Forest classification achieved 83.26% accuracy for Thai-language and 96.45% for English-language reviews, establishing reliable language-based segments for spatial analysis. The 13-point performance differential reflects structural differences between the two datasets rather than algorithmic limitations. Thai text lacks explicit word boundaries, necessitating specialized tokenization that introduces segmentation errors absent from space-delimited English [45], and Thai-language training data exhibited more severe class imbalance: positive:neutral:negative ratios of 15.7:4.1:1 versus 42.3:3.7:1 for English. Training on only nine negative Thai examples within a 5000-feature TF-IDF space creates curse-of-dimensionality conditions in which the feature space is too sparse for reliable minority class learning [46,47]. Such 10–20% performance gaps between English and morphologically complex languages recur consistently across multilingual sentiment studies [48], and the Thai result falls within this expected range.
Neutral classification proved challenging for both languages, with misclassification toward positive—an expected outcome given neutral content’s weak emotional markers [49,50]. Negative sentiment detection was weakest for Thai (33.33% recall), with wide bootstrap confidence intervals (7.49–70.07%) reflecting fundamental sample size constraints. The 25-point macro F1 differential between languages stems primarily from Thai’s severe class imbalance rather than algorithmic limitations [51]. English reviews exhibited greater length and lexical diversity, providing richer contextual signals that further contributed to the performance gap [52]. These results confirm Random Forest’s effectiveness for bilingual sentiment classification, consistent with prior research demonstrating ensemble methods’ superiority over simpler classifiers [53]. Recent deep learning techniques show promise for Thai sentiment analysis [54,55], and character-level models or pre-trained Thai embeddings may reduce the performance gap in future work.
Despite these performance constraints, the 83.26% accuracy falls within the range reported for Random Forest-based multilingual classification in tourism contexts [53]. The segmentation purpose of this study—identifying language groups rather than fine-grained sentiment—places a lower bar on classification precision than studies requiring accurate negative detection. A misclassified review still contributes to the correct language-based spatial segment, since language identification is determined prior to sentiment classification rather than derived from it. Only reviews misidentified as belonging to the wrong language group would introduce segmentation error, and such cases are unlikely given TripAdvisor’s language-tagged review structure.
Using review language as a proxy for visitor origin is a pragmatic approach with established precedent in tourism analytics, but its limitations merit explicit consideration. Language-based segmentation cannot verify nationality the way passport-based registration or IP geo-location can: an expatriate writing Thai-language reviews would be classified as domestic, and a Thai national writing in English would appear international. Such edge cases are likely rare in Chanthaburi, where large expatriate communities characteristic of Bangkok or Phuket are absent but cannot be entirely excluded. The approach is better understood as capturing information–environment segmentation than as a nationality classifier. Information environment may be more relevant to clustering behavior than nationality per se, since it determines which attractions visitors discover and which platforms they consult when planning itineraries. The geographic implications of this information–environment divide are examined in the following section through zone-level spatial clustering analysis.
4.2. Spatial Clustering and Destination Differentiation
ISA identified 2928 m as the optimal distance band for both visitor segments, indicating that clustering operates at approximately 3 km scales regardless of language group [56]. The 500 m and 1000 m resolutions produced monotonic decay without identifiable peaks, reflecting over-fragmentation in which most cells contained zero or one review and produced statistical noise rather than meaningful spatial structure [39]. The 2000 m resolution over-smoothed local variation, obscuring the zone-specific patterns that destination managers require [38]. The 1500 m resolution preserved spatial heterogeneity while maintaining sufficient non-empty cells (72%) for statistical stability, providing empirically justified neighborhood definitions and avoiding arbitrary threshold selection [57].
Global Moran’s I confirmed pronounced clustering for both segments (Thai I = 0.213; English I = 0.253), with both values approximately 650–770 times larger than expected under spatial randomness. English-language reviews clustered 19% more strongly than Thai-language reviews, consistent with prior research showing international tourists concentrate around well-promoted landmarks and established infrastructure [58,59]. Domestic visitors exhibited broader geographic spread, accessing secondary attractions and agricultural sites that international guidebooks typically omit [60]. These global patterns, however, understate the real distributional difference: the Moran’s I gap alone cannot reveal which zones each segment reaches, a limitation that Getis-Ord Gi* addresses directly [61].
Both segments clustered strongly at cultural heritage and nature-temple zones (Zones 1, 2, 3, 5), confirming these as cross-market draws consistent with prior research on heritage-led visitor concentration [62,63]. The domestic hierarchy at Zone 5 (99% vs. 95%) reflects the mountain temple’s stronger appeal among religious domestic tourists compared to its international profile [64]. Zone 6 clustered exclusively for Thai-language reviews, representing the sharpest segment divergence across all six zones, while Zone 4 attracted both segments strongly—a pattern examined in detail below.
Zone 4’s dual-market clustering runs counter to the prevailing treatment of beach destinations as internationally oriented products in Southeast Asian tourism research [65,66]. Thai-language reviews clustered more strongly than English-language reviews (99% vs. 95–99%), suggesting Chanthaburi’s southern beaches serve Bangkok weekenders and eastern seaboard residents as a primary market, with international visitors treating coastal areas as secondary stops on heritage-focused itineraries. This domestic-primary, international-secondary structure challenges destination competitiveness frameworks that treat beach tourism as an internationally driven product [67] and may be more common across Thailand’s secondary coastal destinations than existing literature acknowledges.
Zone 6’s domestic-only pattern reflects a structural information gap rather than product failure. Agrotourism in Chanthaburi is marketed through domestic channels—LINE groups, Thai-language travel blogs, and provincial tourism websites—that do not reach international visitors relying on TripAdvisor or English-language travel content [68,69,70,71]. Local information networks carry domestic tourists to all six zones; international guidebooks stop at Zone 5. Paolanti et al. [17] showed that sentiment–spatial integration can identify attraction-level gaps; the present study extends this to segment-level analysis, demonstrating that the gap is systematically aligned with language-based information access rather than randomly distributed.
Both segments demonstrated geographic overlap in cultural and heritage zones yet diverged in agrotourism and, to a lesser extent, in nature-temple areas. These clustering differences reflect segment-specific destination awareness and accessibility rather than satisfaction variations [72]—what the data capture is where each segment goes, not how visitors feel when they arrive [73,74]. TripAdvisor skews toward digitally active travelers [75], meaning segments relying on WeChat, LINE, or offline channels—Chinese tourists prominent among them—leave no trace in this dataset. Differential information access therefore shapes not only where tourists go but which tourists appear in platform-based spatial analyses, a constraint that future work integrating Weibo, Pantip, or Google Maps data would be well positioned to address [76].
Prior spatial tourism studies treat visitor populations as undifferentiated: García-Palomares et al. [16] and Ferreira et al. [18] identify where tourists concentrate collectively but cannot detect where segments diverge. Zone 6 illustrates the cost of aggregation; it would appear as a minor hotspot in an undifferentiated analysis, with its systematic absence from international clustering invisible. The bilingual segmentation approach surfaces this distinction directly, providing actionable intelligence that aggregate hotspot mapping cannot. These zone-level distinctions point to broader methodological contributions that extend beyond the Chanthaburi case.
4.3. Methodological Implications
This study advances tourism geography by demonstrating that combining sentiment classification with spatial statistics converts a platform-based review dataset into zone-level visitor geography that neither technique alone could produce. Three contributions stand out. First, machine learning enables language-based visitor segmentation at scale, with Random Forest providing reliable segment identification across 1547 bilingual reviews [53]. Second, systematic distance band selection through ISA establishes empirically grounded neighborhood thresholds rather than relying on arbitrary definitions, a methodological refinement with broad applicability to platform-based tourism research [57]. Third, Getis-Ord Gi* identifies zone-specific concentrations that province-wide aggregate measures routinely obscure, revealing sub-destination structure invisible to global statistics alone [77].
Standard destination competitiveness frameworks assume visitor distributions are roughly uniform across a province [67], but the zone-level patterns identified here challenge that assumption directly. Zone-specific clustering reveals segment divergence that global statistics cannot detect; domestic and international visitors follow different geographic paths within the same province, and those paths are only recoverable through sub-destination analysis. What these patterns capture is geographic distribution rather than visitor satisfaction—where segments concentrate not how they evaluate their experience [74]. This distinction matters methodologically: spatial clustering analysis complements rather than replaces sentiment analysis, and the two methods address different research questions.
The sub-destination scale at which these patterns emerge is a substantive finding in its own right. Prior spatial tourism studies operated at city or regional scales without distinguishing visitor segments, producing aggregate hotspot maps that smooth over the within-destination differentiation documented here. Secondary destinations like Chanthaburi—where infrastructure maturity does not smooth visitor distributions as it does in major cities—exhibit sharper and more actionable segment-specific clustering patterns than city-scale analysis can detect.
The analytical framework applied here—language-based segmentation combined with ISA distance band selection and Gi* hotspot mapping—is transferable to other secondary heritage destinations in Southeast Asia where bilingual review data are available. The conditions that make it workable in Chanthaburi—a clearly bounded provincial destination, a bilingual TripAdvisor presence, and spatially distinct attraction clusters—are not unusual across the region. Destinations in Vietnam, Malaysia, and Indonesia face analogous domestic–international segmentation challenges without the visitor volume of primary tourism hubs, and platform-based spatial analysis offers a lower-cost alternative to large-scale visitor surveys for identifying where segment-specific investment is most warranted [77]. Translating these methodological insights into actionable zone-level strategies is the focus of the following section.
4.4. Managerial Implications
The zone-level clustering patterns identified in this study offer a basis for more targeted destination management, though findings from exploratory spatial analysis are best treated as evidence to inform decisions rather than prescriptive directives. Each zone configuration may call for a different management response rather than a single provincial strategy applied uniformly.
Zone 1 is the clearest starting point. Both segments clustered strongly there (99% confidence), making it the province’s only proven dual-market asset across cultural heritage sites. What sustains that performance—multilingual interpretation, staff capability, visitor flow protocols—merits systematic documentation [78], since transferring those practices to lower-performing zones is likely more cost-effective than building capacity from scratch.
For Zone 4, differentiated coastal management is warranted [66]. International visitors could benefit from improved English-language services, tour operator links, and global platform visibility [79], while domestic visitors—equally present at 99% confidence—may be better served through Thai-language promotion and domestic distribution channels. Zone 2 presents a similar dual-market configuration with stronger domestic clustering (99%) alongside strong international presence (99%), so baseline international services are unlikely to be deprioritized without cost.
Zone 3 drew both segments strongly, yet the heritage assets there remain underleveraged, pointing to interpretation or experience gaps rather than any shortage of visitors [80]. Zone 5 shows a clearer hierarchy, with domestic clustering stronger (99%) than international (95%), suggesting room to grow its international profile through targeted outreach. Zone 6 is the outlier: domestic visitors reached 95–99% confidence while international visitors left no trace, a gap that reflects awareness barriers rather than product failure [68]. These three zones could benefit from differentiated strategies: experience investment in Zone 3, selective international promotion in Zone 5, and a revised channel approach in Zone 6.
Province-wide campaigns risk misallocating resources by directing promotion toward segments that show no clustering in a given zone [81]. Resource allocation aligned with demonstrated clustering patterns may outperform uniform provincial promotion [82]: bilingual campaigns for dual-market zones (Zones 1, 3, 4) and domestic-first strategies with selective international outreach for nature-temple and agrotourism zones (Zones 2, 5, 6).
Zone-specific recommendations carry limited value without mechanisms to track whether interventions produce measurable change. Visitor clustering patterns at secondary destinations shift in response to platform visibility, infrastructure investment, and promotional campaigns, yet most provincial tourism authorities in Thailand rely on annual visitor count data that neither distinguish domestic from international segments nor reveal sub-provincial geographic distribution. Quarterly or biannual Gi* updates using accumulated platform reviews would allow managers to detect whether, for example, Zone 6’s international clustering remains absent following a targeted English-language campaign, or whether Zone 5’s moderate international clustering strengthens after outreach investment [24]. This monitoring approach requires no additional data collection infrastructure—TripAdvisor, Google Maps, and similar platforms supply review data continuously and at lower cost than traditional visitor surveys [83,84]—and produces zone-level evidence directly comparable across time periods. The broader shift this approach enables is from asking what attractions exist to asking where each visitor segment actually concentrates, a reorientation that platform data make practically achievable for destinations without large survey budgets.
5. Conclusions
Three patterns stand out from this analysis of TripAdvisor reviews in Chanthaburi Province. First, both visitor segments clustered most heavily at cultural heritage sites but diverged elsewhere. Domestic visitors spread across all six zones including agrotourism; international visitors were concentrated in heritage, coastal, and nature-temple areas, with agrotourism entirely absent from their spatial footprint. Second, despite weaker overall clustering intensity, domestic visitors reached more zones than international visitors, showing broader geographic engagement not lesser spatial coherence. Third, beach destinations drew strong clustering from both segments, contradicting the common assumption that coastal zones serve primarily international visitors and pointing instead to an underrecognized dual-market dynamic.
Methodologically, combining Random Forest classification with ISA, Global Moran’s I, and Getis-Ord Gi* converts a sentiment dataset into zone-level visitor geography that neither technique alone could produce. Theoretically, the results challenge frameworks that treat provinces as spatially uniform. Clustering operates at sub-destination scales, varies by visitor origin, and responds to differential information access rather than attraction quality alone. For managers, the practical takeaway is that resource allocation should follow demonstrated clustering patterns. Zone 4’s dual-market clustering calls for differentiated coastal management. International visitors may benefit from enhanced English-language services, cross-border communication, and greater visibility on global platforms, while domestic visitors are more effectively reached through Thai-language content, local social media, and domestic distribution networks. Beyond Zone 4, domestic-first strategies remain appropriate for nature-temple and agrotourism zones, while experience improvements are warranted where strong clustering coexists with underleveraged assets.
The analytical framework developed here extends beyond Chanthaburi to secondary heritage destinations across Southeast Asia where bilingual platform data are available. Most such destinations lack the survey infrastructure of primary tourism hubs yet face the same domestic–international segmentation challenge, and platform-derived spatial analysis offers a practical route to zone-level geographic intelligence at lower cost. At the policy level, the zone-level evidence provides an empirical basis for differentiating promotional investment by segment rather than applying uniform provincial strategies. At the operational level, repeated Gi* analysis of accumulated platform reviews enables destination managers to track whether segment-specific interventions produce measurable geographic change over time, a monitoring capacity that aggregate visitor counts cannot provide.
Four limitations bound these conclusions. Sentiment classification served as a segmentation proxy, not a sentiment–spatial analysis tool; we locate where segments go not where satisfaction clusters. Review language approximates visitor origin but cannot verify nationality. Additionally, TripAdvisor’s platform bias leaves digitally disengaged segments—including most Chinese visitors—unrepresented. The sample is also concentrated around approximately ten core attractions, which limits the explanatory power of the findings for peripheral areas and low-review-volume sites; the absence of reviews in peripheral areas does not necessarily indicate the absence of tourist activity, only the absence of platform-visible engagement. Future work should expand negative training data, integrate multiple platforms to test cross-platform consistency, extend language coverage to major Asian markets, and link clustering patterns to objective visitor counts for independent validation.
Author Contributions
Conceptualization, Narong Pleerux; methodology, Narong Pleerux; validation, Narong Pleerux; formal analysis, Narong Pleerux and Phannipha Anuraksakornkul; data curation, Narong Pleerux, Parinya Nakpathom, and Phannipha Anuraksakornkul; writing—original draft preparation, Narong Pleerux; writing—review and editing, Narong Pleerux, Parinya Nakpathom, and Phannipha Anuraksakornkul; project administration, Narong Pleerux; funding acquisition, Narong Pleerux. All authors have read and agreed to the published version of the manuscript.
Funding
This research was funded by Burapha University, Thailand Science Research and Innovation (TSRI), and National Science Research and Innovation Fund (NSRF) (Fundamental Fund: Grant Number 58).
Data Availability Statement
The datasets analyzed during the current study are available from the corresponding author upon reasonable request.
Conflicts of Interest
The authors declare no conflicts of interest.
References
- Charfaoui, K.; Mussard, S. Sentiment Analysis for Tourism Insights: A Machine Learning Approach. Stats 2024, 7, 90. [Google Scholar] [CrossRef] [Scilit]
- Changa, V.; Islam, M.R.; Ahad, A.; Ahmedd, M.J.; Xu, Q.A. Machine Learning for Predicting Tourist Spots’ Preference and Analysing Future Tourism Trends in Bangladesh. Enterp. Inf. Syst. 2024, 18, 1450–1481. [Google Scholar] [CrossRef] [Scilit]
- Kladou, S.; Mavragani, E. Assessing Destination Image: An Online Marketing Approach and the Case of TripAdvisor. J. Destin. Mark. Manag. 2015, 4, 187–193. [Google Scholar] [CrossRef] [Scilit]
- Núñez, J.C.S.; Gómez-Pulido, J.A.; Ramírez, R.R. Machine Learning Applied to Tourism: A Systematic Review. Wires Data Min. Knowl. 2024, 14, e1549. [Google Scholar] [CrossRef] [Scilit]
- Ainin, S.; Feizollah, A.; Anuar, N.B.; Abdullah, N.A. Sentiment Analyses of Multilingual Tweets on Halal Tourism. Tour. Manag. Perspect. 2020, 34, 100658. [Google Scholar] [CrossRef] [Scilit]
- Khan, T.A.; Sadiq, R.; Shahid, Z.; Alam, M.M.; Su’ud, M.B.M. Sentiment Analysis Using Support Vector Machine and Random Forest. J. Inform. Web Eng. 2024, 3, 67–75. [Google Scholar] [CrossRef] [Scilit]
- Venkatesh, J.D.; Jaiswal, A.; Nanda, G. Comparing Human and Machine Learning Performance and Explainability in Classifying Online Mental Health Text. Sci. Rep. 2024, 14, 14295. [Google Scholar] [CrossRef] [Scilit] [PubMed]
- Breiman, L. Random Forests. Mach. Learn. 2001, 45, 5–32. [Google Scholar] [CrossRef] [Scilit]
- Ravi, K.; Ravi, V.; Shivakrishna, B. Sentiment Classification Using Paragraph Vector and Cognitive Big Data Semantics on Apache Spark. In Proceedings of the 2018 IEEE 17th International Conference on Cognitive Informatics & Cognitive Computing, Berkeley, CA, USA, 16–18 July 2018. [Google Scholar]
- Li, J.; Xu, L.; Tang, L.; Wang, S.; Li, L. Big Data in Tourism Research: A Literature Review. Tour. Manag. 2018, 68, 301–323. [Google Scholar] [CrossRef] [Scilit]
- Jiang, W.; Xiong, Z.; Su, Q.; Long, Y.; Song, X.; Sun, P. Using Geotagged Social Media Data to Explore Sentiment Changes in Tourist Flow: A Spatiotemporal Analytical Framework. ISPRS Int. J. Geo-Inf. 2021, 10, 135. [Google Scholar] [CrossRef] [Scilit]
- Lee, K.-S.; Eom, J.K. Spatiotemporal Dynamics of Visitors to Jeju Island: Hotspot and Spatial Autocorrelation Analyses Using Mobile Phone Data. PLoS ONE 2025, 20, e0321694. [Google Scholar] [CrossRef] [Scilit]
- Önder, I.; Koerbitz, W.; Hubmann-Haidvogel, A. Tracing Tourists by Their Digital Footprints: The Case of Austria. J. Travel Res. 2016, 55, 566–573. [Google Scholar] [CrossRef] [Scilit]
- Moran, P.A.P. Notes on continuous stochastic phenomena. Biometrika 1950, 37, 17–23. [Google Scholar] [CrossRef] [Scilit]
- Ord, J.K.; Getis, A. Local Spatial autocorrelation Statistics: Distributional Issues and an Application. Geogr. Anal. 1995, 27, 286–306. [Google Scholar] [CrossRef] [Scilit]
- García-Palomares, J.C.; Gutiérrez, J.; Mínguez, C. Identification of Tourist Hot Spots Based on Social Networks: A comparative analysis of European metropolises using photo-sharing services and GIS. Appl. Geogr. 2015, 63, 408–417. [Google Scholar] [CrossRef] [Scilit]
- Paolanti, M.; Mancini, A.; Frontoni, E.; Felicetti, A.; Marinelli, L.; Marcheggiani, E.; Pierdicca, R. Tourism Destination Management using Sentiment Analysis and Geo-Location Information: A Deep Learning Approach. Inf. Technol. Tour. 2021, 23, 241–264. [Google Scholar] [CrossRef] [Scilit]
- Ferreira, A.P.G.; Silva, T.H.; Loureiro, A.A.F. Uncovering Spatiotemporal and Semantic Aspects of Tourists Mobility using Social Sensing. Comput. Commun. 2020, 160, 240–254. [Google Scholar] [CrossRef] [Scilit]
- Kim, G.S.; Kim, C.-K.; Lee, W.-K. Where and Why Travelers Visit? Classifying Coastal Tourism Activities Using Geotagged Image Content from Social Media Data. ISPRS Int. J. Geo-Inf. 2024, 13, 355. [Google Scholar] [CrossRef] [Scilit]
- Manosso, F.C.; Ruiz, T.C.D. Using Sentiment Analysis in Tourism Research: A Systematic, Bibliometric, and Integrative Review. J. Tour. Herit. Serv. Mark. 2021, 7, 16–27. [Google Scholar] [CrossRef]
- Alaei, A.R.; Becken, S.; Stantic, B. Sentiment Analysis in Tourism: Capitalizing on Big Data. J. Travel Res. 2017, 58, 175–191. [Google Scholar] [CrossRef] [Scilit]
- Ribaudo, G.; Figini, P. The Puzzle of Tourism Demand at Destinations Hosting UNESCO World Heritage Sites. J. Travel Res. 2016, 56, 521–542. [Google Scholar] [CrossRef] [Scilit]
- Pleerux, N.; Anuraksakornkul, P.; Nakpathom, P.; Boonpor, P. Analyzing Tourist Sentiments in Chanthaburi Province: A Machine Learning Approach to Enhance Tourism Management. In Proceedings of the 2025 IEEE Region 10 Symposium (TENSYMP), Christchurch, New Zealand, 7–9 July 2025. [Google Scholar]
- Gretzel, U.; Sigala, M.; Xiang, Z.; Koo, C. Smart Tourism: Foundations and developments. Electron. Mark. 2015, 25, 179–188. [Google Scholar] [CrossRef] [Scilit]
- Femenia-Serra, F.; Neuhofer, B.; Ivars-Baidal, J.A. Towards a Conceptualisation of Smart Tourists and Their Role within the Smart Destination scenario. Serv. Ind. J. 2019, 39, 109–133. [Google Scholar] [CrossRef] [Scilit]
- Puh, B.; Babac, M.B. Predicting Sentiment and Rating of Tourist Reviews using Machine learning. J. Hosp. Tour. Insights 2023, 6, 1188–1204. [Google Scholar] [CrossRef] [Scilit]
- Manurung, K.A.; Laksana, K.M. Sentiment Analysis of Tourist Attraction Review from TripAdvisor using CNN and LSTM. Int. J. Inf. Commun. Technol. 2023, 9, 73–85. [Google Scholar] [CrossRef] [Scilit]
- Garg, N.; Sharma, K. Text Pre-Processing of Multilingual for Sentiment Analysis Based on social network data. Int. J. Electr. Comput. Eng. 2022, 12, 776–784. [Google Scholar] [CrossRef] [Scilit]
- Hasan, M.; Rahman, M.T.; Zillanee, A.H.; Alam, M.G.R.; Islam, M.F.U.; Chakrabarty, A. Multilingual sentiment analysis on social media: Harnessing deep learning for enhanced insights and decision support for foreign travelers. In Proceedings of the 6th International Conference on Electrical Engineering and Information & Communication Technology, Dhaka, Bangladesh, 2–4 May 2024. [Google Scholar]
- Phatthiyaphaibun, W.; Kruengkrai, P.; Limkonchotiwat, K.; Chanwanakul, K.; Chuangsuwanich, R.; Aramrattana, P.; Boonyapisit, A. PyThaiNLP: Thai Natural Language Processing in python. In Proceedings of the 3rd Workshop for Natural Language Processing Open Source Software, Singapore, 6 December 2023. [Google Scholar]
- Xiao, L.; Li, Q.; Ma, Q.; Shen, J.; Yang, Y.; Li, D. Text Classification Algorithm of Tourist Attractions Subcategories with Modified TF-IDF and Word2Vec. PLoS ONE 2024, 19, e0305095. [Google Scholar] [CrossRef] [Scilit]
- Álvarez-Carmona, M.A.; Aranda, R.; Rodríguez-González, A.Y.; Fajardo-Delgado, D.; Sánchez, M.G.; Pérez-Espinosa, H.; Martínez-Miranda, J.; Guerrero-Rodríguez, R.; Bustio-Martínez, L.; Díaz-Pacheco, Á. Natural Language Processing Applied to Tourism Research: A Systematic Review and Future Research Directions. J. King Saud Univ. Comput. Inf. Sci. 2022, 34, 10125–10144. [Google Scholar] [CrossRef] [Scilit]
- Pedregosa, F.; Varoquaux, G.; Gramfort, A.; Michel, V.; Thirion, B.; Grisel, O.; Blondel, M.; Prettenhofer, P.; Weiss, R.; Dubourg, V.; et al. Scikit-learn: Machine learning in python. J. Mach. Learn. Res. 2011, 12, 2825–2830. [Google Scholar]
- Saraswathi, N.; Sasi Rooba, T.; Chakaravarthi, S. Improving the accuracy of sentiment analysis using a linguistic rule-based feature selection method in tourism reviews. Meas. Sens. 2023, 27, 100888. [Google Scholar] [CrossRef] [Scilit]
- Probst, P.; Wright, M.N.; Boulesteix, A.-L. Hyperparameters and Tuning Strategies for Random Forest. WIREs Data Min. Knowl. Discov. 2019, 9, e1301. [Google Scholar] [CrossRef] [Scilit]
- Srianan, S.; Nanthaamornphong, A.; Phucharoen, C. Advancing Tourism Sentiment Analysis: A Comparative Evaluation of Traditional Machine Learning, Deep Learning, and transformer models on imbalanced datasets. Inf. Technol. Tour. 2025, 27, 1011–1045. [Google Scholar] [CrossRef] [Scilit]
- Sokolova, M.; Lapalme, G. A Systematic Analysis of Performance Measures for Classification Tasks. Inf. Process. Manag. 2009, 45, 427–437. [Google Scholar] [CrossRef] [Scilit]
- Dark, S.J.; Bram, D. The Modifiable Areal Unit Problem (MAUP) in Physical Geography. Prog. Phys. Geogr. 2007, 31, 471–479. [Google Scholar] [CrossRef] [Scilit]
- Mitchell, A.; Griffin, L.S. Measuring the Spatial Pattern of Feature Values. In The Esri Guide to GIS Analysis, Volume 2: Spatial Measurements and Statistics, 2nd ed.; Esri Press: Redlands, CA, USA, 2021; pp. 71–133. [Google Scholar]
- Anselin, L. Local Indicators of Spatial Association—LISA. Geogr. Anal. 1995, 27, 93–115. [Google Scholar] [CrossRef] [Scilit]
- Yang, Y.; Zhang, H.; Rickly, J.M. A Review of Early COVID-19 Research in Tourism: Launching the Annals of Tourism Research’s Curated Collection on Coronavirus and Tourism. Ann. Tour. Res. 2021, 91, 103313. [Google Scholar] [CrossRef] [Scilit]
- Xiang, Z.; Du, Q.; Ma, Y.; Fan, W. A Comparative Analysis of Major Online Review Platforms: Implications for Social Media Analytics in Hospitality and Tourism. Tour. Manag. 2017, 58, 51–65. [Google Scholar] [CrossRef] [Scilit]
- Mariani, M.M.; Borghi, M.; Gretzel, U. Online Reviews: Differences by Submission Device. Tour. Manag. 2019, 70, 295–298. [Google Scholar] [CrossRef] [Scilit]
- Filieri, R.; Hofacker, C.F.; Alguezaui, S. What Makes Information in Online Consumer Reviews Diagnostic over Time? The Role of Review Relevancy, Factuality, Currency, Source Credibility and Ranking Score. Comput. Hum. Behav. 2018, 80, 122–131. [Google Scholar] [CrossRef] [Scilit]
- Limkonchotiwat, P.; Phatthiyaphaibun, W.; Sarwar, R.; Chuangsuwanich, E.; Nutanong, S. Domain Adaptation of Thai Word Segmentation Models Using Stacked Ensemble. In Proceedings of the 2020 Conference on Empirical Methods in Natural Language Processing (EMNLP), Online, 16–20 November 2020; pp. 3965–3971. [Google Scholar]
- Biau, G.; Scornet, E. A Random Forest Guided Tour. TEST 2016, 25, 197–227. [Google Scholar] [CrossRef] [Scilit]
- Fernández, A.; García, S.; Herrera, F.; Chawla, N.V. SMOTE for Learning from Imbalanced Data: Progress and Challenges, Marking the 15-Year Anniversary. J. Artif. Intell. Res. 2018, 61, 863–905. [Google Scholar] [CrossRef] [Scilit]
- Dashtipour, K.; Gogate, M.; Adeel, A.; Ieracitano, C.; Larijani, H.; Hussain, A. Sentiment Analysis of Persian Movie Reviews Using Deep Learning. Entropy 2021, 23, 596. [Google Scholar] [CrossRef] [Scilit]
- Birjali, M.; Kasri, M.; Beni-Hssane, A. A Comprehensive Survey on Sentiment Analysis: Approaches, Challenges and Trends. Knowl.-Based Syst. 2021, 226, 107134. [Google Scholar] [CrossRef] [Scilit]
- Yadollahi, A.; Shahraki, A.G.; Zaiane, O.R. Current State of Text Sentiment Analysis from Opinion to Emotion Mining. ACM Comput. Surv. 2017, 50, 1–33. [Google Scholar] [CrossRef] [Scilit]
- Guo, H.; Li, Y.; Shang, J.; Gu, M.; Huang, Y.; Gong, B. Learning from Class-Imbalanced Data: Review of Methods and Applications. Expert Syst. Appl. 2017, 73, 220–239. [Google Scholar] [CrossRef] [Scilit]
- Geetha, M.; Singha, P.; Sinha, S. Relationship Between Customer Sentiment and Online Customer Ratings for Hotels—An Empirical Analysis. Tour. Manag. 2017, 61, 43–54. [Google Scholar] [CrossRef] [Scilit]
- Kowsari, K.; Jafari Meimandi, K.; Heidarysafa, M.; Mendu, S.; Barnes, L.; Brown, D. Text Classification Algorithms: A Survey. Information 2019, 10, 150. [Google Scholar] [CrossRef] [Scilit]
- Pasupa, K.; Seneewong Na Ayutthaya, S. Thai Sentiment Analysis with Deep Learning Techniques: A Comparative Study Based on Word Embedding, POS-Tag, and Sentic Features. Sustain. Cities Soc. 2019, 50, 101615. [Google Scholar] [CrossRef] [Scilit]
- Pasupa, K.; Seneewong Na Ayutthaya, S. Hybrid Deep Learning Models for Thai Sentiment Analysis. Cogn. Comput. 2022, 14, 167–193. [Google Scholar] [CrossRef] [Scilit]
- Zheng, W.; Huang, X.; Li, Y. Understanding the Tourist Mobility Using GPS: Where Is the Next Place? Tour. Manag. 2017, 59, 267–280. [Google Scholar] [CrossRef] [Scilit]
- Chen, Y. New Approaches for Calculating Moran’s Index of Spatial Autocorrelation. PLoS ONE 2013, 8, e68336. [Google Scholar] [CrossRef] [Scilit]
- Vu, H.Q.; Li, G.; Law, R.; Ye, B.H. Exploring the Travel Behaviors of Inbound Tourists to Hong Kong Using Geotagged Photos. Tour. Manag. 2015, 46, 222–232. [Google Scholar] [CrossRef] [Scilit]
- Salas-Olmedo, M.H.; Moya-Gómez, B.; García-Palomares, J.C.; Gutiérrez, J. Tourists’ Digital Footprint in Cities: Comparing Big Data Sources. Tour. Manag. 2018, 66, 13–25. [Google Scholar] [CrossRef] [Scilit]
- McKercher, B.; Thompson, M.; Prideaux, B. Impact of Different Domestic Source Markets on Tourist Behaviour. J. Vacat. Mark. 2023, 31, 303–313. [Google Scholar] [CrossRef] [Scilit]
- Goodchild, M.F. Spatial Thinking and the GIS User Interface. Procedia Soc. Behav. Sci. 2011, 21, 3–9. [Google Scholar] [CrossRef] [Scilit]
- Su, R.; Bramwell, B.; Whalley, P.A. Cultural Political Economy and Urban Heritage Tourism. Ann. Tour. Res. 2018, 68, 30–40. [Google Scholar] [CrossRef] [Scilit]
- Balmford, A.; Green, J.M.H.; Anderson, M.; Beresford, J.; Huang, C.; Naidoo, R.; Walpole, M.; Manica, A. Walk on the Wild Side: Estimating the Global Magnitude of Visits to Protected Areas. PLoS Biol. 2015, 13, e1002074. [Google Scholar] [CrossRef] [Scilit]
- Xu, M.; Liu, J.; Wang, R.; Lu, S.; Xu, F. The Relationship Between Visitors’ Motivation and Landscape Preference for the Pilgrimage Route on the Mount Miaofeng, China. PLoS ONE 2024, 19, e0314194. [Google Scholar] [CrossRef] [Scilit]
- Carvache-Franco, W.; Carvache-Franco, M.; Carvache-Franco, O.; Hernández-Lara, A.B. Motivation and Segmentation of the Demand for Coastal and Marine Destinations. Tour. Manag. Perspect. 2020, 34, 100661. [Google Scholar] [CrossRef] [Scilit]
- Carvache-Franco, M.; Carvache-Franco, W.; Carvache-Franco, O.; Solis-Radilla, M.M.; Pastor-Ferrando, J.P. Tourism Market Segmentation Applied to Coastal and Marine Destinations: A Study from Acapulco, Mexico. Sustainability 2021, 13, 13903. [Google Scholar] [CrossRef] [Scilit]
- Dwyer, L.; Kim, C. Destination Competitiveness: Determinants and Indicators. Curr. Issues Tour. 2003, 6, 369–414. [Google Scholar] [CrossRef] [Scilit]
- Wibowo, J.M. Rethinking Agrotourism: Integrating Conceptual Insight from Existing Scholarship. Tour. Manag. Perspect. 2026, 54, 101442. [Google Scholar] [CrossRef] [Scilit]
- 64Flanigan, S.; Blackstock, K.; Hunter, C. Agritourism from the Perspective of Provider and Visitor: A Typology-Based Study. Tour. Manag. 2014, 40, 394–405. [Google Scholar] [CrossRef] [Scilit]
- Brune, S.; Knollenberg, W.; Stevenson, K.T.; Barbieri, C.; Schroeder-Moreno, M. The Influence of Agritourism Experiences on Consumer Behavior toward Local Food. J. Travel Res. 2021, 60, 1318–1332. [Google Scholar] [CrossRef] [Scilit]
- Zarezadeh, Z.Z.; Benckendorff, P.; Gretzel, U. Online Tourist Information Search Strategies. Tour. Manag. Perspect. 2023, 48, 101140. [Google Scholar] [CrossRef] [Scilit]
- Kang, S.; Lee, G.; Kim, J.; Park, D. Identifying the Spatial Structure of the Tourist Attraction System in South Korea Using GIS and Network Analysis: An Application of Anchor-Point Theory. J. Destin. Mark. Manag. 2018, 9, 358–370. [Google Scholar] [CrossRef] [Scilit]
- Hardy, A.; Shoval, N. 25 Years of Tourist Tracking: A Geographical Perspective. Tour. Geogr. 2025, 27, 851–862. [Google Scholar] [CrossRef] [Scilit]
- Mou, N.; Yuan, R.; Yang, T.; Zhang, H.; Tang, J.J.; Makkonen, T. Exploring Spatio-Temporal Changes of City Inbound Tourism Flow: The Case of Shanghai, China. Tour. Manag. 2020, 76, 103955. [Google Scholar] [CrossRef] [Scilit]
- Marine-Roig, E.; Clavé, S.A. Tourism analytics with massive user-generated content: A case study of Barcelona. J. Destin. Mark. Manag. 2015, 4, 162–172. [Google Scholar] [CrossRef] [Scilit]
- Giglio, S.; Bertacchini, F.; Bilotta, E.; Pantano, P. Using Social Media to Identify Tourism Attractiveness in Six Italian Cities. Tour. Manag. 2019, 72, 306–312. [Google Scholar] [CrossRef] [Scilit]
- Dong, W.; Kang, Q.; Wang, G.; Zhang, B.; Liu, P. Spatiotemporal Behavior Pattern Differentiation and Preference Identification of Tourists from the Perspective of Ecotourism Destination Based on the Tourism Digital Footprint Data. PLoS ONE 2023, 18, e0285192. [Google Scholar] [CrossRef] [Scilit]
- Rasoolimanesh, S.M.; Iranmanesh, M.; Seyfi, S.; Ari Ragavan, N.; Jaafar, M. Effects of Perceived Value on Satisfaction and Revisit Intention: Domestic vs. International Tourists. J. Vacat. Mark. 2023, 29, 222–241. [Google Scholar] [CrossRef] [Scilit]
- Cheng, M. Social Media and Tourism Geographies: Mapping Future Research Agenda. Tour. Geogr. 2024, 26, 579–588. [Google Scholar] [CrossRef] [Scilit]
- Packer, J.; Ballantyne, R. Conceptualizing the Visitor Experience: A Review of Literature and Development of a Multifaceted Model. Visit. Stud. 2016, 19, 128–143. [Google Scholar] [CrossRef] [Scilit]
- Novais, M.A.; Del Papa, B.; Han, Q.; Mohan, K.; Vásárhelyi, O.; Wang, Y.; Zejnilovic, L. Investigating Patterns of Tourist Movement Using Multiple Data Sources. J. Travel Tour. Mark. 2025, 42, 709–724. [Google Scholar] [CrossRef] [Scilit]
- Pike, S.; Page, S.J. Destination marketing organizations and destination marketing: A narrative analysis of the literature. Tour. Manag. 2014, 41, 202–227. [Google Scholar] [CrossRef] [Scilit]
- Fuchs, M.; Höpken, W.; Lexhagen, M. Big Data Analytics for Knowledge Generation in Tourism Destinations—A Case from Sweden. J. Destin. Mark. Manag. 2014, 3, 198–209. [Google Scholar] [CrossRef] [Scilit]
- Miah, S.J.; Vu, H.Q.; Gammack, J.; McGrath, M. A Big Data Analytics Method for Tourist Behaviour Analysis. Inf. Manag. 2017, 54, 771–785. [Google Scholar] [CrossRef] [Scilit]

Disclaimer/Publisher’s Note: The statements, opinions and data contained in all publications are solely those of the individual author(s) and contributor(s) and not of MDPI and/or the editor(s). MDPI and/or the editor(s) disclaim responsibility for any injury to people or property resulting from any ideas, methods, instructions or products referred to in the content. |
© 2026 by the authors. Published by MDPI on behalf of the International Society for Photogrammetry and Remote Sensing. Licensee MDPI, Basel, Switzerland. This article is an open access article distributed under the terms and conditions of the Creative Commons Attribution (CC BY) license.