Article

A Geospatial Dynamic Warning Distance Model for Road Disaster Risks in Mixed-Traffic Flow Considering Vehicle Response Heterogeneity

1
Research Institute for Road Safety of the Ministry of Public Security, Beijing 100741, China
2
College of Transportation Engineering, Dalian Maritime University, Dalian 116026, China
*
Author to whom correspondence should be addressed.
ISPRS Int. J. Geo-Inf. 2026, 15(5), 224; https://doi.org/10.3390/ijgi15050224
Submission received: 7 April 2026 / Revised: 11 May 2026 / Accepted: 18 May 2026 / Published: 21 May 2026

Abstract

Road disasters such as subsidence and bridge failures pose severe threats to traffic safety. Existing warning distance calculation methods typically assume homogeneous traffic flow and overlook the spatial heterogeneity of vehicle responses across different vehicle types, limiting their applicability for geospatial early warning systems. This paper proposes a dynamic warning distance model that integrates mixed-traffic flow composition—comprising human-driven vehicles (HDVs), Level 2 advanced driver-assistance system vehicles (ADASVs), and automated vehicles (AVs) of Level 3 and above—within a geospatial risk propagation framework. The model introduces vehicle-type weighting coefficients to quantify response differences, incorporates interaction delays calibrated through SUMO microsimulations, and accounts for cascading reaction delays caused by abrupt HDV braking. The methodology is illustrated using a counterfactual reconstruction of the 2024 Meizhou–Dapu Expressway collapse in China (52 fatalities). Based on reconstructed traffic conditions (80% HDVs, 15% ADASVs, 5% AVs; average speed 27.5 m/s; flow 1800 veh/h), the calculated dynamic warning distance is 153 m, which is 12% shorter than the speed-matched conventional stopping sight distance of 174 m (computed under consistent wet-pavement assumptions). Sensitivity analyses reveal that warning distance decreases substantially with increasing AV penetration (to 42 m in AV-dominated scenarios, a potential reduction of up to 74% compared with the HDV-dominated baseline, provided that residual HDVs are supported by V2X-based alerting) and varies monotonically with traffic flow, demonstrating the model’s adaptive capability. The proposed framework provides a theoretical foundation for adaptive geospatial disaster warning strategies and offers practical guidance for infrastructure development in the era of mixed-traffic automation.

1. Introduction

Road disasters, such as subsidence, collapse, and bridge failure, are sudden catastrophic events that pose severe threats to traffic safety and human lives [1]. The recent catastrophic collapse on the Meizhou–Dapu Expressway in China on 1 May 2024, which resulted in 23 vehicles falling into a sinkhole and 52 fatalities [2], starkly illustrates the devastating consequences of such incidents and underscores the critical importance of effective disaster warning systems. In the aftermath of a disaster, timely and accurate warning to upstream vehicles is essential to prevent secondary accidents and minimize casualties. The warning distance—the distance from the hazard point at which warnings should be issued—is a key parameter determining whether drivers have sufficient time and space to react safely.
Concurrently, the transportation landscape is undergoing a profound transformation with the rapid development and deployment of automated vehicle technologies [3]. Roads are increasingly characterized by mixed-traffic flow, where human-driven vehicles (HDVs), Level 2 advanced driver-assistance system vehicles (ADASVs), and automated vehicles (AVs) of Level 3 and above coexist [4]. These three vehicle categories exhibit fundamentally different capabilities in terms of perception range, reaction time, and decision-making logic. The heterogeneity inherent in these capabilities means that different vehicle types respond to the same hazard on markedly different timescales, introducing a level of complexity into warning distance design that cannot be captured by approaches that treat the traffic stream as uniform. A growing body of empirical research has documented these differences in quantitative terms, establishing a solid foundation for the development of more refined warning strategies that explicitly account for vehicle-specific response characteristics.
Existing methods for calculating disaster warning distances remain largely rooted in homogeneous traffic assumptions. Conventional standards prescribe fixed thresholds based solely on HDV braking performance and do not account for the diverse response capabilities present in mixed traffic. These fixed thresholds have been widely criticized in the recent literature for their inability to adapt to the changing composition of the vehicle fleet. In scenarios where automated vehicles represent a meaningful proportion of the traffic stream, fixed thresholds tend to produce warning distances that are unnecessarily conservative, compromising traffic efficiency. Conversely, in dense, human-dominated flows where inter-vehicle interaction delays become significant, the same thresholds may underestimate the cumulative propagation time of the hazard, leaving the slowest-reacting vehicles with limited safety margins. This mismatch between the assumptions embedded in current standards and the operational realities of heterogeneous traffic creates a pressing need for warning distance models that can dynamically adjust to the real-time composition of the vehicle mix.
The primary contributions of this work are threefold. First, a novel risk propagation time model is introduced that directly utilizes simulation-calibrated total delays to capture the queue-wide effect of heterogeneous vehicle responses. The model incorporates an interaction delay parameter that isolates the additional time attributable specifically to conflicts between vehicles of different types, thereby providing a transparent decomposition of the total risk propagation process. Second, the interaction delay is calibrated through extensive SUMO microsimulations across a wide range of vehicle compositions and traffic flows, yielding a high-resolution lookup table for practical application. A cascading reaction delay is further formulated to account for the chain-reaction braking that occurs when an HDV brakes abruptly and following automated vehicles are forced to replan their trajectories—a phenomenon that is frequently observed in mixed traffic but rarely quantified in existing warning models. Third, the model is applied to a counterfactual reconstruction of the 2024 Meizhou–Dapu Expressway collapse, using plausible traffic parameters that reflect the conditions prevailing at the time of the incident. The analysis quantifies how the optimal warning distance adapts to real-time vehicle mix and traffic volume, demonstrating that the model provides conservative protection in HDV-dominated flows while unlocking substantial efficiency gains in AV-rich scenarios.
The remainder of this paper is organized as follows. Section 2 reviews the related literature on road disaster warning, mixed-traffic flow characteristics, and risk propagation models. Section 3 presents the proposed methodology, including vehicle response stratification, the risk propagation time model, and the dynamic warning distance formulation. Section 4 describes the application of the model to the Meizhou–Dapu Expressway collapse, detailing the input data, calculation steps, and sensitivity analysis. Section 5 discusses the results, compares them with conventional approaches, explores implications for traffic management, and acknowledges limitations and future research directions. Section 6 concludes the paper with a summary of key findings and contributions.

2. Literature Review

This section reviews three streams of literature that are directly relevant to the core research focus: road disaster warning technologies and safety distance models, characteristics of mixed-traffic flow and vehicle heterogeneity, and risk propagation in mixed-traffic environments. The review concludes by situating the present study within this broader literature landscape, highlighting the areas that remain to be addressed.

2.1. Road Disaster Warning Technologies and Safety Distance Models

The effectiveness of a disaster warning system depends critically on the timely detection of hazards and the rapid dissemination of alerts to upstream vehicles, with the goal of preventing secondary accidents and minimizing casualties. A key parameter in such systems is the warning distance, defined as the distance from the hazard point at which warnings should be issued to ensure that approaching drivers have sufficient time and space to react safely [5,6]. Traditional approaches to determining this distance have predominantly relied on fixed thresholds derived from braking distance models that assume homogeneous traffic conditions. For example, widely adopted standards such as the AASHTO Green Book [7] and the Technical Standard of Highway Engineering in China [8] prescribe minimum stopping sight distances based on uniform assumptions about vehicle capabilities and driver behavior. These standards typically specify distances in the range of 110 to 160 m at highway speeds, without accounting for the potentially faster responses that automated driving technologies can offer.
A growing body of research has recognized the limitations of such fixed-threshold approaches. Studies on the stability and capacity of mixed-traffic flow with intelligent connected vehicle platoons have demonstrated that conventional fixed-distance thresholds cannot accommodate the dynamic characteristics of heterogeneous traffic [9]. Three specific shortcomings have been identified. The first is an inherent conservatism that arises from ignoring the faster response potential of ADAS-equipped and highly automated vehicles, which can unnecessarily reduce traffic efficiency [9]. The second is the neglect of interaction conflicts among vehicles of different types, such as cascading braking effects that can force following automated vehicles to replan trajectories or brake multiple times, thereby prolonging the overall risk propagation time [10,11]. The third is a lack of dynamic adaptation to the real-time composition of the traffic stream, which naturally varies across different times of day, days of the week, and stages in the market penetration of automated driving technologies [12]. Consequently, a warning threshold that is appropriate for rush-hour traffic dominated by human drivers may be unsuitable for late-night conditions where the proportion of automated vehicles is higher [13].
In response to these limitations, recent research has explored dynamic safety distance models that incorporate real-time factors such as vehicle speed, pavement friction, and prevailing traffic conditions [14]. Efforts to model the fundamental diagram of mixed human-driven and connected automated vehicle traffic have further demonstrated the significant impact that the penetration rate of automated vehicles can have on traffic flow stability [15]. However, these models generally continue to assume a single representative vehicle type and do not fully capture the heterogeneity that characterizes real-world mixed-traffic flows. Complementary to these efforts, comprehensive guidance on establishing protection distances in emergency planning contexts has been developed, emphasizing the importance of risk-based approaches that integrate probabilistic frameworks for quantitative risk assessment [5,16]. Research on the influence distances associated with post-earthquake debris accumulation has also contributed to the conceptual foundations for determining safety distances in emergency evacuation scenarios [17]. Nevertheless, these studies have not been specifically designed to address road disaster scenarios involving a diverse mix of vehicle types with fundamentally different perception and response characteristics.
The practical deployment of real-time warning systems also depends on the availability of reliable vehicular communication technologies. Comprehensive surveys and empirical performance analyses of the two leading direct vehicular communication technologies, namely DSRC and LTE-V2X, have characterized their respective capabilities and limitations [18], thereby providing the technical foundation for the warning dissemination mechanisms that are assumed in dynamic warning models under current investigation.
A related line of research has examined the effects of vehicle automation on fundamental aspects of roadway geometric design, including the determination of stopping sight distances. Investigations into the implications of a fully automated vehicle fleet suggest that revised design values could yield significant economic and environmental benefits [19]. At the network level, systematic reviews of road network resilience to natural hazards have synthesized resilience metrics and assessment methods across diverse hazard types, providing a broader context for the integration of warning systems into infrastructure planning [20].

2.2. Mixed-Traffic Flow Characteristics and Vehicle Heterogeneity

The coexistence of human-driven vehicles, Level 2 advanced driver-assistance system vehicles, and automated vehicles of Level 3 and above gives rise to fundamentally heterogeneous traffic streams. A comprehensive bibliometric analysis of research on autonomous vehicles in mixed traffic has identified vehicle interactions, market penetration rates, and safety implications as the key themes that have shaped the research landscape [21]. This heterogeneity is manifested in pronounced differences across three categories of perceptual and response capabilities.
Human-driven vehicles rely entirely on the driver’s vision, with typical perception ranges of approximately 100 to 150 m and reaction times that are generally reported to fall within the range of 1.5 to 2.5 s [22,23]. Empirical evidence from eye-movement studies has provided additional validation of these reaction time estimates by demonstrating how ocular behavior can predict driver takeover responses in automated driving scenarios [24]. The behavior of human drivers is further characterized by considerable randomness, individual heterogeneity, and a notable susceptibility to distraction, all of which have been shown to exert a significant influence on traffic flow stability [25].
Vehicles equipped with Level 2 driver-assistance features, including adaptive cruise control and lane-keeping assist, are capable of perceiving hazards at greater distances, typically within a range of 200 to 300 m, and can initiate responses more rapidly than their human-driven counterparts. Systematic reviews of the design space for in-vehicle human–machine interaction have highlighted the extent to which interface design can influence driver response times during partially automated driving [26]. Field-validated data from real-world studies of driver reactions to connected vehicle forward collision warnings have provided crucial empirical evidence on the response behavior of drivers in ADAS-equipped vehicles under operational conditions [27]. Studies focusing specifically on takeover scenarios in conditionally automated driving report total response times on the order of 1.0 to 1.5 s, which can be decomposed into system detection delays of 0.3 to 0.5 s and driver takeover delays of 0.5 to 1.0 s [28]. A recent systematic review and meta-analysis has synthesized the available evidence on takeover times at SAE Levels 2 and 3, providing the most comprehensive empirical basis currently available for calibrating the response times of ADAS-equipped vehicles under varying road, traffic, and human–machine interface conditions [29]. Complementary work has identified distinct driving profiles that emerge following takeover requests, thereby offering the fine-grained behavioral data that is essential for realistic mixed-traffic modeling [30]. Broader reviews of forward collision warning studies have further confirmed the consistency of the perception–response time ranges reported across different experimental paradigms [31].
At the highest level of automation, vehicles equipped with multi-modal sensor suites that fuse radar, LiDAR, and camera inputs, together with vehicle-to-everything communication capabilities, achieve perception ranges exceeding 500 m and can execute perception-to-action cycles as short as 0.3 to 0.5 s [4,28,32]. Comprehensive reviews of the state of the art in autonomous vehicle perception have thoroughly documented the capabilities of onboard sensors and the sensor fusion techniques that underpin the rapid hazard detection potential of these vehicles [33]. At the hardware level, recent developments in long-range LiDAR technology have extended the maximum detection range to beyond 500 m, thereby making high-speed hazard anticipation technically feasible [34]. These technical capabilities enable forms of cooperative and anticipatory maneuvering that lie beyond the reach of human drivers [35,36]. Research on platoon trajectory completion under conditions of sparse observation has further illuminated the potential for cooperative maneuvering in mixed traffic, even when sensing information is incomplete or intermittent [37].
The practical consequences of these differences in response capabilities for traffic safety are substantial. Sensitivity analyses have consistently identified reaction time as one of the most influential parameters governing conflict rates in mixed-traffic environments [25]. Simulation-based investigations of the traffic impacts of expressway accidents in mixed-traffic environments have revealed that higher penetration rates of connected and automated vehicles can significantly reduce both delays and collision risks when a single lane is occupied; when two lanes are simultaneously affected, however, the relationship becomes more complex, with delays and collision risks initially increasing before declining as the penetration rate continues to rise [38]. These studies have also underscored the finding that high traffic flow rates and extended accident durations exacerbate delays, and that collision risks increase substantially under high-flow conditions.
Comprehensive reviews of the impacts of connected autonomous vehicles on mixed-traffic flow have systematically examined the effects on traffic efficiency, safety, and stability across the full spectrum of penetration rates, from early-stage deployment to near-universal adoption [39]. Systematic surveys of urban traffic control strategies in environments that include connected automated vehicles have provided taxonomies of the available control approaches together with assessments of their implications for the stability and safety of mixed-traffic flows [40]. Evaluations of the safety performance of connected and automated vehicles operating in mixed traffic at intersections have demonstrated the utility of driving volatility measures as quantitative indicators of safety performance in heterogeneous traffic streams [41].

2.3. Risk Propagation in Mixed-Traffic Flow

A thorough understanding of the mechanisms by which risk propagates through mixed-traffic streams is essential for the design of effective warning systems. Traditional models of risk propagation, of which shockwave theory is the canonical example [42], were developed under the assumption of homogeneous traffic and proved capable of predicting queue formation and growth upstream of an incident. These classical models, however, by construction ignore vehicle heterogeneity and the complex interactions that arise between vehicles of differing types and capabilities.
More recent research has developed considerably more sophisticated approaches to this problem. Investigations of traffic dynamics in mixed streams subjected to speed disturbances have demonstrated that while automated vehicles can serve to dampen perturbations, they may simultaneously introduce new modes of instability that are absent in purely human-driven traffic [43]. Studies of phase transitions and spectral entropy in heterogeneous flows that include both connected automated and human-driven vehicles have provided a quantitative understanding of how the composition of the traffic stream fundamentally alters the patterns and rates of risk propagation [44]. Research on the safety implications of connected autonomous vehicles operating in realistic mixed-traffic scenarios, where factors such as unreliable communication and car-following control come into play, has highlighted the complex trade-offs that exist between safety and efficiency under varying conditions of communication reliability and traffic demand [45]. The development of novel surrogate safety metrics, combined with comprehensive behavioral modeling frameworks that integrate time-to-collision and related measures, has provided the methodological foundations needed to evaluate how warning distances influence overall traffic safety in environments where longitudinal and lane-changing conflicts occur simultaneously [46].
The interaction effects between human-driven and connected autonomous vehicles in mixed traffic have received considerable research attention. Cellular automata models that explicitly incorporate the cognitive behavioral characteristics of human drivers, together with the interaction effects between these drivers and connected autonomous vehicles, have yielded important insights. Numerical simulations based on such models have revealed that at relatively low penetration rates of connected autonomous vehicles, specifically below the range of 0.5 to 0.6, increases in the penetration rate can actually lead to increases in the lane-changing frequency of the entire traffic flow, a counterintuitive result that is driven by the complex interactions between the driving behaviors of the two vehicle classes [11]. This finding carries the broader implication that vehicle interactions in mixed traffic can generate non-linear effects that propagate through the traffic stream in ways that are not anticipated by conventional homogeneous traffic models, and that these interaction effects, which are most pronounced at intermediate levels of automation penetration, are critical to understanding both the nature of risk propagation and the determination of appropriate warning distances in mixed-traffic environments.
In parallel with these modeling efforts, a substantial body of research has addressed the problem of real-time crash risk prediction. Comprehensive reviews have systematically established the design pathways and ubiquitous requirements for proactive traffic safety management systems that rely on real-time crash prediction as a foundational capability [47]. Deep learning approaches have been applied to develop two-stage frameworks for real-time crash risk prediction in freeway tunnels that explicitly account for feature interactions and unobserved heterogeneity across different crash precursors [48]. Multi-modal learning methods have been proposed for vehicle-level real-time collision risk prediction that leverage large-scale datasets of near-crash events to achieve robust performance across diverse road scenarios [49].

2.4. Research Gap and Positioning of This Study

The preceding review reveals that, despite substantial and sustained progress in understanding the characteristics of mixed traffic and the mechanisms of risk propagation within it, a significant gap remains in the literature. No existing model integrates vehicle-type-specific reaction weights, simulation-calibrated interaction delays, and cascading reaction effects into a single, unified analytical framework for the calculation of disaster warning distances. Moreover, existing studies of expressway incident warning systems have not explicitly accounted for the heterogeneity in vehicle perception–response capabilities that fundamentally shapes how risk is transmitted through a mixed-traffic stream. The present study is designed to fill this gap by proposing a dynamic warning distance model that explicitly quantifies both response heterogeneity and interaction effects in mixed-traffic flow. The model is calibrated through systematic microsimulation experiments and is illustrated through a counterfactual reconstruction of a real-world expressway disaster.

3. Methodology

This section presents the proposed methodology for calculating dynamic warning distances in mixed-traffic flow. First, the response capabilities of different vehicle types are stratified based on their perception and reaction characteristics. Second, a risk propagation time model is developed that incorporates vehicle-type weights and interaction delays. Finally, a dynamic warning distance formulation is derived, accounting for cascading reactions and safety buffers.

3.1. Stratification of Vehicle Response Capability

In mixed-traffic flow, vehicles exhibit fundamentally different response capabilities due to variations in sensing technology, decision-making logic, and human involvement. Based on a comprehensive review of the literature, we classify vehicles into three categories: human-driven vehicles (HDVs), Level 2 advanced driver-assistance system vehicles (ADASVs), and automated vehicles (AVs) of Level 3 and above. Table 1 summarizes their key characteristics, including perception range, reaction time, and typical braking distance at highway speeds. The reaction time ranges presented in Table 1 are compiled from empirical studies on driver behavior and automated vehicle performance [4,22,23,50].
HDVs rely solely on driver vision and are subject to human limitations such as distraction, fatigue, and variability in perception–response time, with a typical reaction time of 2.0 s. ADASVs are equipped with adaptive cruise control and lane-keeping assist, enabling faster hazard detection with a typical response time of 1.2 s, but still requiring driver supervision and potential takeover delays. AVs with Level 3 or higher automation leverage multi-modal sensors (radar, LiDAR, cameras) and vehicle-to-everything (V2X) communication, achieving perception ranges exceeding 500 m and a reaction time as low as 0.5 s. These differences are critical for determining how quickly a vehicle can respond to a sudden road disaster.

3.2. SUMO Simulation Setup for Delay Calibration

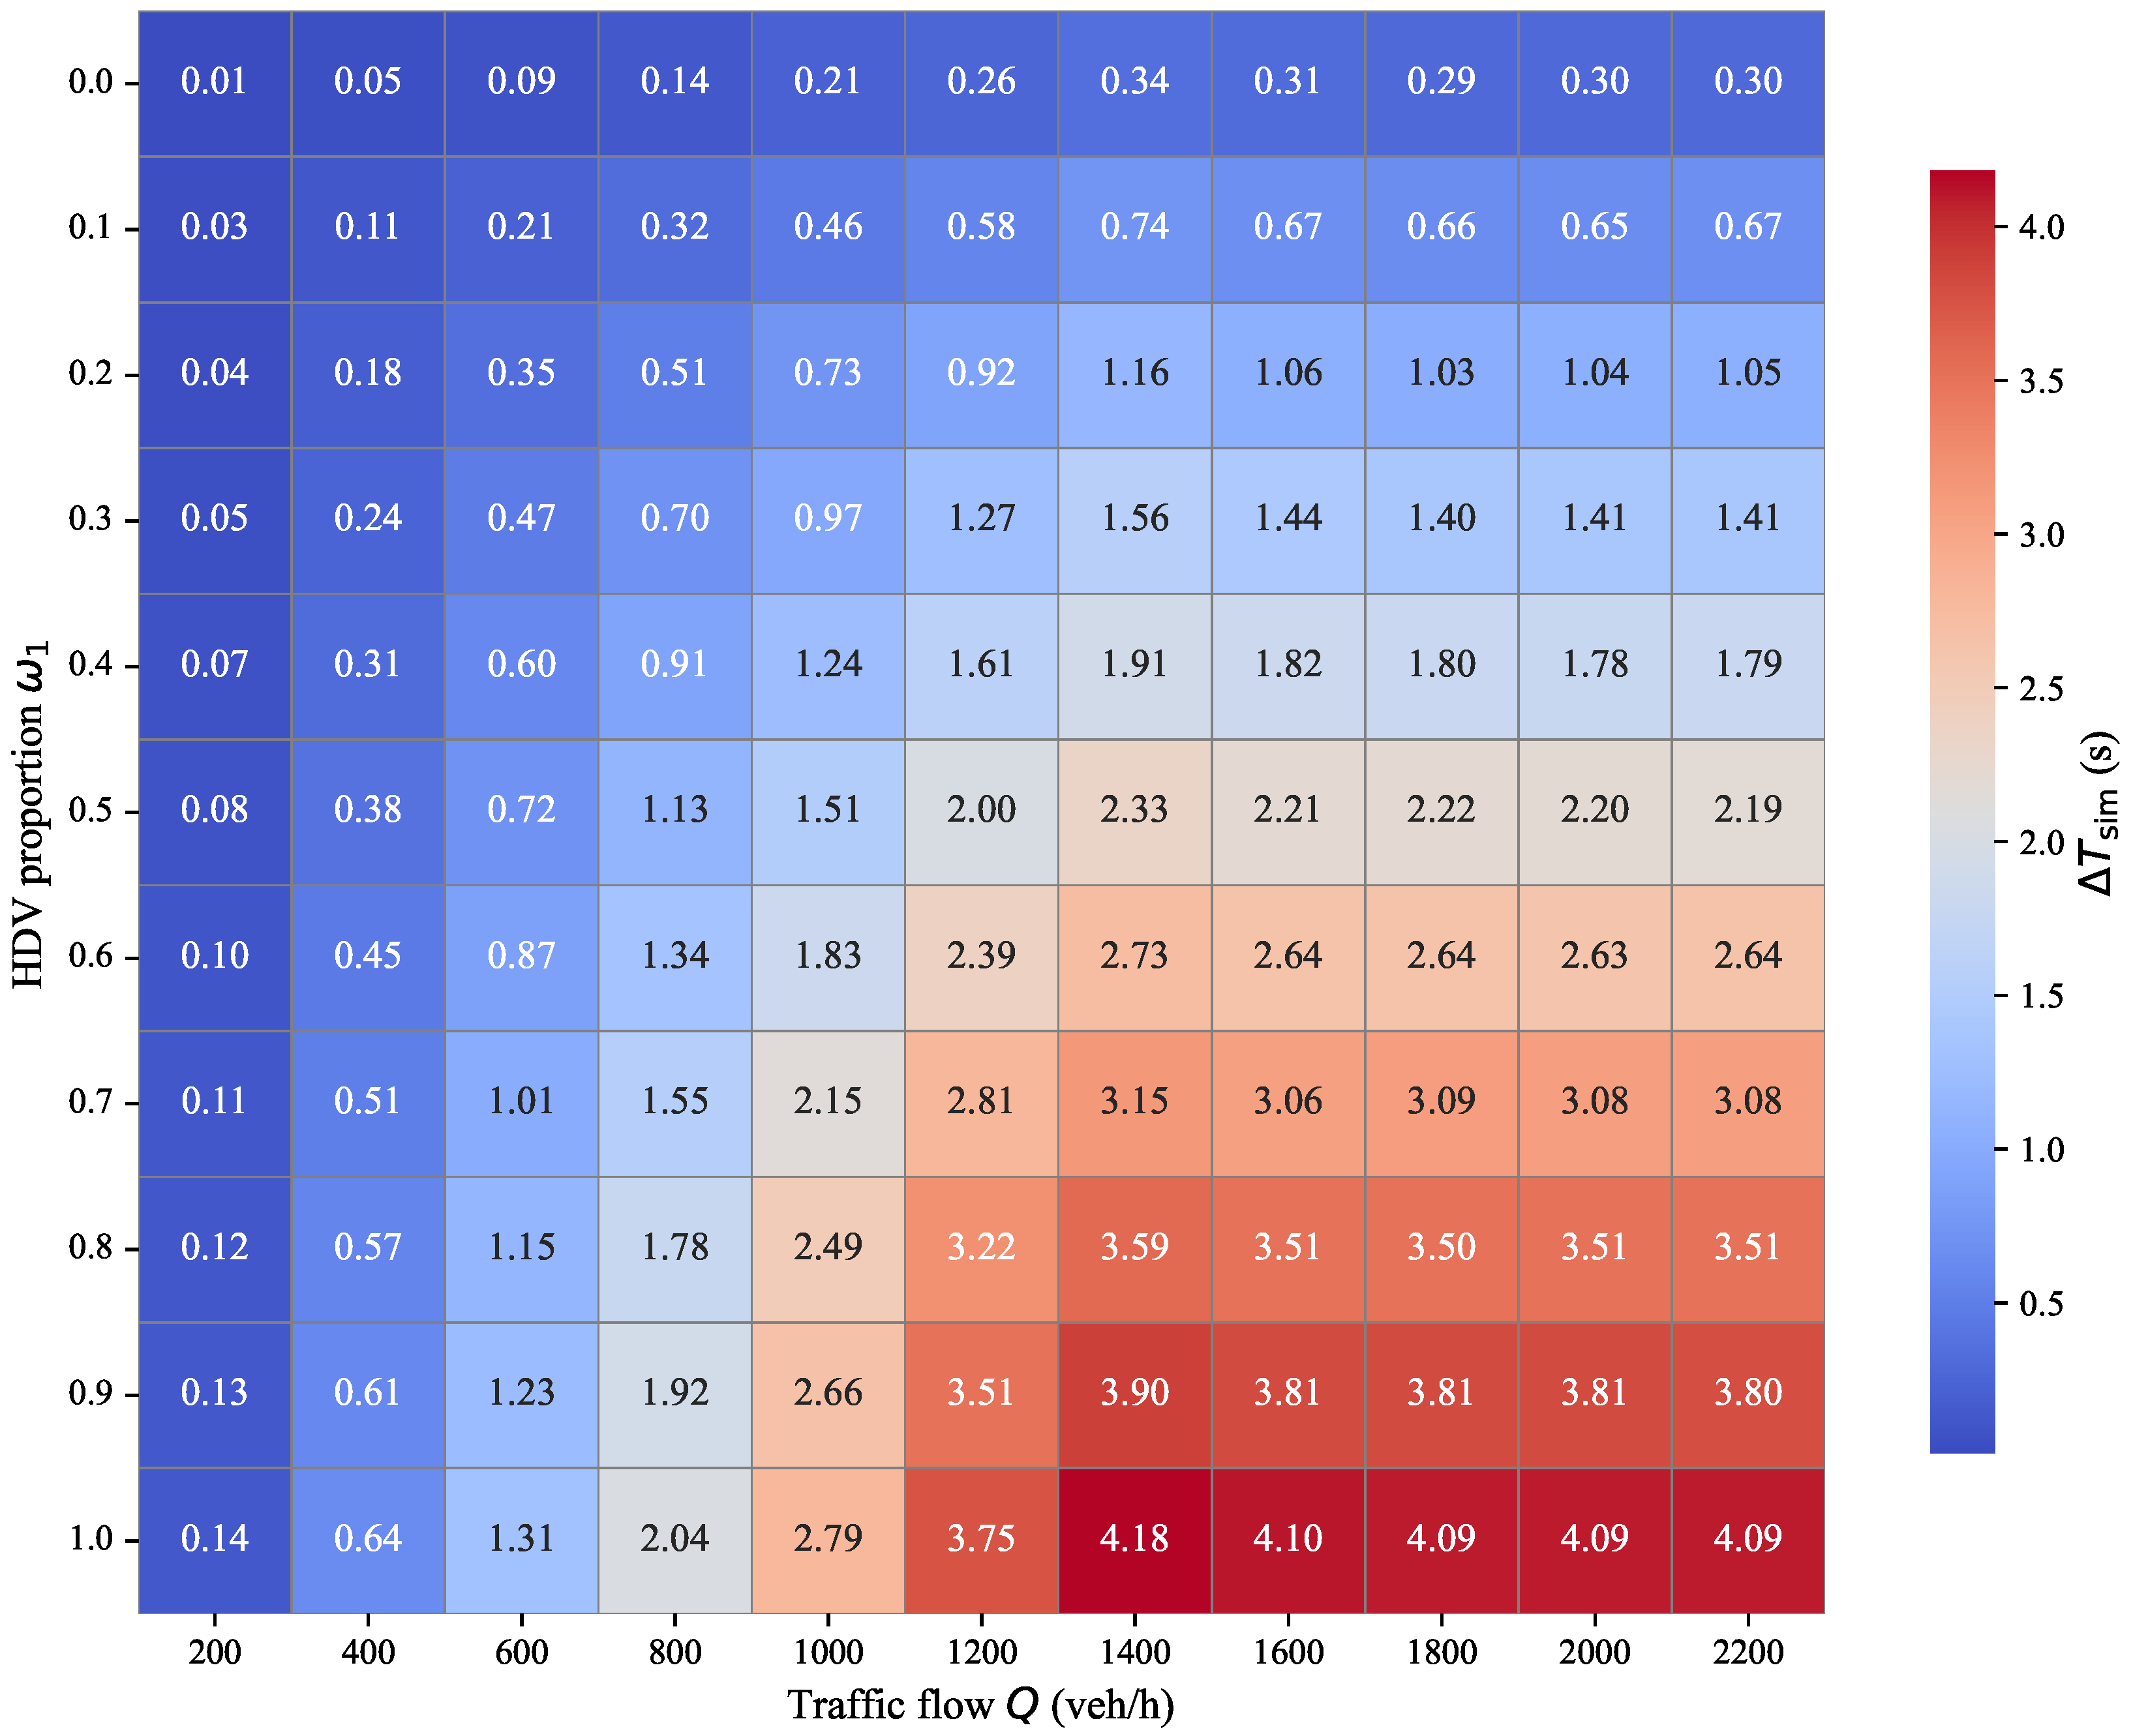
The interaction-related delay was calibrated using the SUMO microscopic traffic simulator (German Aerospace Center (DLR), Berlin, Germany, version 1.26.0). A 2 km straight four-lane freeway segment was modeled with a speed limit of 27.5 m/s. The car-following behavior of HDVs was governed by the Krauß model with default parameters; ADASVs and AVs were represented by the Intelligent Driver Model (IDM) with parameters adjusted to reflect shorter time headways (0.8 s and 0.5 s, respectively) and smoother acceleration profiles. The disaster event was modeled as the instantaneous full stop of the leading vehicle at a fixed location, representing the most conservative scenario. For each combination of HDV proportion ω 1 { 0.0 , 0.1 , , 1.0 } and traffic flow Q { 200 , 400 , , 2200 } veh/h, a total of 50 independent simulation runs with different random seeds were executed. Each run simulated 30 min of traffic flow, with the event triggered after a 10 min warm-up period. The simulation delay Δ T sim was extracted as the difference between the 85th percentile of the time-to-brake distribution in the mixed-traffic scenario and the baseline all-AV scenario. The resulting heatmap is shown in Figure 1.

3.3. Risk Propagation Time Model

When a road disaster occurs, the time required for upstream vehicles to perceive the hazard and initiate evasive actions depends strongly on the traffic composition. We define the mixed-traffic risk propagation time T risk mixed as the total time from disaster onset until all vehicles have begun effective braking. This time is expressed as T risk mixed = T weighted + Δ T interaction , where T weighted = i = 1 3 ω i T response i is the fleet-weighted-average response time, and Δ T interaction is the pure interaction delay, the additional time caused exclusively by vehicle-to-vehicle conflicts. To calibrate Δ T interaction , we first extract the simulated total delay Δ T sim from SUMO, defined as the difference in risk propagation time between the mixed-traffic scenario and an all-AV baseline ( T AV base = 0.5 s). The pure interaction delay is then computed by subtracting the reaction-time heterogeneity component: Δ T interaction = Δ T sim ( T weighted T AV base ) . This decomposition ensures that Δ T interaction isolates the conflict-induced delay, while reaction time differences are captured in T weighted . Table 2 provides calibrated values of the 85th percentile simulation delay Δ T sim for selected combinations of HDV proportion ω 1 and traffic flow Q. The full dataset is available in the Supplementary Materials. For the Meizhou–Dapu Expressway case ( ω 1 = 0.8 , Q = 1800 veh/h), the corresponding delay is 3.50 s, yielding Δ T interaction = 3.50 ( 1.805 0.5 ) = 2.195 s and T risk mixed = 1.805 + 2.195 = 4.00 s.

3.4. Dynamic Warning Distance Model

The dynamic warning distance D mixed is the minimum distance upstream of the disaster point at which warnings should be issued to ensure that all vehicles can safely stop or avoid the hazard. It consists of three parts: the risk propagation distance, a cascading reaction delay term, and a safety buffer distance.

3.4.1. Cascading Reaction Delay Application

When an HDV brakes abruptly, following AVs may need to replan their trajectories or brake a second time, causing additional delays that propagate upstream. This cascading effect is captured by Δ T cascade , defined as follows:
Δ T cascade = k · ω 1 · Q Q max ,
where k = 0.3 s is an empirically chosen coefficient that quantifies the strength of the cascading effect. The linear form and the specific value are adopted as a pragmatic heuristic, and a sensitivity analysis over the range k [ 0.1 , 0.5 ] is provided in Section 4.3 to demonstrate that the model’s conclusions are robust to this choice.

3.4.2. Risk Propagation Distance Calculation

The risk propagation distance D risk mixed is the distance required for vehicles to complete evasive maneuvers after the total risk propagation time:
D risk mixed = v 0 · T risk mixed + Δ T cascade ,
where v 0 (m/s) is the average speed of upstream traffic, obtained from radar measurements.

3.4.3. Safety Buffer Distance Assessment

To account for control errors and perception inaccuracies, a safety buffer distance is added. Instead of fixed distances, we adopt a time-headway approach consistent with traffic engineering practice. The buffer distance is computed as Δ D buffer mixed = v 0 · ( ω 1 t buffer HDV + ω 2 t buffer ADASV + ω 3 t buffer AV ) , where t buffer HDV = 1.5 s, consistent with the perception time component of the AASHTO perception–reaction time model [7]; t buffer ADASV = 0.8 s, corresponding to the minimum selectable steady-state time headway specified in ISO 15622 for ACC systems [51]; and t buffer AV = 0.3 s, representing the minimum string-stable time headway demonstrated for CACC-equipped automated vehicle platoons by Vegamoor et al. [52]. For the Meizhou–Dapu Expressway case, this yields Δ D buffer mixed = 27.5 × ( 0.8 × 1.5 + 0.15 × 0.8 + 0.05 × 0.3 ) = 27.5 × 1.335 = 36.7 m. The key parameters of the proposed model are summarized in Table 3.

3.4.4. Final Warning Distance

The final dynamic warning distance is the sum of the risk propagation distance and the safety buffer:
D mixed = D risk mixed + Δ D buffer mixed .
For the Meizhou–Dapu Expressway case, D risk mixed = 115.9 m and Δ D buffer mixed = 36.7 m, yielding D mixed = 115.9 + 36.7 = 152.6 m. Rounding conservatively, the recommended dynamic warning distance is 153 m.
This distance is recalculated every 30 s using real-time data on vehicle composition, speed, and flow, enabling adaptive warning strategies that balance safety and efficiency.

4. Illustrative Application: Counterfactual Reconstruction of the 2024 Meizhou–Dapu Expressway Collapse

4.1. Disaster Background and Data

On 1 May 2024, at 1:57 AM, a catastrophic embankment collapse occurred on the Meizhou–Dapu Expressway in Guangdong Province, China, at section K11+900–K11+950. The collapse resulted in 23 vehicles falling into the sinkhole, causing 52 fatalities and 30 injuries. According to the official investigation report, the disaster was triggered by prolonged heavy rainfall that saturated the embankment foundation. At the time of the incident, there was light rain and poor visibility, and traffic volume was higher than usual for that hour.
To apply the proposed dynamic warning distance model, we reconstruct the traffic conditions upstream of the collapse point based on the investigation report and typical nighttime traffic characteristics. The following input parameters are adopted for the illustrative case study. First, the traffic composition is assumed to be 80% HDVs, 15% ADASVs, and 5% AVs; the 5% AV proportion is a forward-looking illustrative value rather than a measured quantity. Second, the average speed is v 0 = 27.5 m/s (99 km/h), consistent with the expressway speed limit. Third, the traffic flow is Q = 1800 veh/h, an upper-bound scenario designed to stress-test the model. This value is consistent with the traffic surge noted in the official investigation report—which stated that the traffic volume at the time of the incident was “significantly higher than usual”—and with the Ministry of Transport’s forecast that national expressway daily traffic during the 2024 May Day holiday would reach approximately 1.8 times the normal volume [53]. Precise minute-by-minute traffic counts for the specific time and location are unavailable. Fourth, the road capacity is Q max = 2000 veh/h, typical for a four-lane divided highway. The baseline response times for each vehicle class are as listed in Table 1, yielding a weighted-average reaction time of 1.805 s. The safety buffer is computed using the time-headway formulation described in Section 3.4. For the interaction delay, the calibrated 85th percentile simulation delay Δ T sim is taken from Table 2, and the pure interaction delay Δ T interaction is derived from it as detailed in Section 3.3. The cascading coefficient is set to k = 0.3 s. The sensitivity analysis presented in Section 4.3 further explores a wide range of flow rates and AV penetration levels, ensuring robustness to these illustrative assumptions.

4.2. Model Calculation and Results

Following the methodological framework established in Section 3, the dynamic warning distance is computed by sequentially applying the derived equations to the Meizhou–Dapu Expressway case. Each step corresponds directly to a component of the theoretical model, illustrating how the heterogeneous characteristics of the traffic stream translate into a quantitative warning threshold.

4.2.1. Weighted Response Time

The weighted-average response time captures the overall reactivity of the mixed-traffic stream by combining the baseline response times of each vehicle type with their respective proportions. Using the values from Table 1 and the observed traffic composition, we obtain the following:
T weighted = 0.8 × 2.0 + 0.15 × 1.2 + 0.05 × 0.5 = 1.805 s .
This value lies between the HDV baseline of 2.0 s and the AV baseline of 0.5 s, weighted toward the dominant HDV population. It represents the expected mean reaction time if all vehicles responded independently without interaction effects.

4.2.2. Risk Propagation Time Incorporating Interaction Effects

Vehicle interactions introduce additional delays beyond individual response times. From the calibrated simulation data, with ω 1 = 0.8 and Q = 1800 veh/h, the 85th percentile of the simulated total delay relative to the all-AV baseline is Δ T sim = 3.50 s. The pure interaction delay, which isolates the conflict-induced component from reaction-time heterogeneity, is then computed as Δ T interaction = Δ T sim ( T weighted T AV base ) = 3.50 ( 1.805 0.5 ) = 2.195 s. The total risk propagation time therefore becomes T risk mixed = T weighted + Δ T interaction = 1.805 + 2.195 = 4.00 s. This value reflects the cumulative delay as the hazard information propagates upstream through a heterogeneous queue, accounting for both the slower reactions of human drivers and the conflicts among vehicles with different capabilities.

4.2.3. Cascading Reaction Delay

The cascading reaction delay quantifies the extra time needed for following AVs to respond when a preceding HDV brakes abruptly. By applying the cascading delay expression from Section 3.4 with calibrated coefficient k = 0.3 , the result is obtained:
Δ T cascade = k · ω 1 · Q Q max = 0.3 × 0.8 × 1800 2000 = 0.216 s .
This term captures the chain-reaction effect that is particularly pronounced when HDVs are abundant and traffic density is high, as in the present scenario.

4.2.4. Risk Propagation Distance

The distance required for vehicles to complete their evasive maneuvers after the total reaction time is obtained by multiplying the combined temporal delay by the prevailing speed:
D risk mixed = v 0 T risk mixed + Δ T cascade = 27.5 × ( 4.00 + 0.216 ) = 27.5 × 4.216 = 115.9 m .
This 115.9 m represents the theoretical minimum distance from the hazard point at which vehicles could stop if their responses were perfectly coordinated and no additional safety margin were required.

4.2.5. Safety Buffer Distance

To accommodate real-world uncertainties—including sensor errors, actuator delays, and inter-driver variability—a safety buffer is added. Instead of fixed distances, a time-headway approach consistent with traffic engineering practice is adopted. The buffer distance is computed as Δ D buffer mixed = v 0 · ( ω 1 t buffer HDV + ω 2 t buffer ADASV + ω 3 t buffer AV ) , where t buffer HDV = 1.5 s, consistent with the perception time component of the AASHTO perception–reaction time model [7]; t buffer ADASV = 0.8 s, corresponding to the minimum selectable steady-state time headway specified in ISO 15622 for ACC systems [51]; and t buffer AV = 0.3 s, representing the minimum string-stable time headway demonstrated for CACC-equipped automated vehicle platoons by Vegamoor et al. [52]. For the Meizhou–Dapu Expressway case, this yields Δ D buffer mixed = 27.5 × ( 0.8 × 1.5 + 0.15 × 0.8 + 0.05 × 0.3 ) = 27.5 × 1.335 = 36.7 m. This buffer is largest for HDVs (1.5 s) due to their greater unpredictability and smallest for AVs (0.3 s) reflecting their precision.

4.2.6. Final Dynamic Warning Distance

The final dynamic warning distance is the sum of the risk propagation distance and the safety buffer:
D mixed = D risk mixed + Δ D buffer mixed .
For the Meizhou–Dapu Expressway case, D risk mixed = 115.9 m and Δ D buffer mixed = 36.7 m, yielding D mixed = 115.9 + 36.7 = 152.6 m. Rounding conservatively, the recommended dynamic warning distance is 153 m.
This distance is recalculated every 30 s using real-time data on vehicle composition, speed, and flow, enabling adaptive warning strategies that balance safety and efficiency.

4.2.7. Distinction Between Warning Distance and Stopping Sight Distance

It is crucial to distinguish between the dynamic warning distance computed by the proposed model and the conventional stopping sight distance prescribed by highway design standards. Stopping sight distance is the minimum longitudinal distance required for a single vehicle to perceive a hazard, react, and brake to a complete stop. It is a vehicle-centric safety metric. Dynamic warning distance is the upstream distance from the hazard point at which a warning message should be disseminated to the approaching mixed-traffic stream. It accounts not only for individual vehicle braking but also for the risk propagation time—the cumulative delay as hazard information travels upstream through a heterogeneous queue. Consequently, the dynamic warning distance is inherently larger than the stopping sight distance for a given speed when the traffic stream is dominated by slow-reacting human drivers. However, as the penetration of fast-reacting automated vehicles increases, the risk propagation time decreases substantially, allowing the dynamic warning distance to approach—and even fall below—the conventional stopping sight distance.

4.2.8. Worst-Case Safety Verification

To address the concern regarding the safety margin for the slowest-reacting vehicles under adverse conditions, we explicitly compute the stopping distance required by a worst-case HDV on wet pavement. Following AASHTO guidelines, the 85th percentile reaction time of 2.0 s is adopted as the design value. Assuming a wet-pavement deceleration of 5.5 m/s2, the required stopping distance is D stop worst = v 0 t r + v 0 2 / ( 2 a wet ) = 27.5 × 2.0 + 27 . 5 2 / ( 2 × 5.5 ) = 55.0 + 68.75 = 123.75 m. The proposed dynamic warning distance of 153 m exceeds this worst-case requirement by approximately 29 m, confirming that even under degraded friction conditions, HDV-dominated traffic is adequately protected.
For the ADASV-dominated and AV-dominated compositions reported in Table 4, the warning distances of 62 m and 42 m respectively fall below the 123.75 m worst-case stopping distance of an isolated HDV on wet pavement. These shorter distances assume that the residual HDVs (20% and 10% of the traffic stream, respectively) receive hazard alerts through V2X communication or benefit from collective deceleration initiated by surrounding automated vehicles. This assumption is plausible but has not been explicitly modeled in the present study. Therefore, the efficiency gains observed in these two scenarios should be regarded as potential benefits achievable under high automation penetration with reliable V2X infrastructure, rather than as unconditionally safe thresholds for immediate deployment. A dedicated examination of this assumption is identified as a priority for future work.

4.2.9. Interpretation and Practical Significance

The computed value of 153 m represents the minimum upstream distance at which warnings should be activated to ensure that all approaching vehicles, regardless of their automation level, can safely respond to the collapsed roadway. For a fair and internally consistent comparison, the conventional stopping sight distance is recomputed at the same speed of 27.5 m/s under wet-pavement conditions (deceleration 5.5 m/s2), yielding 174 m, comprising a 2.0 s perception–reaction distance (55 m), a braking distance of 69 m, and a 50 m safety buffer. The dynamic warning distance is 12% shorter than this speed-matched wet-pavement baseline, demonstrating that the model maintains safety while offering a modest efficiency improvement in HDV-dominated traffic.
If such a warning had been disseminated within 13 s of the initial collapse (a realistic latency for an automated detection and broadcast system), vehicles located 500 m upstream would have gained approximately 18 s of advance notice. At 27.5 m/s, this would allow drivers to reduce speed gradually or change lanes well before reaching the hazard, potentially preventing the sequential fall-in of multiple vehicles that contributed to the high casualty count. The 153 m threshold thus balances the competing objectives of safety (ensuring adequate reaction time) and efficiency (avoiding unnecessarily long warnings that could induce congestion or driver complacency).

4.2.10. Comparison with Alternative Formulations

To situate the 85th-percentile approach adopted in this study, Table 4 compares the warning distance obtained under four alternative reaction-time benchmarks for the same Mei–Da traffic composition.
The 85th-percentile approach yields a warning distance of 153 m, which lies between the potentially unsafe weighted-average threshold (92 m) and the more conservative worst-case estimate (175 m). This confirms that the model achieves a balanced trade-off between safety and operational efficiency.

4.3. Sensitivity Analysis

The model’s adaptability is tested by varying key parameters while keeping others constant. First, the overall simulated delay surface derived from microsimulation is examined. Figure 1 presents a heatmap of the 85th percentile simulation delay Δ T sim as a function of HDV proportion ω 1 and traffic flow Q, which serves as the foundation for the subsequent sensitivity analyses. The small negative values occasionally observed along ω 1 = 0 in the raw simulation output arise from statistical noise when subtracting the stochastic all-AV baseline and have been set to zero in the figure; for all practical purposes, the delay at ω 1 = 0 is zero.

4.3.1. Influence of Vehicle Composition

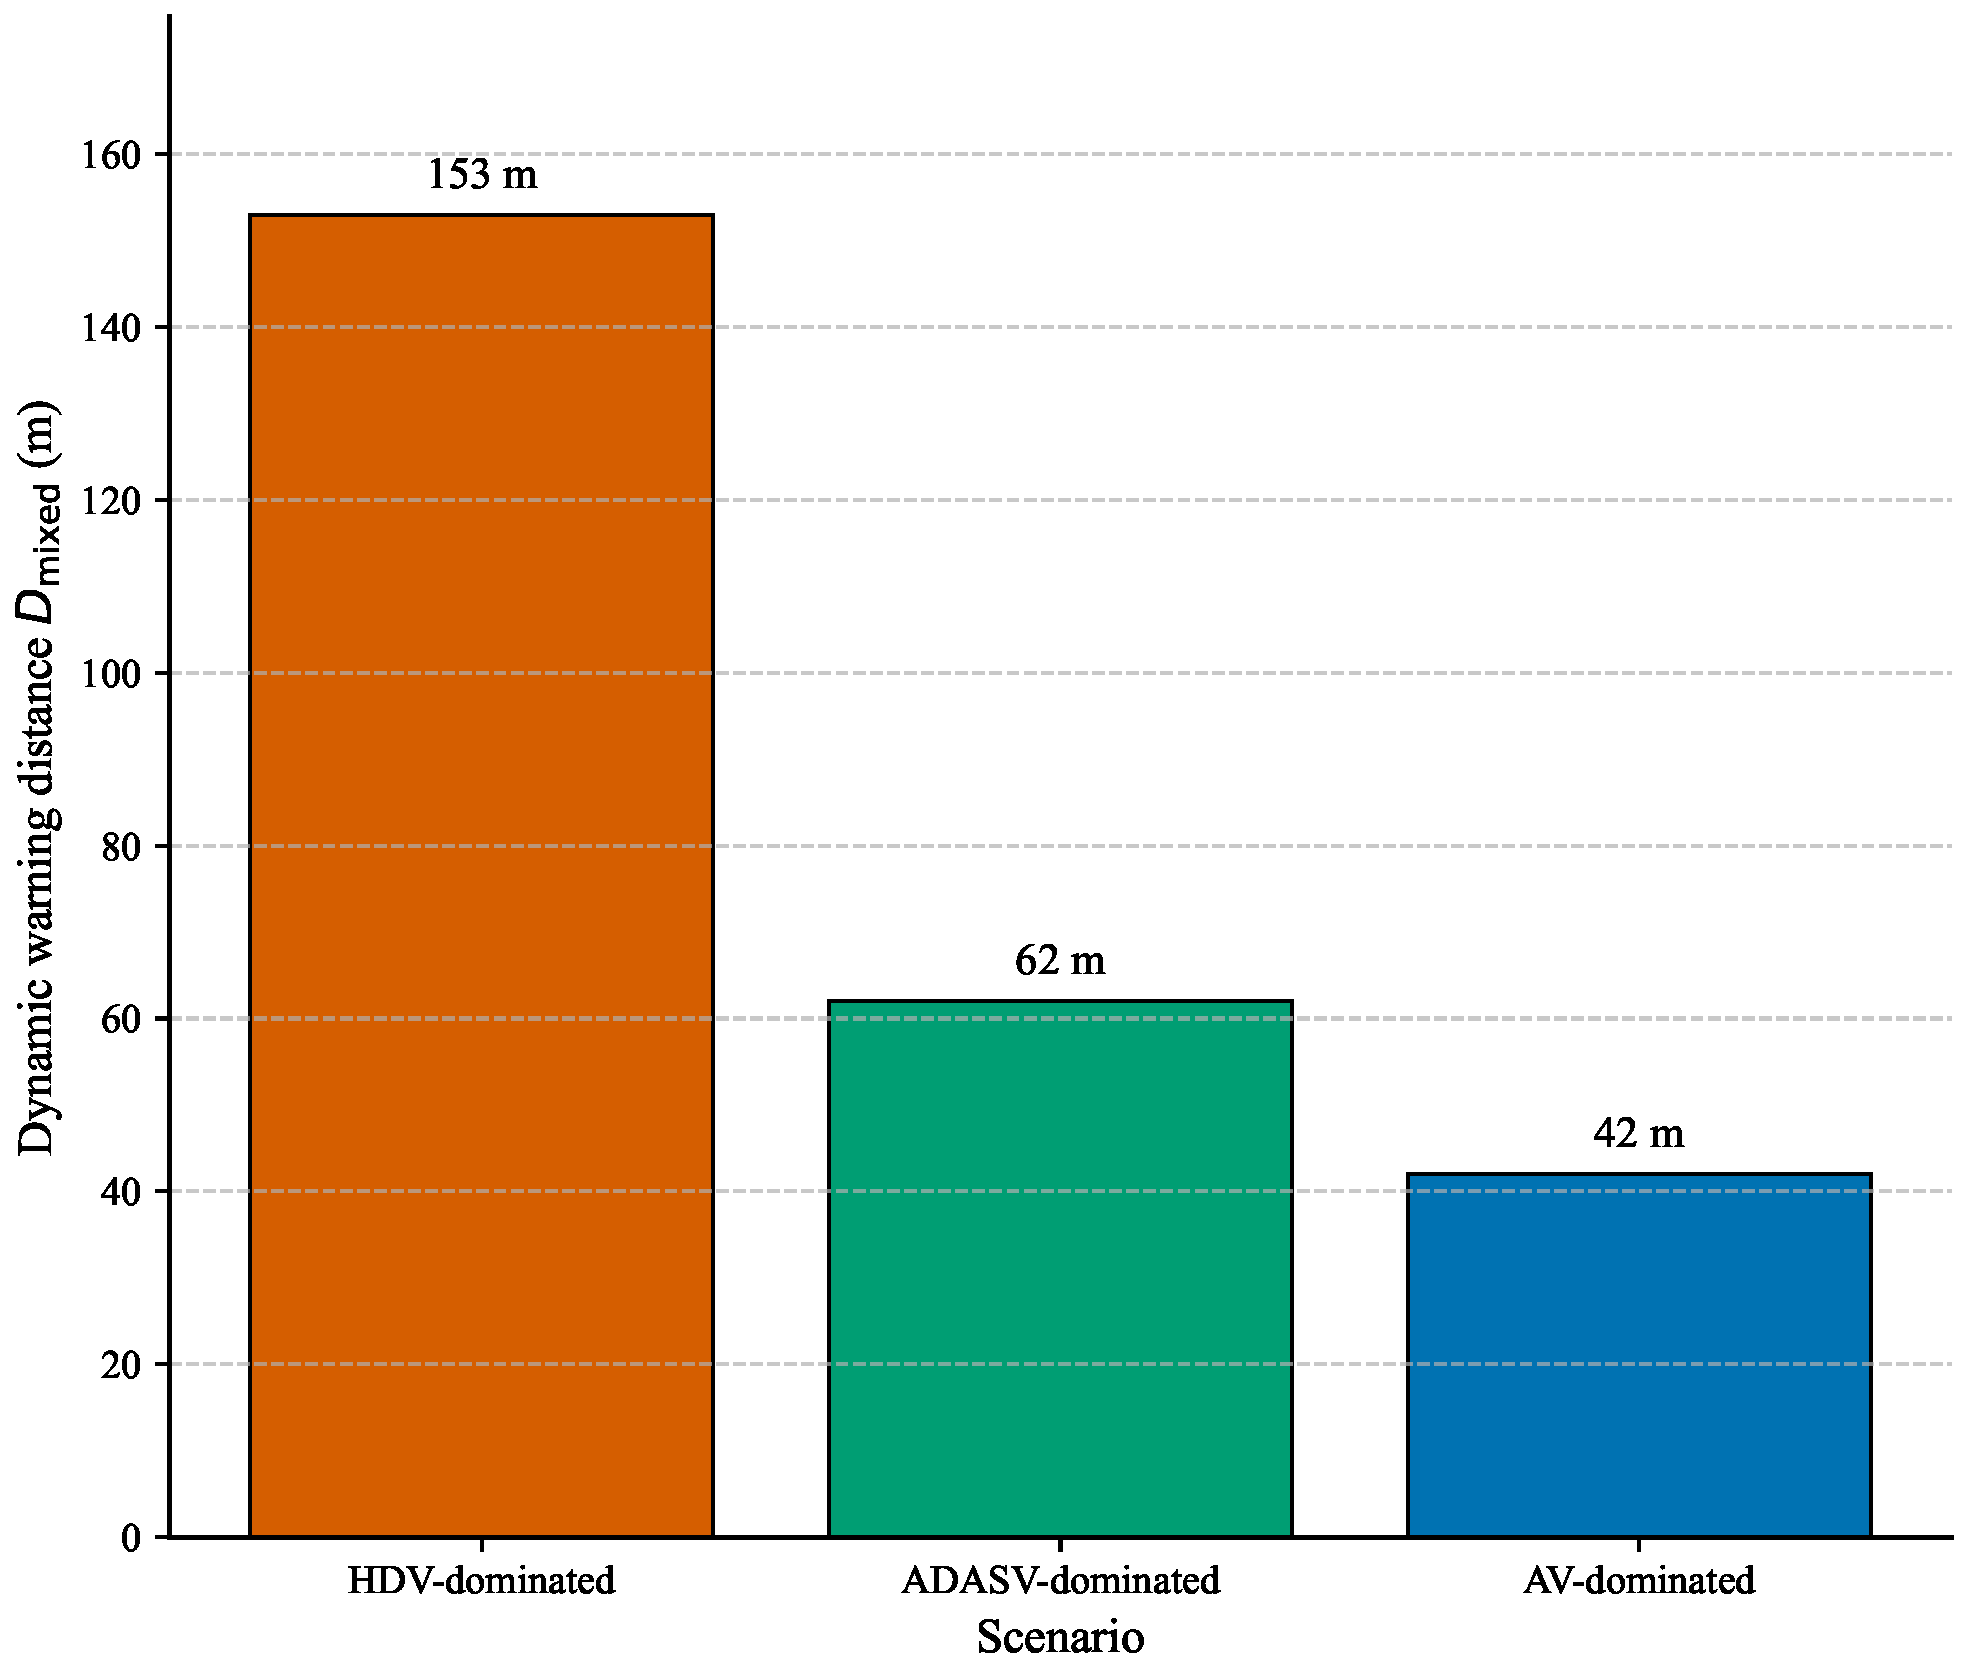
Table 5 shows the resulting warning distance for three representative traffic compositions, with the same speed (27.5 m/s) and flow (1800 veh/h). As the proportion of AVs increases, the required warning distance decreases significantly, reflecting the faster response capabilities of automated vehicles.
Figure 2 visually compares the warning distances for the three scenarios, clearly illustrating the substantial reduction in required warning distance as vehicle automation increases.

4.3.2. Influence of Traffic Flow

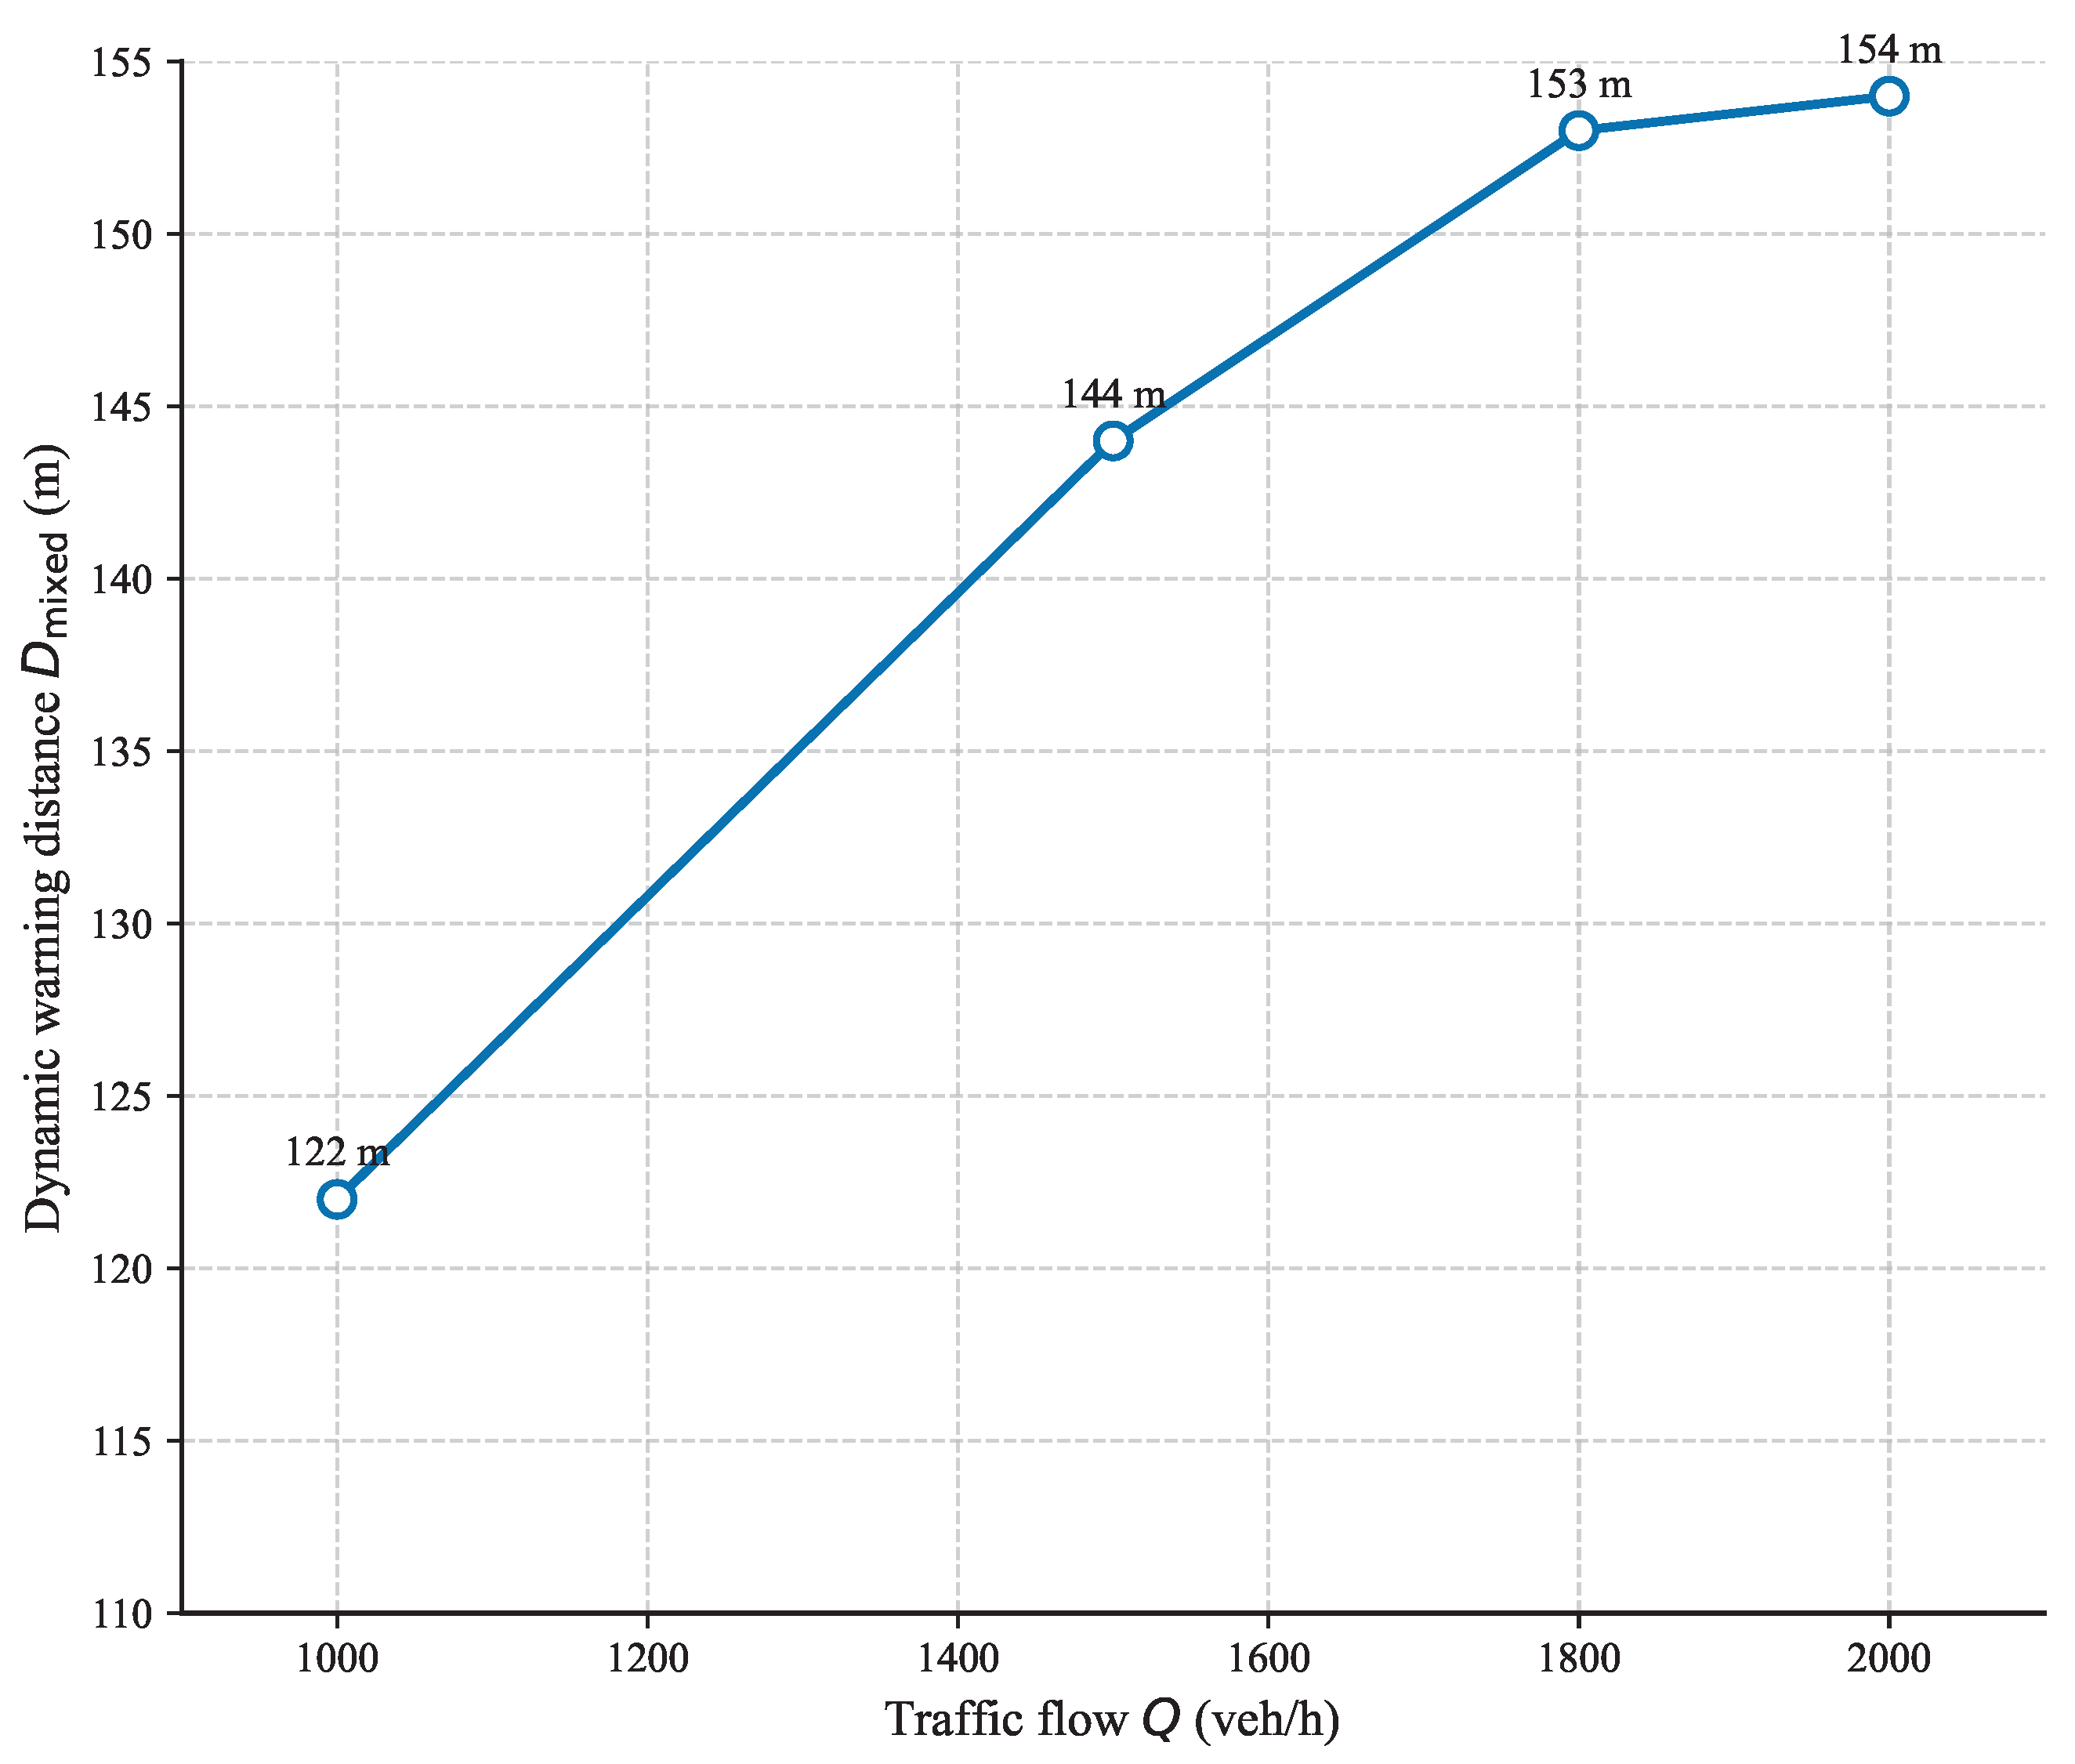
With the HDV-dominated composition (80-15-5), the warning distance increases monotonically with traffic flow, though the rate of increase diminishes as flow approaches capacity. At lower flows, the distance increases as growing density intensifies interaction delays and cascading effects. However, as flow approaches capacity, the distance stabilizes. Results are summarized in Table 6.
Figure 3 depicts the relationship between traffic flow and warning distance.
These sensitivity analyses confirm that the model dynamically adapts to real-time traffic conditions. The warning distance is highly sensitive to vehicle composition, decreasing substantially when AVs dominate the traffic stream, although the shorter distances in low-HDV scenarios assume that residual HDVs receive V2X-based alerts (see Section 4.2.8). The relationship with traffic flow shows a monotonically increasing trend, rising from 122 m at 1000 veh/h to 154 m at 2000 veh/h, with the rate of increase gradually diminishing as flow approaches capacity, which is consistent with the moderating effect of interaction delays at high densities where vehicle interactions are already frequent even in the baseline all-AV scenario. This behavior underscores the importance of accounting for both vehicle heterogeneity and traffic density when determining appropriate warning thresholds.

4.3.3. Sensitivity to the Cascading Coefficient

The cascading coefficient k in the expression for Δ T cascade defined in Section 3.4 was varied from 0.1 to 0.5 s to assess its influence. Table 7 lists the resulting warning distances.
Over the explored range, D mixed varies by only ± 2.6 % around the nominal value, confirming that the model’s conclusions are not overly sensitive to the precise choice of k.

5. Discussion

5.1. Comparison with Conventional Stopping Sight Distance

For a meaningful and internally consistent comparison, the conventional stopping sight distance is recomputed at the incident speed of 27.5 m/s under the same wet-pavement conditions assumed in the worst-case verification. Following standard practice, the stopping sight distance comprises a perception–reaction distance of 2.0 × 27.5 = 55 m, a braking distance on wet pavement ( a = 5.5 m/s2) of 27 . 5 2 / ( 2 × 5.5 ) 69 m, and a safety buffer of 50 m. This yields a total stopping sight distance of 174 m. The proposed dynamic model yields a warning distance of 153 m under the same speed and HDV-dominated composition. Although numerically similar, the dynamic distance explicitly incorporates fleet-level risk propagation delay ( T risk = 4.00 s), cascading reaction delays ( 0.216 s), and a time-headway-based safety buffer ( 36.7 m). The dynamic warning distance is 12% shorter than the wet-pavement conventional SSD and exceeds the worst-case HDV stopping distance by 29 m, confirming that the model maintains safety while offering modestly improved efficiency over the static threshold. More importantly, the dynamic model demonstrates its true value when the traffic composition shifts toward higher automation. As shown in Table 5, for an AV-dominated scenario the warning distance falls to 42 m—less than one-quarter of the wet-pavement conventional SSD—under the assumption that residual HDVs receive alerts through V2X communication. This potential reduction is achieved because the rapid, coordinated responses of AVs and ADASVs drastically shrink the risk propagation time. The model thus enables infrastructure operators to safely relax warning thresholds as the vehicle fleet evolves, unlocking efficiency gains that fixed standards cannot capture.

5.2. Implications for Traffic Management and Infrastructure

The findings have several practical implications for road authorities and transportation planners. First, fixed signage with static distances should be supplemented or replaced by variable message signs that display real-time warnings based on current traffic composition and flow. Such systems require integration with roadside sensors and communication links to a central processing unit. Second, the full benefit of the model is realized when vehicles can receive warnings digitally. For HDVs, visual messages on dynamic signs suffice; for ADASVs and AVs, direct V2X messages can trigger automatic deceleration or path planning, further reducing the effective warning distance in scenarios where V2X coverage is sufficient to alert residual HDVs. Deployment of roadside units along highways should be prioritized in corridors with significant automated vehicle traffic. Third, regulatory agencies could adopt graduated warning distance requirements that depend on the observed or projected market penetration of automated vehicles. In the near term, a conservative baseline might be retained, but as automation becomes widespread, standards could be relaxed to the dynamic values predicted by models like the one presented here.

5.3. Implementation of Dynamic Updating

The model is designed to operate with a 30 s update interval, which aligns with typical traffic data aggregation cycles in modern traffic management systems. Real-time inputs, including vehicle composition from roadside camera analytics, speed from radar, and flow from inductive loops, are fed into the model every 30 s. The resulting warning distance is then disseminated via variable message signs or V2X roadside units. Future work could investigate the optimal update frequency under rapidly changing traffic conditions and its interaction with communication latency.

5.4. Synergy with Onboard Sensors and V2X Communication

The proposed warning distance serves as the infrastructure-side information dissemination point. For HDVs, this warning is displayed on variable message signs. For ADASVs and AVs equipped with V2X receivers, the warning can be transmitted directly to the vehicle, triggering automatic deceleration or lane-change planning. In scenarios where the warning distance is shorter than the onboard sensor range, the vehicle may also detect the hazard independently. The model’s output therefore represents a system-level safety guarantee, while onboard sensing provides an additional layer of redundancy. This synergy is particularly valuable during the transition period when V2X penetration is incomplete.

5.5. Limitations and Future Research Directions

While the model provides a robust framework, six limitations should be acknowledged and addressed in future work. First, the simulation-based calibration of the interaction delay relies on SUMO simulations with assumed driver behavior parameters. Empirical validation using naturalistic driving data or field experiments with mixed traffic would strengthen confidence in the lookup table values. Second, the current model does not explicitly incorporate weather conditions, which can significantly affect both human driver reaction times and sensor performance. A weather-dependent friction adjustment factor should be explored. Third, the optimal update frequency depends on the volatility of traffic flow and should be investigated further. Fourth, the model assumes that the disaster has already been detected. A complete system would combine real-time hazard detection with the warning distance calculation presented here. Fifth, the response time for HDVs is treated as a deterministic value, but a probabilistic treatment could provide a more nuanced safety assessment. Sixth, the worst-case safety margin has been verified in detail only for HDV-dominated traffic. In the ADASV- and AV-dominated scenarios (Table 5), the model assumes that the remaining HDVs benefit from V2X-based alerts or collective deceleration guided by surrounding automated vehicles. This assumption is plausible but has not been explicitly modeled; future work should validate it through simulation with explicit communication delays and interaction protocols. Future work should prioritize empirical validation, weather-dependent extensions, and explicit modeling of V2X-assisted alerting for residual HDVs to enhance the model’s practical applicability.

6. Conclusions

This paper has proposed a dynamic warning distance model for road disaster risks in mixed-traffic flow, explicitly accounting for the heterogeneous response capabilities of HDVs, ADASVs, and AVs. The main contributions are summarized as follows. First, a clear classification of vehicle response capabilities based on perception range and reaction time was established. Second, a simulation-calibrated interaction delay was introduced, isolating the pure effect of vehicle conflicts from reaction-time heterogeneity. Third, cascading reaction delays and a time-headway-based safety buffer were incorporated, yielding an adaptive warning distance. Fourth, a counterfactual reconstruction of the 2024 Meizhou–Dapu Expressway collapse demonstrated the model’s behavior. For the reconstructed HDV-dominated conditions, the dynamic warning distance was 153 m, which is 12% shorter than the speed-matched conventional stopping sight distance of 174 m computed under consistent wet-pavement assumptions. Worst-case verification confirmed that even the slowest HDV on wet pavement can stop safely with approximately 29 m to spare. Fifth, sensitivity analysis showed that the model adapts strongly to vehicle composition: warning distances reduce to as low as 42 m in AV-dominated scenarios—a potential reduction of up to 73% compared with the HDV-dominated baseline—provided that residual HDVs are supported by V2X-based alerting or collective deceleration, illustrating the efficiency potential of automation under high connectivity.

Supplementary Materials

The following supporting information can be downloaded at https://www.mdpi.com/article/10.3390/ijgi15050224/s1: Table S1: Statistical summaries of simulated delay ( Δ T sim ) across all HDV proportion and traffic flow combinations (mean, 85th percentile, 95th percentile, and maximum). Table S2: Raw simulation data for all scenarios. The supplementary package also includes the SUMO simulation script and figure generation scripts.

Author Contributions

Conceptualization, Yanbin Hu; methodology, Yanbin Hu; software, Yanbin Hu; validation, Yanbin Hu, Wenhui Zhou, Yi Li and Hongzhi Miao; formal analysis, Yanbin Hu; investigation, Yanbin Hu, Wenhui Zhou, Yi Li and Hongzhi Miao; resources, Yanbin Hu; data curation, Yanbin Hu; writing—original draft preparation, Yanbin Hu; writing—review and editing, Wenhui Zhou, Yi Li and Hongzhi Miao; visualization, Yanbin Hu; supervision, Yanbin Hu; project administration, Yanbin Hu; funding acquisition, Yanbin Hu. All authors have read and agreed to the published version of the manuscript.

Funding

This research was supported by the National Key Research and Development Program of China (Grant No. 2024YFC3017100).

Data Availability Statement

The data presented in this study are available in the Supplementary Materials.

Conflicts of Interest

The authors declare no conflicts of interest.

References

  1. Dong, S.; Gao, X.; Mostafavi, A.; Gao, J. Modest flooding can trigger catastrophic road network collapse due to compound failure. Commun. Earth Environ. 2022, 3, 38. [Google Scholar] [CrossRef]
  2. Guangdong Provincial Government Investigation and Assessment Team. Investigation and Assessment Report on the “5·1” Collapse Disaster at the Chayang Section of Mei-Da Expressway; Government Investigation Report; Guangdong Provincial People’s Government: Guangzhou, China, 2025. (In Chinese)
  3. Siwach, V.; Yadav, D.; Redhu, P. Enhancing driver’s attention and overtaking efficiency in car-following model for Advanced Driver Assistance Systems (ADAS) vehicles. Phys. A Stat. Mech. Its Appl. 2025, 657, 130207. [Google Scholar] [CrossRef]
  4. Wang, J.; Wang, H.; Song, J.; Chen, X.; Guo, J.; Li, K.; Li, X.; Huang, B. Knowledge-guided self-learning control strategy for mixed vehicle platoons with delays. Nat. Commun. 2025, 16, 7705. [Google Scholar] [CrossRef]
  5. Brown, D.F.; Dunn, W.E. Application of a quantitative risk assessment method to emergency response planning. Comput. Oper. Res. 2007, 34, 1243–1265. [Google Scholar] [CrossRef]
  6. mei Gai, W.; Du, Y.; feng Deng, Y. Evacuation risk assessment of regional evacuation for major accidents and its application in emergency planning: A case study. Saf. Sci. 2018, 106, 203–218. [Google Scholar] [CrossRef]
  7. American Association of State Highway and Transportation Officials. A Policy on Geometric Design of Highways and Streets, 2018, 7th ed.; Publication Code: GDHS-7; American Association of State Highway and Transportation Officials: Washington, DC, USA, 2018. [Google Scholar]
  8. JTG B01-2014; Technical Standard of Highway Engineering. China Communications Press: Beijing, China, 2014.
  9. Chang, X.; Li, H.; Rong, J.; Zhao, X.; Li, A. Analysis on traffic stability and capacity for mixed traffic flow with platoons of intelligent connected vehicles. Phys. A Stat. Mech. Its Appl. 2020, 557, 124829. [Google Scholar] [CrossRef]
  10. Jiang, Y.; Cong, H.; Chen, H.; Yao, Z. Safety evaluation for mixed traffic flow of CAVs with different automation and connection levels. Expert Syst. Appl. 2025, 261, 125561. [Google Scholar] [CrossRef]
  11. Li, X.; Xiao, Y.; Zhao, X.; Ma, X.; Wang, X. Modeling mixed traffic flows of human-driving vehicles and connected and autonomous vehicles considering human drivers’ cognitive characteristics and driving behavior interaction. Phys. A Stat. Mech. Its Appl. 2023, 609, 128368. [Google Scholar] [CrossRef]
  12. Zhao, Y.; Hua, X.; Yu, W.; Lin, W.; Wang, W.; Zhou, Q. Safety and efficiency-oriented adaptive strategy controls for connected and automated vehicles in unstable communication environment. Accid. Anal. Prev. 2025, 220, 108121. [Google Scholar] [CrossRef] [PubMed]
  13. Wu, Z.; Li, M.; Guo, Y.; Li, Z.; Wang, S. A cross-scale traffic-communication control framework for improving safety through proactive congestion mitigation in mixed traffic. Accid. Anal. Prev. 2026, 226, 108339. [Google Scholar] [CrossRef]
  14. Praticò, F.G. Impact of pavement friction decay on speed limits and autonomous vehicles: A theoretical and experimental study. J. Road Eng. 2025, 5, 35–47. [Google Scholar] [CrossRef]
  15. Zhou, J.; Zhu, F. Modeling the fundamental diagram of mixed human-driven and connected automated vehicles. Transp. Res. Part C Emerg. Technol. 2020, 115, 102614. [Google Scholar] [CrossRef]
  16. National Academies of Sciences, Engineering and Medicine. A Guide for Assessing Community Emergency Response Needs and Capabilities for Hazardous Materials Releases; Technical Report; The National Academies Press: Washington, DC, USA, 2011. [Google Scholar]
  17. Wang, W.; Zhang, N.; Wang, L.; Wang, Z.; Ma, D. A Study of Influence Distance and Road Safety Avoidance Distance from Postearthquake Building Debris Accumulation. Adv. Civ. Eng. 2020, 2020, 7034517. [Google Scholar] [CrossRef]
  18. Moradi-Pari, E.; Tian, D.; Bahramgiri, M.; Rajab, S.; Bai, S. DSRC Versus LTE-V2X: Empirical Performance Analysis of Direct Vehicular Communication Technologies. IEEE Trans. Intell. Transp. Syst. 2023, 24, 4889–4903. [Google Scholar] [CrossRef]
  19. Khoury, J.; Amine, K.; Saad, R.A. An Initial Investigation of the Effects of a Fully Automated Vehicle Fleet on Geometric Design. J. Adv. Transp. 2019, 2019, 6126408. [Google Scholar] [CrossRef]
  20. Zeleke, Y.S.; Tira, M.; Scaini, C. Resilience of road networks to natural hazards: A systematic literature review. Transp. Eng. 2026, 23, 100420. [Google Scholar] [CrossRef]
  21. Azam, M.; Hassan, S.A.; Che Puan, O. Autonomous Vehicles in Mixed Traffic Conditions—A Bibliometric Analysis. Sustainability 2022, 14, 10743. [Google Scholar] [CrossRef]
  22. Mousavi, S.M.; Osman, O.A.; Lord, D.; Dixon, K.K.; Dadashova, B. Investigating the safety and operational benefits of mixed traffic environments with different automated vehicle market penetration rates in the proximity of a driveway on an urban arterial. Accid. Anal. Prev. 2021, 152, 105982. [Google Scholar] [CrossRef]
  23. Karimi, M.; Roncoli, C.; Alecsandru, C.; Papageorgiou, M. Cooperative merging control via trajectory optimization in mixed vehicular traffic. Transp. Res. Part C Emerg. Technol. 2020, 116, 102663. [Google Scholar] [CrossRef]
  24. Wu, Y.; Kihara, K.; Takeda, Y.; Sato, T.; Akamatsu, M.; Kitazaki, S.; Nakagawa, K.; Yamada, K.; Oka, H.; Kameyama, S. Eye movements predict driver reaction time to takeover request in automated driving: A real-vehicle study. Transp. Res. Part F Traffic Psychol. Behav. 2021, 81, 355–363. [Google Scholar] [CrossRef]
  25. Miqdady, T.; de Oña, R.; de Oña, J. Traffic Safety Sensitivity Analysis of Parameters Used for Connected and Autonomous Vehicle Calibration. Sustainability 2023, 15, 9990. [Google Scholar] [CrossRef]
  26. Jansen, P.; Colley, M.; Rukzio, E. A Design Space for Human Sensor and Actuator Focused In-Vehicle Interaction Based on a Systematic Literature Review. Proc. ACM Interact. Mob. Wearable Ubiquitous Technol. 2022, 6, 56. [Google Scholar] [CrossRef]
  27. Kamrani, M.; Concas, S.; Kourtellis, A.; Rabbani, M.; Kummetha, V.C.; Dokur, O. Drivers’ reactions to connected vehicle forward collision warnings: Leveraging real-world data from the THEA CV pilot. Transp. Res. Part F Traffic Psychol. Behav. 2023, 92, 108–120. [Google Scholar] [CrossRef]
  28. Peng, H.; Chen, F.; Chen, P. Examining the Effects of Visibility and Time Headway on the Takeover Risk during Conditionally Automated Driving. Int. J. Environ. Res. Public Health 2022, 19, 13904. [Google Scholar] [CrossRef]
  29. Sekadakis, M.; Yannis, G. Systematic review and meta-analysis of take-over time from automated driving at SAE levels 2 and 3 to manual control. Transp. Res. Part F Traffic Psychol. Behav. 2025, 113, 263–306. [Google Scholar] [CrossRef]
  30. Sekadakis, M.; Trösterer, S.; Mörtl, P.; Yannis, G. Identifying driving profiles after take over request in automated vehicles at SAE levels 2 and 3. Transp. Res. Part F Traffic Psychol. Behav. 2025, 111, 250–263. [Google Scholar] [CrossRef]
  31. Scully, I.; Davis, S.; Shlanta, P.; Yanes, J.; Michaelis, K.; Cades, D. Looking Back on Forward Collision Warnings: A Review of Perception Response Times from Empirical Studies. Proc. Hum. Factors Ergon. Soc. Annu. Meet. 2024, 68, 1627–1633. [Google Scholar] [CrossRef]
  32. J3016; Taxonomy and Definitions for Terms Related to Driving Automation Systems for On-Road Motor Vehicles. SAE International: Warrendale, PA, USA, 2021.
  33. Van Brummelen, J.; O’Brien, M.; Gruyer, D.; Najjaran, H. Autonomous vehicle perception: The technology of today and tomorrow. Transp. Res. Part C Emerg. Technol. 2018, 89, 384–406. [Google Scholar] [CrossRef]
  34. Aeva Technologies, Inc. Aeva Introduces Atlas Ultra, Its Slimmest High-Resolution Long-Range 4D LiDAR Sensor at CES 2025; Aeva Official: Mountain View, CA, USA, 2025. [Google Scholar]
  35. Zhang, Y.; Hu, Z.; Hang, P.; Lou, S.; Lv, C. Human–machine cooperative decision-making and planning for automated vehicles using spatial projection of hand gestures. Adv. Eng. Inform. 2024, 62, 102864. [Google Scholar] [CrossRef]
  36. Huang, C.; Huang, H.; Zhang, J.; Hang, P.; Hu, Z.; Lv, C. Human-Machine Cooperative Trajectory Planning and Tracking for Safe Automated Driving. IEEE Trans. Intell. Transp. Syst. 2022, 23, 12050–12063. [Google Scholar] [CrossRef]
  37. Zhou, Y.; Lin, Y.; Ahn, S.; Wang, P.; Wang, X. Platoon Trajectory Completion in a Mixed Traffic Environment Under Sparse Observation. IEEE Trans. Intell. Transp. Syst. 2022, 23, 16217–16226. [Google Scholar] [CrossRef]
  38. He, Y.; Kong, Y. Traffic Impact Analysis of Expressway Accident in Mixed Traffic Environment of Connected and Autonomous Considering Multi-Factor Coupling. IEEE Access 2025, 13, 57342–57353. [Google Scholar] [CrossRef]
  39. Pan, Y.; Wu, Y.; Xu, L.; Xia, C.; Olson, D.L. The impacts of connected autonomous vehicles on mixed traffic flow: A comprehensive review. Phys. A Stat. Mech. Its Appl. 2024, 633, 129454. [Google Scholar] [CrossRef]
  40. Li, J.; Yu, C.; Shen, Z.; Su, Z.; Ma, W. A survey on urban traffic control under mixed traffic environment with connected automated vehicles. Transp. Res. Part C Emerg. Technol. 2023, 154, 104258. [Google Scholar] [CrossRef]
  41. Arvin, R.; Khattak, A.J.; Kamrani, M.; Rio-Torres, J. Safety evaluation of connected and automated vehicles in mixed traffic with conventional vehicles at intersections. J. Intell. Transp. Syst. 2021, 25, 170–187. [Google Scholar] [CrossRef]
  42. Lighthill, M.J.; Whitham, G.B. On kinematic waves II. A theory of traffic flow on long crowded roads. Proc. R. Soc. Lond. A Math. Phys. Sci. 1955, 229, 317–345. [Google Scholar] [CrossRef]
  43. Chen, D.; Srivastava, A.; Ahn, S.; Li, T. Traffic dynamics under speed disturbance in mixed traffic with automated and non-automated vehicles. Transp. Res. Part C Emerg. Technol. 2020, 113, 293–313. [Google Scholar] [CrossRef]
  44. Jin, C.; Qing, L.; Zhu, M.; Peng, G. Phase transitions and spectral entropy of heterogeneous vehicles comprised of CAVs and HDVs in flux restriction scenarios. Chaos Solitons Fractals 2025, 191, 115962. [Google Scholar] [CrossRef]
  45. Garg, M.; Bouroche, M. Can Connected Autonomous Vehicles Improve Mixed Traffic Safety Without Compromising Efficiency in Realistic Scenarios? IEEE Trans. Intell. Transp. Syst. 2023, 24, 6674–6689. [Google Scholar] [CrossRef]
  46. Hou, K.; Zheng, F.; Liu, X. Enhancing mixed traffic safety assessment: A novel safety metric combined with a comprehensive behavioral modeling framework. Accid. Anal. Prev. 2024, 208, 107766. [Google Scholar] [CrossRef]
  47. Hossain, M.; Abdel-Aty, M.; Quddus, M.A.; Muromachi, Y.; Sadeek, S.N. Real-time crash prediction models: State-of-the-art, design pathways and ubiquitous requirements. Accid. Anal. Prev. 2019, 124, 66–84. [Google Scholar] [CrossRef]
  48. Jin, J.; Huang, H.; Yuan, C.; Li, Y.; Zou, G.; Xue, H. Real-time crash risk prediction in freeway tunnels considering features interaction and unobserved heterogeneity: A two-stage deep learning modeling framework. Anal. Methods Accid. Res. 2023, 40, 100306. [Google Scholar] [CrossRef]
  49. Li, J.; He, Y.; Li, Y.; Huang, H.; Wu, D.; Jin, J. Vehicle real-time collision risk prediction: A multi-modal learning approach for diverse urban road scenarios based on a large-scale near-crash event dataset. Eng. Appl. Artif. Intell. 2025, 157, 111299. [Google Scholar] [CrossRef]
  50. Ding, R.; Zhu, Y.; Ma, Y.; Chen, S.; Wang, S. An Advanced Hybrid Framework for Predicting Drivers’ Perception and Response Times in Car-Following Risks in Connected Environments. In Proceedings of the 2025 8th International Conference on Transportation Information and Safety (ICTIS), Granada, Spain, 16–19 July 2025; pp. 228–239. [Google Scholar] [CrossRef]
  51. ISO 15622:2018; Intelligent Transport Systems—Adaptive Cruise Control Systems—Performance Requirements and Test Procedures. International Organization for Standardization: Geneva, Switzerland, 2018.
  52. Vegamoor, V.K.; Kalathil, D.; Rathinam, S.; Darbha, S. Reducing Time Headway in Homogeneous CACC Vehicle Platoons in the Presence of Packet Drops. In Proceedings of the 2019 18th European Control Conference (ECC), Naples, Italy, 25–28 June 2019; pp. 3159–3164. [Google Scholar] [CrossRef]
  53. Ministry of Transport of the People’s Republic of China. Regular Press Conference of the Ministry of Transport. Forecast National Expressway Daily Traffic During the May Day Holiday of Approximately 63.5 Million Vehicles, About 1.8 Times the Normal Daily Volume. 29 April 2024. Available online: https://www.mot.gov.cn (accessed on 7 May 2026).
Figure 1. Heatmap of simulated total delay Δ T sim (85th percentile) as a function of HDV proportion ω 1 and traffic flow Q.
Ijgi 15 00224 g001
Figure 2. Warning distance for different vehicle compositions (data from Table 5).
Ijgi 15 00224 g002
Figure 3. Warning distance as a function of traffic flow for the HDV-dominated scenario (data from Table 6).
Ijgi 15 00224 g003
Table 1. Vehicle response capability stratification.
Vehicle TypePerception RangeReaction
Time (s)
Braking Distance
at 120 km/h (m)
Human-Driven (HDV)Visual, 100–150 m2.0 (typical)110
ADASV (Level 2)Radar + camera, 200–300 m1.2 (typical)70
Automated Vehicle (L3+)Multi-modal + V2X, >500 m0.5 (typical)<50
Table 2. Simulated total delay Δ T sim (s) at the 85th percentile relative to all-AV baseline.
ω 1 Flow Q (veh/h)
1000150018002000
0.20.730.921.031.04
0.51.512.002.222.20
0.82.493.223.503.51
Table 3. Model parameters: symbols, values, and sources.
ParameterSymbolValueSource
HDV reaction time (85th pct) T HDV 2.0 sAASHTO, [22]
ADASV reaction time T ADASV 1.2 s[28,50]
AV reaction time T AV 0.5 s[4,28]
Cascading coefficientk0.3 sempirical, sensitivity tested
Road capacity Q max 2000 veh/hHighway Capacity Manual
HDV buffer headway t buffer HDV 1.5 sAASHTO [7]
ADASV buffer headway t buffer ADASV 0.8 sISO 15622 [51]
AV buffer headway t buffer AV 0.3 sVegamoor et al. [52]
Update interval30 sstandard traffic aggregation
Table 4. Warning distance under alternative reaction-time benchmarks.
FormulationWarning Distance (m)
Weighted-average reaction time (1.805 s)92
85th-percentile reaction time (2.0 s, this study)153
95th-percentile reaction time (2.5 s)160
Worst-case (all HDV, 2.5 s)175
Table 5. Warning distance for different vehicle compositions.
Composition ω 1 (HDV) ω 2 (ADASV) ω 3 (AV) D mixed (m)
HDV-dominated0.800.150.05153
ADASV-dominated0.200.600.2062
AV-dominated0.100.200.7042
Table 6. Warning distance for different traffic flows (HDV-dominated composition).
Q (veh/h) Δ T cascade (s) D mixed (m)
10000.12122
15000.18144
18000.216153
20000.24154
Table 7. Sensitivity of D mixed to k ( ω 1 = 0.8 , Q = 1800 veh/h).
k (s) Δ T cascade (s) D mixed (m)
0.10.072147
0.20.144149
0.30.216153
0.40.288153
0.50.360155
Disclaimer/Publisher’s Note: The statements, opinions and data contained in all publications are solely those of the individual author(s) and contributor(s) and not of MDPI and/or the editor(s). MDPI and/or the editor(s) disclaim responsibility for any injury to people or property resulting from any ideas, methods, instructions or products referred to in the content.