A Lightweight WebGIS Visualization Platform for Historical and Cultural Heritage Based on Multi-Source Data Fusion

Abstract
1. Introduction
- How can heterogeneous, multi-source heritage data be effectively fused and organized within a lightweight WebGIS architecture?
- How can interactive visualization design improve public usability and engagement for cultural heritage-oriented WebGIS platforms?
- Proposes and implements an integrated visualization framework for multi-source historical and cultural spatial data, clarifying the integration mechanisms for geographic information, attribute text, behavioral data, and media resources.
- Designs and develops a complete Web platform with map interaction, dynamic charts, paginated loading, and responsive layout, providing the public with an intuitive, convenient entry point for cultural exploration.
- Verifies the platform’s feasibility and effectiveness in information integration, interaction fluency, and multi-terminal adaptation through functional testing and performance evaluation.
2. Related Work
2.1. Theoretical Foundations
2.2. Evolution of Methods and Technologies in WebGIS for Cultural Heritage
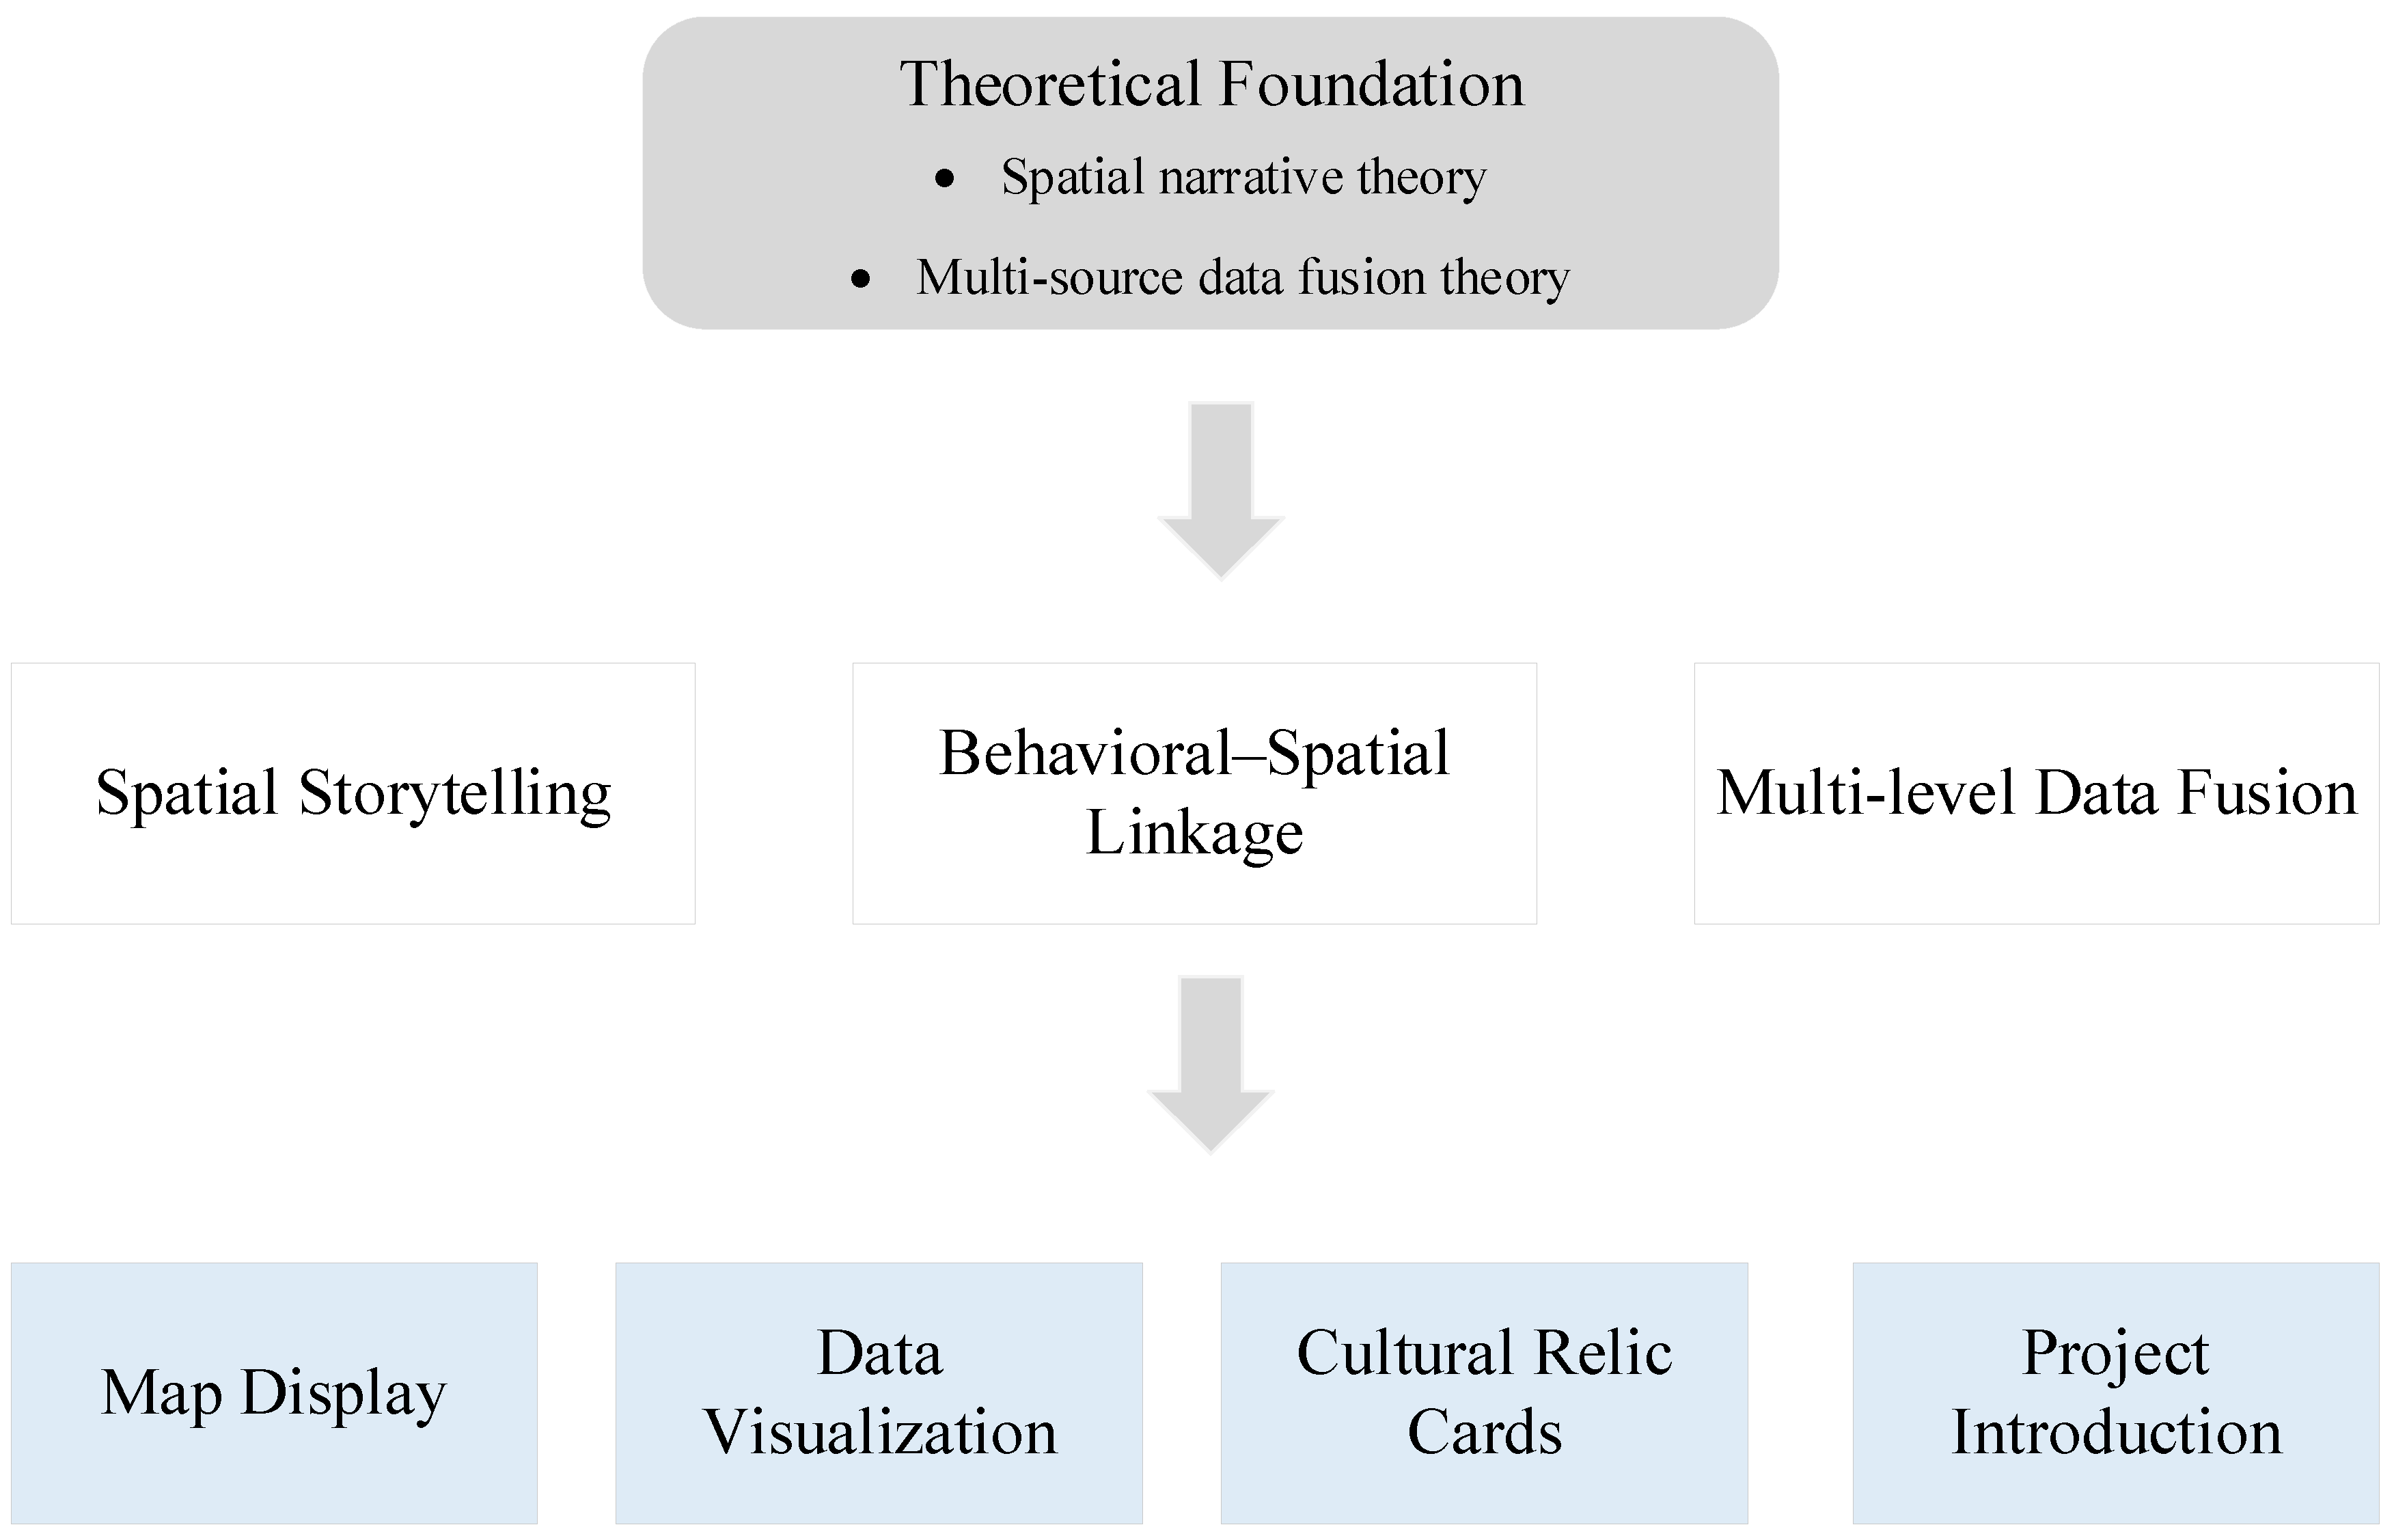
2.3. Conceptual Framework
2.4. Responsive Web Development Based on Tailwind CSS
3. Platform Design and Implementation
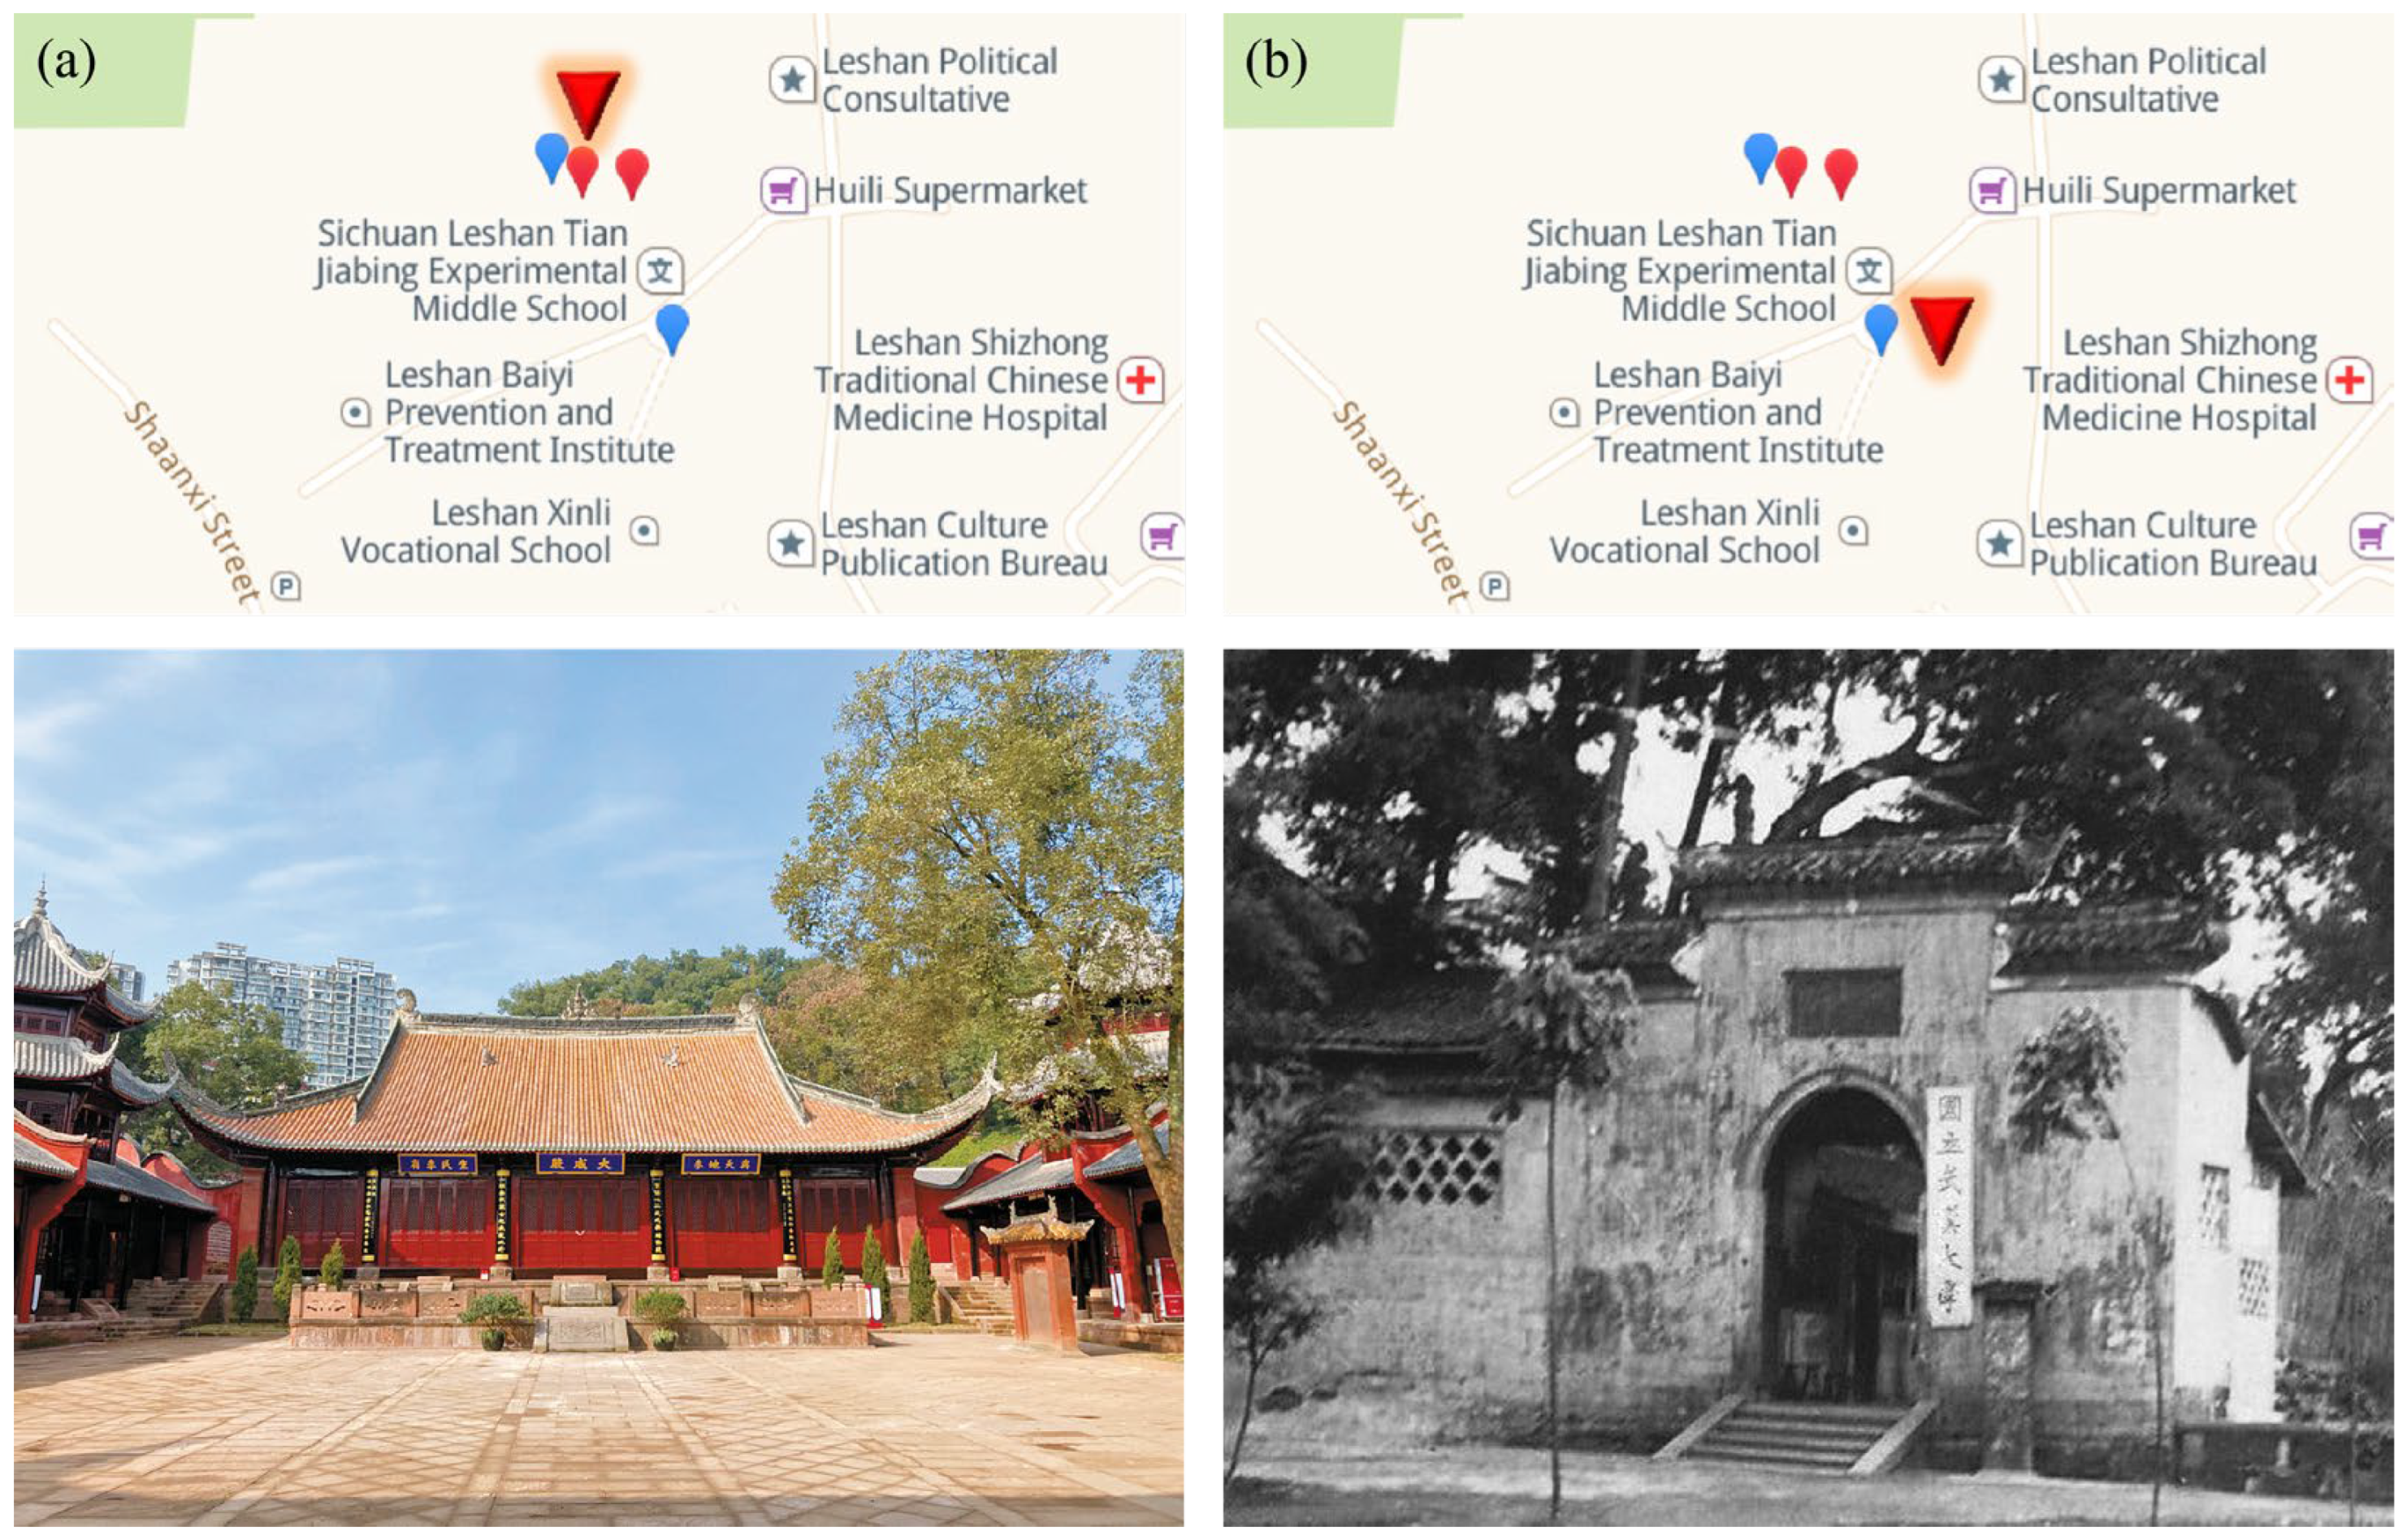
3.1. Case Study Sites
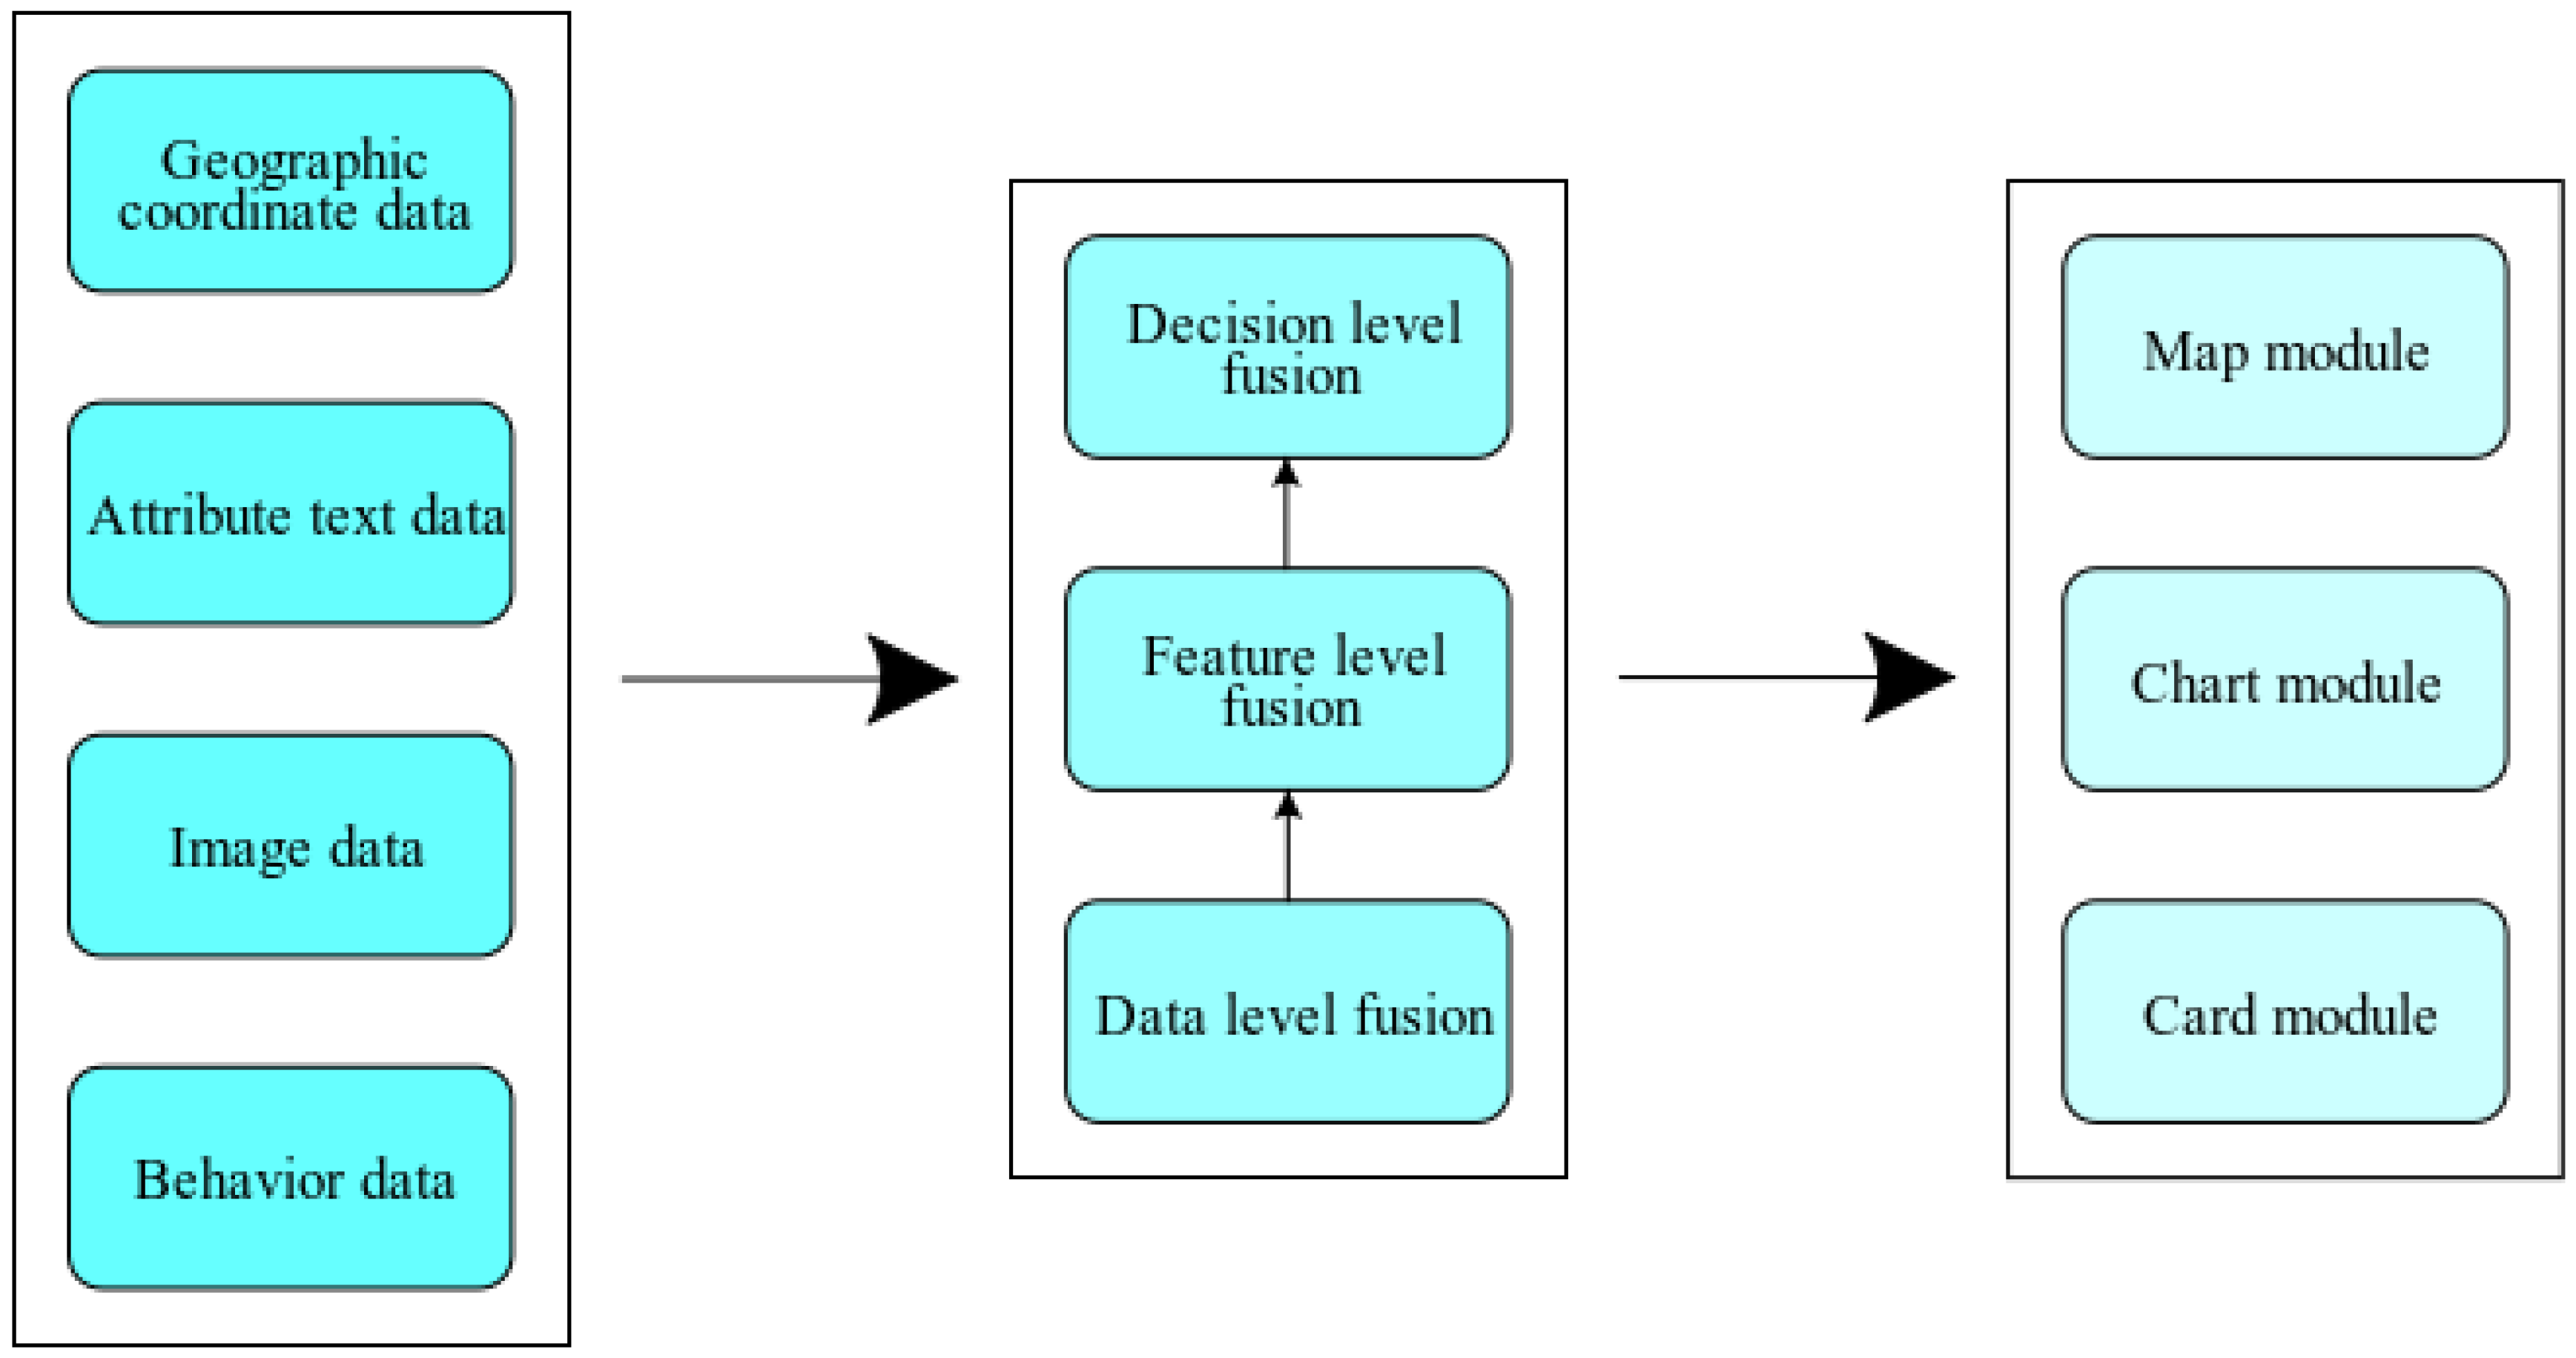
3.2. Data Collection and Fusion Processing
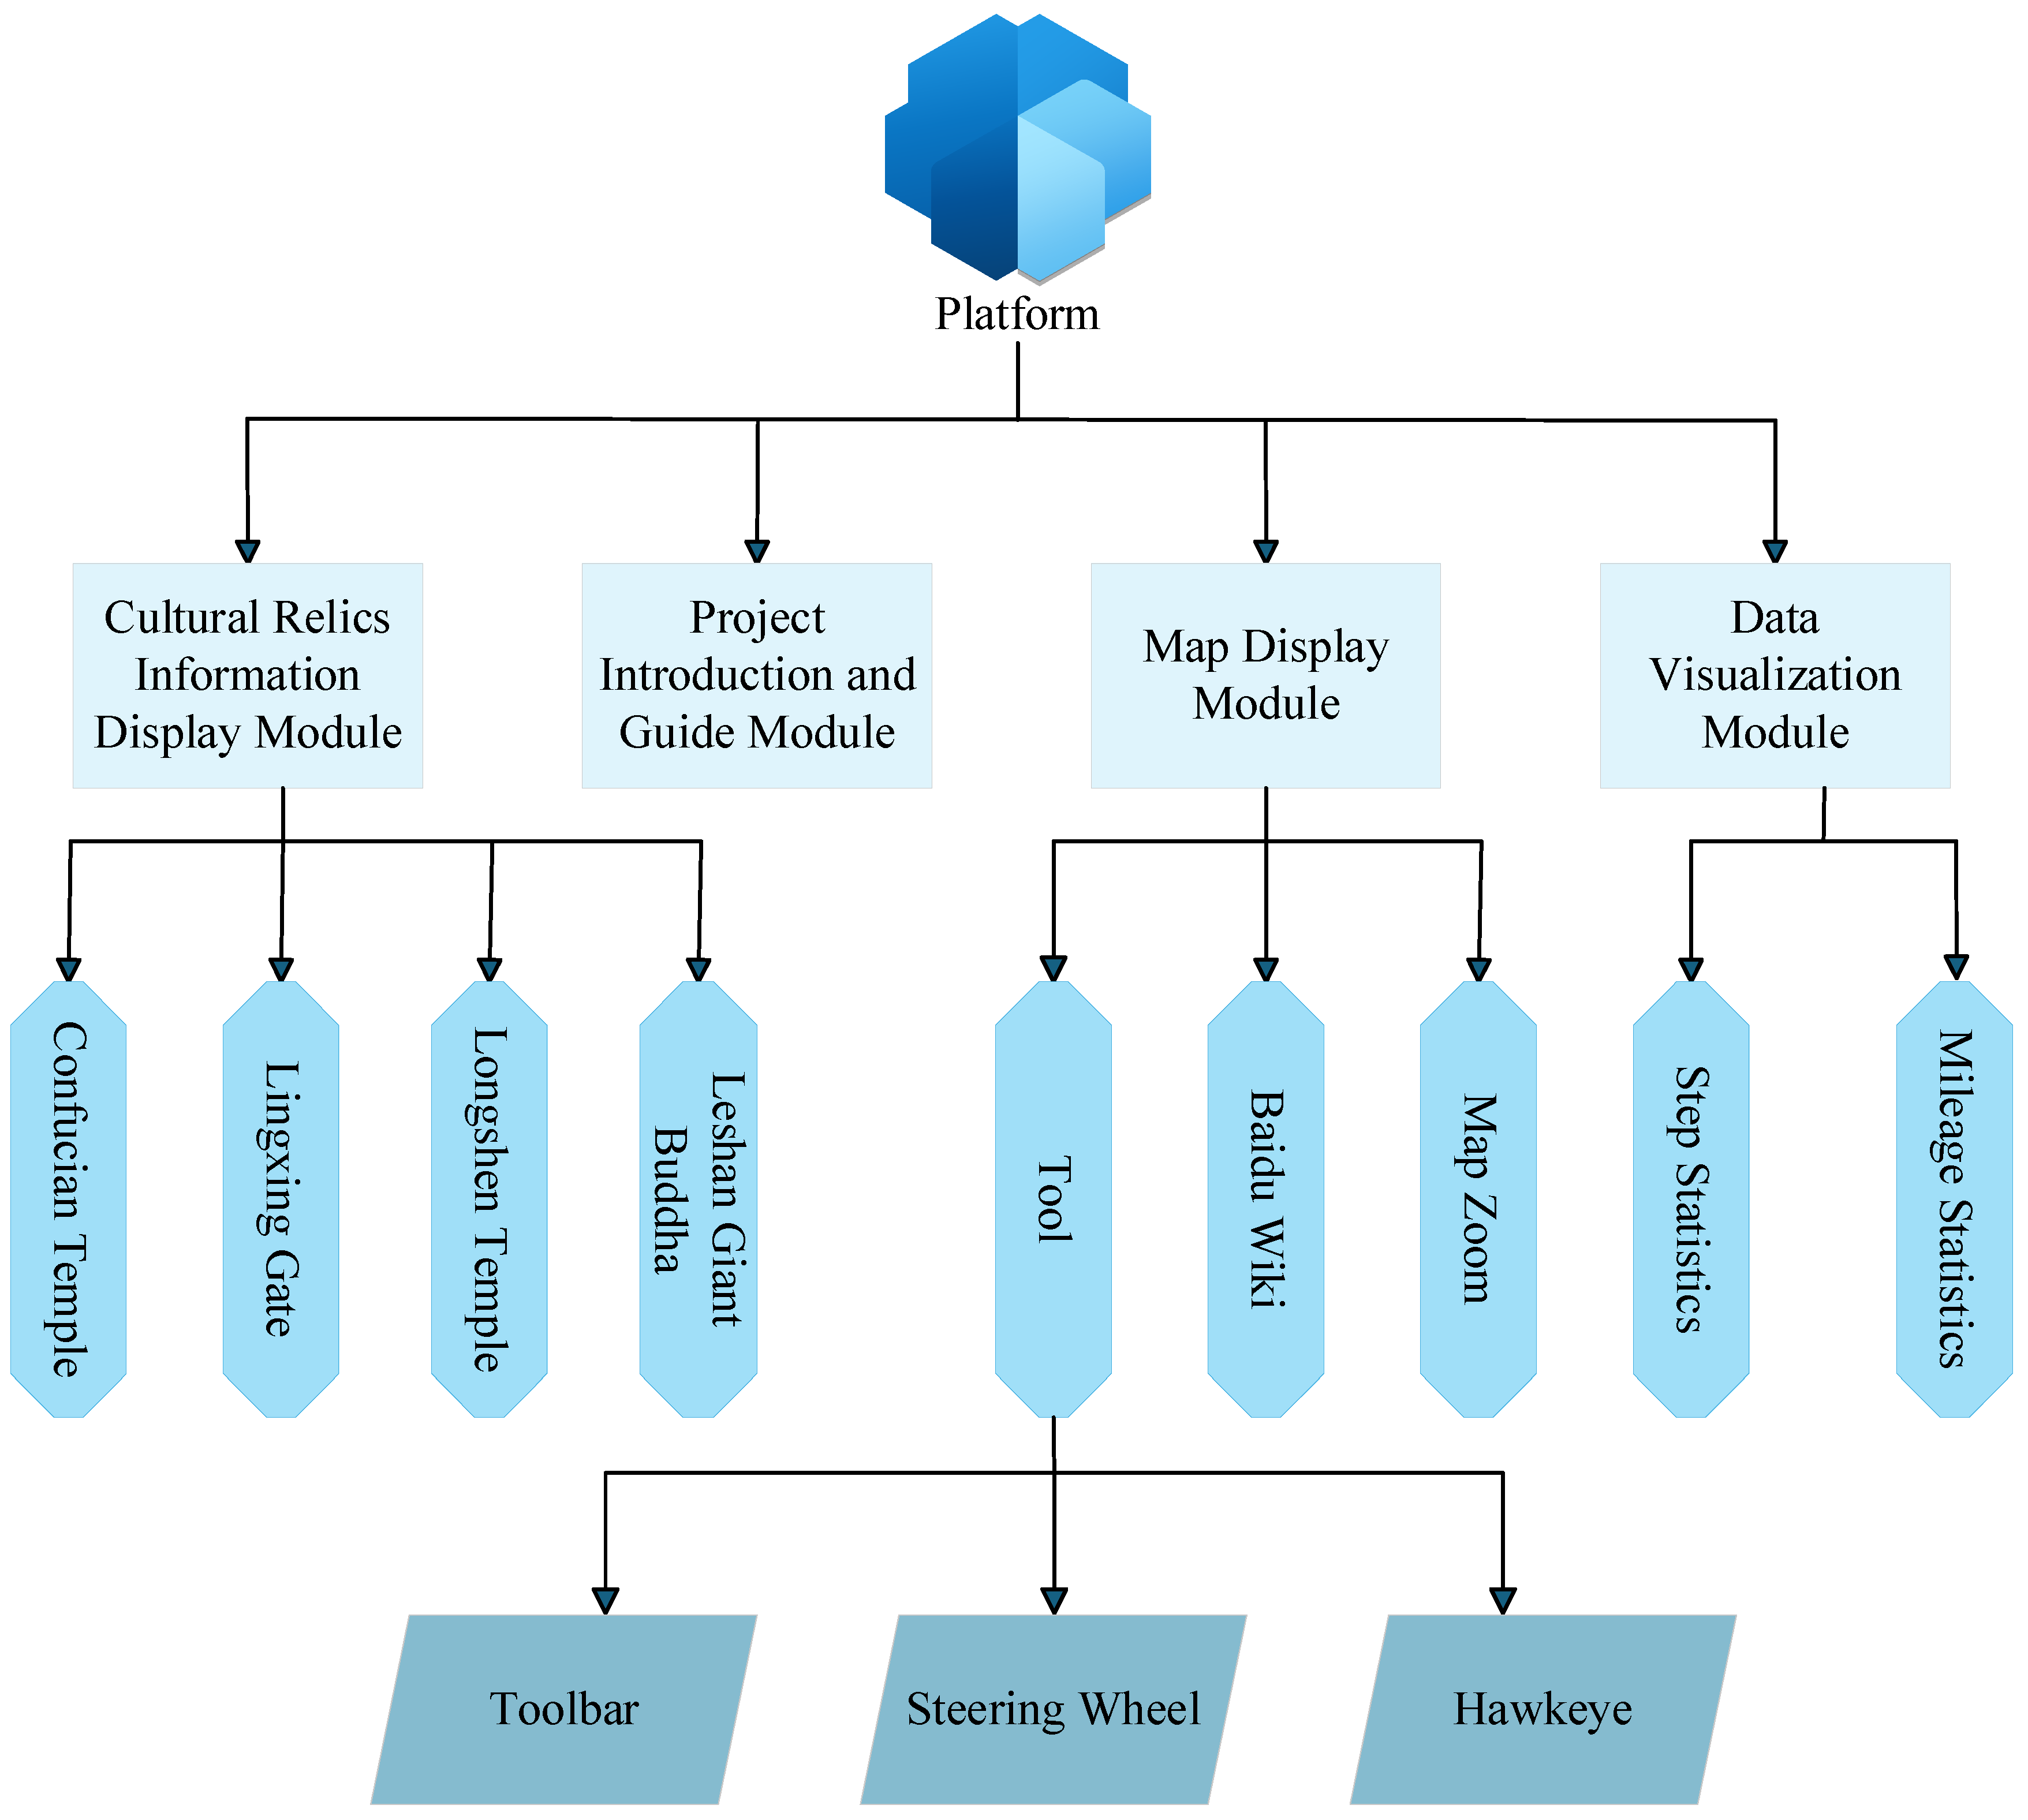
3.3. Function Modules
3.3.1. Map Display Module
3.3.2. Data Visualization Module
3.3.3. Cultural Relics Information Display Module
3.3.4. Project Introduction and Guide Module
3.4. Platform Architecture
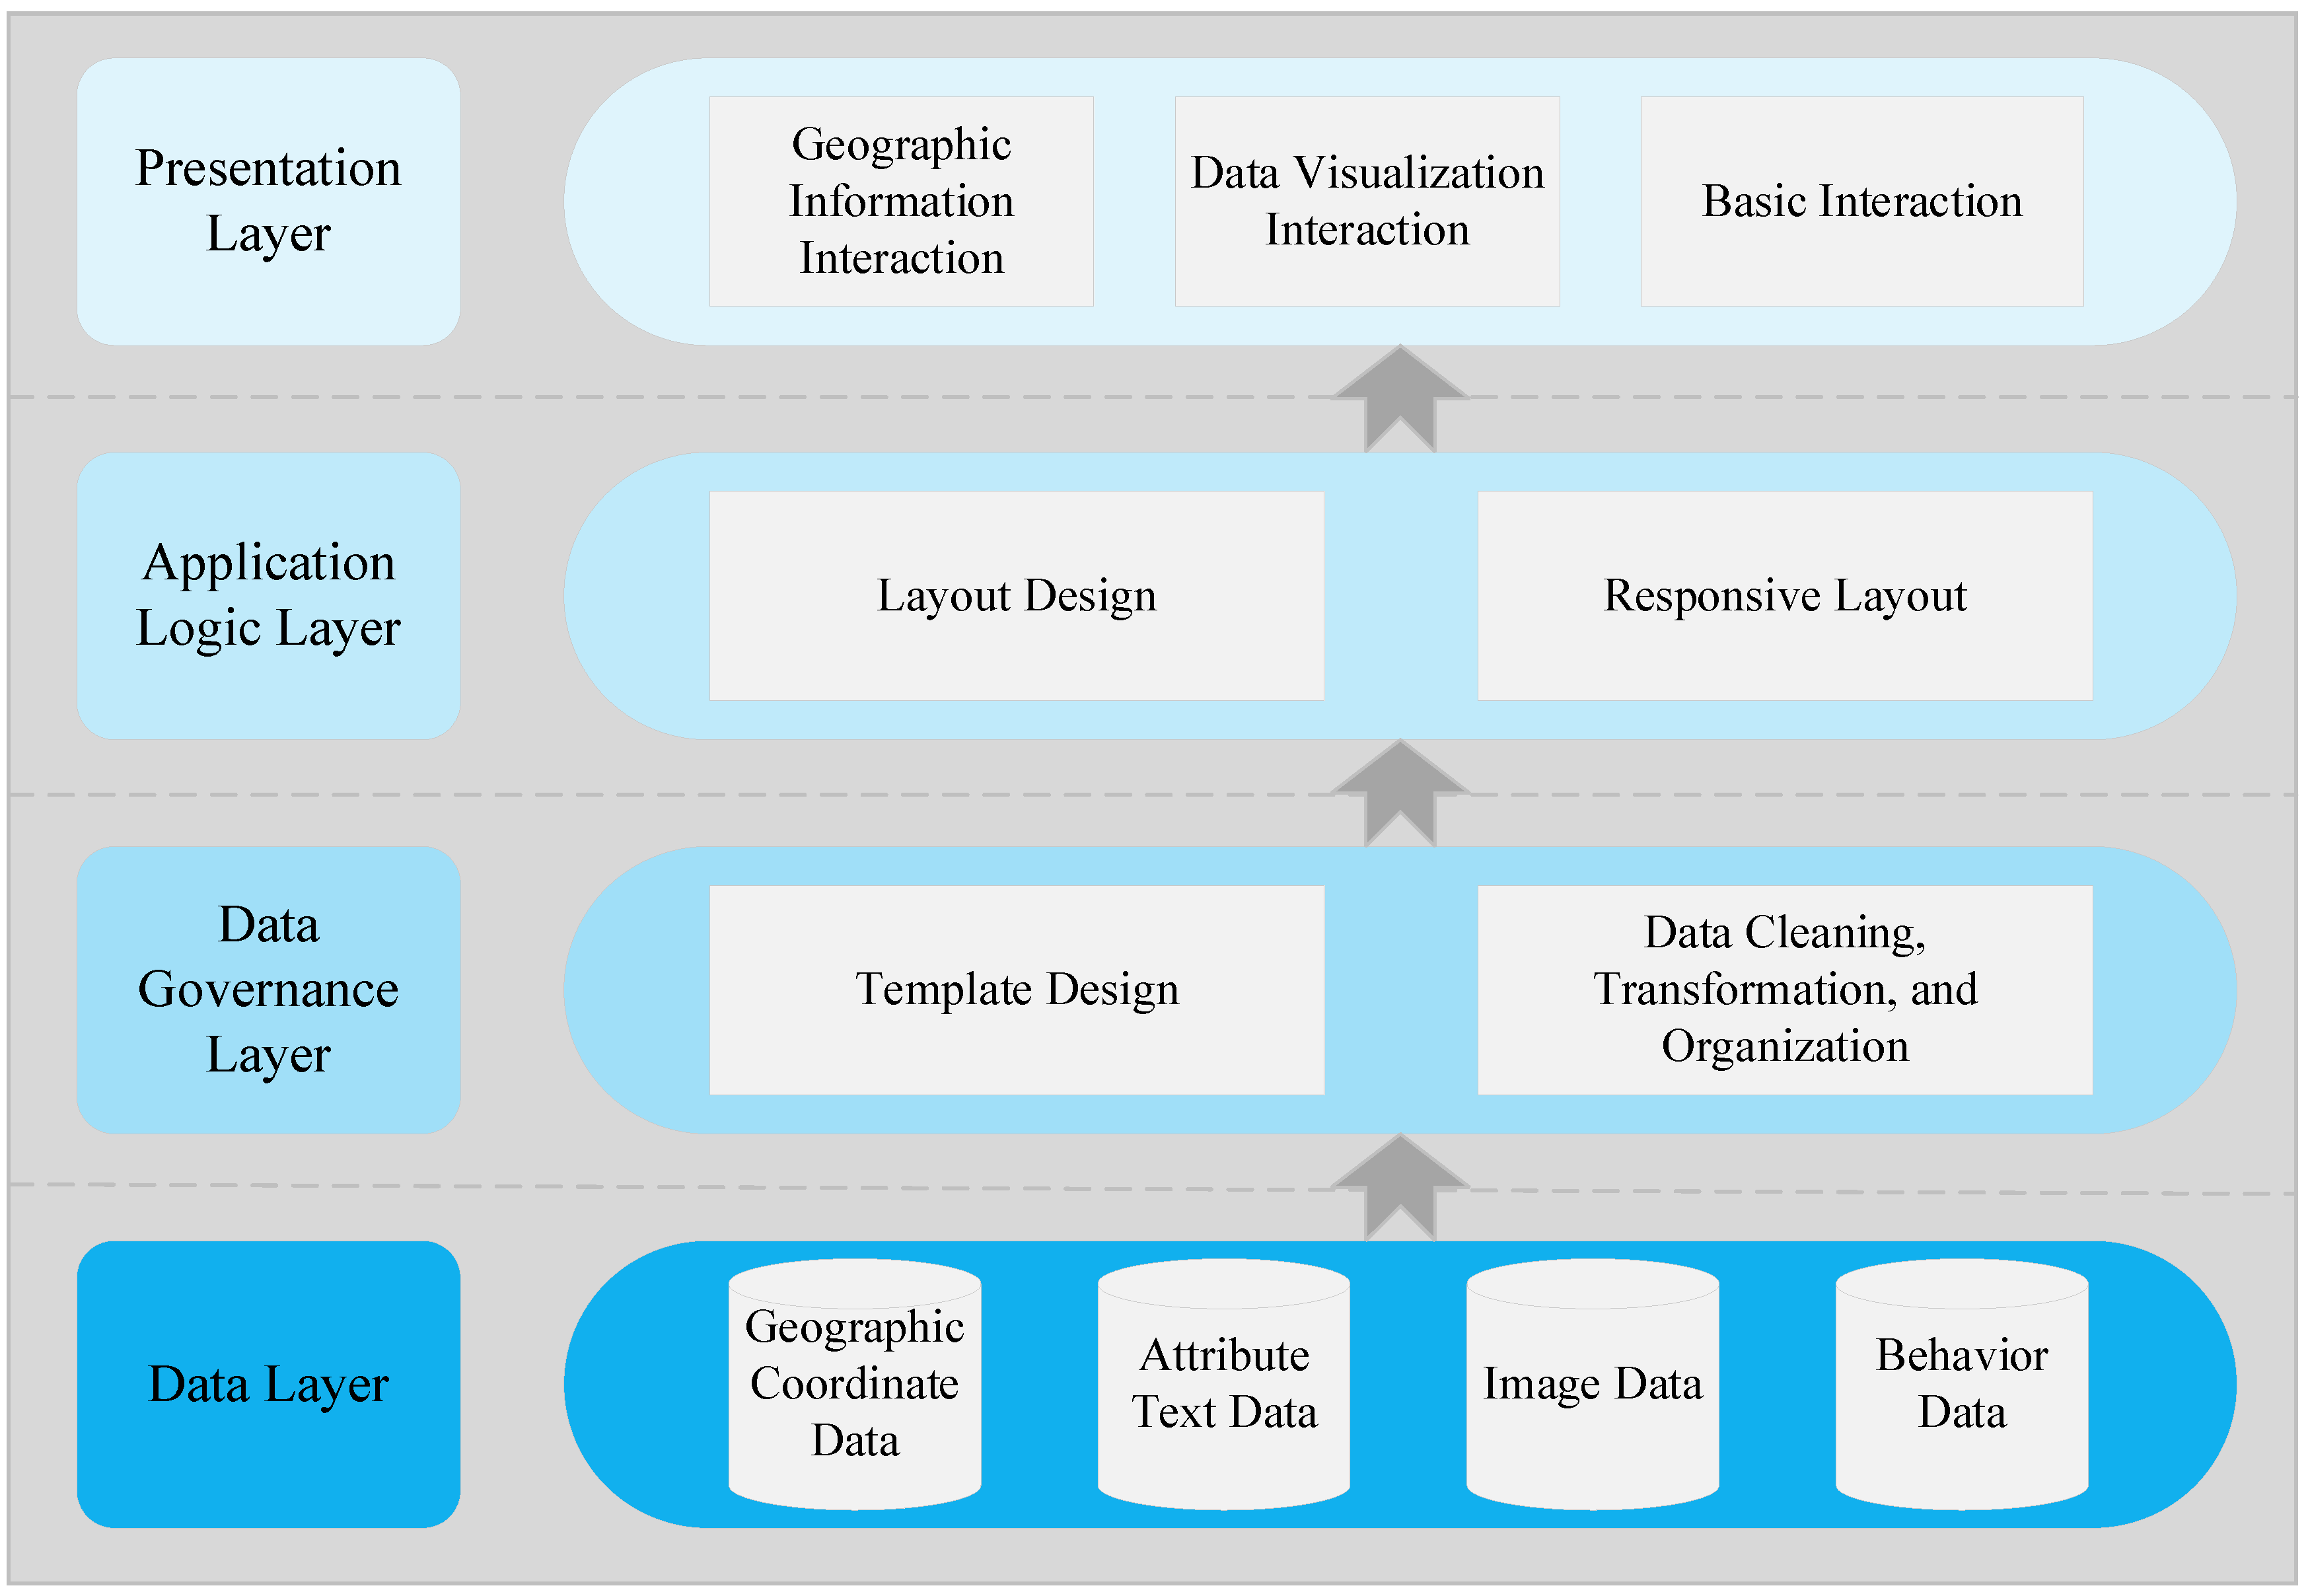
- Data layer. Stores and manages all original and derived multi-source data (Table 3). During development, data is organized as structured JSON files for direct front-end reading and parsing, simulating backend API data acquisition.
- Data governance layer. Transforms original heterogeneous data into standard visual display formats—a key step in converting spatial information to digital carriers [34]. Standardized data templates are developed for different data types (e.g., geographic data points standardized as {name, lnglat, description, imageurl, externallink} objects). This layer ensures data quality and provides clean, consistent data sources for upper-layer applications.
- Application logic layer. The platform’s core processing layer is fully driven by the client JavaScript engine, including three core sub-modules: map service engine, visualization rendering engine, and content management engine. Among them, the map service engine is built on the Gaode map JavaScript API, which is responsible for creating and rendering map instances, listening for and responding to interactive events (such as clicks and drags), and managing map controls. The visual rendering engine is based on the Echarts library. It receives statistical data after governance, generates interactive charts based on configuration items, and handles user interaction within the charts (such as hover prompts and legend switches). The content management engine dynamically manages the generation of cultural relic cards, paging loading logic, and the routing and smooth scrolling behavior of the entire page through native DOM operations and event processing.
- Presentation layer. The user-interactive Web interface, built following HTML5 semantic standards, with a fully responsive layout design using CSS3 and Tailwind CSS. It adapts to screen sizes from desktop to mobile, providing clear, aesthetically pleasing, and consistent visual presentation and interactive feedback.
3.5. Overall Layout and Interaction Design of Web Platform
4. Platform Evaluation
4.1. Evaluation Setup
4.2. Functional Testing
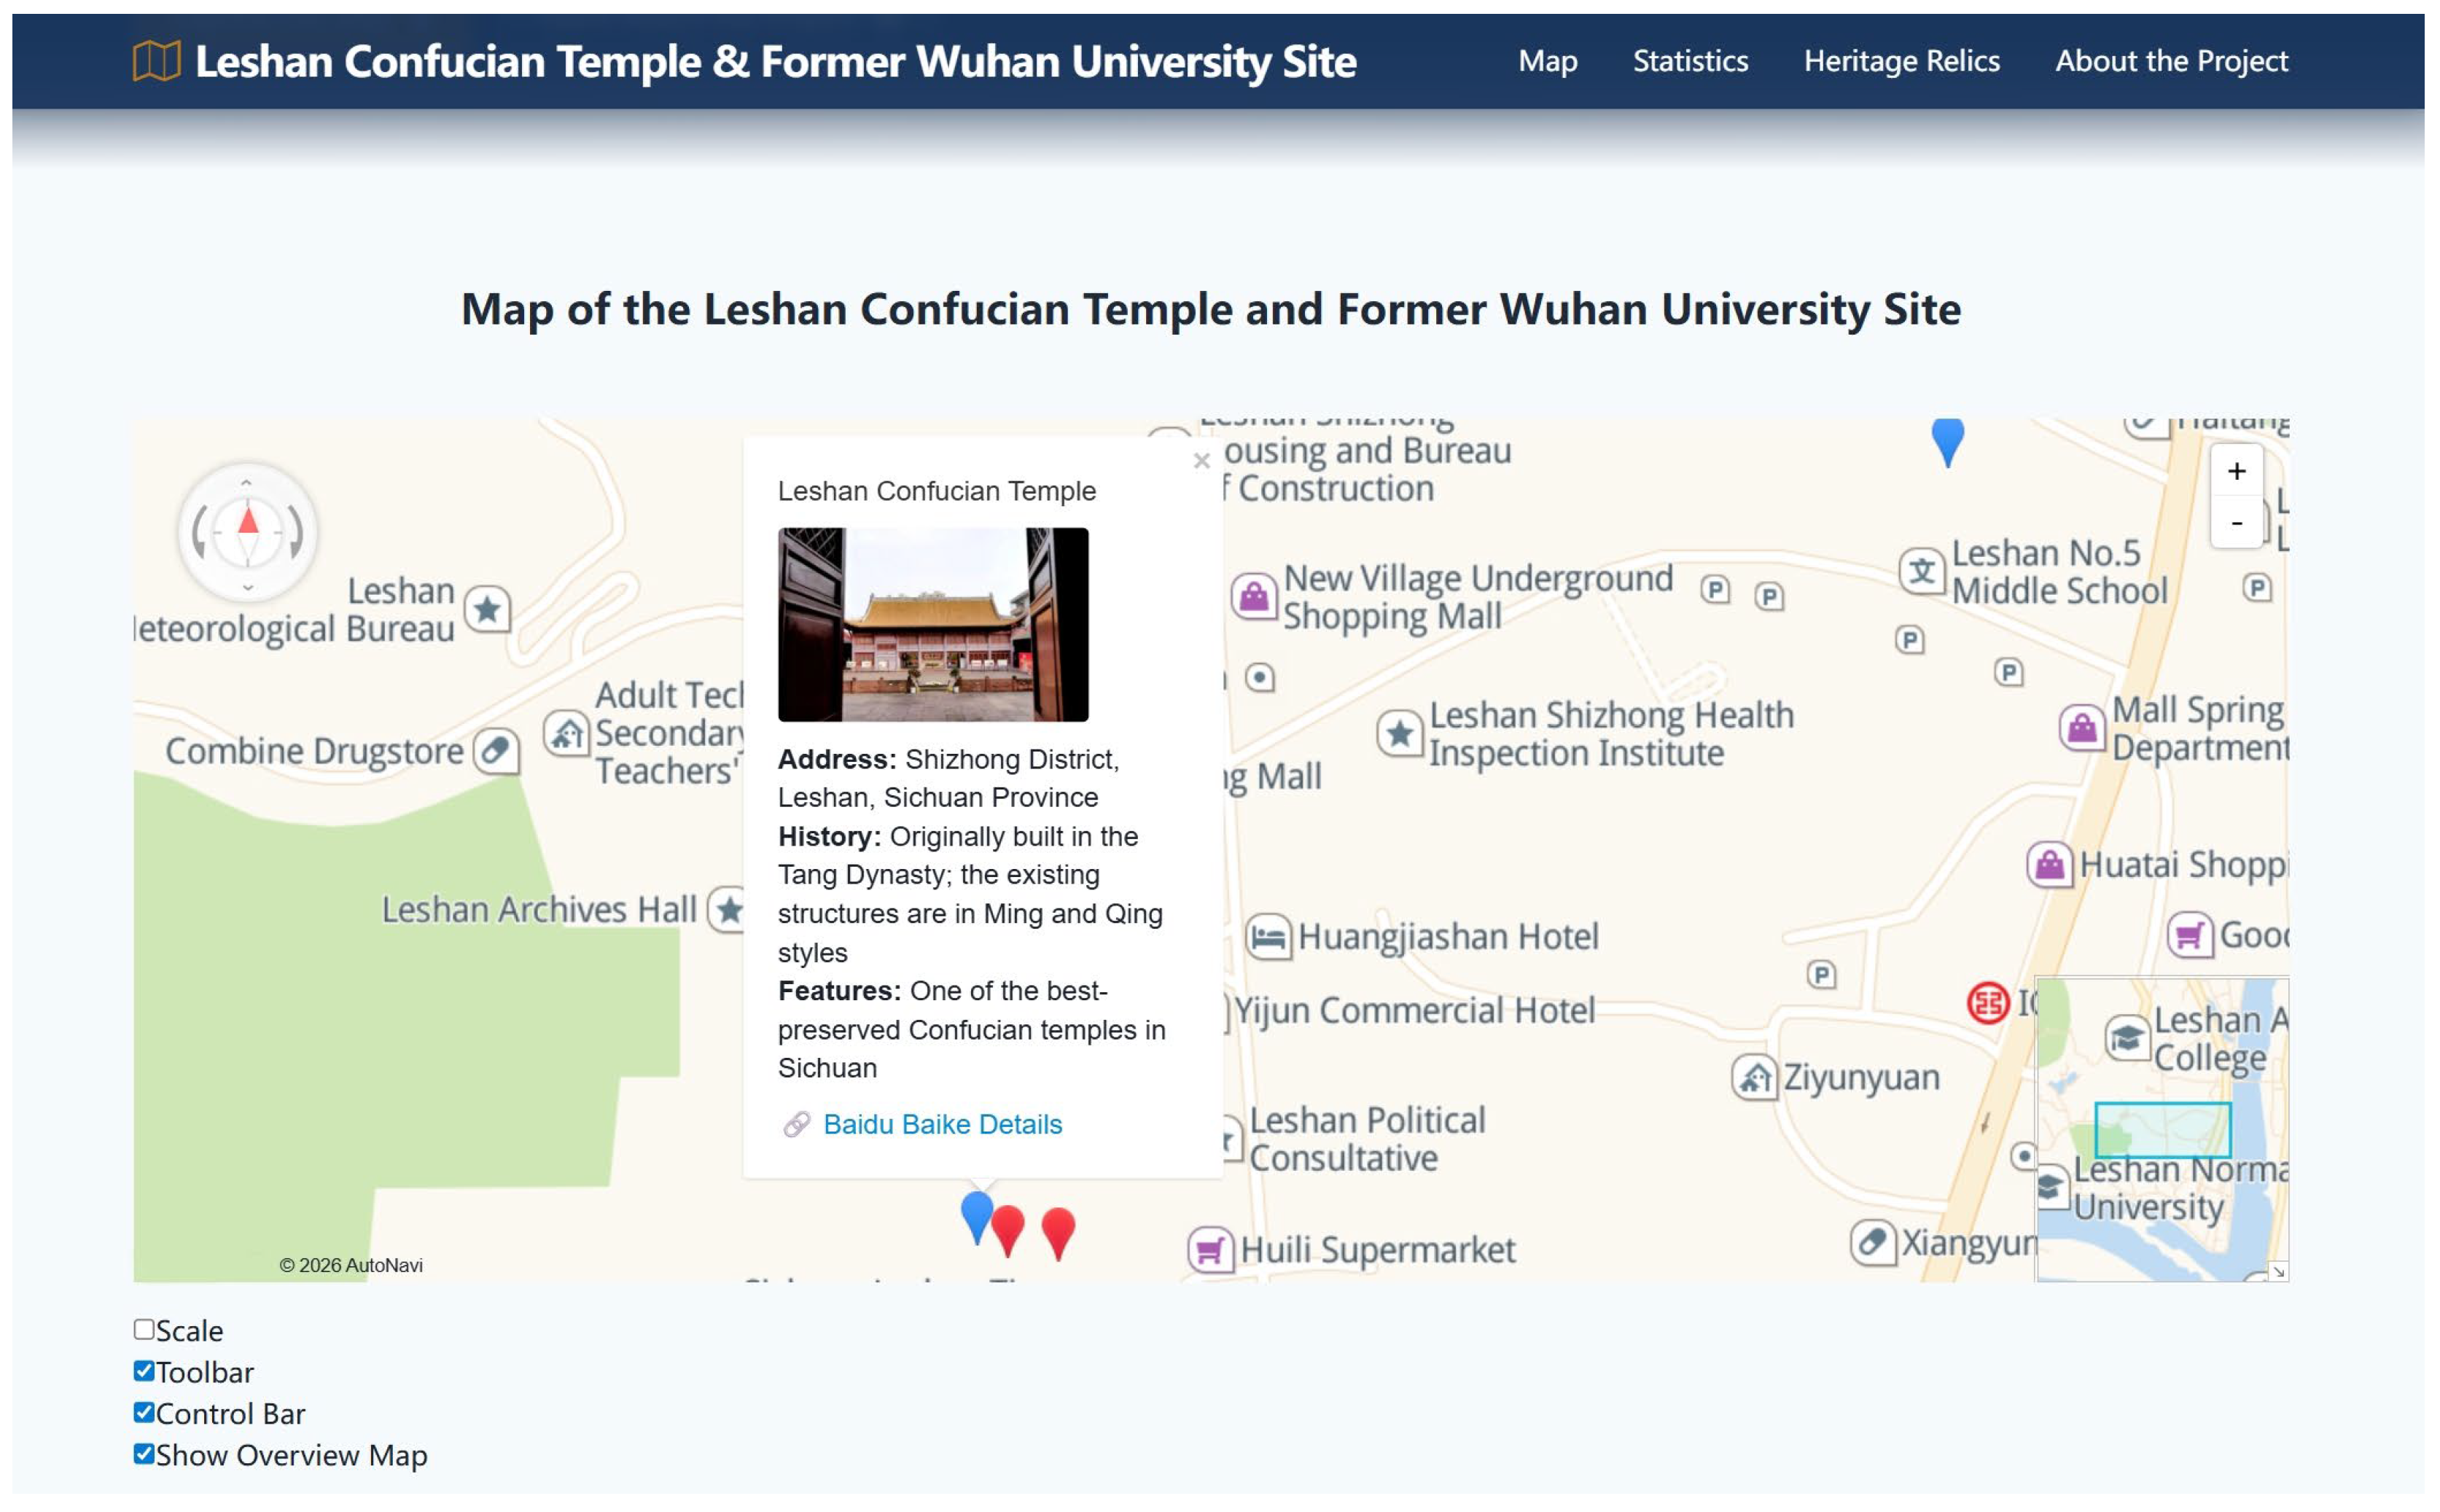
- Map service module: verified successful Gaode Maps JavaScript API integration, including accurate map initialization (center point, zoom level), custom marker rendering (icons, color coding), and dynamic information window generation with accurate content (text, pictures, hyperlinks).
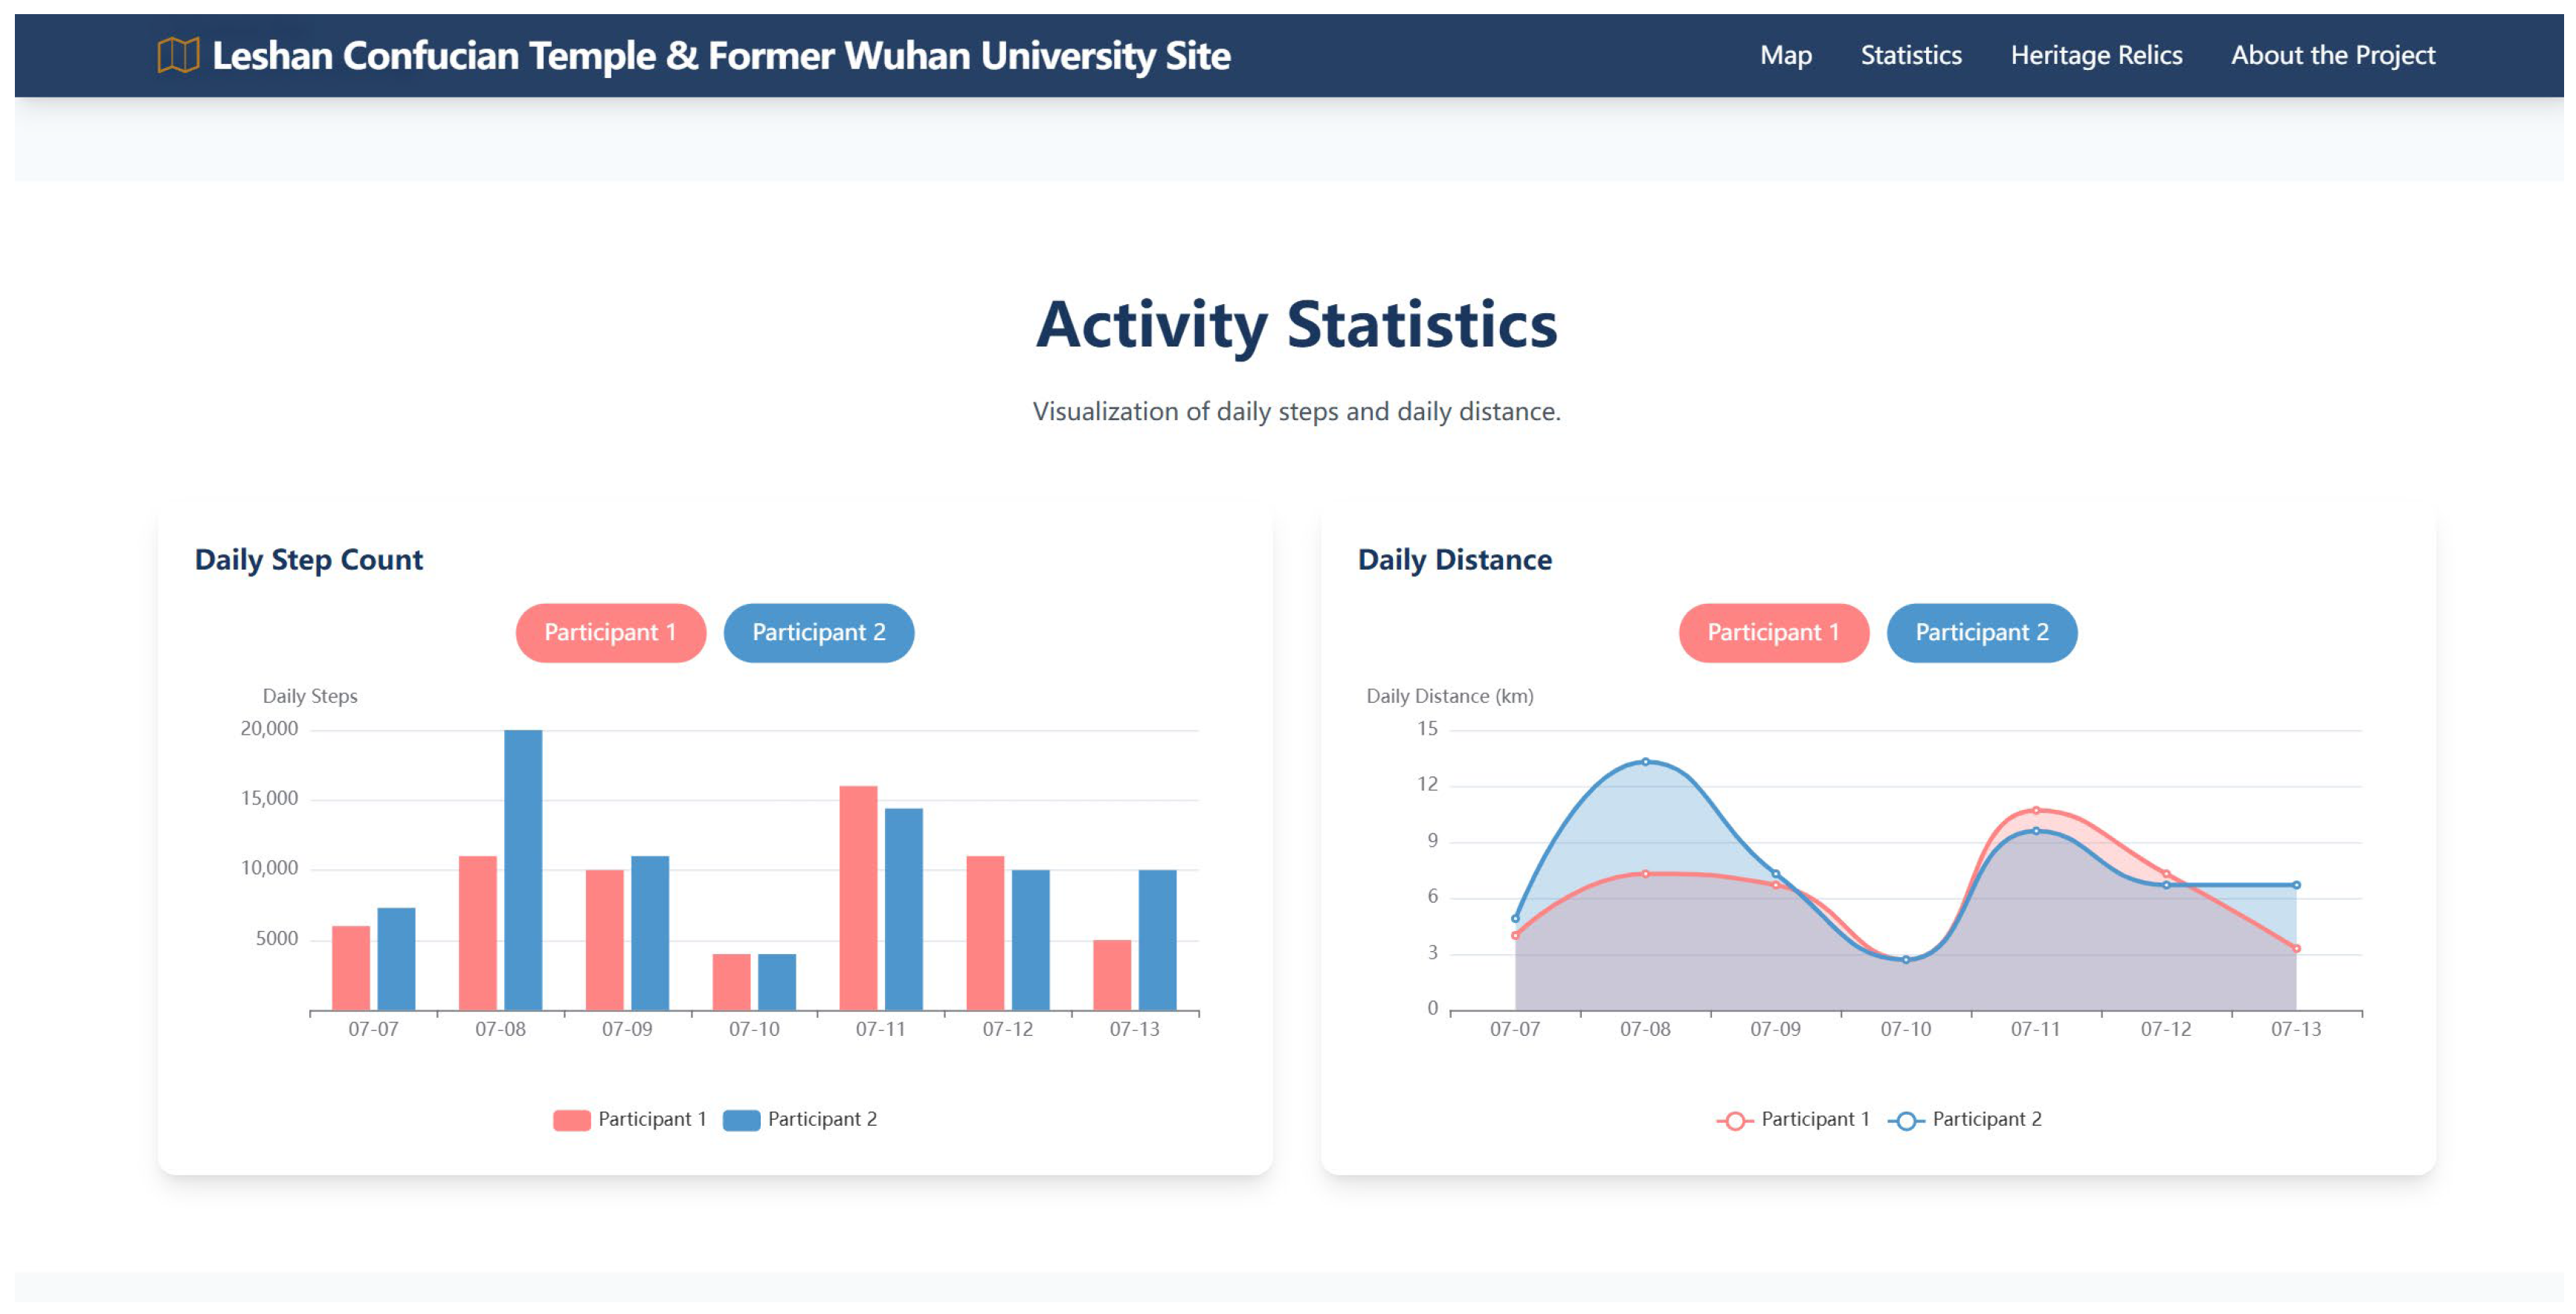
- Data visualization module: confirmed correct ECharts binding and rendering of step (bar chart) and mileage (line chart) data; interactive tests validated correct legend filtering response and accurate mouse-hover tooltip data.
- Information integration and interaction module: tested cultural relic card paginated loading logic, verifying “load more” button behavior (loading, status update, hiding) met expectations; evaluated global navigation smooth scrolling and mobile responsive menu switching.
4.3. Usability Testing
4.4. Performance and Compatibility Testing
- Loading performance: Chrome DevTools Lighthouse and Network panels measured First Contentful Paint (FCP), Largest Contentful Paint (LCP), and full page loading time under simulated 4G and 5G network throttling, with five test repetitions for average values.
- Runtime performance: in stress test scenarios (150+ markers), the Performance panel recorded page frame rate (FPS) and memory usage changes, evaluating interaction fluency (rapid map zooming, chart switching);
- Cross-platform compatibility: full-function traversal tests were conducted on different device-browser combinations to ensure core function and visual layout consistency.
4.5. Comparative Analysis
5. Discussion
6. Conclusions
- This study developed a purely front-end, serverless architecture using the Gaode Map JavaScript API (2D mapping), ECharts (interactive charts), and Tailwind CSS (responsive layout). A JSON-based fusion model successfully integrates geospatial coordinates, attribute texts, imagery, and user behavior data. Performance tests showed a First Contentful Paint of 1.2 s under 5G and an interaction delay of < 3 s, confirming the feasibility of the lightweight approach.
- The platform achieved a System Usability Scale score of 82.5 (“good” to “excellent”). Task completion rates were 100% for map-based searching and 93% for data comparison. User feedback indicated that the spatially grounded presentation (color-coded markers, information windows, linked charts) effectively supports exploratory learning of heritage sites.
- This study operationalizes spatial narrative theory and multi-source data fusion theory in a concrete WebGIS implementation, providing a reusable framework for digital humanities projects. The platform offers a low-cost, easily deployable tool for heritage dissemination, with full source code and data schemas provided as Supplementary Materials. The responsive design ensures cross-device usability.
Supplementary Materials
Author Contributions
Funding
Data Availability Statement
Conflicts of Interest
References
- Moufid, O.; Praharaj, S.; Oulidi, J. Digital technologies in urban regeneration: A systematic review of literature. J. Urban Manag. 2025, 14, 264–278. [Google Scholar] [CrossRef] [Scilit]
- Dessy, H.; Ballesteros, L.; Variant, E.; Endah, P.; Fitri, R. Cultural heritage preservation in the digital age, harnessing artificial intelligence for the future: A bibliometric analysis. Digit. Libr. Perspect. 2024, 40, 609–630. [Google Scholar] [CrossRef] [Scilit]
- Roggio, D.S.; Shokrollahi, S.; Forte, A.; Bitelli, G. Exploring Historical Changes to Architectural Heritage Through Reality-Based 3D Modeling and Virtual Reality: A Case Study. ISPRS Int. J. Geo-Inf. 2025, 14, 353. [Google Scholar] [CrossRef] [Scilit]
- Selim, G.; Bachagha, N.; Alobaydi, D.; Farhan, S.L.; Tarabeih, A. Integrated Surveying for Architectural Heritage Documentation in Iraq: From LiDAR Scanner to GIS Applications. Remote Sens. 2025, 17, 3632. [Google Scholar] [CrossRef] [Scilit]
- Lee, A.; Lee, K.W.; Kim, K.H.; Shin, S.W. A Geospatial Platform to Manage Large-Scale Individual Mobility for an Urban Digital Twin Platform. Remote Sens. 2022, 14, 723. [Google Scholar] [CrossRef] [Scilit]
- Freire, N.; Meijers, E.; Voorburg, R.; Isaac, A. Aggregation of cultural heritage datasets through the Web of Data. Procedia Comput. Sci. 2018, 137, 120–126. [Google Scholar] [CrossRef] [Scilit]
- Isa, E.S. Image embedded metadata in cultural heritage digital collections on the web. Libr. Hi Tech 2018, 36, 339–357. [Google Scholar] [CrossRef] [Scilit]
- Neelakanta, G.I.; Sachit, B. Kathakali character identification-Using deep learning techniques and web technologies for Indian cultural heritage. Digit. Appl. Archaeol. Cult. Herit. 2024, 32, e00300. [Google Scholar]
- Liu, B.; Wu, C.; Xu, W.; Shen, Y.; Tang, F. Emerging trends in GIS application on cultural heritage conservation: A review. Herit. Sci. 2024, 12, 139. [Google Scholar] [CrossRef] [Scilit]
- Huang, Y. Bibliometric analysis of GIS applications in heritage studies based on web of science from 1994 to 2023. Herit. Sci. 2024, 12, 57. [Google Scholar] [CrossRef] [Scilit]
- Esquembre, F.; Chacón, J.; Saenz, J.; Vega, J.; Dormido-Canto, S. A programmable web platform for distributed access, analysis, and visualization of data. Fusion Eng. Des. 2023, 197, 114049. [Google Scholar] [CrossRef] [Scilit]
- Trocchianesi, R.; Bollini, L. Design, Digital Humanities, and Information Visualization for Cultural Heritage. Multimodal Technol. Interact. 2023, 7, 102. [Google Scholar] [CrossRef] [Scilit]
- Chen, B.; Huang, B.; Xu, B. Multi-source remotely sensed data fusion for improving land cover classification. ISPRS J. Photogramm. Remote Sens. 2017, 124, 27–39. [Google Scholar] [CrossRef] [Scilit]
- Wang, H.; Du, J.; Li, Y.; Zhang, L.; Li, X. Grand challenges in immersive technologies for cultural heritage. Int. J. Hum. Comput. Interact. 2025, 41, 13682–13703. [Google Scholar] [CrossRef] [Scilit]
- La Guardia, M.; Koeva, M. Towards Digital Twinning on the Web: Heterogeneous 3D Data Fusion Based on Open-Source Structure. Remote Sens. 2023, 15, 721. [Google Scholar] [CrossRef] [Scilit]
- Pesce, D.; Franzè, C. When digital platforms meet tradition: Phygital innovation in the cultural heritage. J. Eng. Technol. Manag. 2025, 77, 101896. [Google Scholar] [CrossRef] [Scilit]
- Gong, R.N.; Sun, Z.Y. Multi-sensor data-fusion technology for immersive Chinese cultural experience virtual environment construction. J. Comput. Methods Sci. Eng. 2025, 25, 13. [Google Scholar] [CrossRef] [Scilit]
- Velhinho, A.; Alves, M.; Almeida, P.; Pedro, L. Designing a Collaborative Storytelling Platform to Enrich Digital Cultural Heritage Archives and Collective Memory. In Design, User Experience, and Usability; Marcus, A., Rosenzweig, E., Soares, M.M., Eds.; HCII 2024. Lecture Notes in Computer Science; Springer: Cham, Switzerland, 2024; Volume 14712. [Google Scholar]
- Ryan, M.L. Transmedia Storytelling: Industry Buzzword or New Narrative Experience? StoryWorlds J. Narrat. Stud. 2015, 7, 1–20. [Google Scholar] [CrossRef] [Scilit]
- Psarra, S. Architecture and Narrative: The Formation of Space and Cultural Meaning; Taylor and Francis: Abingdon, UK, 2009. [Google Scholar]
- Martin, M.; Vacca, F. Heritage narratives in the digital era. Res. J. Text. Appar. 2018, 22, 335–351. [Google Scholar] [CrossRef] [Scilit]
- Mercer, W.J.; Bell, C.S. An Introduction to data fusion, data mining, and pattern recognition applied to fiber analysis. Jurimetrics 2005, 46, 53–64. [Google Scholar]
- Dong, S.; Wang, X.; Yin, H.; Xu, S.; Xu, R. Semantic enhanced WebGIS approach to visualize Chinese historical natural hazards. J. Cult. Herit. 2013, 14, 181–189. [Google Scholar] [CrossRef] [Scilit]
- Chow, T.E. The Potential of Maps APIs for Internet GIS Applications. Trans. GIS 2008, 12, 179–191. [Google Scholar] [CrossRef] [Scilit]
- Schwerin, J.V.; Richards-Rissetto, H.; Remondino, F.; Spera, M.G.; Auer, M.; Billen, N.; Loos, L.; Stelson, L.; Reindel, M. Airborne LiDAR acquisition, post-processing and accuracy-checking for a 3D WebGIS of Copan, Honduras. J. Archaeol. Sci. Rep. 2016, 5, 85–104. [Google Scholar] [CrossRef] [Scilit]
- Vacca, G.; Fiorino, D.R.; Pili, D. A WebGIS for the knowledge and conservation of the historical buildings in Sardinia (Italy). Int. Arch. Photogramm. Remote Sens. Spat. Inf. Sci. 2017, XLII-4-W2, 171–178. [Google Scholar] [CrossRef] [Scilit]
- Nishanbaev, I.; Champion, E.; McMeekin, D.A. A Web GIS-Based Integration of 3D Digital Models with Linked Open Data for Cultural Heritage Exploration. ISPRS Int. J. Geo-Inf. 2021, 10, 684. [Google Scholar] [CrossRef] [Scilit]
- Sajja, R.; Mermer, O.; Yermet, Y.; Demir, I. Hydro3DJS: A modular web-based library for real-time 3D visualization of watershed dynamics and digital twin integration. Environ. Model. Softw. 2026, 197, 106853. [Google Scholar] [CrossRef] [Scilit]
- Riffle, M.; Zelter, A.; Jaschob, D.; Hoopmann, M.R.; Faivre, D.A.; Moritz, R.L.; Davis, T.N.; MacCoss, M.J.; Isoherranen, N. Limelight: An Open, Web-Based Tool for Visualizing, Sharing, and Analyzing Mass Spectrometry Data from DDA Pipelines. J. Proteome Res. 2025, 24, 1895–1906. [Google Scholar] [CrossRef] [Scilit]
- Zhang, C.L.; Wang, P.Y.; Zhang, H.; Lv, J.; Qiao, X.Q.; Huang, Y.K. WebGS360: Towards web-based visualization of Gaussian Splatting from panoramic images. Comput. Graph. 2025, 133, 104462. [Google Scholar] [CrossRef] [Scilit]
- Marbella, N.H.; Akbar, A.I.; Setiawan, B. Design and development of a web-based patient management information system. Procedia Comput. Sci. 2024, 234, 1799–1806. [Google Scholar] [CrossRef] [Scilit]
- Kinskey, J.; Long, S.; Christensen, P.; Eagar, T. Streamlining HLA quality control applications: Simplified development and role-based authorization with Next.js and NextUI. J. Pathol. Inform. 2025, 19, 100467. [Google Scholar] [CrossRef] [Scilit]
- Wu, J.M.; Tan, L.D.; Chen, J.; Li, X.; Wu, C.Y. Inversion study on the nitrogen content of jujube canopy based on multi-source data fusion combined with integrated learning algorithm. Smart Agric. Technol. 2025, 12, 101407. [Google Scholar] [CrossRef] [Scilit]
- Wolfengagen, E.V.; Ismailova, Y.L.; Kosikov, V.S.; Nikulin, I.A.; Parfenova, I.A.; Kcholodov, V.A. Means for Ensuring Compatibility of Heterogeneous Data Models in an Interactive Visualization Environment. Procedia Comput. Sci. 2018, 123, 195–202. [Google Scholar] [CrossRef] [Scilit]
- Brooke, J. SUS: A quick and dirty usability scale. In Usability Evaluation in Industry; CRC Press: Boca Raton, FL, USA, 1996. [Google Scholar]
- Nielsen, J.; Landauer Thomas, K. A mathematical model of the finding of usability problems. In Proceedings of the ACM INTERCHI’93 Conference, Amsterdam, The Netherlands, 24–29 April 1993; pp. 206–213. [Google Scholar]
- Nielsen, J. Why You Only Need to Test with 5 Users; Nielsen Norman Group: Fremont, CA, USA, 2000. [Google Scholar]



| No. | Name | Longitude (° E) | Latitude (° N) |
|---|---|---|---|
| 1 | Leshan Confucian Temple | 103.761523 | 29.558502 |
| 2 | Yangchi Pond | 103.762005 | 29.558418 |
| 3 | Louxing Gate | 103.761705 | 29.558432 |
| 4 | Longshen Shrine | 103.768212 | 29.557461 |
| 5 | Leshan Giant Buddha | 103.771924 | 29.544073 |
| No. | Name | Longitude (° E) | Latitude (° N) |
|---|---|---|---|
| 1 | Monument commemorating Wuhan University’s relocation to Leshan | 103.751098 | 29.557706 |
| 2 | Former site of Wuhan University dormitory No. 5 | 103.767309 | 29.562531 |
| 3 | Former site of Wuhan University dormitory No. 1 | 103.762245 | 29.557608 |
| 4 | Former Site of Wuhan University women’s dormitory | 103.757009 | 29.556255 |
| 5 | Former site of Wuhan University College of Science | 103.754772 | 29.555788 |
| 6 | Former site of Wuhan University College of Engineering | 103.751570 | 29.557967 |
| 7 | Former site of Wuhan University dormitory No. 4 | 103.750604 | 29.556362 |
| 8 | Former site of Wuhan University dormitory No. 6 | 103.748973 | 29.556471 |
| Date Type | Data Detail |
|---|---|
| Geographic coordinate data | Positioning of historical buildings stored as longitude-latitude pairs (WGS-84 coordinate system) |
| Attribute text data | Descriptive texts (historical evolution, cultural value, architectural features) organized from authoritative sources |
| Image data | Links to image resources (site photos, schematic diagrams) associated with locations/cultural relics (45 MP resolution) |
| Behavior data | Sequential behavior records of team members (daily steps, moving distances) with a 5-min sampling frequency |
| No. | Module | Test Case | Expected Result | Actual Result |
|---|---|---|---|---|
| 1 | Map Display | Click the marker, check the info window | Info window shows correct content | Pass |
| 2 | Chart Interaction | Click legend to toggle data series | Chart updates accordingly | Pass |
| 3 | Paginated Loading | Scroll to the bottom, click “Load More” | Additional cards appear | Pass |
| Evaluation Metric | 5G | 4G | Stress Test (150 Points) |
|---|---|---|---|
| First Contentful Paint (FCP) | 1.2 s | 2.8 s | 1.5 s |
| Largest Contentful Paint (LCP) | 2.5 s | 5.1 s | 3.8 s |
| Fully Loaded Time | 3.1 s | 7.4 s | 4.5 s |
| Interaction Frame Rate (FPS) | >60 | >60 | 20–45 |
| Evaluation Dimension | This Platform | Sardinia Leaflet WebGIS Platform [26] |
|---|---|---|
| Technology stack | Lightweight front-end stack (Gaode Map API + ECharts + Tailwind CSS) | Lightweight front-end + backend (Leaflet + PostgreSQL/PostGIS + PHP) |
| 3D Capability | 2D | 2D |
| Development cost | Low | Medium |
| Deployment mod | Static files, any web server or CDN | Requires PostgreSQL + PHP server |
| Cross-device compatibility | Excellent (responsive design) | Good (mobile-optimized version available) |
| Functional coverage | Comprehensive (multi-source integration + interaction) | Primarily geospatial + attributes |
Disclaimer/Publisher’s Note: The statements, opinions and data contained in all publications are solely those of the individual author(s) and contributor(s) and not of MDPI and/or the editor(s). MDPI and/or the editor(s) disclaim responsibility for any injury to people or property resulting from any ideas, methods, instructions or products referred to in the content. |
© 2026 by the authors. Published by MDPI on behalf of the International Society for Photogrammetry and Remote Sensing. Licensee MDPI, Basel, Switzerland. This article is an open access article distributed under the terms and conditions of the Creative Commons Attribution (CC BY) license.
Share and Cite
Liu, Z.; Tian, Y.; Xiong, Q.; Chen, D. A Lightweight WebGIS Visualization Platform for Historical and Cultural Heritage Based on Multi-Source Data Fusion. ISPRS Int. J. Geo-Inf. 2026, 15, 184. https://doi.org/10.3390/ijgi15050184
Liu Z, Tian Y, Xiong Q, Chen D. A Lightweight WebGIS Visualization Platform for Historical and Cultural Heritage Based on Multi-Source Data Fusion. ISPRS International Journal of Geo-Information. 2026; 15(5):184. https://doi.org/10.3390/ijgi15050184
Chicago/Turabian StyleLiu, Zixuan, Yangge Tian, Qingwen Xiong, and Duanning Chen. 2026. "A Lightweight WebGIS Visualization Platform for Historical and Cultural Heritage Based on Multi-Source Data Fusion" ISPRS International Journal of Geo-Information 15, no. 5: 184. https://doi.org/10.3390/ijgi15050184
APA StyleLiu, Z., Tian, Y., Xiong, Q., & Chen, D. (2026). A Lightweight WebGIS Visualization Platform for Historical and Cultural Heritage Based on Multi-Source Data Fusion. ISPRS International Journal of Geo-Information, 15(5), 184. https://doi.org/10.3390/ijgi15050184