Article

Refining Urban Park Accessibility and Service Coverage Assessment Using a Building-Level Population Allocation Model: Evidence from Yongsan-gu, Seoul, Korea


by
Sehan Kim
and
Choong-Hyeon Oh
*
Department of Biological and Environmental Science, Dongguk University, 32 Dongguk-ro, Ilsandong-gu, Goyang 10326, Gyeonggi-do, Republic of Korea
*
Author to whom correspondence should be addressed.
ISPRS Int. J. Geo-Inf. 2026, 15(4), 165; https://doi.org/10.3390/ijgi15040165
Submission received: 27 January 2026 / Revised: 17 March 2026 / Accepted: 9 April 2026 / Published: 11 April 2026

Abstract

Urban neighborhood parks are essential infrastructure for sustainable cities, supporting physical and mental health, social cohesion, and climate adaptation. Equity-oriented park planning, however, requires accurate identification of residents who can access parks within network-constrained travel time thresholds. Many accessibility studies estimate served populations using coarse administrative zones and areal-weighting assumptions, which can bias results in heterogeneous, vertically developed districts. This study develops a building-based population allocation framework (implemented via a building centroid overlay) that integrates Statistics Korea’s census output areas (2023 Q4 release) with the Ministry of Land, Infrastructure and Transport (MOLIT)’s GIS Integrated Building Information database (2023 Q4 release) and applies it to Yongsan-gu (Yongsan District), Seoul. Park entrances were verified and digitized using street-view imagery available on multiple web map platforms, and walkable service areas (5 and 10 min) were delineated via network analysis. Potential service coverage and unserved population were then estimated under three spatial configurations—administrative dong (neighborhood-level administrative unit in Seoul; hereafter administrative unit), census output area, and building-based allocation—and compared. Under the 10 min scenario, the unserved share reached 24.6% at the administrative unit level but decreased to 5.9% and 4.3% when using census output areas and building-based allocation, respectively. The building-based approach additionally revealed micro-scale clusters of unserved residents near localized pedestrian constraints and boundary-crossing areas that are obscured by zone-based methods. These findings demonstrate the sensitivity of access-based potential service coverage diagnostics to spatial unit choice and population disaggregation and suggest that building-based population allocation can improve the targeting of park pro-vision policies and promote spatial equity in dense, vertically developed cities.

1. Introduction

Urban parks are widely recognized as essential infrastructure for sustainable cities because they provide ecosystem services and support physical and mental health, social cohesion, and climate adaptation [1,2,3,4]. Yet, the distribution of park access is often uneven across neighborhoods, raising concerns about spatial equity in proximity-based access to green space [5,6,7]. Identifying who is served by existing parks is therefore a prerequisite for evidence-based park planning, particularly in compact cities where barriers, vertical housing, and land-use heterogeneity can generate sharp accessibility gradients.

1.1. Background and Motivation

Equity-oriented assessments often operationalize park access as the population that can reach a park within a walking time threshold along the street network [8,9]. Such indicators are frequently used in municipal performance monitoring and proximity-planning narratives that emphasize local access to everyday services [9,10]. In Seoul, where residential density is high and the built environment is complex, fine-grained diagnostics of access-based potential service coverage are needed to prioritize unserved micro-areas and avoid misdirected investments.
Recent green-equity research has shown that unequal access to urban green space is shaped not only by residential location, but also by everyday mobility patterns and the uneven travel constraints faced by marginalized groups. This broader perspective suggests that residential proximity-based park indicators remain useful, but should be interpreted as one component of a wider environmental justice framework [11].

1.2. Park Accessibility Assessment Based on Walking Time

Walking time thresholds (e.g., 5 and 10 min) are commonly used to represent the accessibility of neighborhood parks for everyday residents. Methodologically, network-based accessibility is preferred over Euclidean buffers because it incorporates street connectivity and physical barriers; thus, access is evaluated using network-constrained travel time, rather than straight-line distance [8,12]. Reflecting this methodological shift, some jurisdictions now define planning standards for public facilities (e.g., schools and green areas) using pedestrian network distances, although Euclidean measures remain common for broad strategic screening. More refined accessibility measures can better approximate effective service coverage than simple buffer-based representations, particularly where pedestrian routes, barriers, and entrance locations constrain realized access. Accordingly, network-based service-area analysis is increasingly favored in planning-oriented assessments because it more closely reflects walkable access under actual route constraints [13].

1.3. Spatial Resolution, Population Disaggregation, and the MAUP

A persistent challenge in accessibility assessment is that population data is typically available in aggregated form (e.g., administrative units). The choice of spatial unit can substantially influence equity metrics due to the modifiable areal unit problem (MAUP) [14,15]. Areal interpolation methods transfer data between zonal systems under explicit assumptions about within-zone population distribution [16]. Dasymetric mapping improves upon simple areal weighting by using ancillary information to constrain plausible population distribution [17,18,19,20]. Building-based ancillary data are particularly promising in high-rise and mixed housing environments because they capture vertical residential capacity through attributes such as gross floor area (GFA) [21,22]. Recent empirical studies have further shown that spatial accessibility estimates can vary substantially across levels of aggregation, underscoring how MAUP-related scale effects can distort conclusions about service coverage and spatial equity [23].
While building-based and dasymetric disaggregation have been widely applied in accessibility research, fewer studies have directly compared how coarse administrative units, fine-scale census output areas, and GFA-informed building-based allocation alter park service-coverage estimates under an identical network-based service-area framework in a dense, vertically developed district. The contribution of this study therefore lies not in introducing building-based disaggregation per se, but in empirically demonstrating the scale sensitivity of access-based service coverage diagnostics and in clarifying where the additional value of building-based allocation is most evident—particularly in boundary-crossing units where areal weighting can smooth population across partially served and unserved space.

2. Materials and Methods

2.1. Study Area

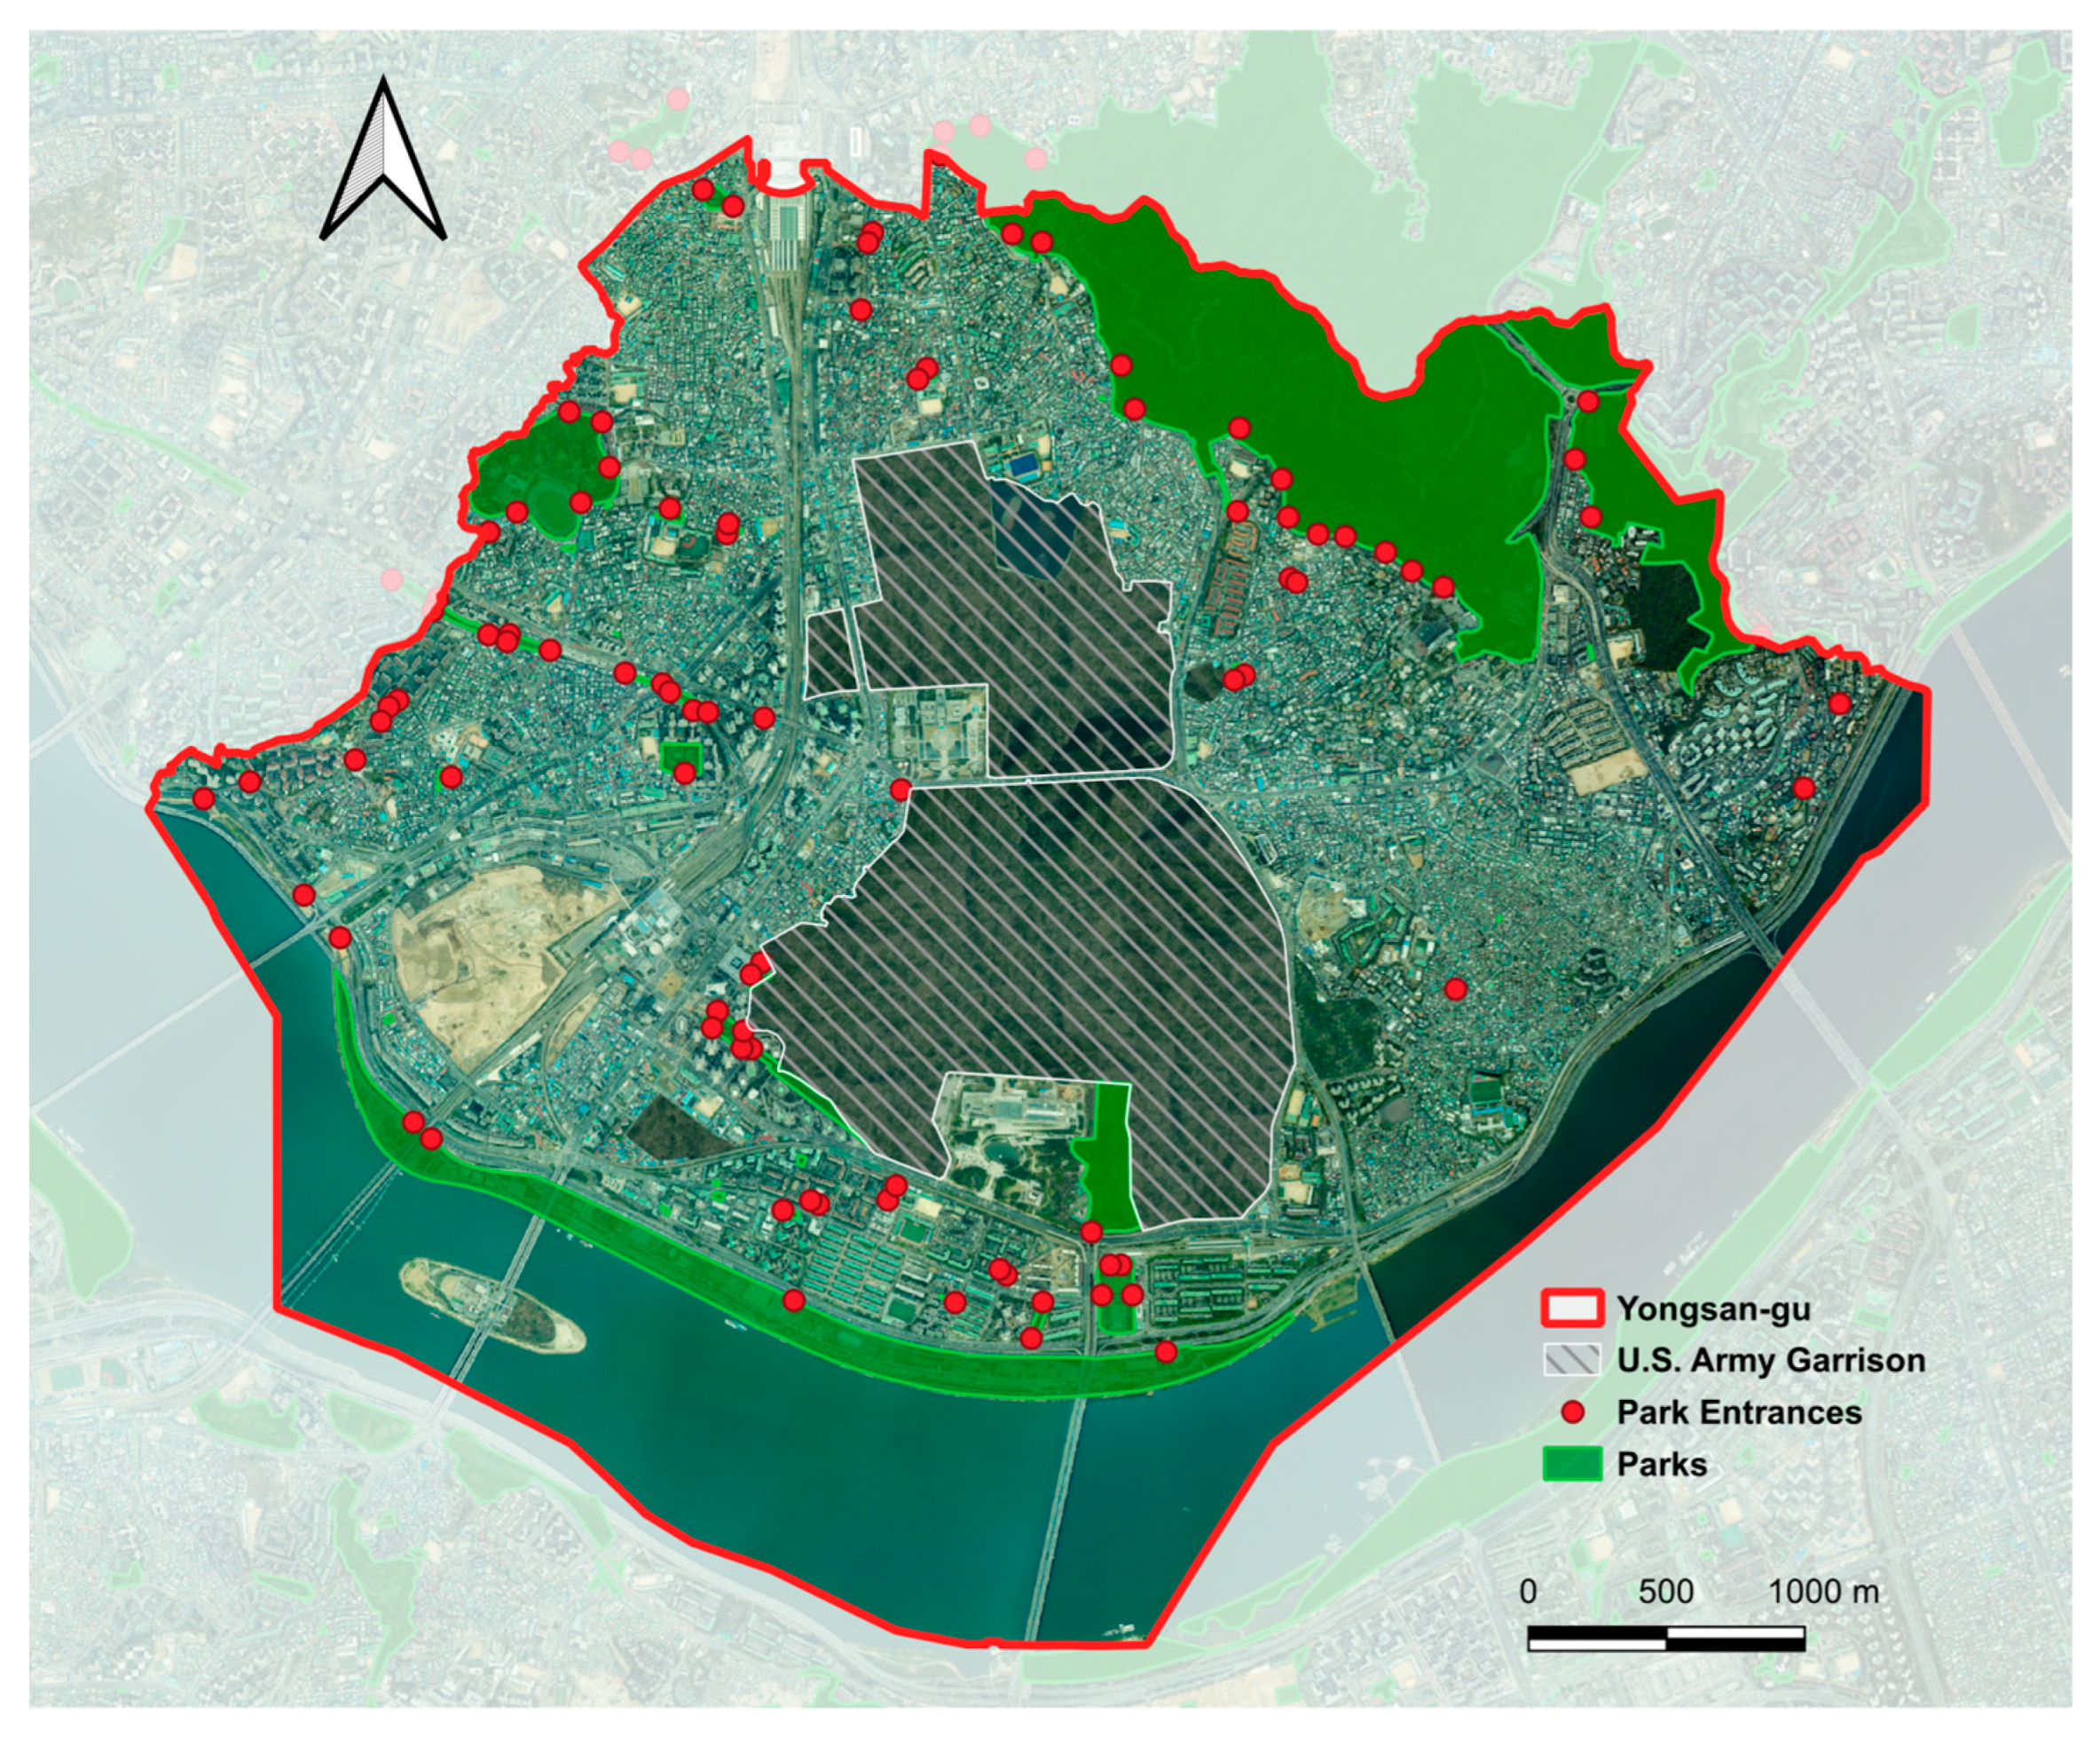
The empirical analysis focuses on Yongsan-gu, a centrally located district in Seoul characterized by a mixture of urban forms ranging from old low-rise neighborhoods to large-scale residential complexes, which primarily denote high-rise apartment complexes and large mixed-use residential compounds with substantial vertical residential floor area. These features make Yongsan-gu an appropriate setting for evaluating how spatial unit choice and population disaggregation affect park accessibility and equity diagnostics. The spatial distribution of the study area and urban parks in Yongsan-gu is shown in Figure 1.

2.2. Data and Preprocessing

Four primary datasets were used. First, urban park polygons were obtained from municipal open data sources [25]. Second, park entrances were digitized as point features by cross-checking official facility information with street-view imagery available on multiple web map platforms (Kakao Map, Naver Map, and Google Maps) [26,27,28]. An entrance was retained when a pedestrian-accessible connection to the street network could be confirmed from street-view imagery; in addition to formal gates, observable informal access points (e.g., openings in fences) were included when they functioned as practical pedestrian entry locations. The final dataset comprised 97 entrance points. Third, population counts and boundary geometries were sourced from Statistics Korea’s census output areas (2023 Q4 release) and administrative units [29]. Fourth, building footprints and attributes (including use codes and GFA) were obtained from MOLIT’s GIS Integrated Building Information database (2023 Q4 release) [24]. These 2023 Q4 datasets represent the most recently released public versions available at the time of analysis, ensuring temporal consistency across population and building inputs. Small-area statistics and boundaries were obtained from the 2023 Q4 public release of SGIS. This choice aligns the analysis with Korea’s combined census system, introduced in 2015, under which basic population and housing information is compiled annually from administrative registers and detailed characteristics are collected through a quinquennial sample survey [29]. For transparency and reproducibility, the author-generated geospatial layers used in the analysis, including the digitized park entrance layer and the network-based service-area layer, are provided in the Supplementary Materials.

2.2.1. Residential Building Filtering and Attribute Completion

To minimize bias from nonresidential structures, buildings were filtered by use codes to retain only residential categories (e.g., detached and multi-family housing). For records with missing or zero GFA, attributes were cross-checked against official building and real-estate information portals and manually supplemented when verifiable. In Yongsan-gu, the initial building dataset contained 29,815 records; after filtering by residential use codes, 19,699 residential building records were retained for allocation. Among these retained residential buildings, 29 records (0.15%) had missing or zero GFA values and were manually supplemented using official building and real-estate information portals. This refinement improved data completeness and mitigated the risk of under- or over-allocation during subsequent population disaggregation [30]. Because the source building database provides building-level use codes and does not separate floor-by-floor residential versus commercial floor area, mixed-use buildings were handled using their building-level residential classification. This may introduce uncertainty in cases where residential and commercial functions coexist within the same structure, and we explicitly acknowledge this limitation.

2.2.2. Building-Based Population Allocation (Dasymetric Mapping)

Population allocation was implemented as a dasymetric mapping procedure. Residential building polygons were converted to centroid points and spatially joined to census output areas. The total population of each output area was then distributed to its residential buildings proportionally to GFA, which serves as a proxy for residential capacity in vertically developed neighborhoods.
P b ^ = P j × G F A b b j G F A b ,
where P b ^ is the estimated population of building b ; P j is the total population of census output area j ; G F A b is the G F A of building b ; and b j G F A b is the sum of GFAs of all residential buildings in j .

2.3. Analytical Workflow

2.3.1. Service Area Delineation via Network Analysis

Using the digitized park entrance points as origins, walkable service areas were delineated in Esri ArcGIS Pro 3.6.0 (Network Analyst) utilizing the ArcGIS Online Routing Service [31]. Two thresholds were examined: 5 min and 10 min walking time. A walking speed of 5 km/h was applied, consistent with the default WalkTime travel mode in ArcGIS Online. Walking speeds vary across age and mobility groups; thus, the present results should be interpreted as a standardized benchmark rather than group-specific behavioral estimates [8,20,31,32].

2.3.2. Estimating Served and Unserved Populations

Served populations were evaluated across three spatial configurations. For administrative units and census output areas, the population was estimated using areal weighting (proportional allocation by intersected area), rather than a binary centroid-inclusion rule. Under this approach, the population of each zone was multiplied by the fraction of zone area intersecting the service area polygon. In contrast, for the building centroid configuration, the served population was derived by summing the populations assigned to centroids located within the service area (via point-in-polygon overlay). Accordingly, the served population was computed using Equations (2) and (3), and residents outside the delineated 5 or 10 min network-based service areas were classified as unserved (i.e., unserved population = total population − P s e r v e d ).
P s e r v e d = i P i × Area S Z i Area Z i ,
where P i is the total population of zone i (either an administrative unit or an output area); S is the walkable service area polygon derived from the network analysis; Z i is the geometry of zone i ; and Area S Z i represents the area of the intersection between the service area and the zone.
P s e r v e d = b S P b ^ ,
where b S denotes the set of residential building centroids located inside the service area S , identified via a standard point-in-polygon overlay. Unlike the zone-based approach, this method accounts for the discrete and vertical distribution of residents. Finally, the unserved population for each configuration was defined as the total district population minus the corresponding P s e r v e d .
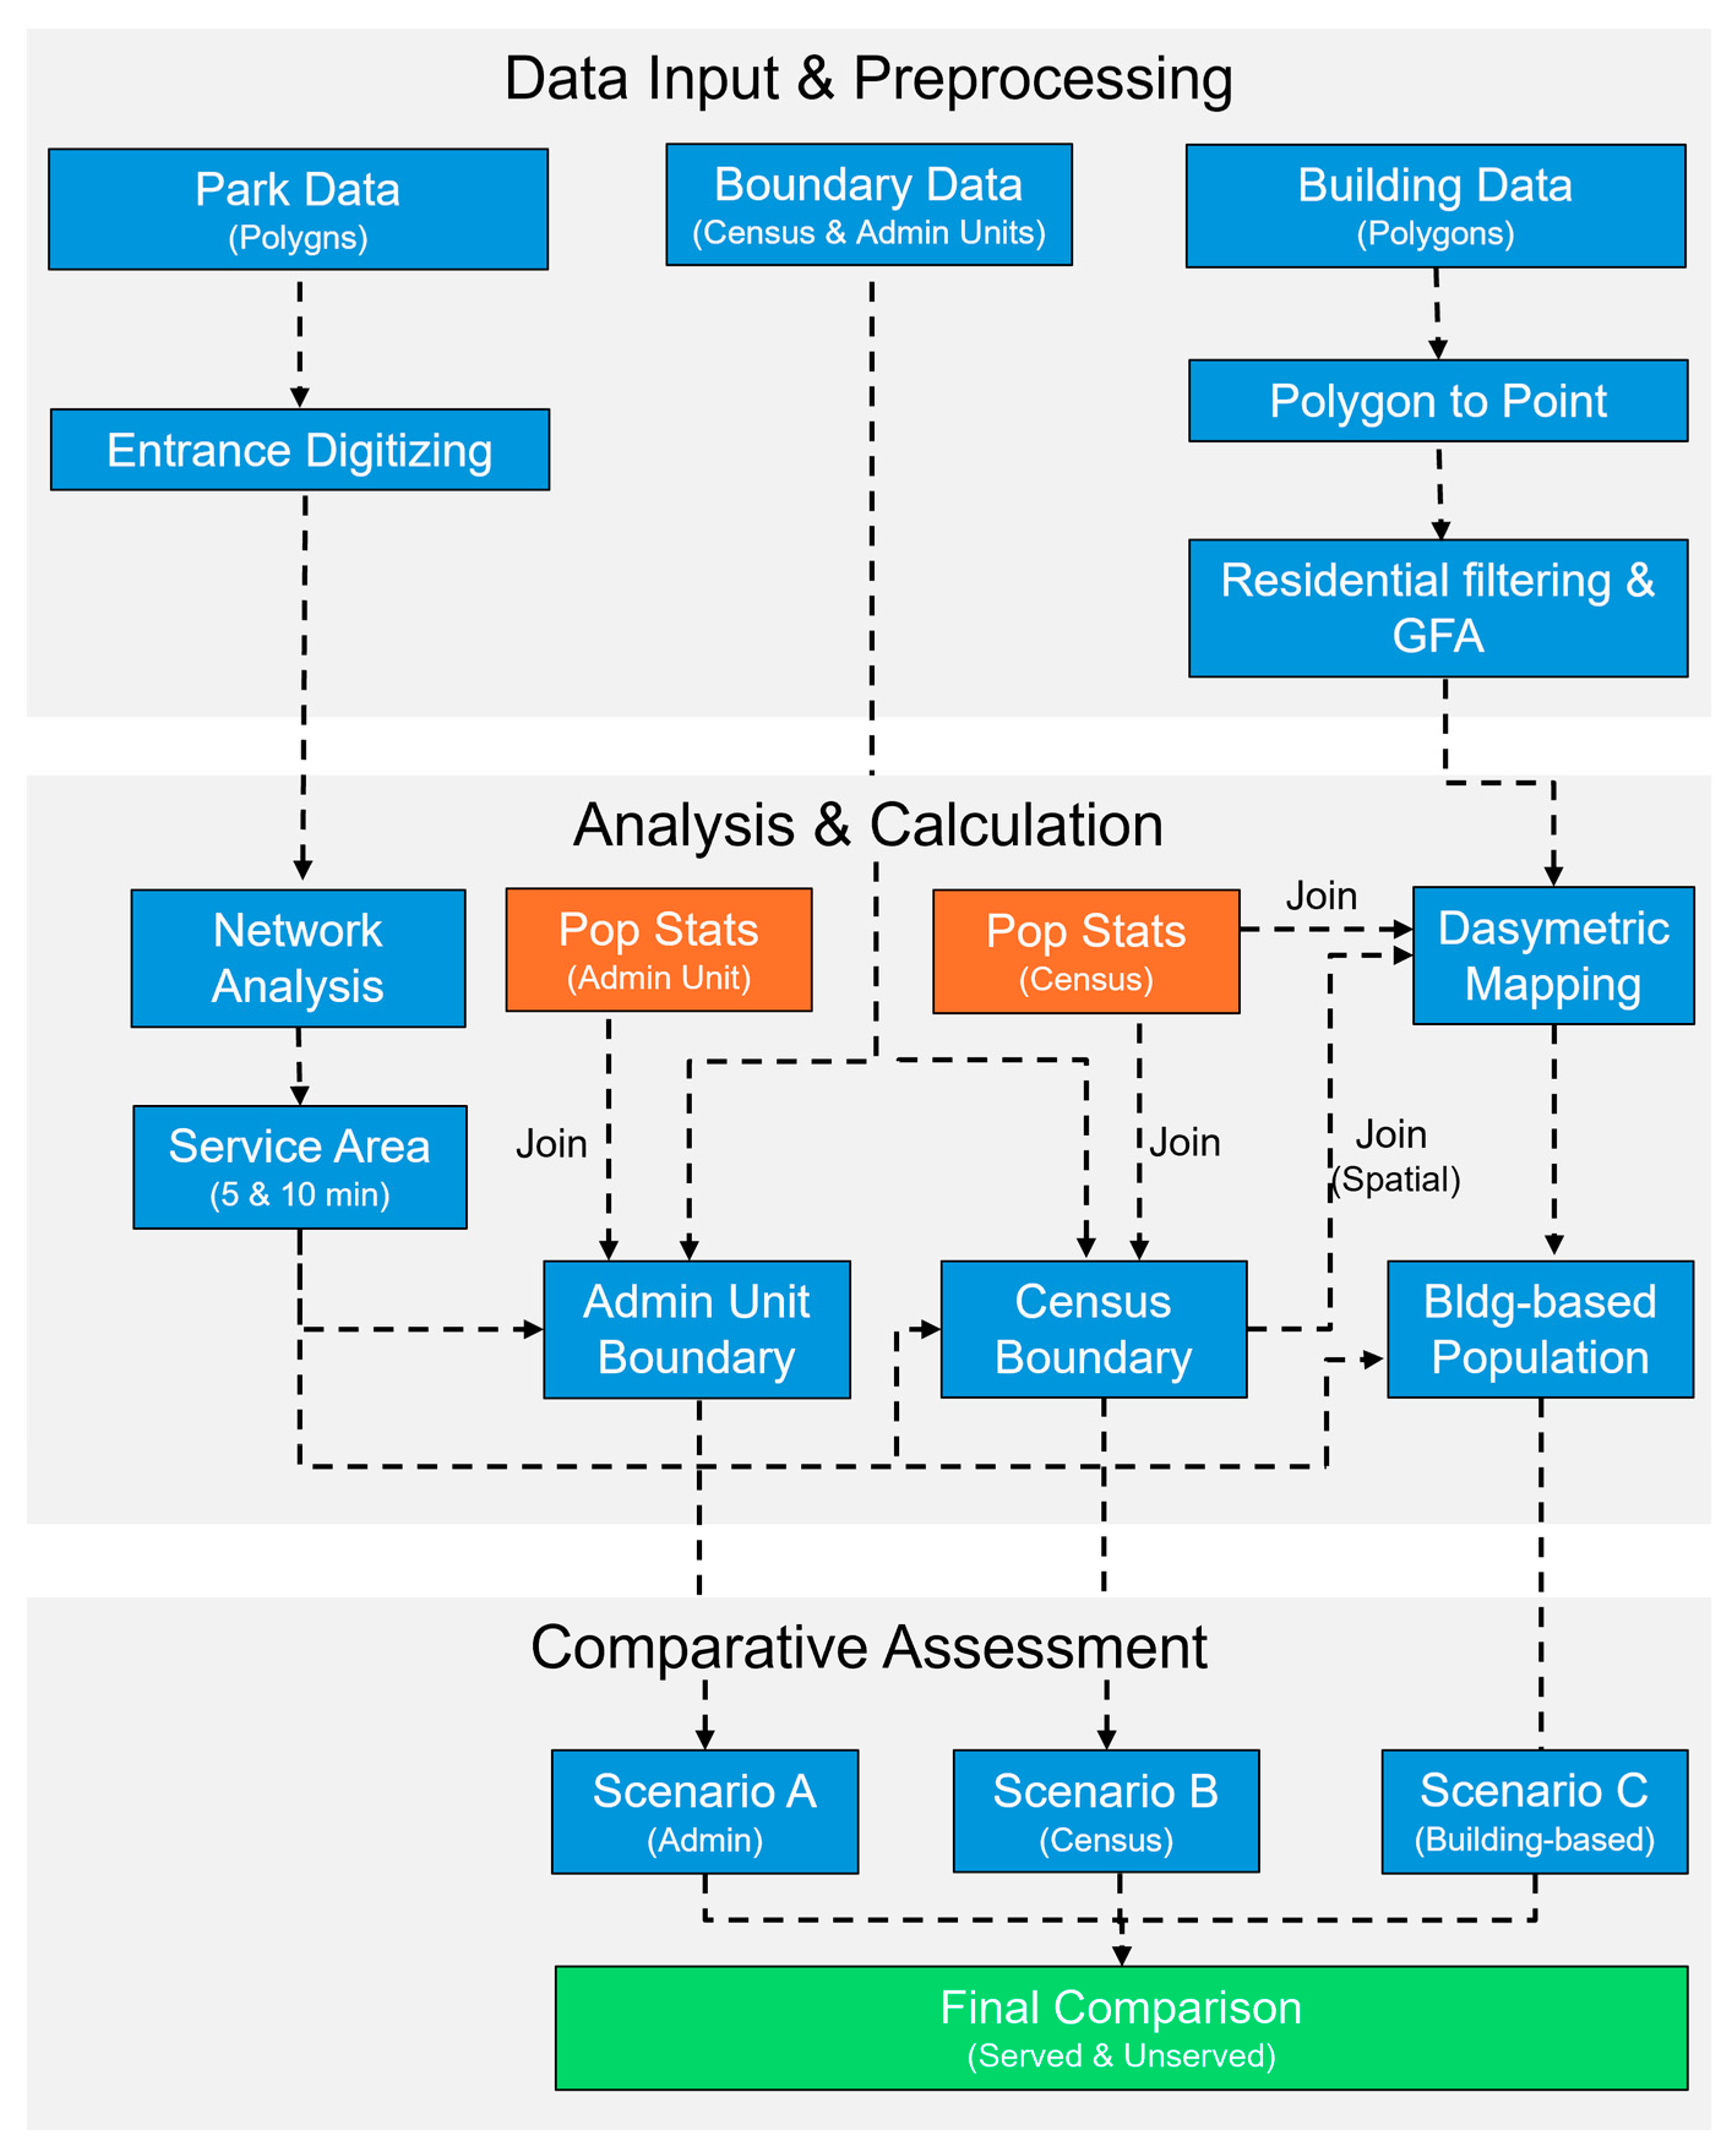
The overall data-processing and analytical workflow is summarized in Figure 2.

3. Results

3.1. Served and Unserved Population by Spatial Configuration

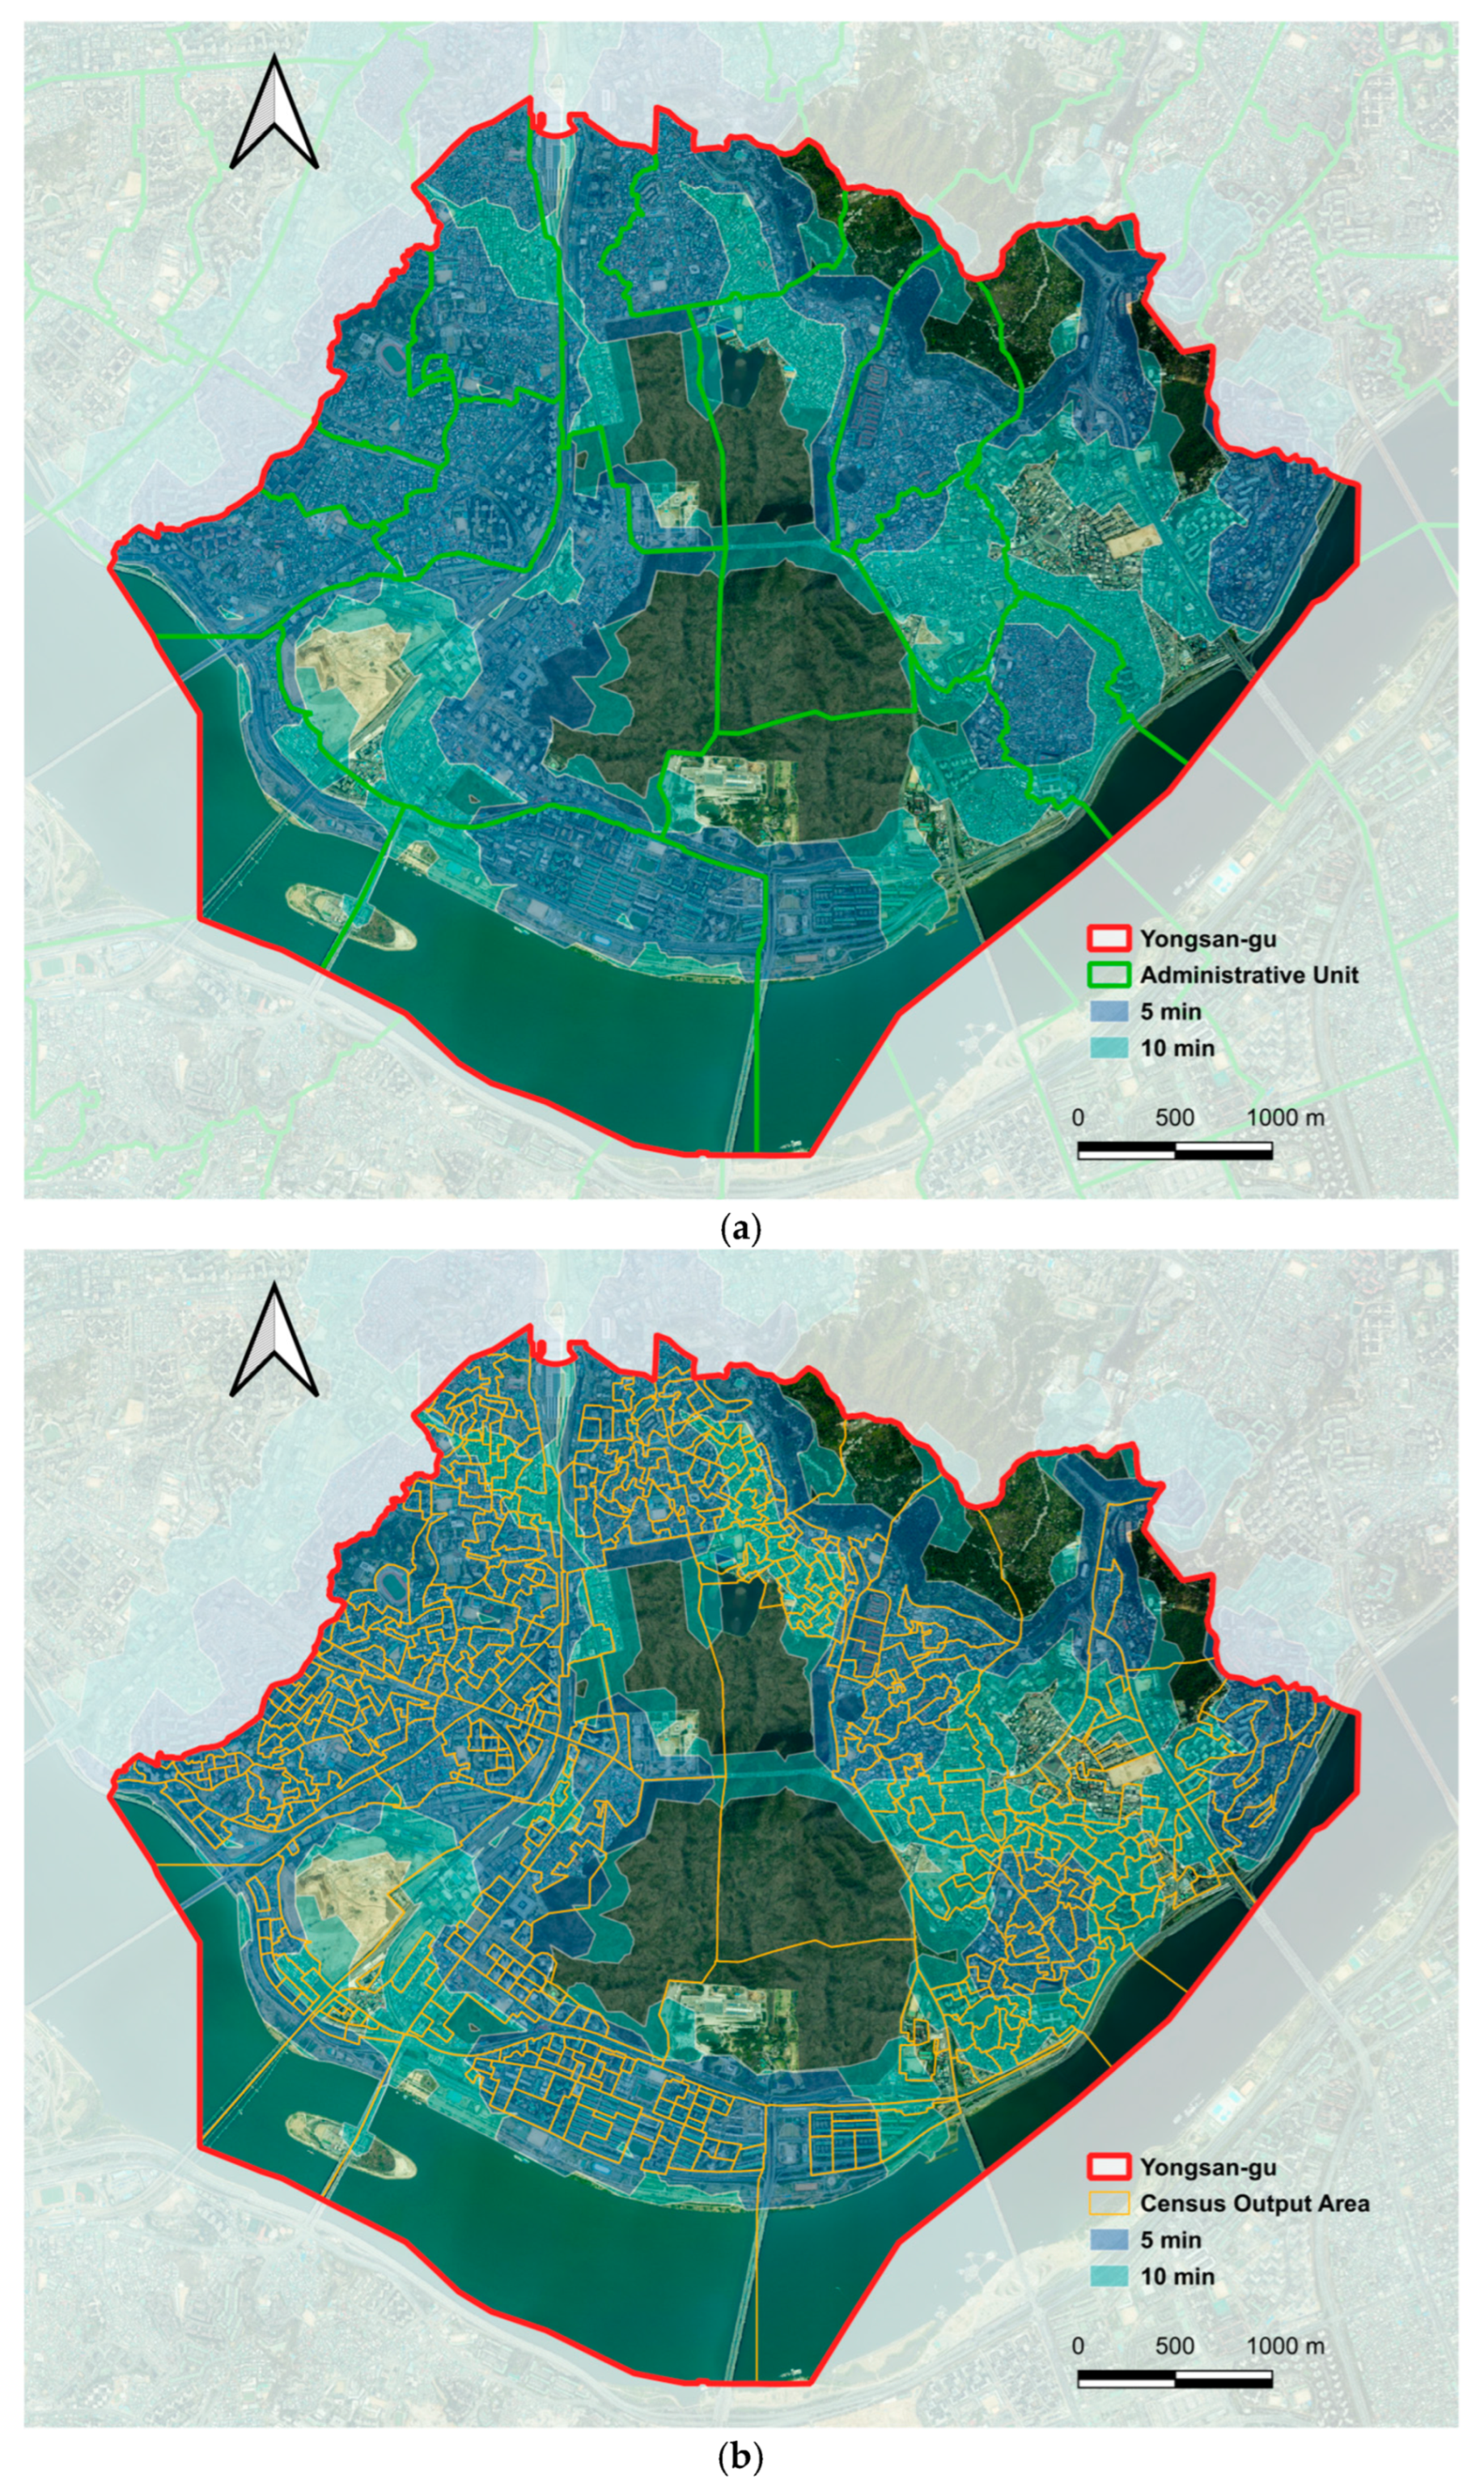
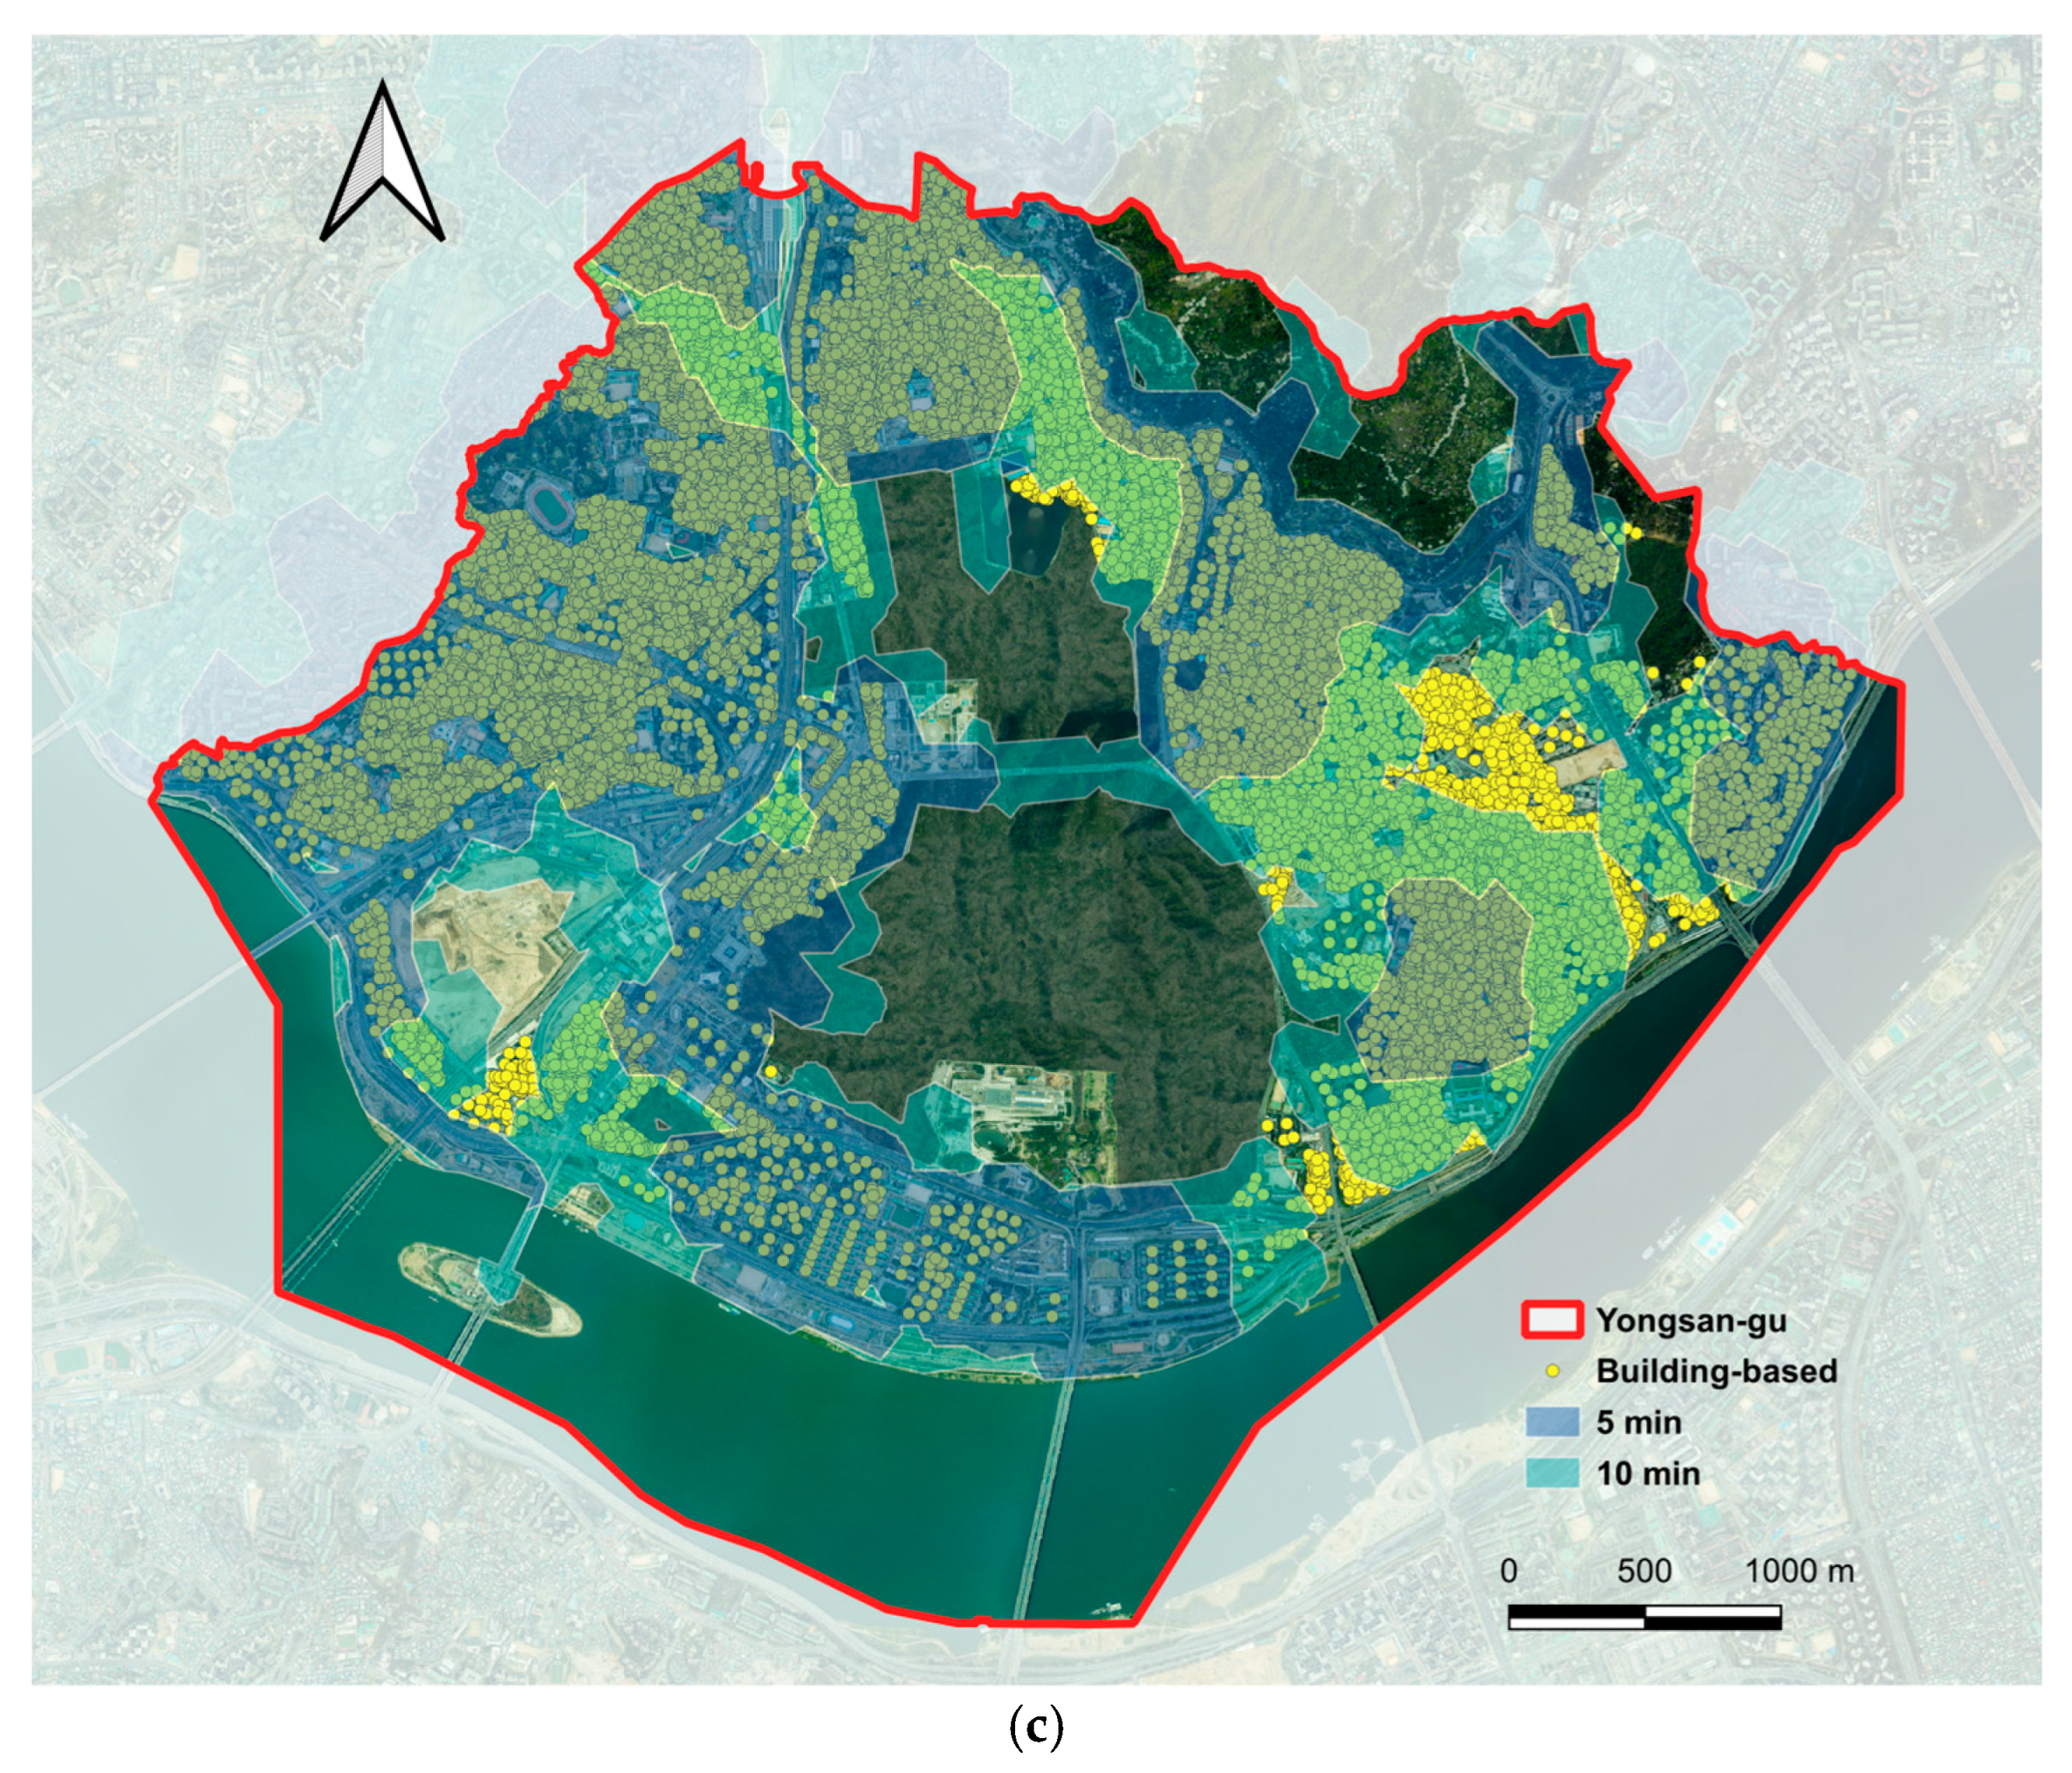
Table 1 and Table 2 report served and unserved population counts and unserved shares under the 5 min and 10 min scenarios, respectively. Across both scenarios, unserved shares differed substantially by spatial configuration, suggesting that results depend on the spatial unit and the level of population disaggregation. Figure 3 further demonstrates that the spatial pattern of unserved populations differs by analytical configuration: compared with the administrative unit and census output area approaches, the building-based allocation reveals more localized and boundary sensitive clusters of unserved residents.
Under the 5 min scenario (Table 1), the estimated unserved share ranged from 28.2% for the building-based (GFA allocation) configuration to 43.3% for the administrative unit configuration. The substantially higher unserved estimate produced by the administrative unit approach is consistent with aggregation bias, whereby coarser units smooth within-zone heterogeneity in land use and residential distribution near service boundaries.
Under the 10 min scenario (Table 2), unserved shares declined, but they still varied substantially by spatial configuration. The administrative unit configuration yielded an unserved share of 24.6%, whereas the census-output-area and building-based configurations produced much lower estimates of 5.9% and 4.3%, respectively. The comparatively lower unserved shares from the building-based approach are consistent with its finer spatial granularity, which can better represent residential concentration, including high-rise residential intensity, that may be obscured when relying on zone-level averages. A summary comparison of the three population allocation approaches, including their allocation logic, strengths, limitations, and resulting unserved shares under the 5 and 10 min scenarios, is provided in Table 3.

3.2. Boundary-Focused Discrepancy Analysis

Boundary-focused discrepancy analysis was conducted to identify where the divergence between the census-output-area areal-weighting method and the building-based allocation method arises. The analysis was restricted to census output areas intersecting the network-defined service-area boundary. For each census output area i and scenario s (5 or 10 min), the signed discrepancy in unserved population was calculated as the difference between the unserved population estimated by areal weighting and that estimated by building-based allocation.
D i , s = U i , s A U i , s B ,
where D i , s is the signed discrepancy in unserved population for output area i under scenario s ; U i , s A is the unserved population estimated using the areal-weighting method; and U i , s B is the unserved population estimated using the building-based allocation method.
To account for variation in population size across output areas, the discrepancy was further standardized by the total population of each output area.
Δ i , s = D i , s P i × 100 ,
where Δ i , s is the difference in unserved-population share, expressed in percentage points for output area i under scenario s , and P i is the total population of output area i .
The discrepancy between the two methods was concentrated entirely in boundary-crossing output areas, whereas output areas located fully inside or fully outside the service area produced virtually identical unserved estimates (Table 4 and Table 5). Under the 5 min scenario, 149 output areas (33.7% of 442) intersected the service boundary (Table 4). In these crossing units, the population-weighted net discrepancy was +2.30 percentage points, indicating that areal weighting tended to estimate a higher unserved share than building-based allocation on average (Table 5). Under the 10 min scenario, 185 output areas (41.9% of 442) were boundary-crossing (Table 4), and the population-weighted net discrepancy increased to +3.74 percentage points (Table 5).
The magnitude of divergence within crossing units was also nontrivial. The population-weighted mean absolute discrepancy reached 11.07 percentage points in the 5 min scenario and 7.18 percentage points in the 10 min scenario (Table 5). Moreover, the direction of discrepancy became more systematic in the 10 min scenario. Among crossing units with nonzero differences, 65.15% showed U i , s A > U i , s B (Table 5), and a Wilcoxon signed-rank test indicated that the signed differences were significantly greater than zero ( p = 0.004 ). By contrast, the corresponding test was not significant in the 5 min scenario ( p = 0.123 ), suggesting greater local heterogeneity in boundary effects under the shorter threshold.
Finally, exploratory analysis based on Δ i , s indicated that the magnitude of discrepancy increased with output-area size and decreased with population density in crossing units. Correlation estimates excluded one crossing unit with zero population because Δ i , s is undefined when P i = 0 . Spearman’s ρ   values were 0.314 for area and −0.294 for density in the 5 min scenario, and 0.473 for area and −0.480 for density in the 10 min scenario ( p < 0.001 in all cases). Together, these results suggest that the additional value of building-based allocation beyond fine-scale census units is most evident in spatially large and relatively low-density boundary-crossing units, where areal weighting is more likely to smooth population across partially served and unserved space.

4. Discussion

4.1. Implications of Spatial Unit Choice and the MAUP

The comparison across administrative-unit, census output area, and building-based configurations demonstrates that unserved-population estimates—and thus inferred spatial equity—are highly sensitive to the population estimation unit, illustrating MAUP-related scale effects in park accessibility diagnostics. Coarse administrative units may artificially inflate the unserved population share, particularly when residential clusters are concentrated near park access points while the broader zone remains outside the service area. This finding corroborates prior research on the MAUP [14,15].

4.2. Value and Limitations of Building-Based Population Allocation

Building-informed dasymetric mapping provides a more spatially explicit population surface when direct occupancy records are unavailable. By anchoring residents to plausible residential structures before overlaying service areas, it reduces the tendency of areal weighting to smooth population across zone boundaries. In this study, GFA was used as a proxy for vertical residential capacity, which is not captured by planar areal-weighting approaches [21,22]. Importantly, we do not interpret the building-based allocation as empirically validated ground truth; rather, it should be understood as a data-informed refinement intended to reduce boundary-induced aggregation bias and spatial smearing under data constraints. Where GFA data are unavailable, similar building-based approaches may approximate vertical residential capacity using building footprint area combined with floor counts (or building height) and occupancy-density assumptions [21].
The use of building-level data is particularly valuable in heterogeneous urban environments where residential and non-residential land uses are intermingled. Notably, district-level differences between the census-output-area and building-based estimates were modest in Yongsan-gu, especially under the 5 min threshold. This likely reflects the district’s high density and the already fine granularity of census output areas. However, the added boundary-focused analysis indicates that divergence is concentrated in boundary-crossing output areas and is especially pronounced in spatially large and relatively low-density crossing units, where areal weighting is more likely to smooth population across partially served and unserved space. This finding clarifies that the additional value of building-based allocation beyond fine-scale census units is context-dependent and becomes more evident in heterogeneous boundary zones and potentially in more fragmented, mixed-use, or lower-density urban settings. In such settings, zone-based areal weighting can induce “spatial smearing,” whereby residents are implicitly allocated to uninhabited or nonresidential space [18,20]. A further limitation concerns the temporal scope of the analysis. The present study reflects a static residential population surface based on the 2023 Q4 dataset and therefore most closely represents nighttime residential accessibility. In a highly dynamic district such as Yongsan-gu, accessibility demand may differ during daytime due to commuting flows, office concentration, and visitor activity. Future research could incorporate daytime population dynamics to evaluate park accessibility for workers, commuters, and non-resident users.

4.3. Policy Implications for Park Provision and Environmental Justice

From a policy perspective, coarse spatial units can overstate the size of the unserved population and obscure where interventions are most needed. Higher-resolution diagnostics of potential service coverage can support more targeted strategies—such as pocket parks, entrance upgrades, and improved pedestrian connections near barrier-prone segments—thereby aligning investments with access-oriented equity objectives [6,9]. In Yongsan-gu, these localized service gaps appear to be associated with several kinds of pedestrian barriers, including railway-related discontinuities, steep hillside streets in some residential areas, and wide arterial roads that reduce direct pedestrian access even where parks are geographically nearby.

5. Conclusions

This study refined park access assessment by integrating building-based population allocation with network-based service areas across multiple spatial configurations. The findings lead to the following three conclusions:
  • Spatial unit choice significantly alters estimates of unserved populations and equity metrics. This sensitivity reinforces the practical importance of addressing the MAUP in accessibility diagnostics, as coarser units can obscure micro-level service gaps.
  • Building-based allocation using GFA can provide a more spatially explicit representation of vertical residential intensity and, in our comparisons, was consistent with reduced aggregation bias compared to traditional zone-level weighting. While the divergence between methods was moderate in a high-density urban context, the building-based approach remains valuable for reducing “spatial smearing” in more fragmented or low-density environments.
  • In dense, vertically developed cities, building-informed disaggregation provides the precision necessary for evidence-based policy targeting. By identifying residents more plausibly served by parks, this approach supports more efficient investments in pocket parks, entrance upgrades, and pedestrian connectivity.
Further research should validate building-based allocations using independent occupancy data and examine this methodology across an urban-to-rural gradient. Testing the model in diverse urban forms will further clarify how varying population densities influence the robustness of accessibility diagnostics.

Supplementary Materials

The following supporting information can be downloaded at: https://www.mdpi.com/article/10.3390/ijgi15040165/s1, Dataset S1: Park Entrances, Yongsan; Dataset S2: Network-Based Service Area.

Author Contributions

Conceptualization, Sehan Kim; methodology, Sehan Kim; software, Sehan Kim; validation, Sehan Kim; formal analysis, Sehan Kim; investigation, Sehan Kim; resources, Sehan Kim; data curation, Sehan Kim; writing—original draft preparation, Sehan Kim; writing—review and editing, Sehan Kim and Choong-Hyeon Oh; visualization, Sehan Kim; supervision, Sehan Kim; project admin-istration, Sehan Kim; funding acquisition, Sehan Kim. All authors have read and agreed to the published version of the manuscript.

Funding

This research received no external funding.

Institutional Review Board Statement

Not applicable.

Informed Consent Statement

Not applicable.

Data Availability Statement

Publicly available datasets were analyzed in this study. These data sources are cited in the References, and the derived data and results are contained within the article and the Supplementary Materials.

Acknowledgments

The authors acknowledge Statistics Korea and the Ministry of Land, Infrastructure and Transport (MOLIT) for providing the public datasets used in this study. The authors also thank the providers of web map platforms used to verify park entrance locations.

Conflicts of Interest

The authors declare no conflicts of interest.

Abbreviations

The following abbreviations are used in this manuscript:
GFAGross Floor Area
GISGeographic Information System
MAUPModifiable Areal Unit Problem
MOLITMinistry of Land, Infrastructure and Transport

References

  1. Chiesura, A. The Role of Urban Parks for the Sustainable City. Landsc. Urban Plan. 2004, 68, 129–138. [Google Scholar] [CrossRef]
  2. World Health Organization. Urban Green Spaces and Health; WHO Regional Office for Europe: Copenhagen, Denmark, 2016. [Google Scholar]
  3. Ulrich, R.S. View Through a Window May Influence Recovery from Surgery. Science 1984, 224, 420–421. [Google Scholar] [CrossRef]
  4. Twohig-Bennett, C.; Jones, A. The Health Benefits of the Great Outdoors: A Systematic Review and Meta-Analysis of Greenspace Exposure and Health Outcomes. Environ. Res. 2018, 166, 628–637. [Google Scholar] [CrossRef]
  5. Wolch, J.R.; Byrne, J.; Newell, J.P. Urban Green Space, Public Health, and Environmental Justice: The Challenge of Making Cities ‘Just Green Enough’. Landsc. Urban Plan. 2014, 125, 234–244. [Google Scholar] [CrossRef]
  6. Talen, E. Visualizing Fairness: Equity Maps for Planners. J. Am. Plan. Assoc. 1998, 64, 22–38. [Google Scholar] [CrossRef]
  7. Rigolon, A. A Complex Landscape of Inequity in Access to Urban Parks: A Literature Review. Landsc. Urban Plan. 2016, 153, 160–169. [Google Scholar] [CrossRef]
  8. Geurs, K.T.; van Wee, B. Accessibility Evaluation of Land-Use and Transport Strategies: Review and Research Directions. J. Transp. Geogr. 2004, 12, 127–140. [Google Scholar] [CrossRef]
  9. Moreno, C.; Allam, Z.; Chabaud, D.; Gall, C.; Pratlong, F.; Moreno, C.; Allam, Z.; Chabaud, D.; Gall, C.; Pratlong, F. Introducing the “15-Minute City”: Sustainability, Resilience and Place Identity in Future Post-Pandemic Cities. Smart Cities 2021, 4, 93–111. [Google Scholar] [CrossRef]
  10. Nicholls, S. Measuring the Accessibility and Equity of Public Parks: A Case Study Using GIS. Manag. Leis. 2001, 6, 201–219. [Google Scholar] [CrossRef]
  11. Rui, J. Marginalized but Equal? An Investigation of Visible Green Equity Disparities in Marginalized Residents’ Daily Commutes and Its Potential Green Solutions. Habitat Int. 2025, 165, 103556. [Google Scholar] [CrossRef]
  12. Dijkstra, E.W. A Note on Two Problems in Connexion with Graphs. Numer. Math. 1959, 1, 269–271. [Google Scholar] [CrossRef]
  13. Dong, Q.; Zeng, P.; Long, X.; Peng, M.; Tian, T.; Che, Y. An Improved Accessibility Index to Effectively Assess Urban Park Allocation: Based on Working and Residential Situations. Cities 2024, 145, 104736. [Google Scholar] [CrossRef]
  14. Openshaw, S. The Modifiable Areal Unit Problem; Concepts and Techniques in Modern Geography; Geo: Norwich, UK, 1984. [Google Scholar]
  15. Fotheringham, A.S.; Wong, D.W.S. The Modifiable Areal Unit Problem in Multivariate Statistical Analysis. Environ. Plan. A 1991, 23, 1025–1044. [Google Scholar] [CrossRef]
  16. Goodchild, M.; Lam, N. Areal Interpolation: A Variant of the Traditional Spatial Problem. Geo-Processing 1980, 1, 297–312. [Google Scholar]
  17. Wright, J.K. A Method of Mapping Densities of Population: With Cape Cod as an Example. Geogr. Rev. 1936, 26, 103–110. [Google Scholar] [CrossRef]
  18. Eicher, C.L.; Brewer, C.A. Dasymetric Mapping and Areal Interpolation: Implementation and Evaluation. Cartogr. Geogr. Inf. Sci. 2001, 28, 125–138. [Google Scholar] [CrossRef]
  19. Mennis, J. Generating Surface Models of Population Using Dasymetric Mapping. Prof. Geogr. 2003, 55, 31–42. [Google Scholar] [CrossRef]
  20. Maantay, J.A.; Maroko, A.R.; Herrmann, C. Mapping Population Distribution in the Urban Environment: The Cadastral-Based Expert Dasymetric System (CEDS). Cartogr. Geogr. Inf. Sci. 2007, 34, 77–102. [Google Scholar] [CrossRef]
  21. Lwin, K.; Murayama, Y. A GIS Approach to Estimation of Building Population for Micro-Spatial Analysis. Trans. GIS 2009, 13, 401–414. [Google Scholar] [CrossRef]
  22. Biljecki, F.; Stoter, J.; Ledoux, H.; Zlatanova, S.; Çöltekin, A.; Biljecki, F.; Stoter, J.; Ledoux, H.; Zlatanova, S.; Çöltekin, A. Applications of 3D City Models: State of the Art Review. ISPRS Int. J. Geo-Inf. 2015, 4, 2842–2889. [Google Scholar] [CrossRef]
  23. Meng, L. The Modifiable Areal Unit Problem (MAUP) and Spatial Accessibility Assessments of Urban Parks: Empirical Evidence from Nanjing’s Central Urban Area, China. Urban For. Urban Green. 2025, 113, 129027. [Google Scholar] [CrossRef]
  24. Ministry of Land, Infrastructure and Transport (MOLIT). V-World Spatial Information Open Platform. Available online: https://www.vworld.kr (accessed on 17 January 2026).
  25. Seoul Metropolitan Government. Seoul Open Data Plaza. Available online: https://data.seoul.go.kr (accessed on 17 January 2026).
  26. Kakao Corporation. Kakao Map. Available online: https://map.kakao.com/ (accessed on 17 January 2026).
  27. NAVER Corporation. Naver Map. Available online: https://map.naver.com/p?c=15.00,0,0,2,dh (accessed on 17 January 2026).
  28. Google LLC. Google Maps. Available online: https://www.google.com/maps (accessed on 17 March 2026).
  29. Statistics Korea. Statistical Geographic Information Service (SGIS). Available online: https://sgis.kostat.go.kr (accessed on 15 January 2026).
  30. Seoul Metropolitan Government. Seoul Real Estate Information Plaza. Available online: https://kras.seoul.go.kr (accessed on 17 January 2026).
  31. Configure Travel Modes—ArcGIS Online Help | Documentation. Available online: https://doc.arcgis.com/en/arcgis-online/reference/travel-modes.htm (accessed on 17 January 2026).
  32. Network Analyst Solvers—ArcGIS Pro | Documentation. Available online: https://pro.arcgis.com/en/pro-app/latest/help/analysis/networks/network-analyst-solver-types.htm (accessed on 17 January 2026).
Figure 1. The study area and spatial distribution of urban parks in Yongsan-gu, Seoul. Basemap: VWorld (via API in QGIS) [24].
Ijgi 15 00165 g001
Figure 2. Data and analytical workflow. Blue boxes represent geospatial data and analytical steps, orange boxes represent population statistics inputs, and the green box represents the final comparison. Dashed arrows indicate workflow and data linkage.
Ijgi 15 00165 g002
Figure 3. Spatial distribution of unserved populations under the 5 min and 10 min walking scenarios, across three spatial configurations: (a) administrative unit (zone-based); (b) census output area (zone-based); (c) building-based (GFA allocation). Localized unserved clusters represent populations allocated to zones or building centroids lying outside the network-defined service areas. The figure illustrates how coarse zoning can smooth population across service boundaries, whereas finer-resolution allocation reveals localized gaps, particularly near boundary-crossing areas and locally constrained pedestrian connections. In the maps, colors distinguish the spatial categories displayed in each panel, and dots in panel (c) represent residential building centroids used in the building-based allocation.
Ijgi 15 00165 g003aIjgi 15 00165 g003b
Table 1. Served and unserved population within 5 min walkable service areas by spatial configuration.
Spatial ConfigurationServed Population (Persons)Unserved Population (Persons)Unserved Share (%)
Administrative unit
(zone-based)
121,73693,05543.3
Building-based
(GFA allocation)
154,31660,47528.2
Census output area
(zone-based)
152,64962,14228.9
Table 2. Served and unserved population within 10 min walkable service areas by spatial configuration.
Spatial ConfigurationServed Population (Persons)Unserved Population (Persons)Unserved Share (%)
Administrative unit
(zone-based)
162,02252,76924.6
Building-based
(GFA allocation)
205,51092824.3
Census output area
(zone-based)
202,19112,6005.9
Table 3. Summary of population allocation approaches and resulting unserved shares under 5 and 10 min walking scenarios.
CategoryAdministrative Unit
(Zone-Based)
Census Output Area
(Zone-Based)
Building-Based
(GFA Allocation)
Population
allocation unit
Administrative-dong polygonCensus output area polygonResidential building centroid
Allocation logicPopulation allocated by the area ratio of service area ∩ zone (areal weighting)Population allocated by the area ratio of service area ∩ zone (areal weighting)Census output area population allocated to residential buildings in proportion to GFA, followed by point-in-polygon assignment
StrengthsConsistent with administrative units and useful for policy communicationReduces MAUP compared with administrative-dong units (finer resolution)Reduces “spatial smearing” across boundaries and non-residential land; reflects vertical residential intensity (GFA)
LimitationsCoarse aggregation may lead to over- or underestimation (aggregation bias)Limited ability to reflect internal heterogeneity in boundary-crossing unitsUnable to separate floor-level mixed uses; lacks independent validation data; dependent on assumptions
(GFA, walking speed, entrance delineation)
5 min unserved share (%)43.328.928.2
10 min unserved share (%)24.65.94.3
Table 4. Distribution of census output areas by service-area relationship under the 5 and 10 min walking scenarios.
ScenarioInside UnitsCrossing UnitsOutside UnitsCrossing Share (%)
5 min2301496333.71
10 min256185141.86
Note: Crossing units are census output areas that intersect the network-defined service-area boundary.
Table 5. Boundary-focused discrepancies between area-based and building-based unserved-population estimates.
ScenarioWeighted Net Discrepancy (%p)Weighted Absolute Discrepancy (%p)Area-Based > Building-Based Among Nonzero-Difference Units (%)Share of Total Absolute Discrepancy in Crossing Units (%)
5 min2.3011.0756.55100.00
10 min3.747.1865.15100.00
Note 1: All discrepancy measures were calculated using only crossing census output areas. Correlation analyses based on Δ i , s excluded one crossing unit with zero population because Δ i , s is undefined when P i = 0 . Note 2: Weighted net discrepancy is calculated as D i , s P i × 100 , where D i , s = U i , s A U i , s B , and is expressed in percentage points. Weighted absolute discrepancy is calculated as D i , s P i × 100 . Note 3: Because discrepancies between the two methods are negligible in inside-only and outside-only units, 100% of the total absolute discrepancy is concentrated in crossing units.
Disclaimer/Publisher’s Note: The statements, opinions and data contained in all publications are solely those of the individual author(s) and contributor(s) and not of MDPI and/or the editor(s). MDPI and/or the editor(s) disclaim responsibility for any injury to people or property resulting from any ideas, methods, instructions or products referred to in the content.