1. Introduction
Healthcare is an essential component of urban planning and directly affects quality of life [
1]. As cities grow in size and population, the fair distribution of clinics and hospitals becomes critical to ensure that all residents can find and reach services [
2]. Jeddah, one of the largest cities in Saudi Arabia, has experienced rapid urban expansion in recent decades [
3]. This growth raises important questions about whether healthcare services are evenly distributed across the city and whether their quality meets the needs of residents [
4,
5]. Digital platforms such as Google Maps now provide rich, real-time data that allow these questions to be studied in new ways [
6].
In this study, the term “healthcare facilities” refers to publicly accessible medical service providers, including hospitals, clinics, and specialised treatment centres, as represented in digital map platforms.
Previous studies of healthcare services often relied on government statistics or official reports [
7]. While useful, such sources are sometimes outdated and may not capture all active facilities [
8]. In addition, many studies have focused mainly on counting the number of facilities rather than assessing their quality from the perspective of patients [
2]. Online user ratings and textual reviews provide a valuable new opportunity to measure both service availability and perceived quality, but very few studies have combined these sources with spatial analysis [
9]. Therefore, the primary objective of this research is to establish an automated and reusable framework for collecting and organising spatial facility data, which can support a range of downstream analyses, including accessibility assessment and service quality evaluation, without being limited to a specific analytical model.
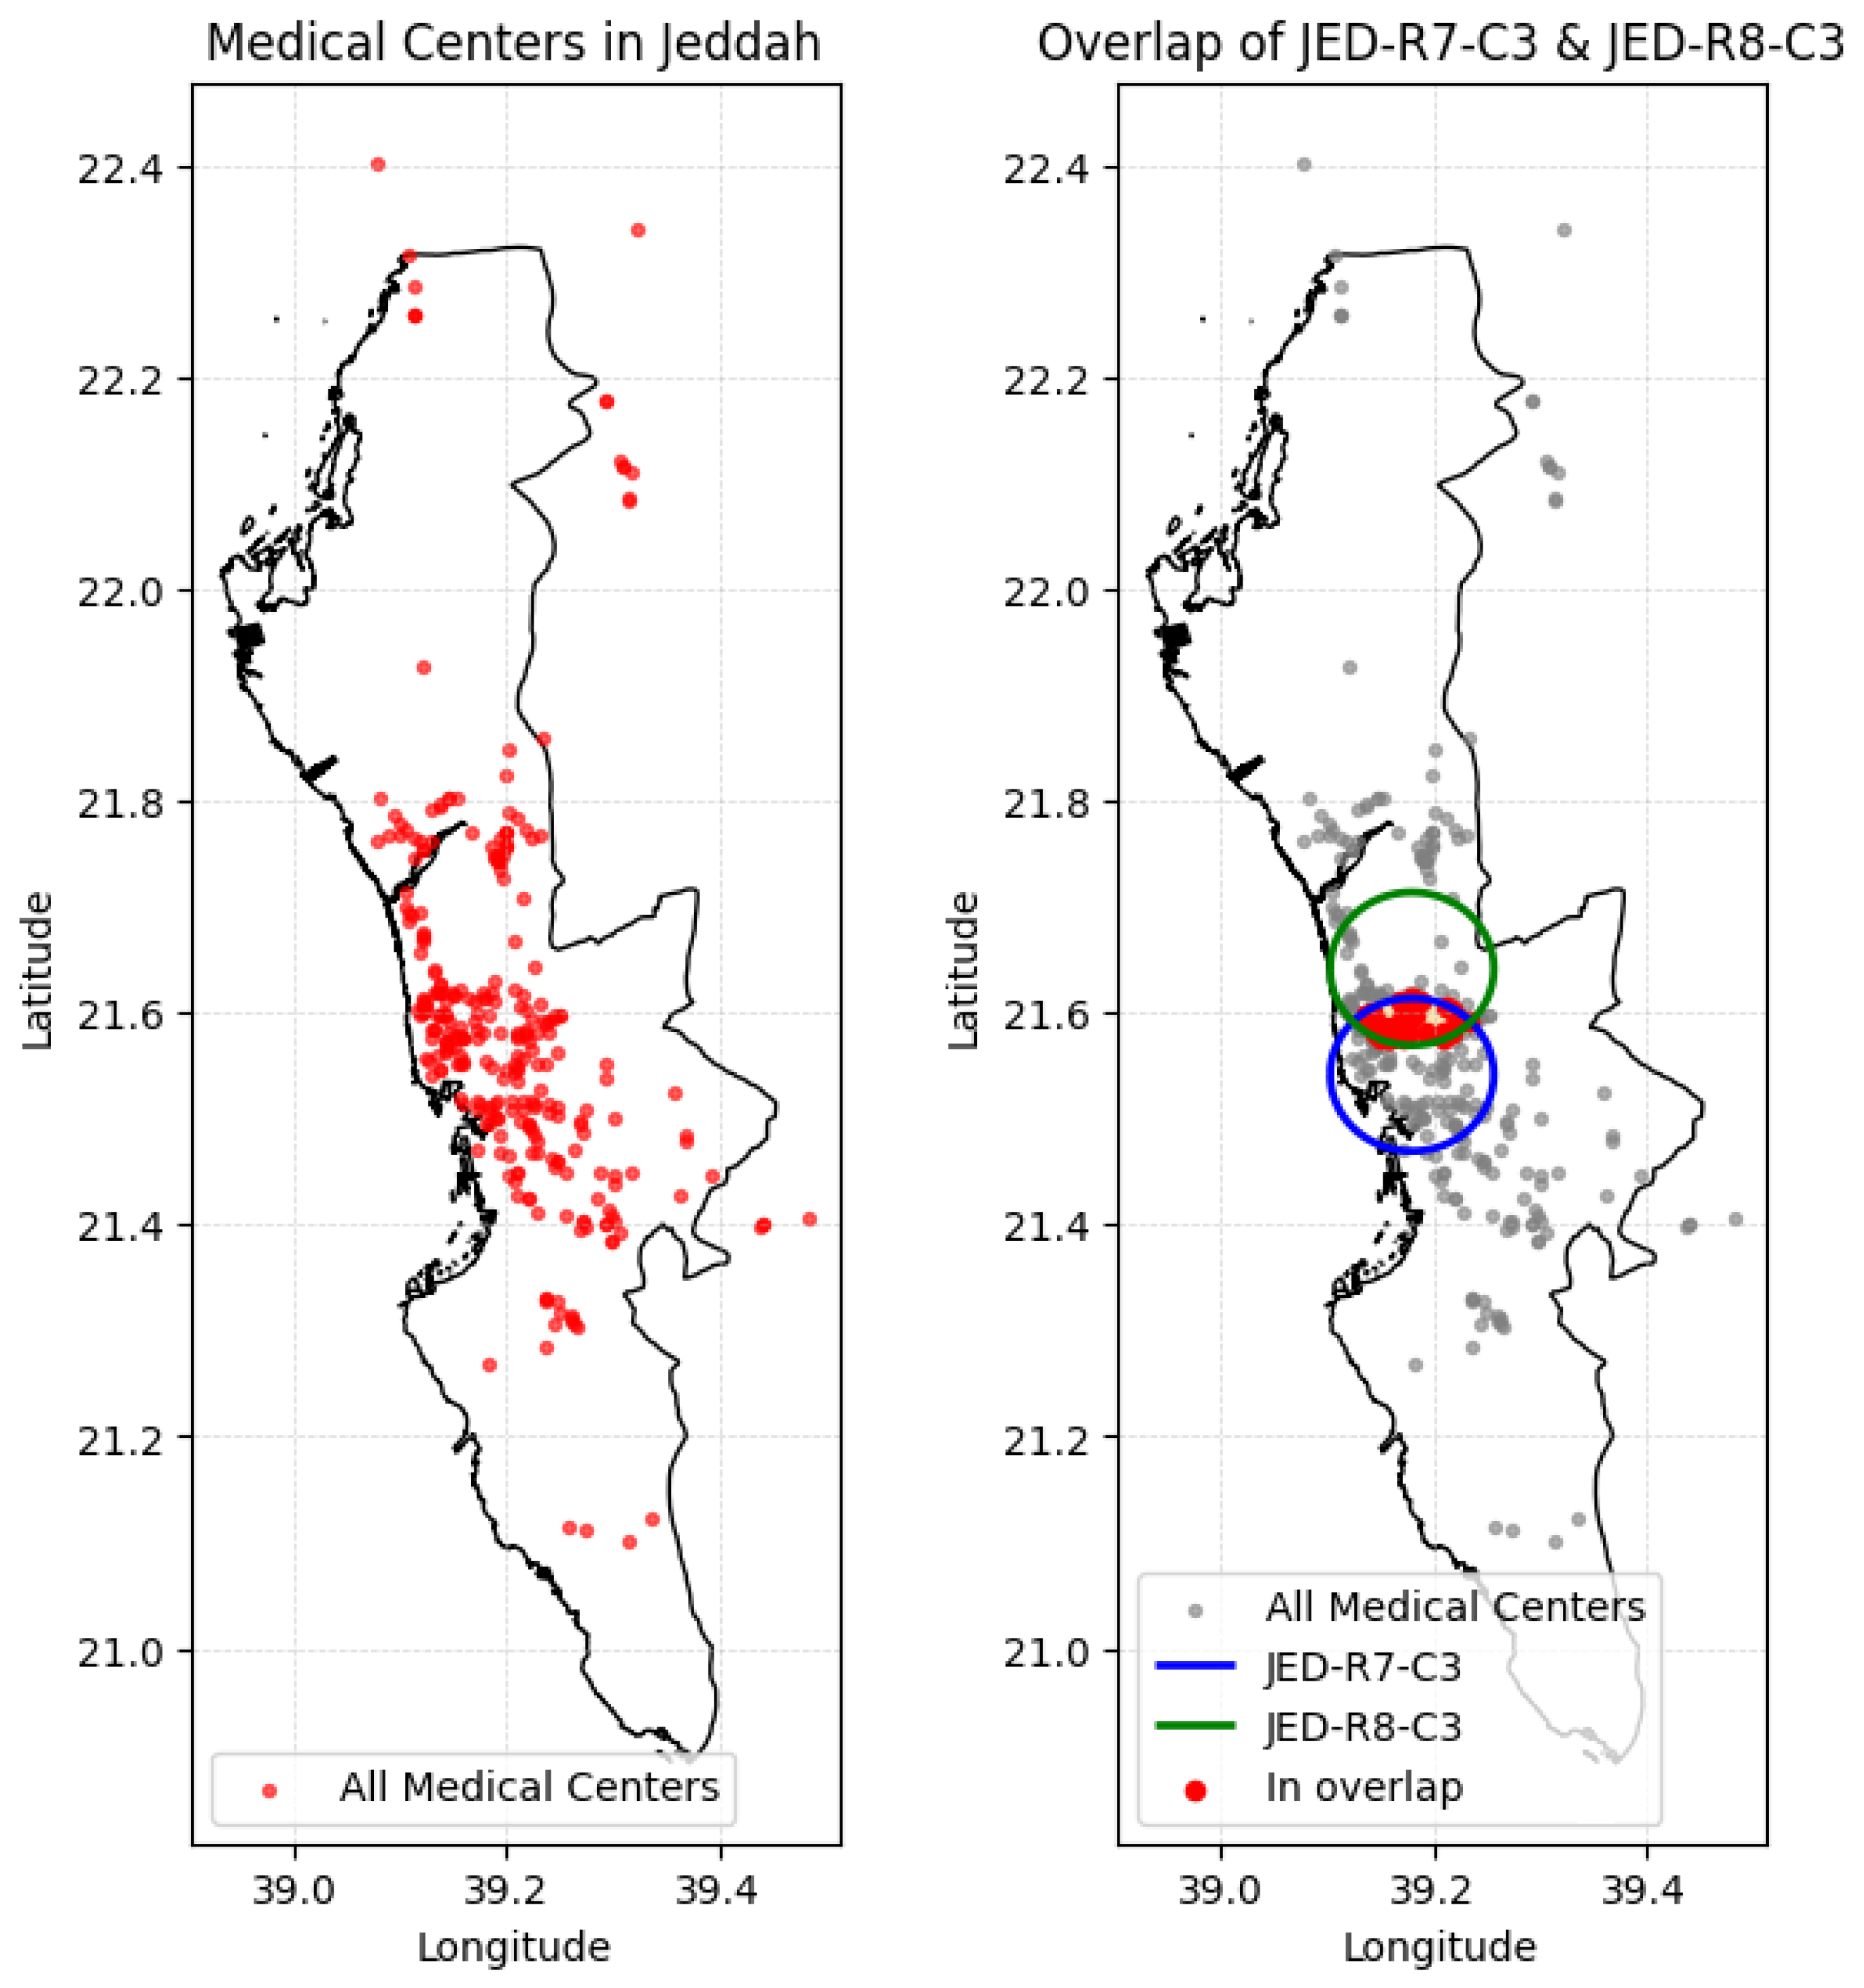
An initial experiment was conducted to test the suitability of online map data as a source for healthcare facilities in Jeddah. Queries were submitted to the Google Maps Places API using healthcare-related keywords, including hospitals, clinics, and health centres, as illustrated in
Figure 1, in accordance with the terms of service (
https://cloud.google.com/maps-platform/terms, accessed on 24 February 2026) and for academic research purposes.
This attempt revealed a critical limitation: each request returns a maximum of 60 results, regardless of how many facilities exist in the target area. As a result, a single query produces incomplete coverage and fails to reflect the true distribution of healthcare services in Jeddah. To address this limitation and achieve a high coverage, the city was divided into a grid system, with each cell used as the basis for location-specific data collection. This approach is utilized to produce a more representative dataset that better captures the geographic diversity of facilities across the city.
The main aim of this study is to develop and apply a method for collecting and analysing healthcare facility data in Jeddah using location-based digital sources. The focus is on building an automated and reusable framework (GeoJed) that divides the city into uniform grid cells and retrieves facility data from Google Maps to form an up-to-date dataset (GeoJedHF). Further, a baseline experiment was also conducted to demonstrate how the collected data can be utilised to develop an initial indicator for patient satisfaction, referred to as the Patient Satisfaction Index (PSI).
Based on the above, the study addressed the following research question:
RQ: How can an automated, grid-based approach be developed and applied to collect and analyse healthcare facility data for understanding spatial distribution in a large city like Jeddah? Accordingly, the study introduces the following contributions:
Applying a baseline experiment (PSI) to illustrate how the collected data can be used to develop an initial indicator for patient satisfaction.
Examining the spatial distribution of healthcare facilities across the city.
The rest of the paper is organised as follows.
Section 2 reviews related work.
Section 3 presents the methodology, including the grid framework, data collection, and the design of PSI.
Section 4 reports the results and analysis.
Section 5 provides the discussion and limitations.
Section 6 concludes the paper and suggests directions for future research.
2. Related Studies
Several studies have explored large-scale spatial data collection using location-based digital sources such as Google Places and OpenStreetMap, demonstrating their potential for capturing urban points of interest and supporting data-driven spatial analysis [
10,
11,
12]. In parallel, a substantial body of research has examined healthcare accessibility using spatial and GIS-based methods to identify inequalities in service provision and population coverage across different urban and regional contexts [
13,
14,
15,
16]. Other studies have focused on evaluating service quality through user-generated content and online reviews, showing that ratings and textual feedback from platforms such as Google Maps can serve as proxies for perceived quality and patient experience [
6,
17,
18,
19]. However, recent reviews indicate that existing approaches remain fragmented, with limited automation and weak integration between spatial data collection, accessibility assessment, and service quality evaluation, particularly in local and underrepresented contexts such as Middle Eastern cities [
5,
20,
21].
Building on these works, some studies have explored different frameworks for automated spatial data collection and urban analytics using online sources such as Google Places and Google Popular Times. Wenceslau et al. [
22] proposed a methodology for matching and comparing official governmental records with alternative sources such as Google Places to assess the reliability of unofficial urban data in Belo Horizonte, Brazil. Their approach demonstrated the feasibility of using web-based business information for urban analysis but still involved manual verification and data cleaning. More recently, Barrena-Herrán et al. [
23] developed a fully automated pipeline to collect and analyse citywide activity patterns in a coastal city in northern Spain using Google Popular Times, integrating temporal and spatial dimensions through centroid-based aggregation. Both studies highlight progress toward automated data acquisition but primarily address general urban dynamics rather than public service analytics. The proposed GeoJed framework extends these efforts by introducing a fully automated, grid-based system specifically designed for collecting healthcare-related spatial data in Jeddah. Through its component, GeoJedHF, the framework generates a reproducible dataset that captures healthcare facility locations and attributes directly from digital sources, which minimises manual intervention and duplication. Unlike centroid-based or partially sampled approaches, GeoJed systematically queries all grid cells, ensuring full spatial coverage while reducing manual data preparation and post hoc data matching.
Within healthcare, Aunimo et al. [
6] applied sentiment analysis to over 55,000 Google Maps reviews of primary healthcare centres in Finland and a coastal region of Spain, examining public sentiment. Their findings highlighted the value of online reviews as indicators of perceived service quality and patient experience. Similarly, Laghbi and Al Dhoayan [
9] analysed 8084 reviews of pharmacies in Riyadh, Saudi Arabia, using sentiment analysis and statistical models to explore public perception and satisfaction. Another work has also explored the integration of sentiment analysis with spatial modelling at multiple scales, highlighting the importance of scale effects in interpreting review-based indicators [
24]. While both studies successfully utilised API-based data to assess healthcare quality and patient sentiment, they lacked spatial integration and focused primarily on perception rather than geographic coverage. In contrast, the GeoJed framework couples automated spatial data collection with user-created content to enable experiments on patient satisfaction. The resulting GeoJedHF dataset serves as a foundation for computing a preliminary satisfaction indicator, demonstrating how collected data can later support broader measures of healthcare quality.
Several studies have examined healthcare accessibility and spatial planning within the city of Jeddah, highlighting persistent inequalities in service distribution. Murad [
25] was among the first to apply GIS tools for evaluating hospital service areas, demonstrating how spatial analysis could identify underserved districts based on travel-time zones and patient demand. Later, Murad [
5] expanded this approach by developing a comprehensive geodatabase that integrated health facility locations, population data, and transportation networks, using network analysis to delineate catchment areas and assess spatial coverage. Khashoggi and Murad [
4,
26] further advanced this line of research by employing the Two-Step Floating Catchment Area (2SFCA) method to measure healthcare accessibility across Jeddah, revealing a clear imbalance between central and peripheral districts. Complementary work by Murad and Khashoggi [
27] utilised GIS-based hotspot analysis to visualise the spatial distribution of chronic diseases such as diabetes and asthma, thereby connecting service distribution with population health outcomes. Collectively, these studies established a strong foundation for spatial healthcare research in Jeddah, yet they all relied on static, government-sourced datasets and manual GIS operations. None of them incorporated automated, API-driven data collection or dynamic updates. This limitation emphasises the need for a new framework that can continuously retrieve, process, and analyse healthcare-related data using digital and crowd-sourced sources—a gap directly addressed by the GeoJed framework introduced in this study.
This study makes three key advancements compared with prior research:
Complete automation in spatial data collection. Previous studies depended on static and manually curated data from government sources. GeoJed introduces a fully automated, reproducible, grid-based pipeline for data acquisition and processing using Google Maps APIs.
Focused application to healthcare services. Earlier GIS-based analyses in Jeddah primarily examined accessibility or disease mapping. This research specifically targets healthcare facilities, establishing the GeoJedHF dataset that consolidates spatial and descriptive information into a structured and reusable form.
Dynamic and extensible local framework. Unlike static one-time analyses, the proposed framework enables continuous data updates and can be extended to other service domains or replicated across different Saudi or international cities, offering a scalable foundation for future spatial data analytics.
3. Methodology
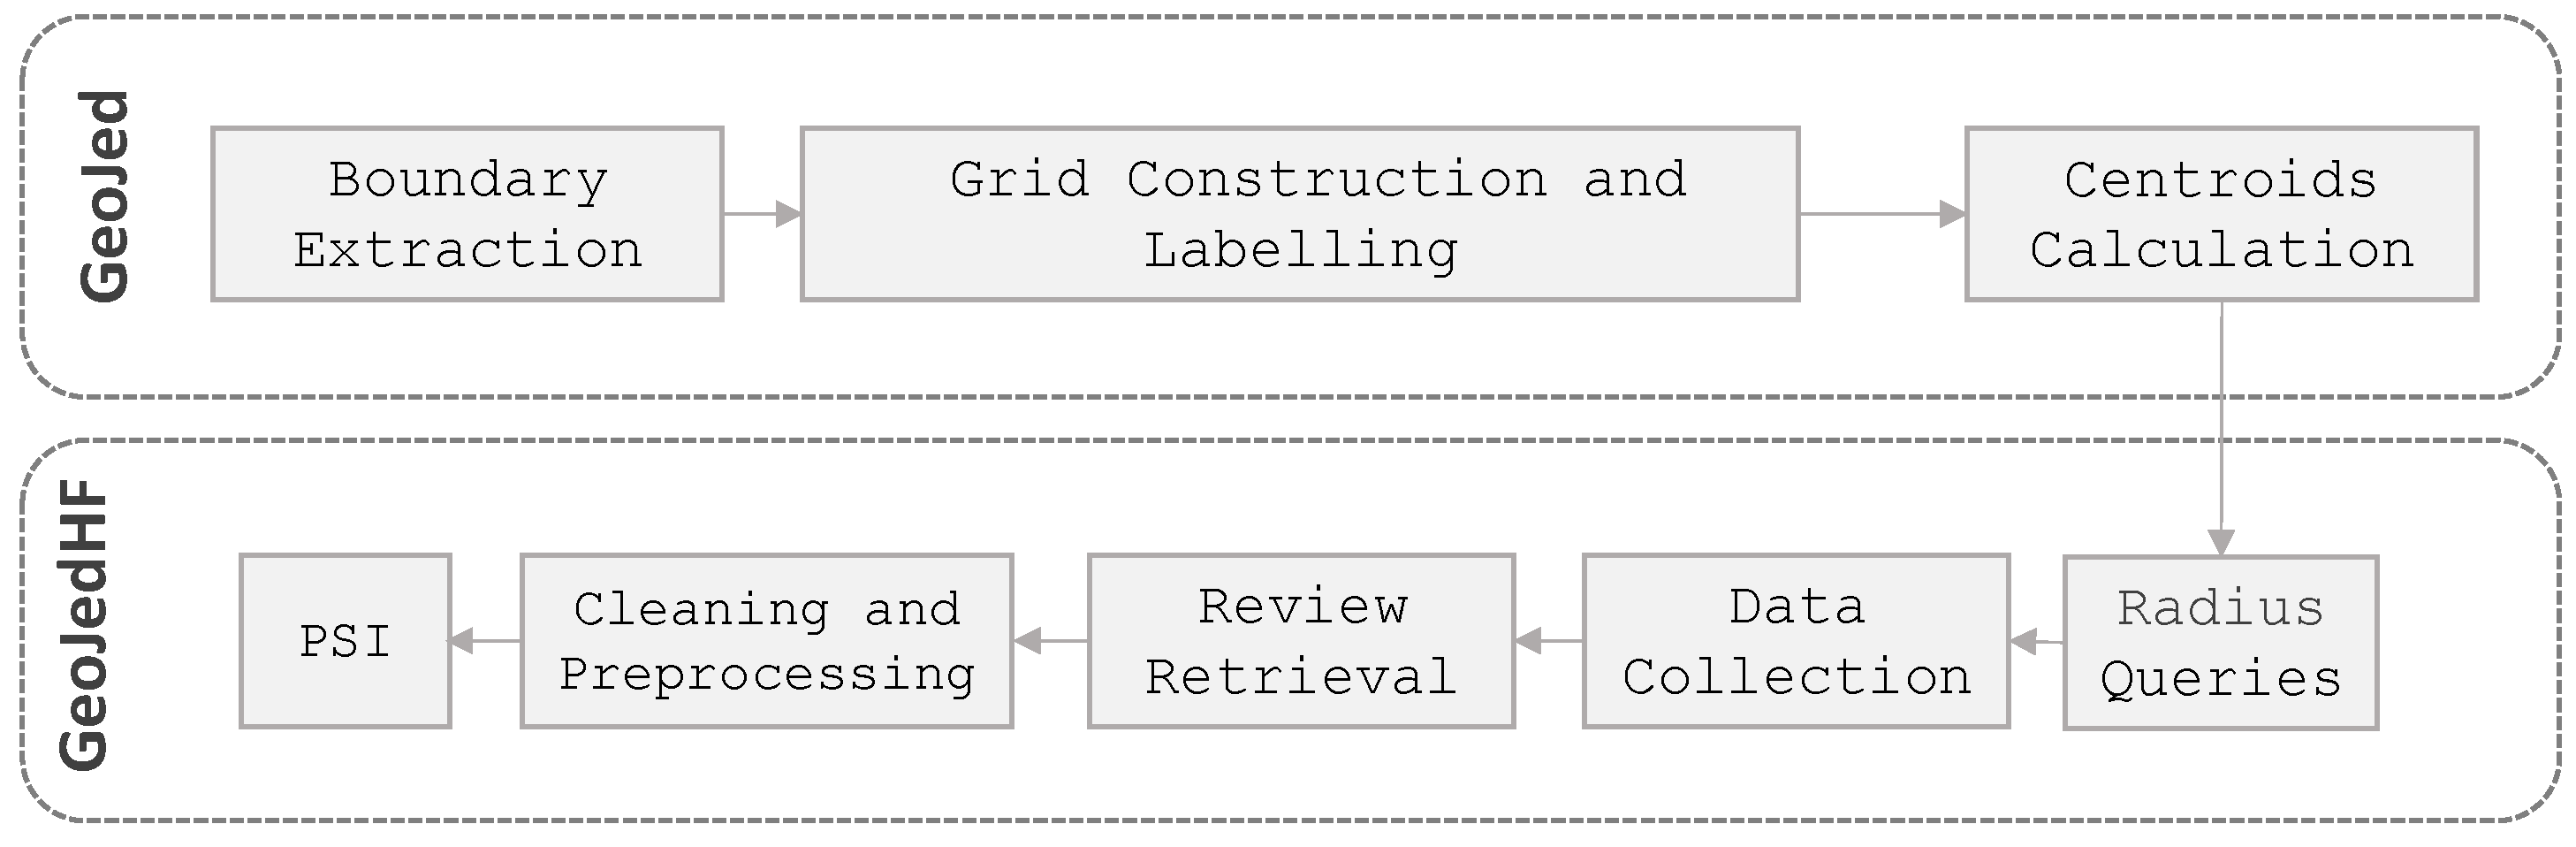
Figure 2 presents a high-level overview of the GeoJed methodology and its GeoJedHF component prior to the detailed description of each processing stage.
An initial trial showed that direct queries returned only partial coverage of healthcare facilities in Jeddah, as illustrated in
Figure 1. This limitation motivated the introduction of a grid-based spatial framework to ensure more comprehensive data collection across the city.
The idea was to divide Jeddah into a set of uniform square cells, with each cell treated as a separate unit for data retrieval. By issuing location-specific queries centred on each cell, the process was able to cover both central and peripheral areas, resulting in a broader and more representative dataset of healthcare facilities.
The following subsection describe the construction of this grid, the method of labelling each cell, and the calculation of centroids, which later served as the query points for data collection.
3.1. Grid Framework Construction
To solve the problem of limited results in the initial trial and to ensure wider coverage, Jeddah was divided into a uniform grid system. Each grid cell was defined by its latitude and longitude boundaries and treated as an independent unit for data retrieval. By running separate queries for each cell, the process captured a more complete and spatially diverse set of healthcare facilities across the city.
This section explains how the grid was built and prepared for later analysis. The process had three main parts:
Jeddah Boundary Extraction: Identifying and extracting the administrative boundary of Jeddah from open-access GeoJSON data.
Grid Construction and Labelling: Creating a uniform set of square cells covering the study area, keeping only those intersecting with the city boundary, and assigning unique identifiers to each cell.
Centroid Calculation: Computing the geographic centre of each grid cell to use as the input point for later queries.
The following subsections describe each of these steps in detail.
3.1.1. Jeddah Boundary Extraction
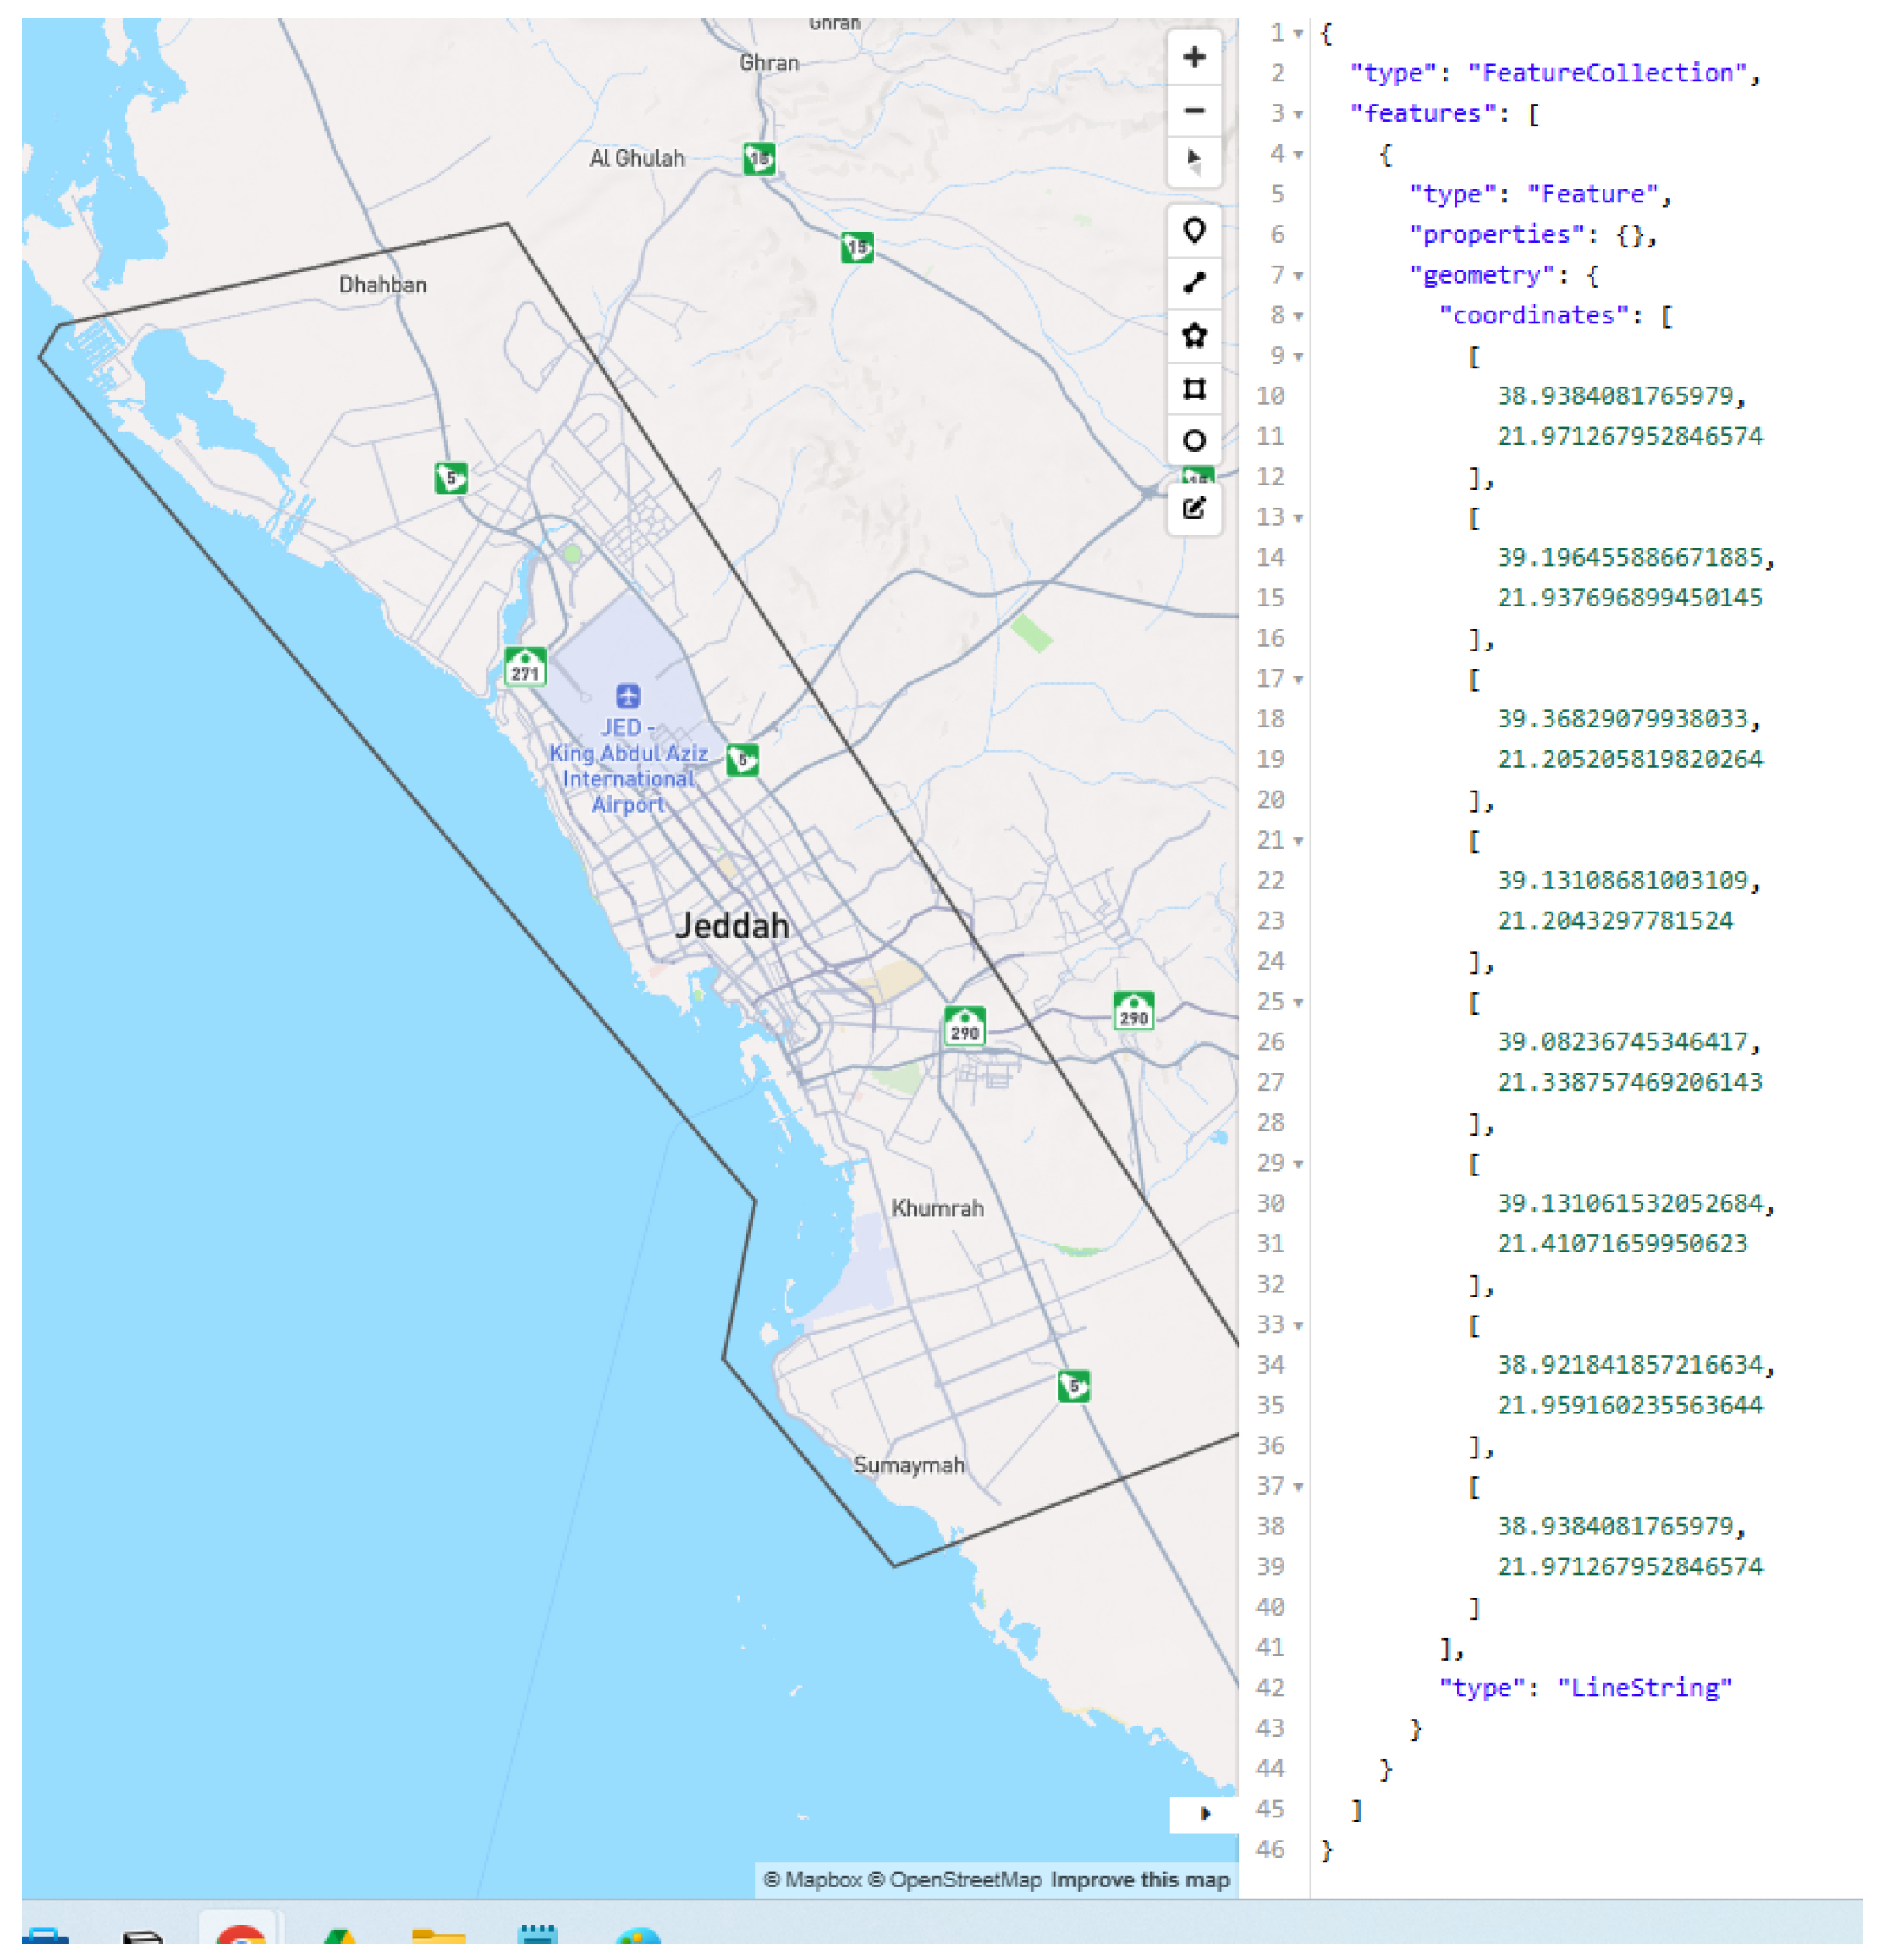
The first step was to identify the administrative boundary of Jeddah, which provided the base shape for the grid framework. For this purpose, the SAU-ADM2 geoBoundaries (
https://www.geoboundaries.org/, accessed on 24 February 2026) was used. This dataset contains polygons for all second-level administrative divisions in Saudi Arabia, including governorates and major cities. Details on how this boundary was obtained are provided in Appendices
Appendix A and
Appendix B, and a summary of the extraction process is illustrated in
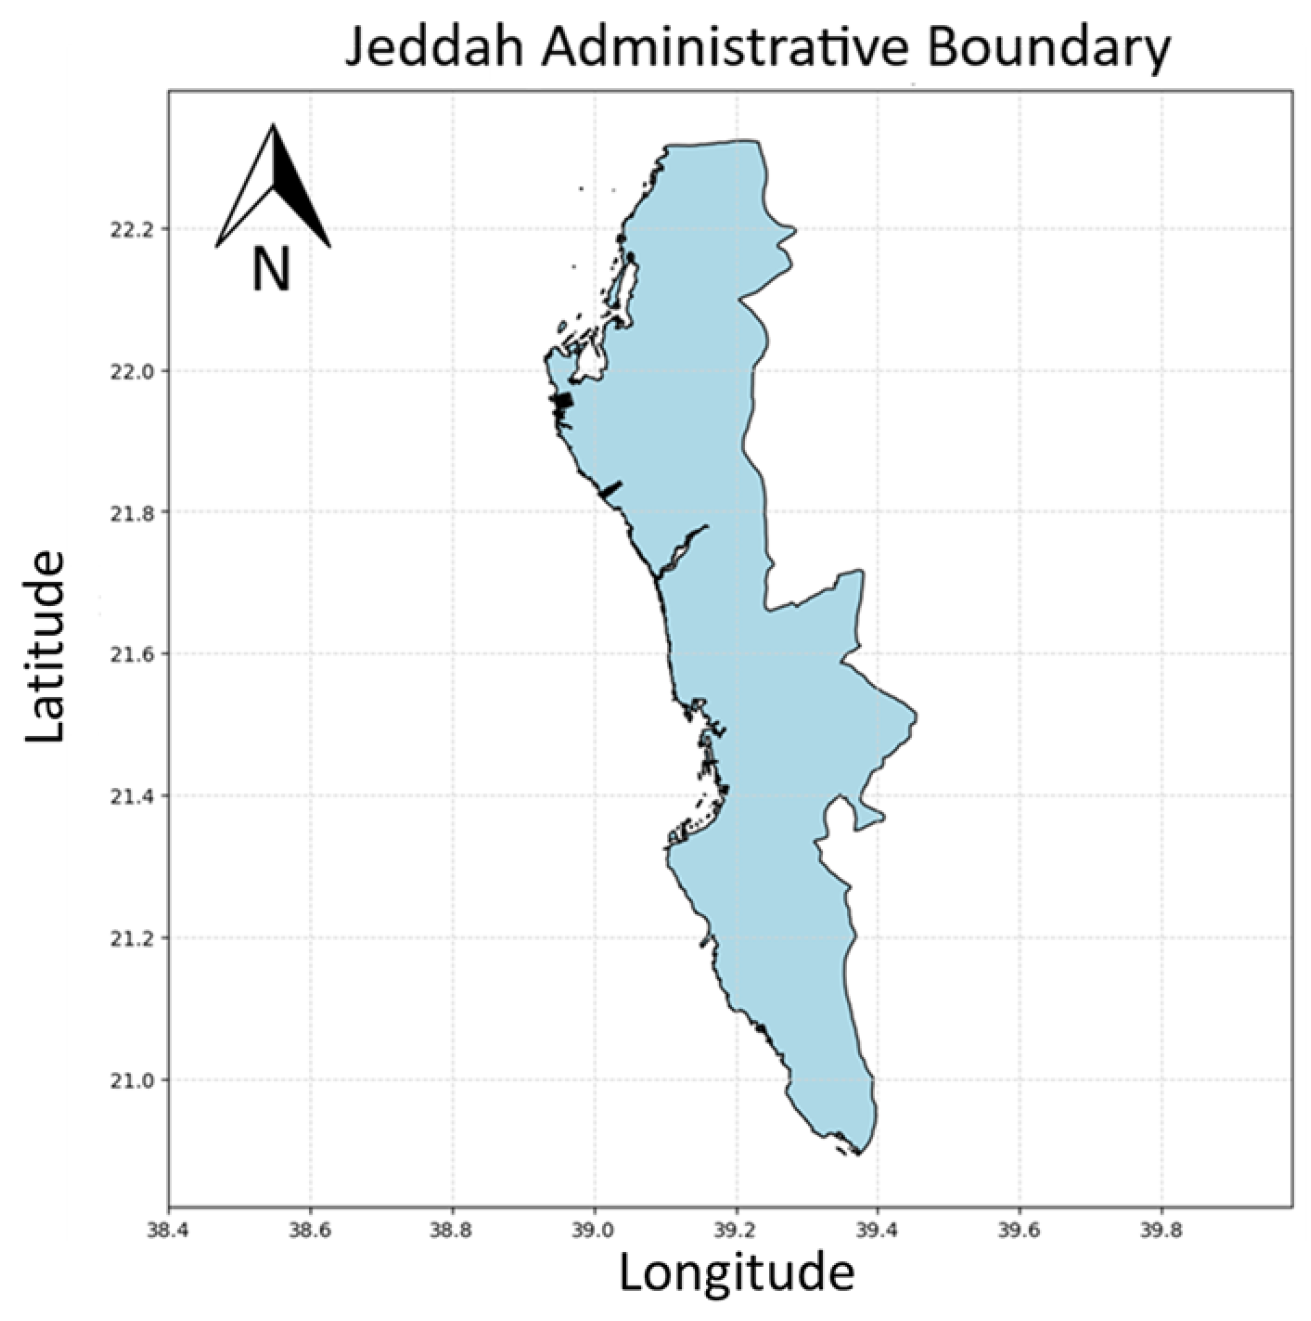
Figure 3. First, the file with ADM2 polygons was loaded and the unique regions were inspected. Next, a filtering step selected the entries for Jeddah. Finally, the polygon for Jeddah was isolated for later analysis.
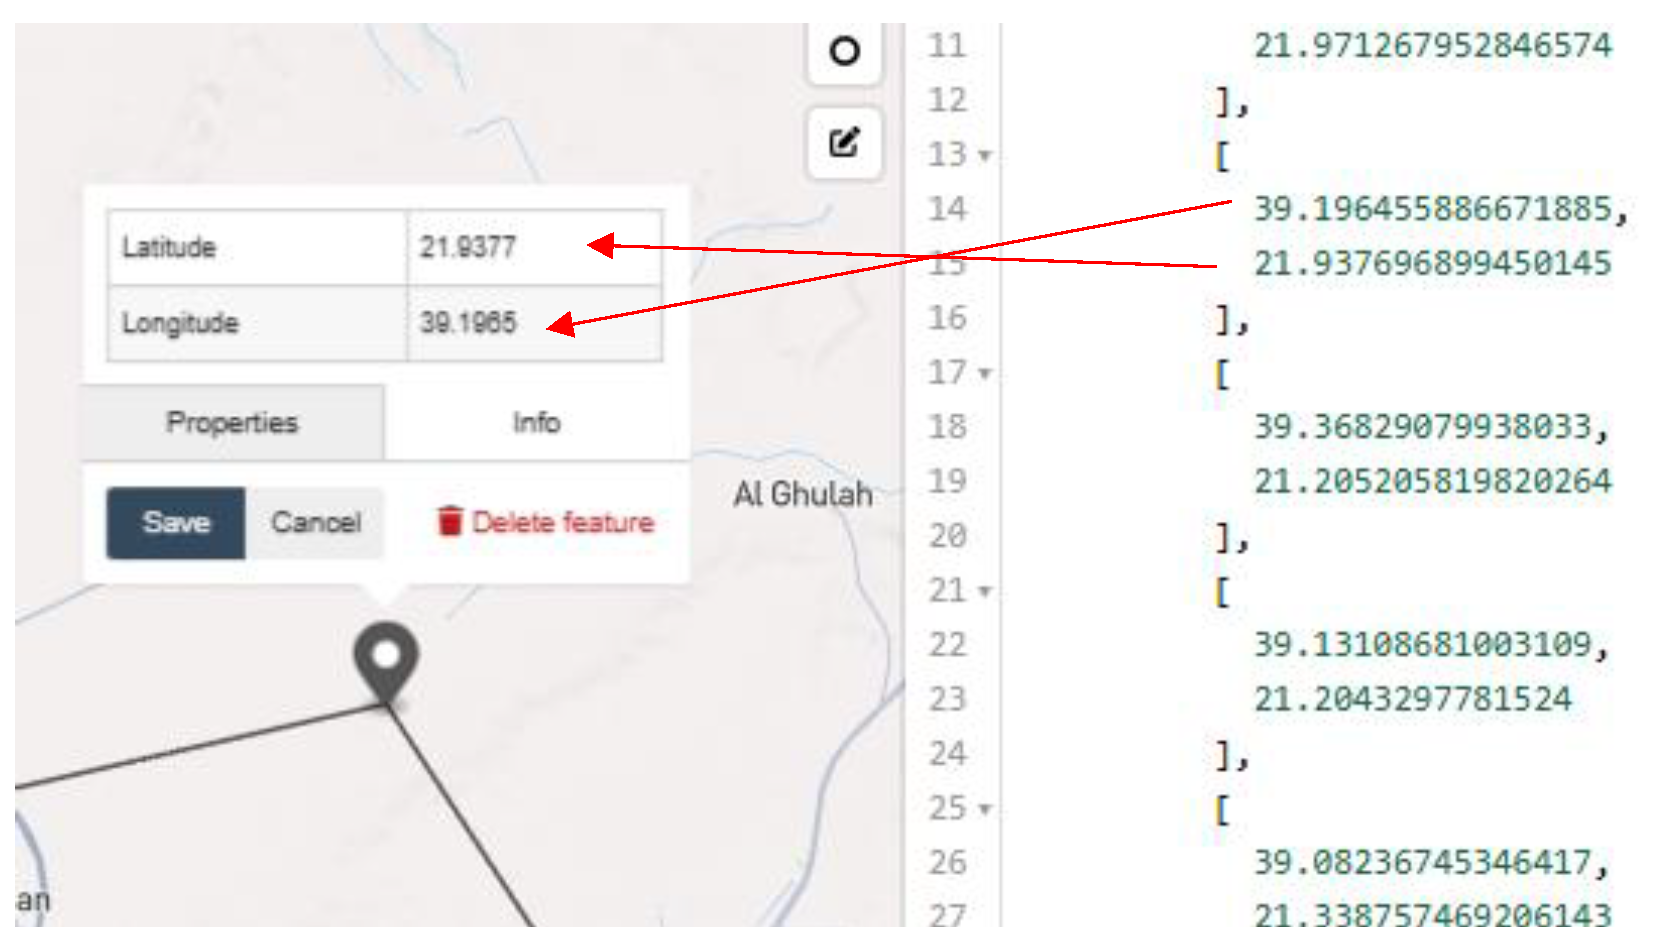
The extracted boundary is stored in the geometry field of the GeoJSON file, which contains ordered pairs of longitude and latitude. A short example is shown in Listing 1. These coordinates produced the map in
Figure 4, which correctly represents the administrative extent of Jeddah.
| Listing 1. Excerpt of a GeoJSON file showing Jeddah’s boundary. |
| "geometry": { |
| "coordinates": [ |
| [38.9384, 21.9712] , [39.1964, 21.9376], |
| [39.3682, 21.2052] , … , [38.9384, 21.9712]]} |
3.1.2. Grid Construction and Labelling
The grid was built by first defining a bounding box
B around Jeddah’s boundary. This box was calculated directly from the extracted city polygon. Formally, it is written as:
where
and
are the minimum and maximum longitude, and
and
are the minimum and maximum latitude.
Table 1 lists the coordinates of the bounding box for Jeddah. Each row shows one of the four corner points.
This bounding box was then divided into a uniform grid. Each grid cell was defined as:
where
The indices
i and
j show the column and row positions of the grid. The fixed side length of each cell is defined as
This grid resolution was selected as a practical trade-off between spatial granularity and API query constraints. Smaller cells would substantially increase the number of queries and amplify redundancy due to overlapping search radii, whereas larger cells could reduce spatial detail and risk incomplete coverage because of Google Places API result limits. Therefore, the chosen cell size ensures full city coverage with manageable computational overhead. This choice is operational rather than optimal, and alternative grid resolutions may be explored in future extensions of the GeoJed framework.
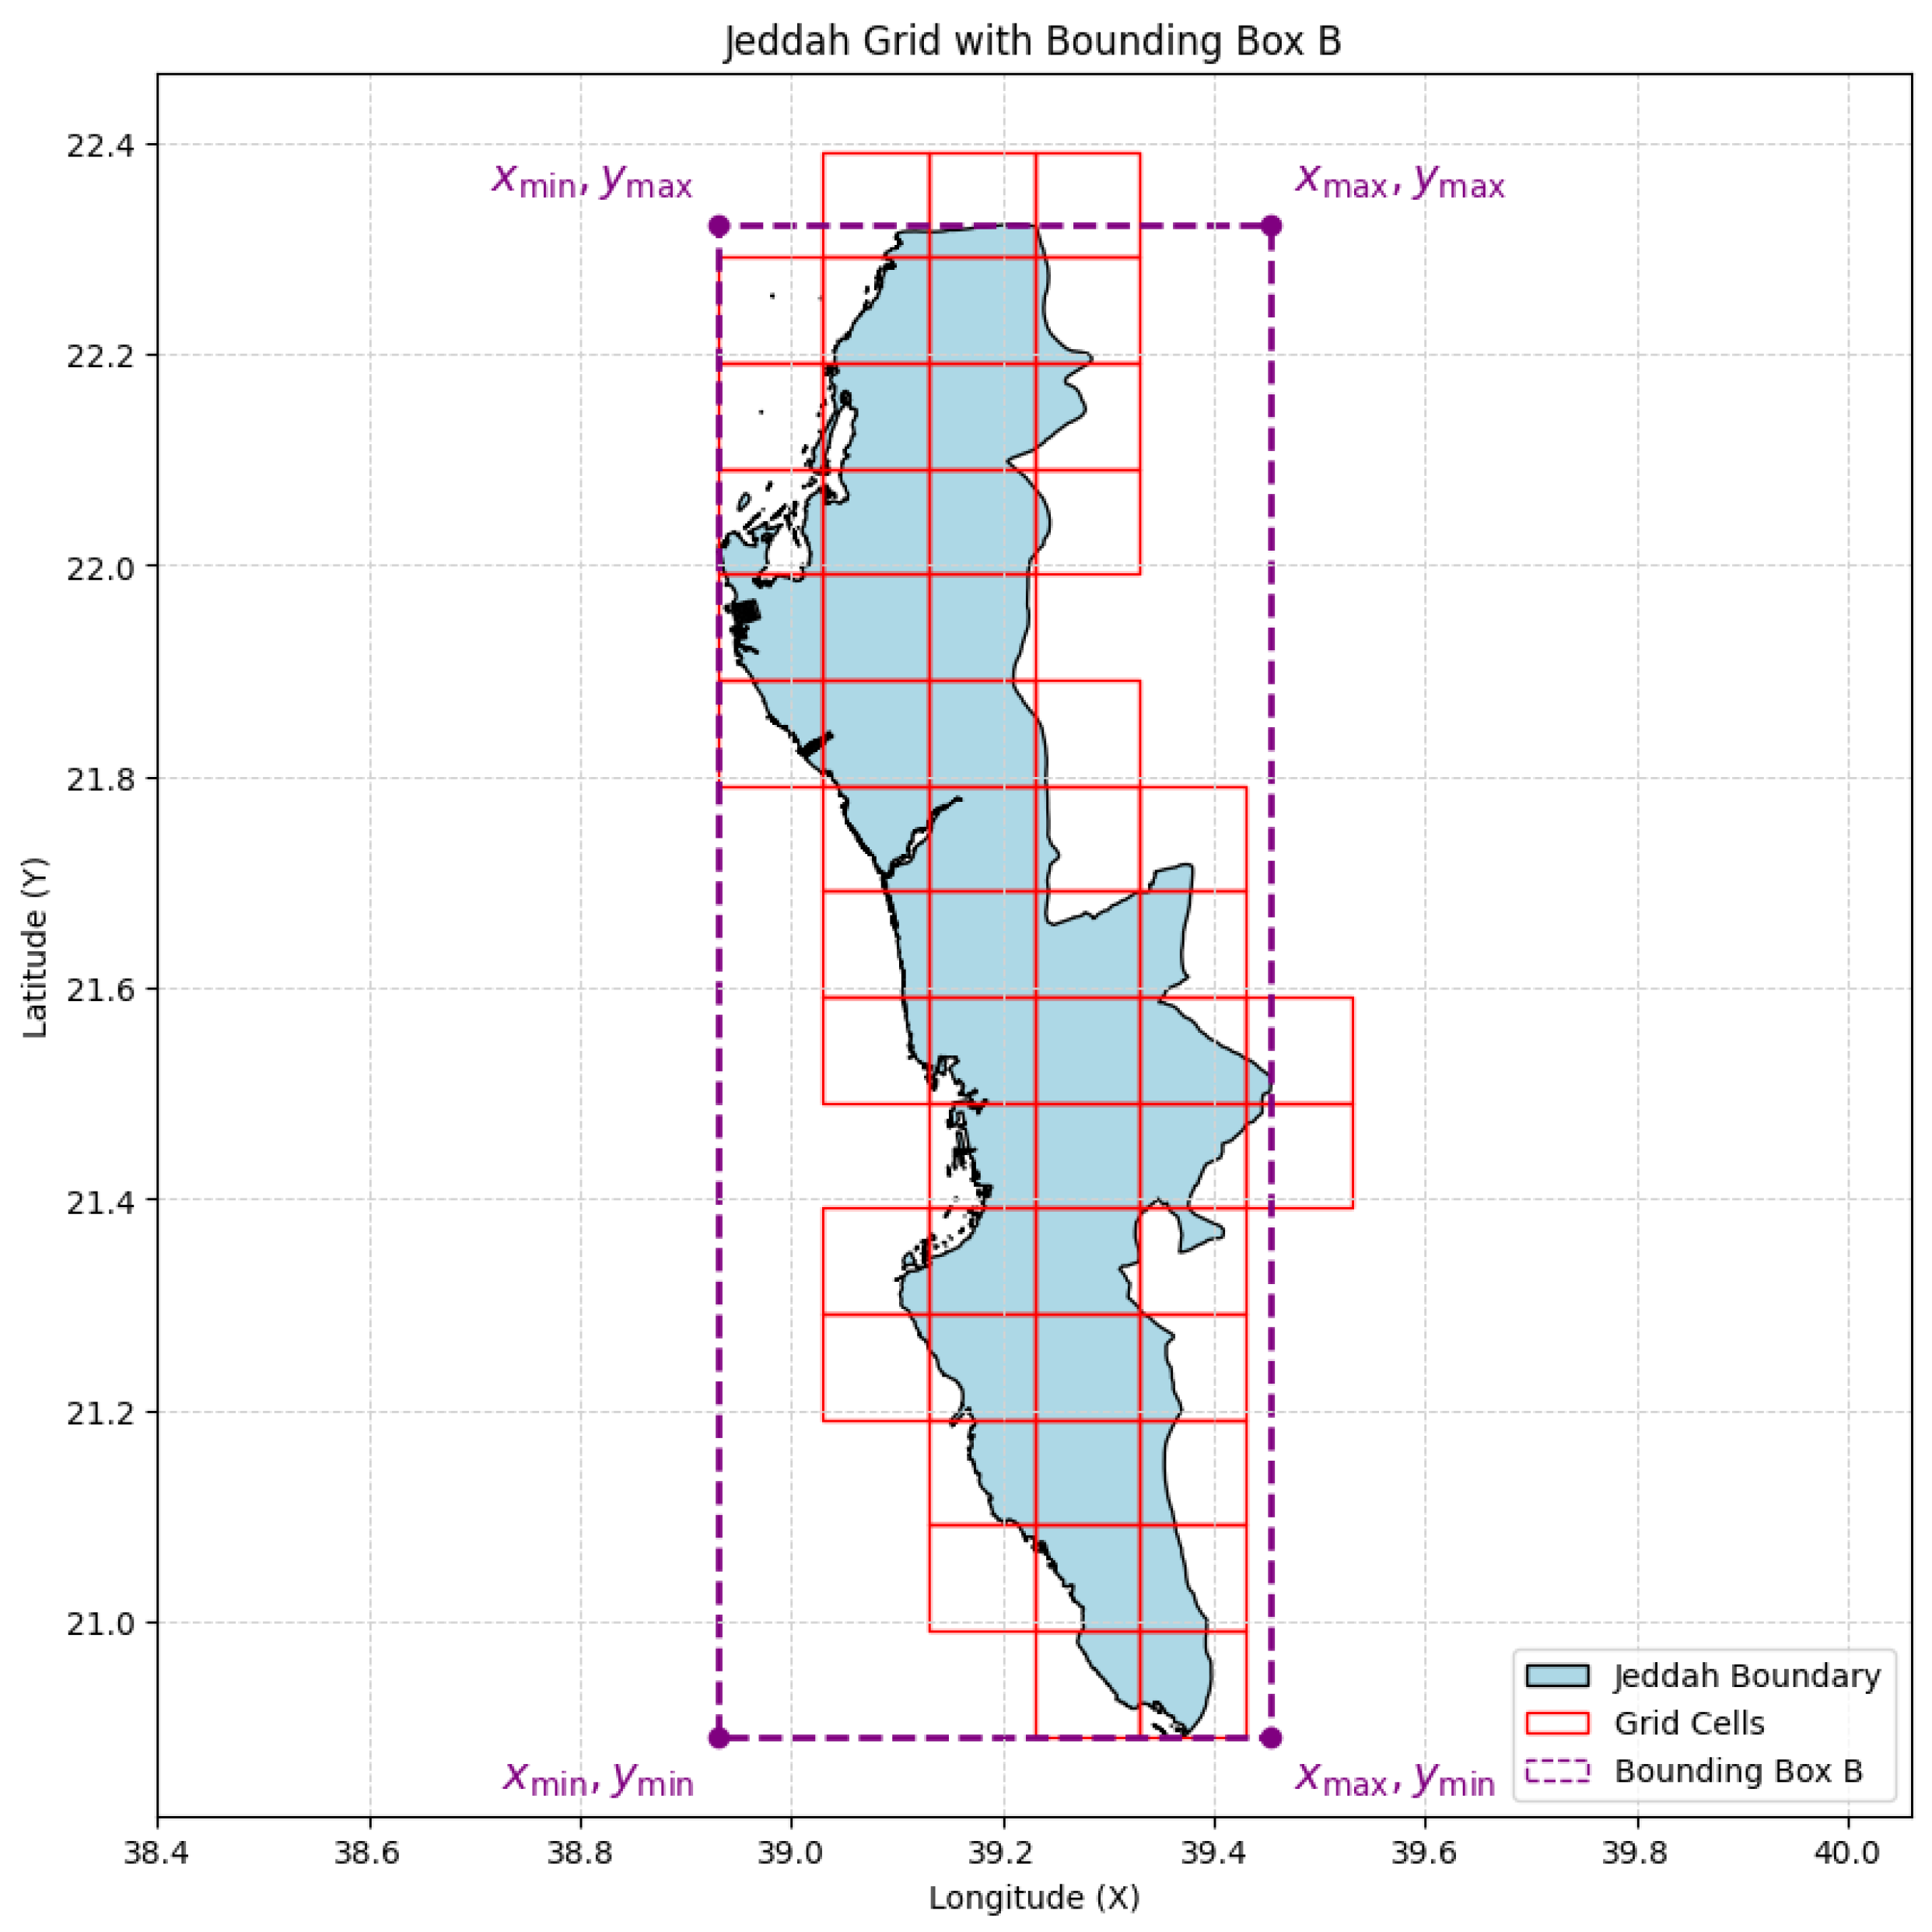
The subdivision started at the south-west corner and moved east and north by s until the north-east corner was reached. At first, this covered the whole bounding box B, but a spatial filter kept only those cells that intersected with the actual boundary of Jeddah. This step ensured that the final grid stayed inside the city’s limits.
The set of valid cells can be written as:
where
is a grid cell,
P is the polygon of Jeddah’s boundary, and ∩ means geometric intersection. This means that only the cells overlapping with
P are included in the final grid.
Figure 5 shows this result, with the bounding box
B in purple and the retained grid cells in red on top of Jeddah’s boundary.
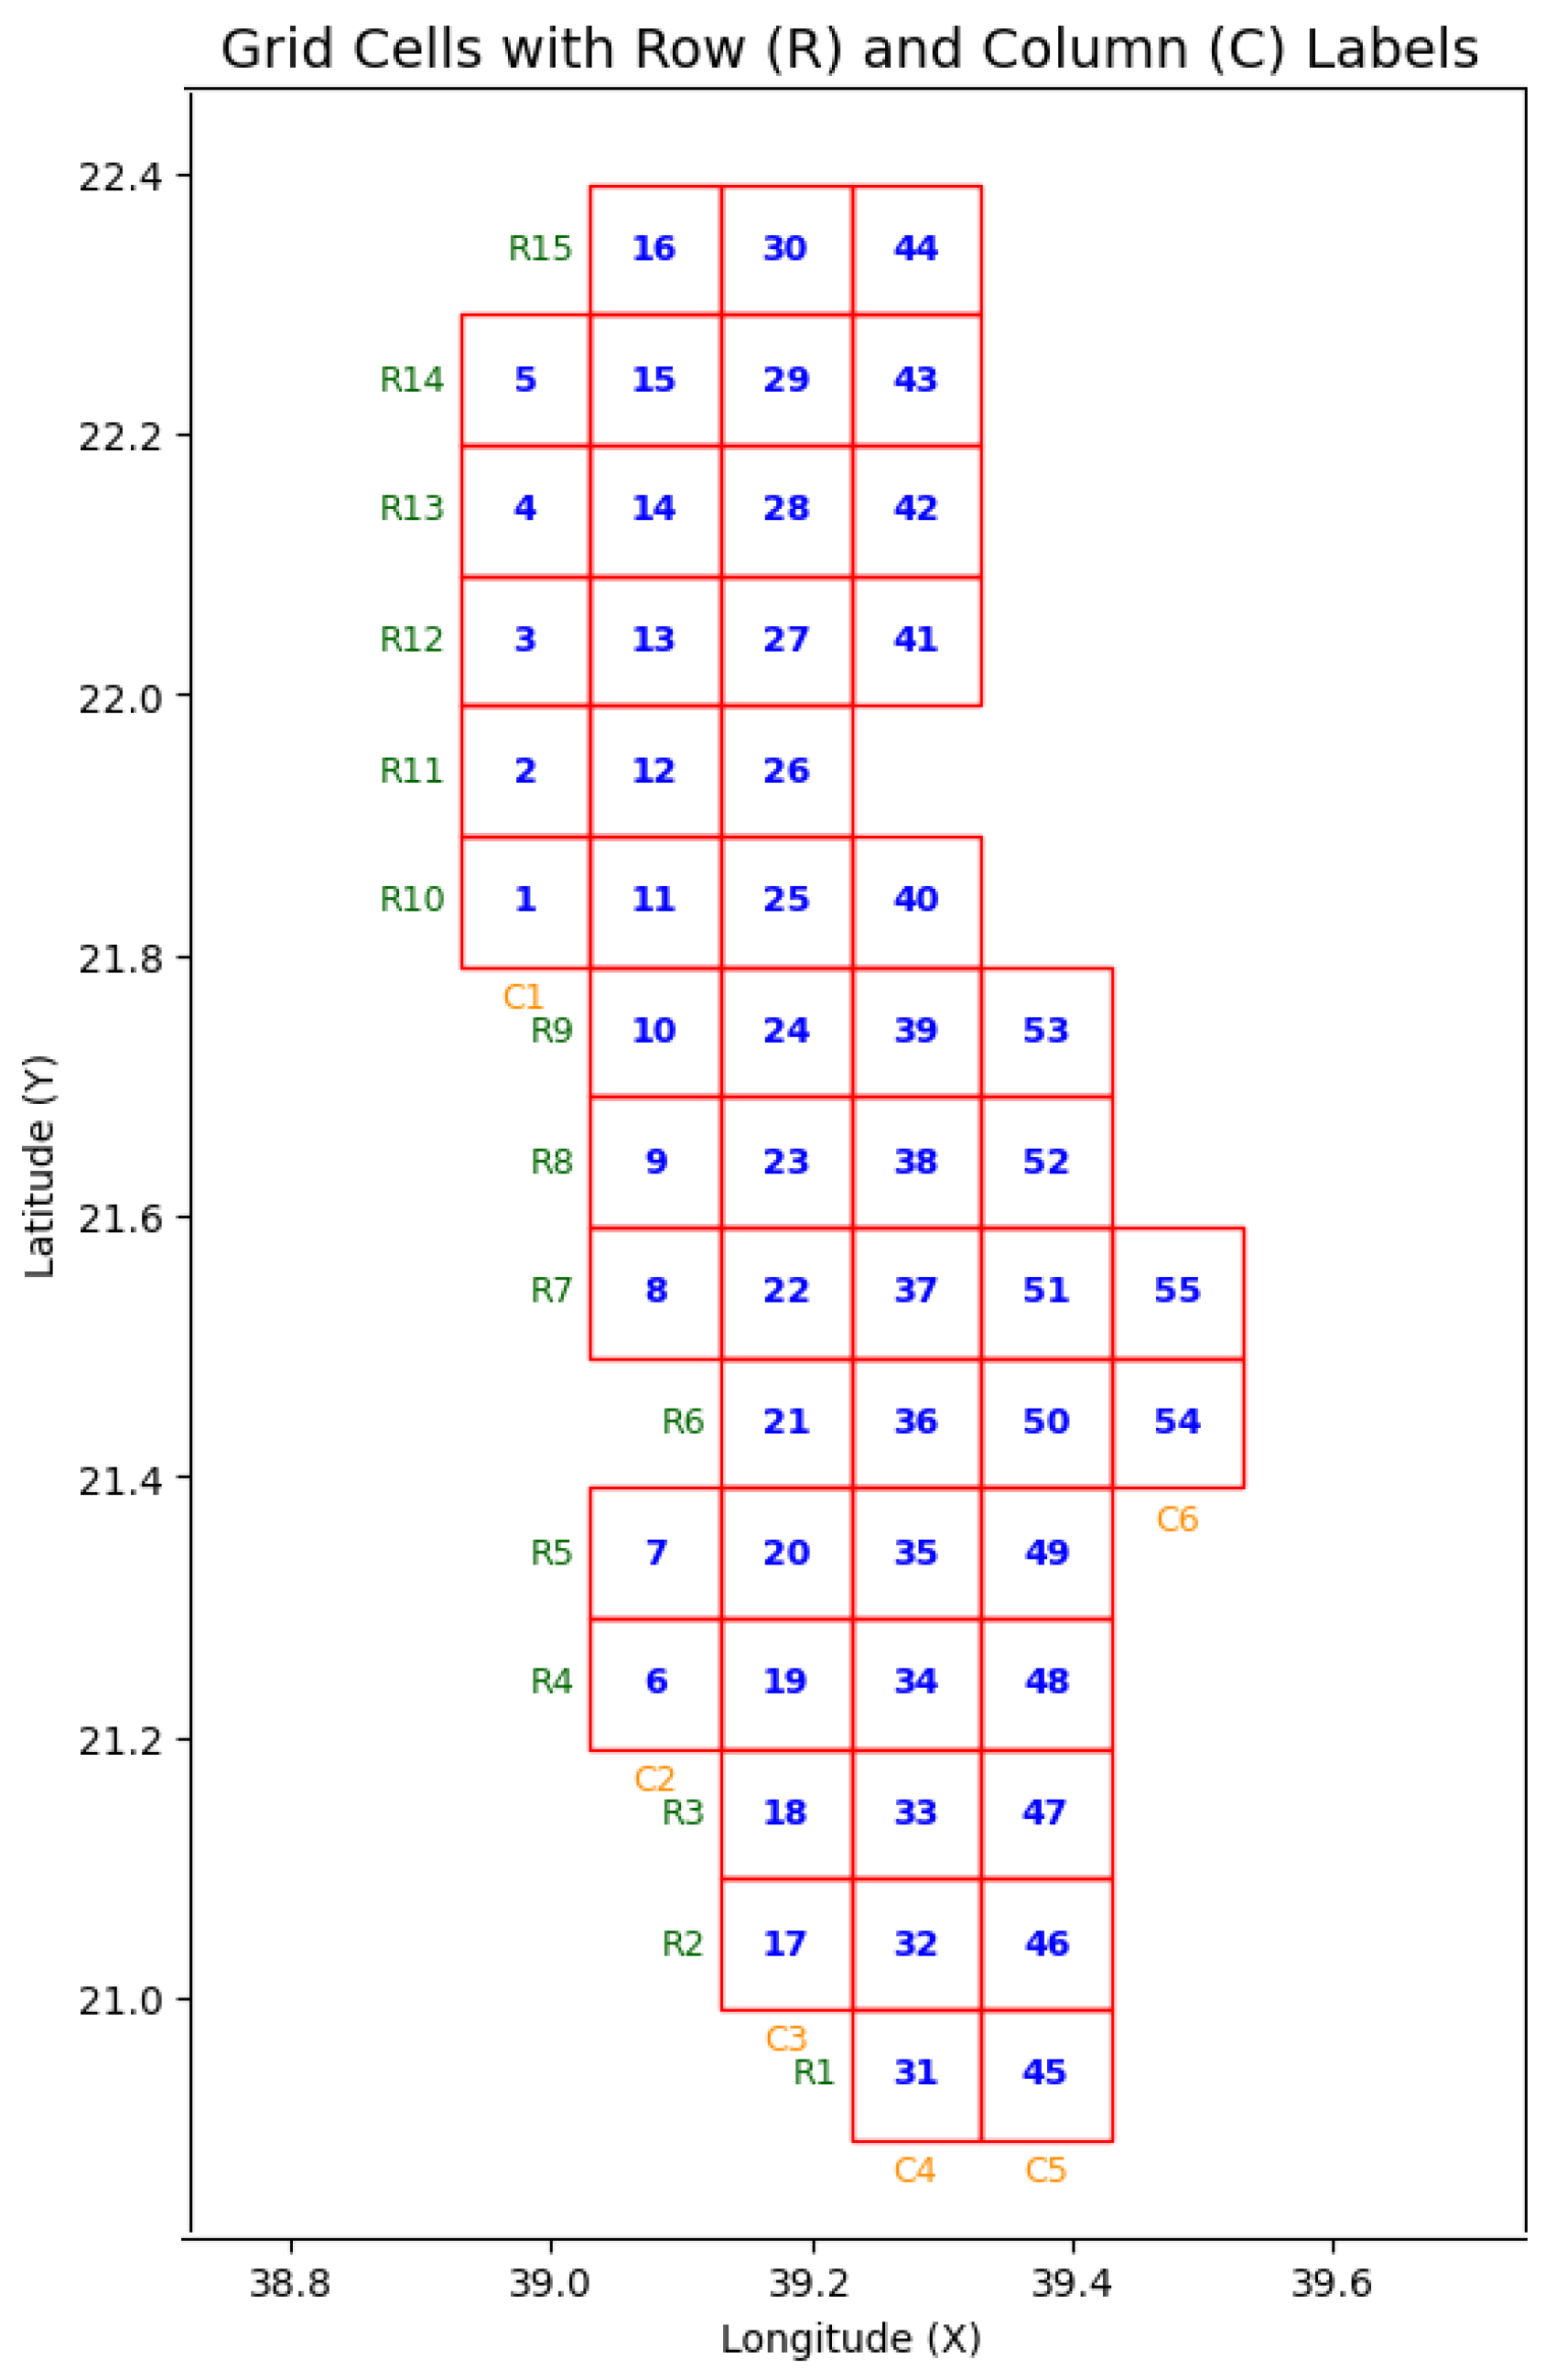
To make the grid clear and consistent, each retained grid cell was given two identifiers. The first was a sequential cell number, which simply numbered the cells (e.g., cell1, cell2, …). The second was a structured grid_id, which encoded the position of the cell by its row index and column index. The row index increased from south to north, and the column index increased from west to east. For example, the identifier JED-R10-C1 refers to the cell located in row 10 and column 1, as illustrated in
Figure 6. The numbers inside the cells are the sequential cell number, while the labels along the edges indicate the row and column indices.
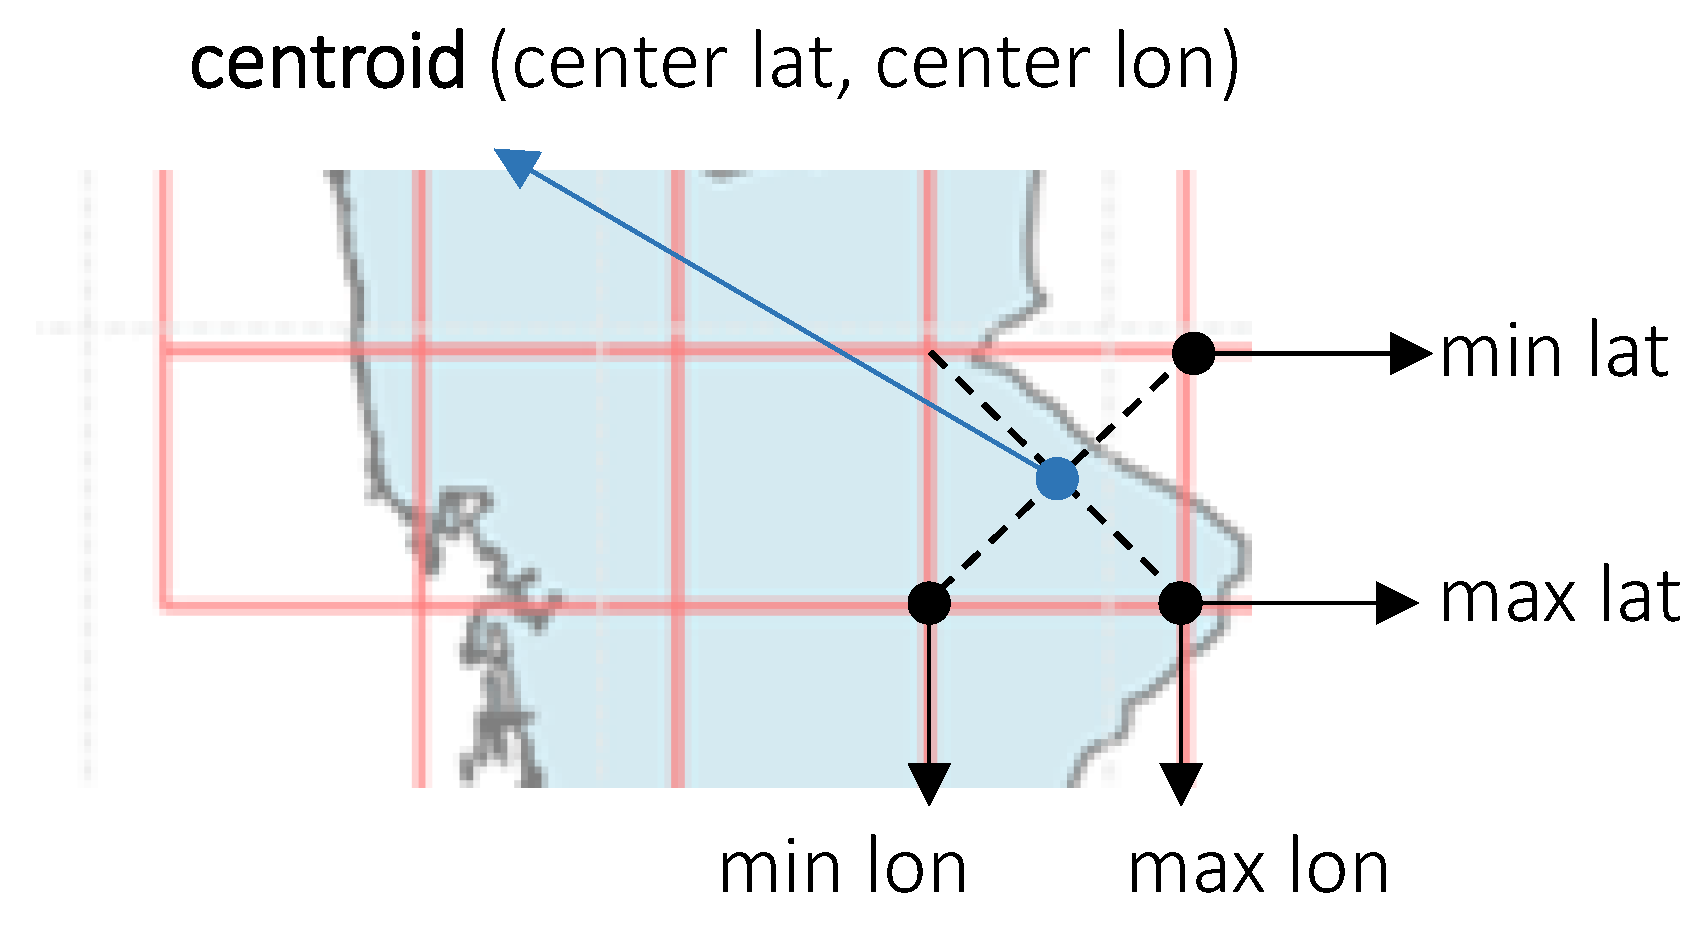
3.1.3. Centroid Calculation
Each retained cell needed one representative point for data queries. Since queries require only a single latitude–longitude coordinate, the centroid of each cell was chosen.
Here we distinguish between the grid cell
, which is a square polygon defined by its four corners, and the centroid
, which is the point at the geometric centre of
. The centroid is calculated as:
where
is the south-west corner of the cell, and
s is the side length.
By definition, is equally distant from all four corners. Each centroid was stored along with the coordinates of its cell and later used as the query location for retrieving healthcare facilities.
Figure 7 shows how the centroid
is derived from the bounding box of
and used as the representative query point.
3.2. GeoJedHF: Data Collection
This part focused on collecting information about healthcare facilities across the predefined grid covering Jeddah. To ensure full coverage, the data collection process had four main components:
The following subsections describe each component in detail.
3.2.1. Search Radius
To make sure all facilities inside each grid cell were captured, the search area was defined as a circular buffer centred on the cell centroid. Each cell had a side length of
, which equals about 11.13 km in latitude (since one degree is about 111.32 km [
28]). As shown in
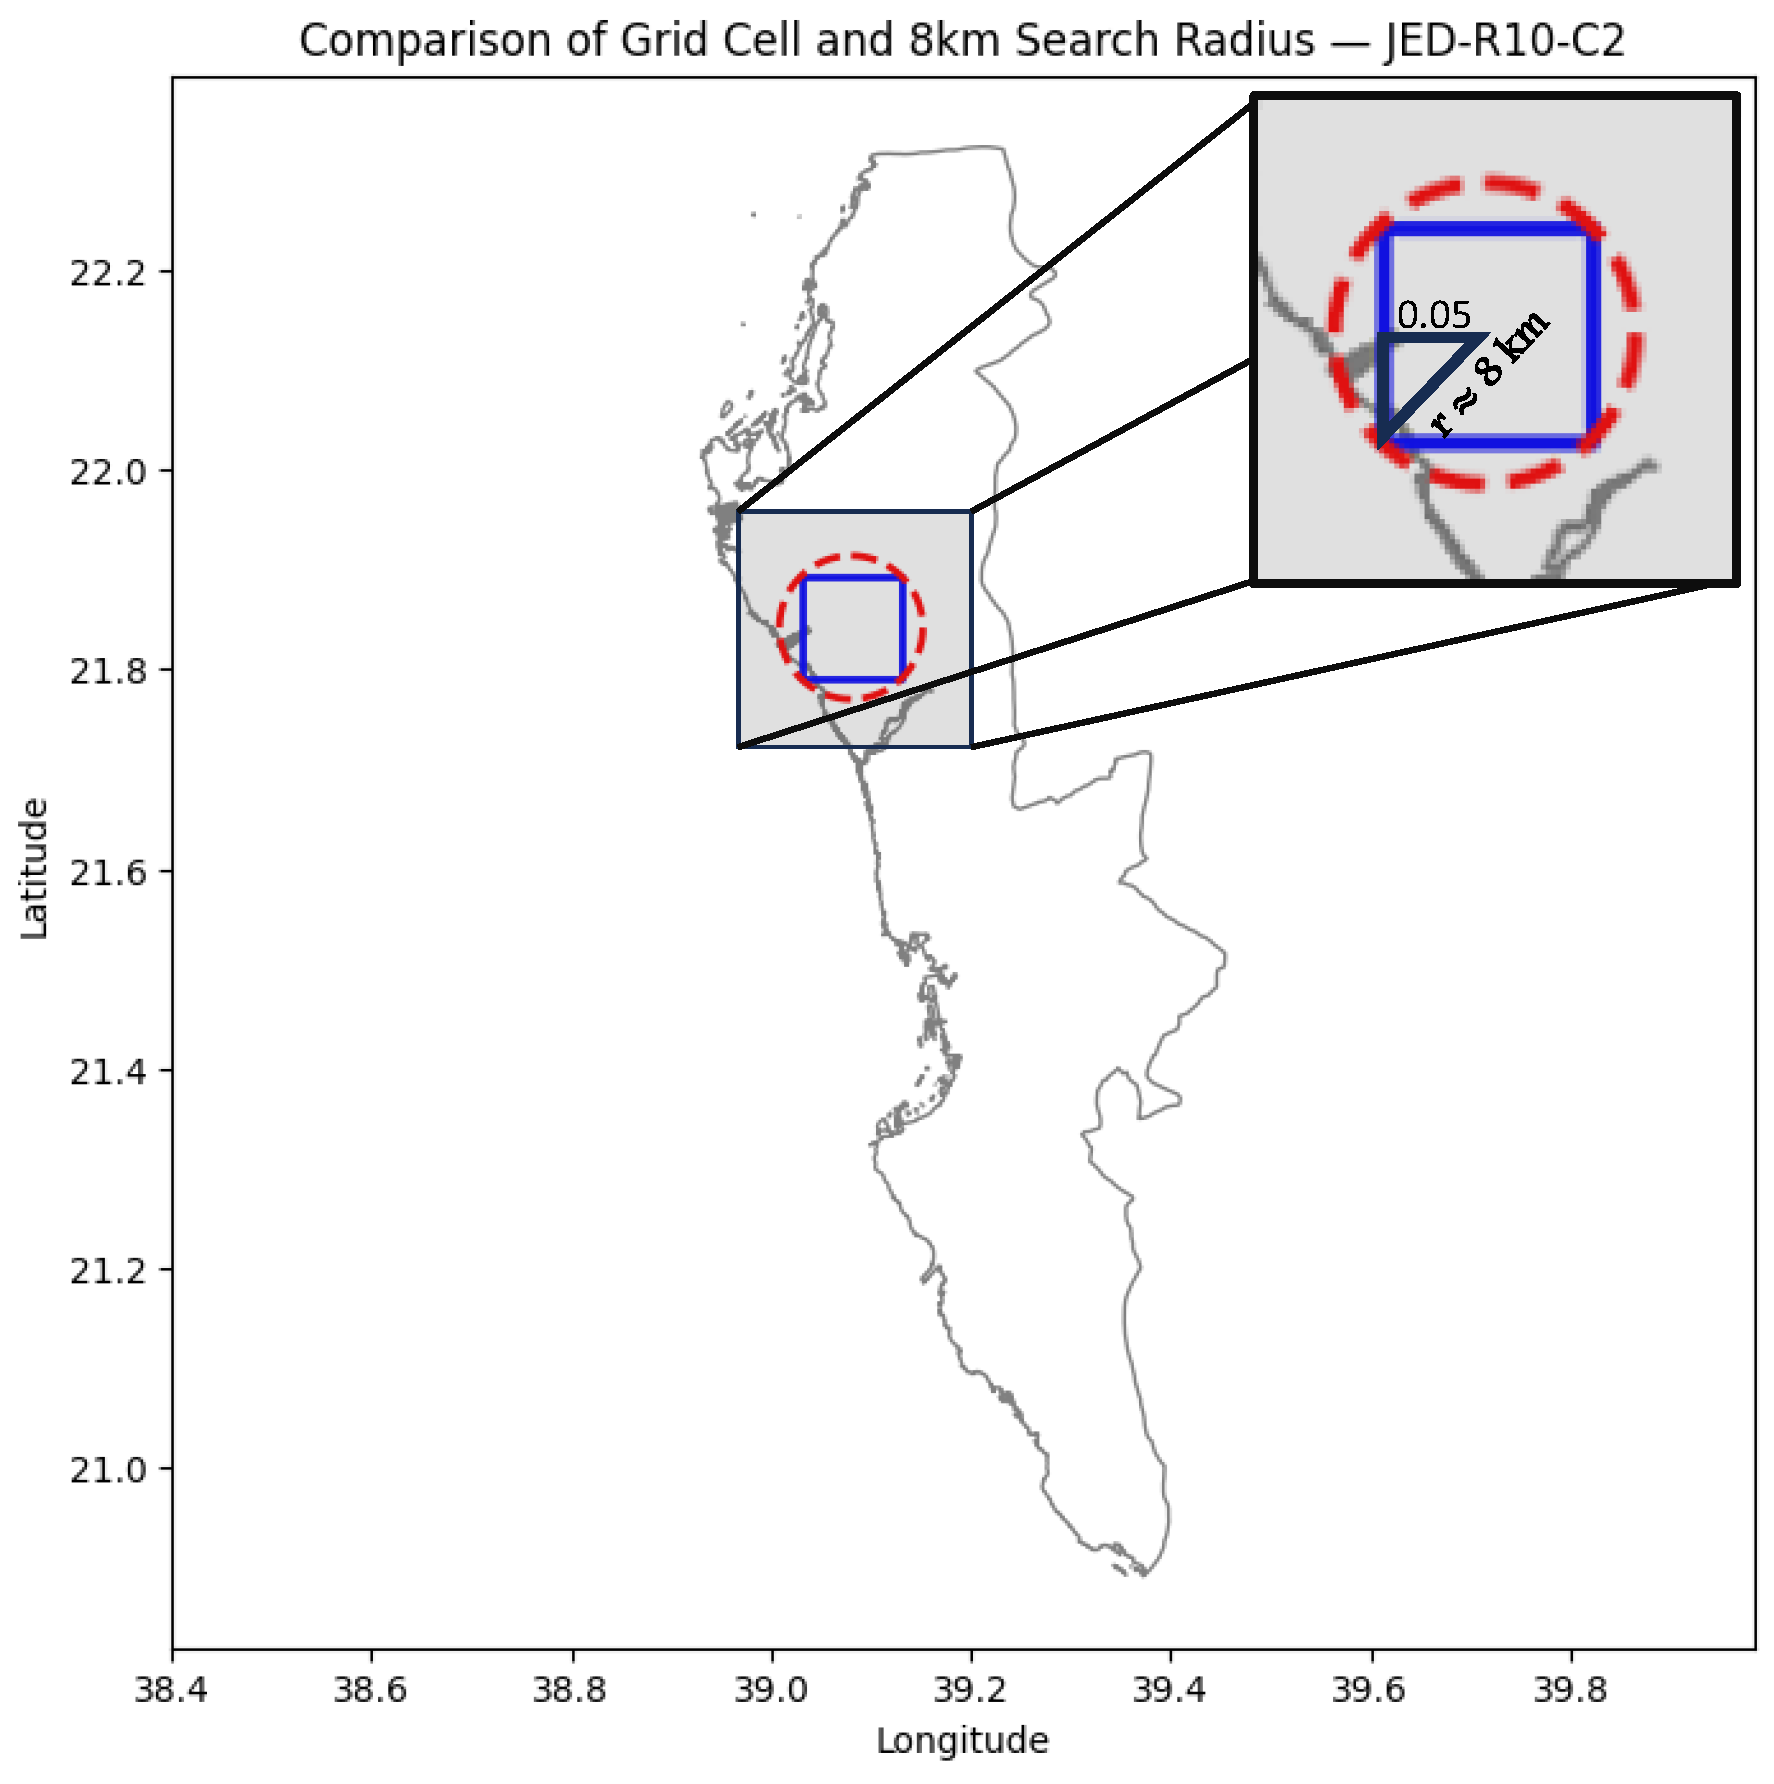
Figure 8, the distance from the centroid to an edge is half of
s (about 5.566 km), and the distance to a corner is about
km.
A radius of 8 km was therefore chosen. This value is slightly larger than the diagonal distance, which ensured that the circle covered the full square cell and all of its corners.
Table 2 shows these geometric measures.
Figure 8 shows this relationship, where the blue square is a sample grid cell and the red dashed circle is the 8 km search radius. The circle fully contains the cell, making sure no healthcare facility was missed.
3.2.2. Facility Data Retrieval
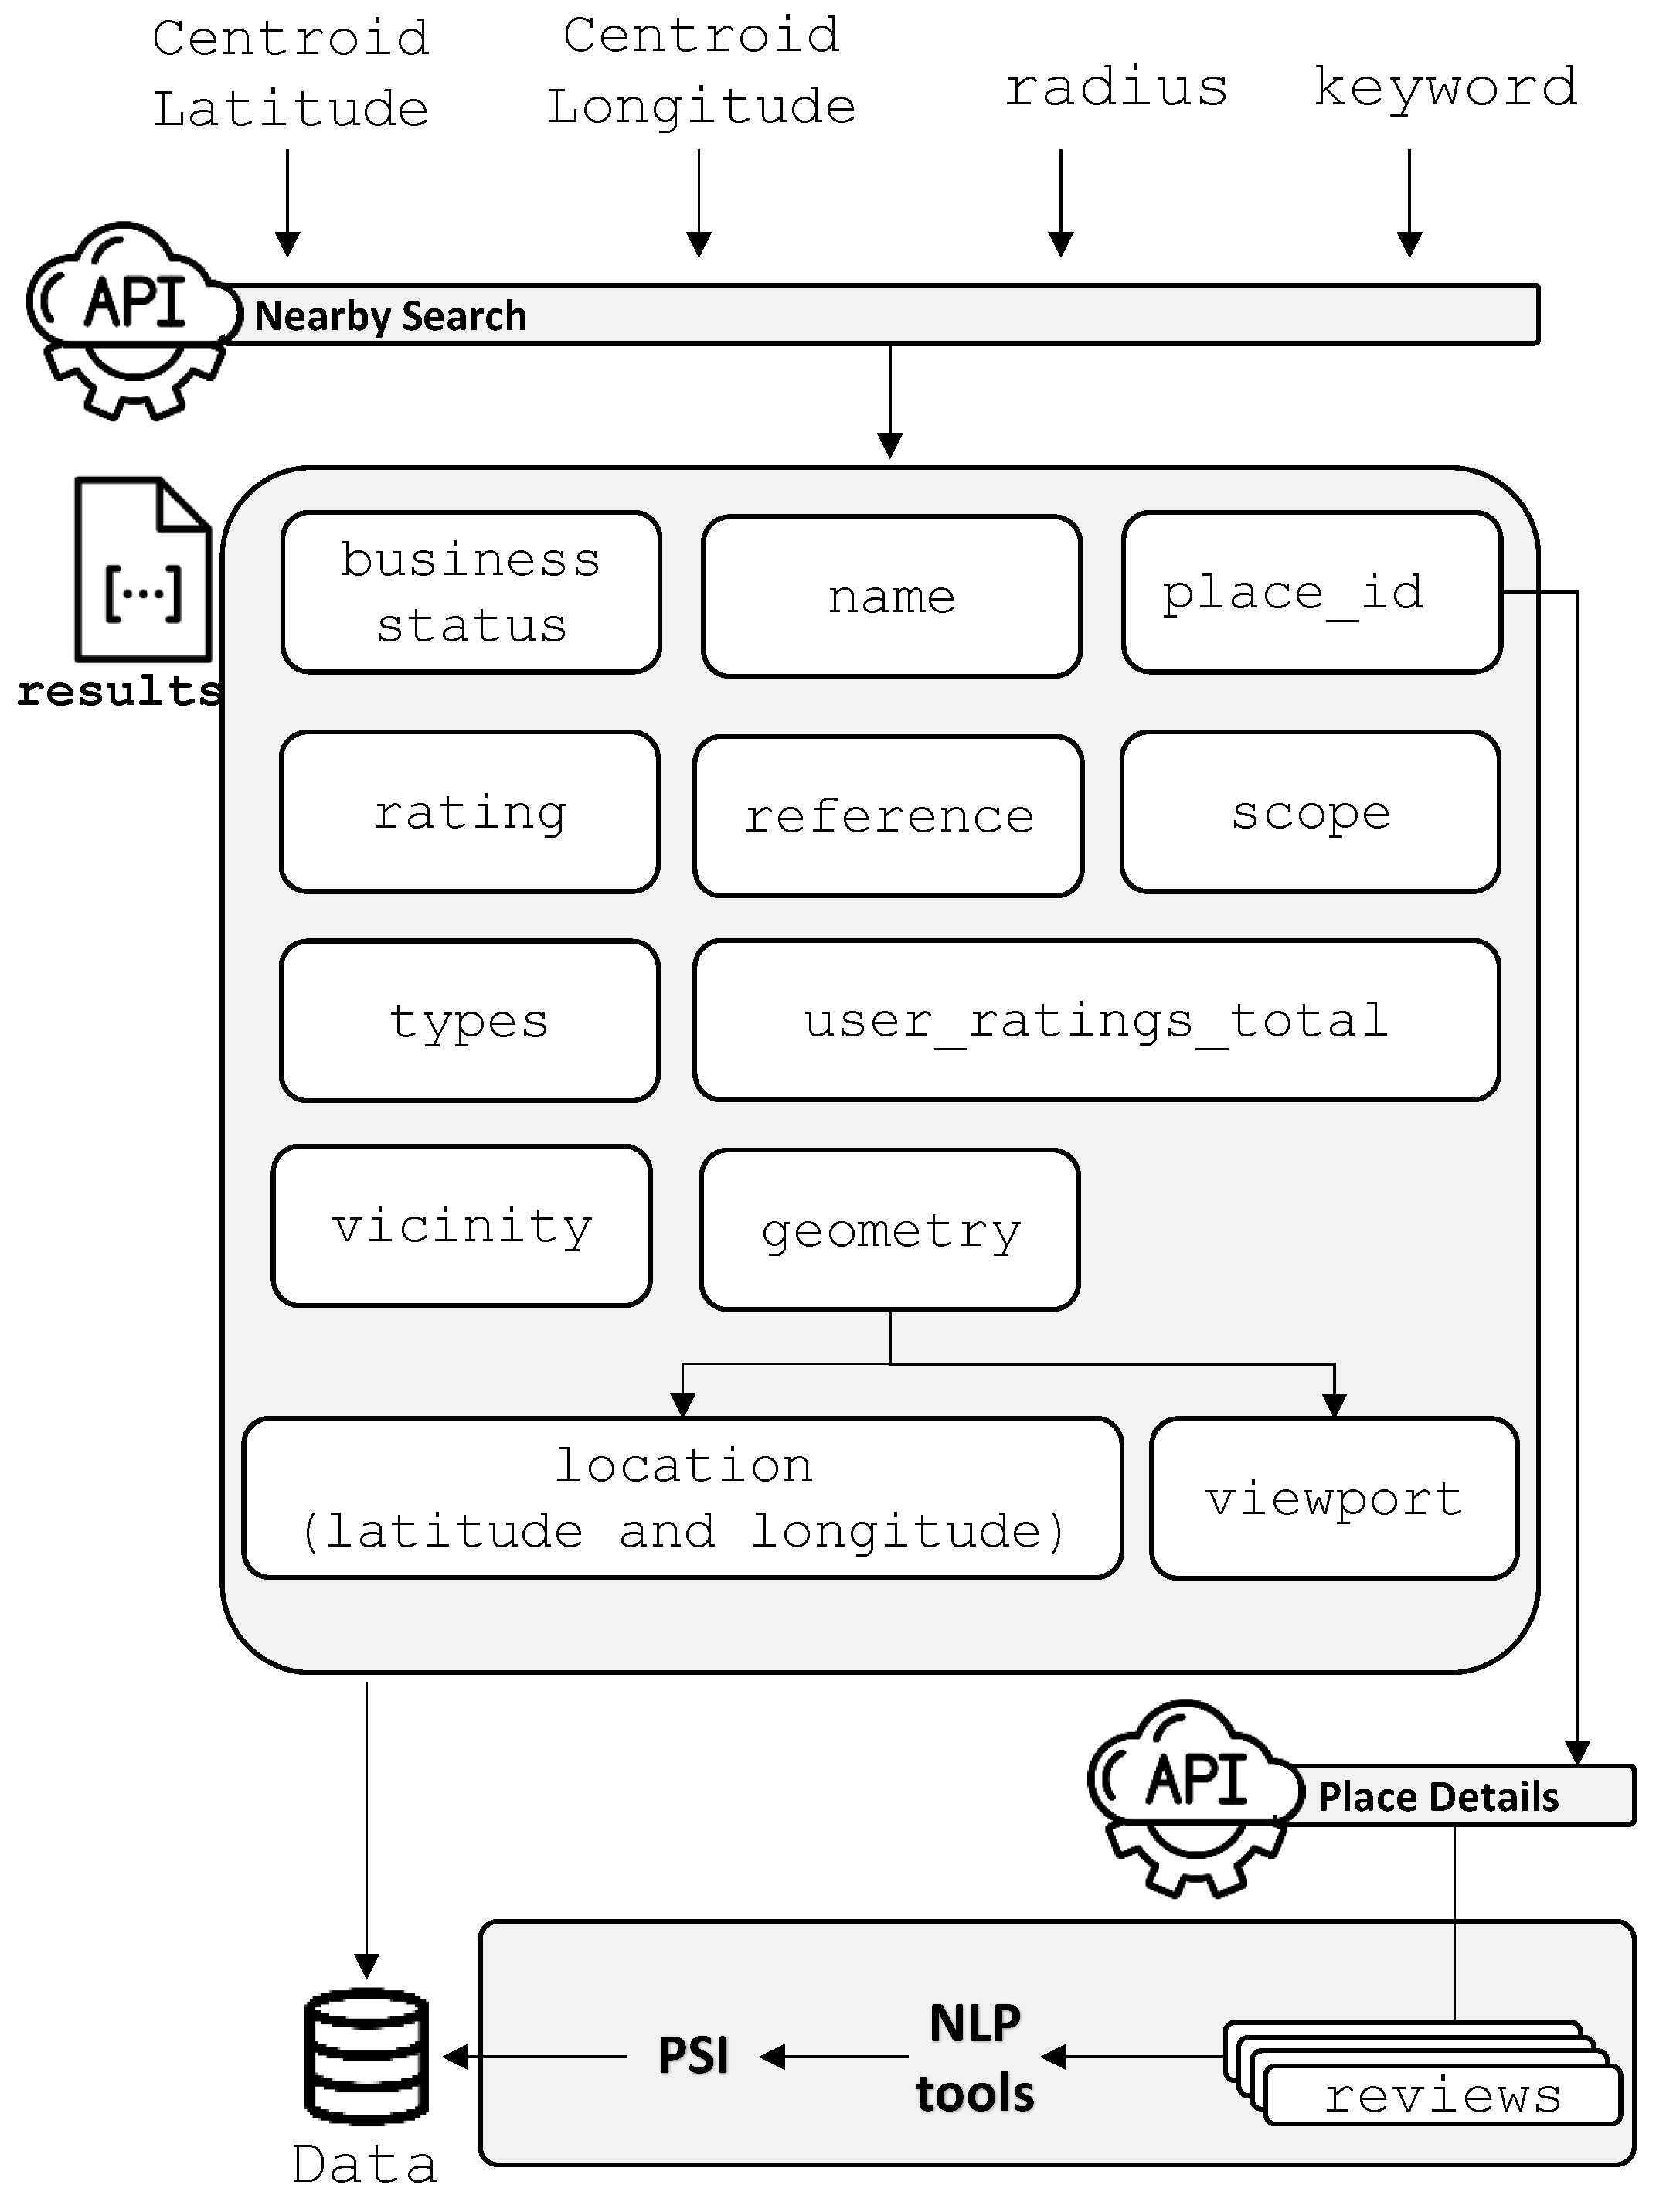
The Google Nearby Search API was then used to collect data on healthcare facilities such as clinics, hospitals, and health centres. Each request to the API was built with four parameters: centroid latitude, centroid longitude, radius, and a healthcare-related keyword.
To maximise results, a pagination mechanism was used. The API returns up to three pages (about 20 results per page), so as many as 60 facilities could be retrieved for a single grid cell. This returned several attributes for each facility. Implementation details of the API, including request construction, pagination, and example responses, are provided in
Appendix C.
Figure 9 shows the process and the attributes. The key fields are:
name: facility name;
lat, lon: geographic coordinates;
rating: average user rating (1–5 scale);
user_ratings_total: number of ratings submitted;
place_id, reference: unique identifiers;
types: classification (e.g., hospital, clinic);
vicinity: short description of location;
MC_id: an internally assigned identifier introduced in this study to uniquely index facilities within the GeoJedHF dataset.
Each facility was linked back to its grid cell by adding the identifiers cell_number and grid_id. This way, every entry in the dataset could be traced to its spatial unit in the grid framework.
3.2.3. Review Retrieval
In addition to these attributes, user reviews were collected using the Google Place Details API. This step added qualitative feedback to complement the numerical indicators (ratings and counts).
Each request to the Place Details API required the place_id of a facility. The API returned up to five reviews per facility, usually the most recent or most relevant.
The reviews were stored in a separate field of the dataset, linked to each facility using its
place_id,
cell_number, and
grid_id. These textual reviews were utilised in two subsequent analyses: (i) sentiment analysis using natural language processing (NLP) (see
Section 3.2.5), and (ii) incorporation into the Patient Satisfaction Index (PSI) baseline computation (see
Section 3.3).
3.2.4. Data Cleaning and Preprocessing
After the retrieval step, the dataset contained 583 entries of healthcare facilities across 55 grid cells. Since some facilities appeared more than once, duplicate records were removed by checking both the facility name and geographic coordinates. After this step, 295 unique facilities were kept.
Next, the dataset was checked for valid geographic coordinates and unique place_id values. No invalid entries were found. Five facilities did not have ratings or review counts, but they were still included as valid healthcare facilities that had not yet received user feedback. At this point, the dataset still contained 295 entries.
The types field provided by the API included a variety of labels, some of which were not related to healthcare (such as beauty_salon, store, or spa). To make the dataset consistent, filtering was applied to keep only medical facilities. Entries were kept if their types field included at least one of the following: hospital, dentist, or physiotherapist. Other categories, such as pharmacies, were excluded.
After filtering, the dataset was reduced to 216 valid healthcare facilities. This cleaned dataset was then used as the final version of GeoJedHF for later analysis.
3.2.5. Sentiment Analysis of Reviews
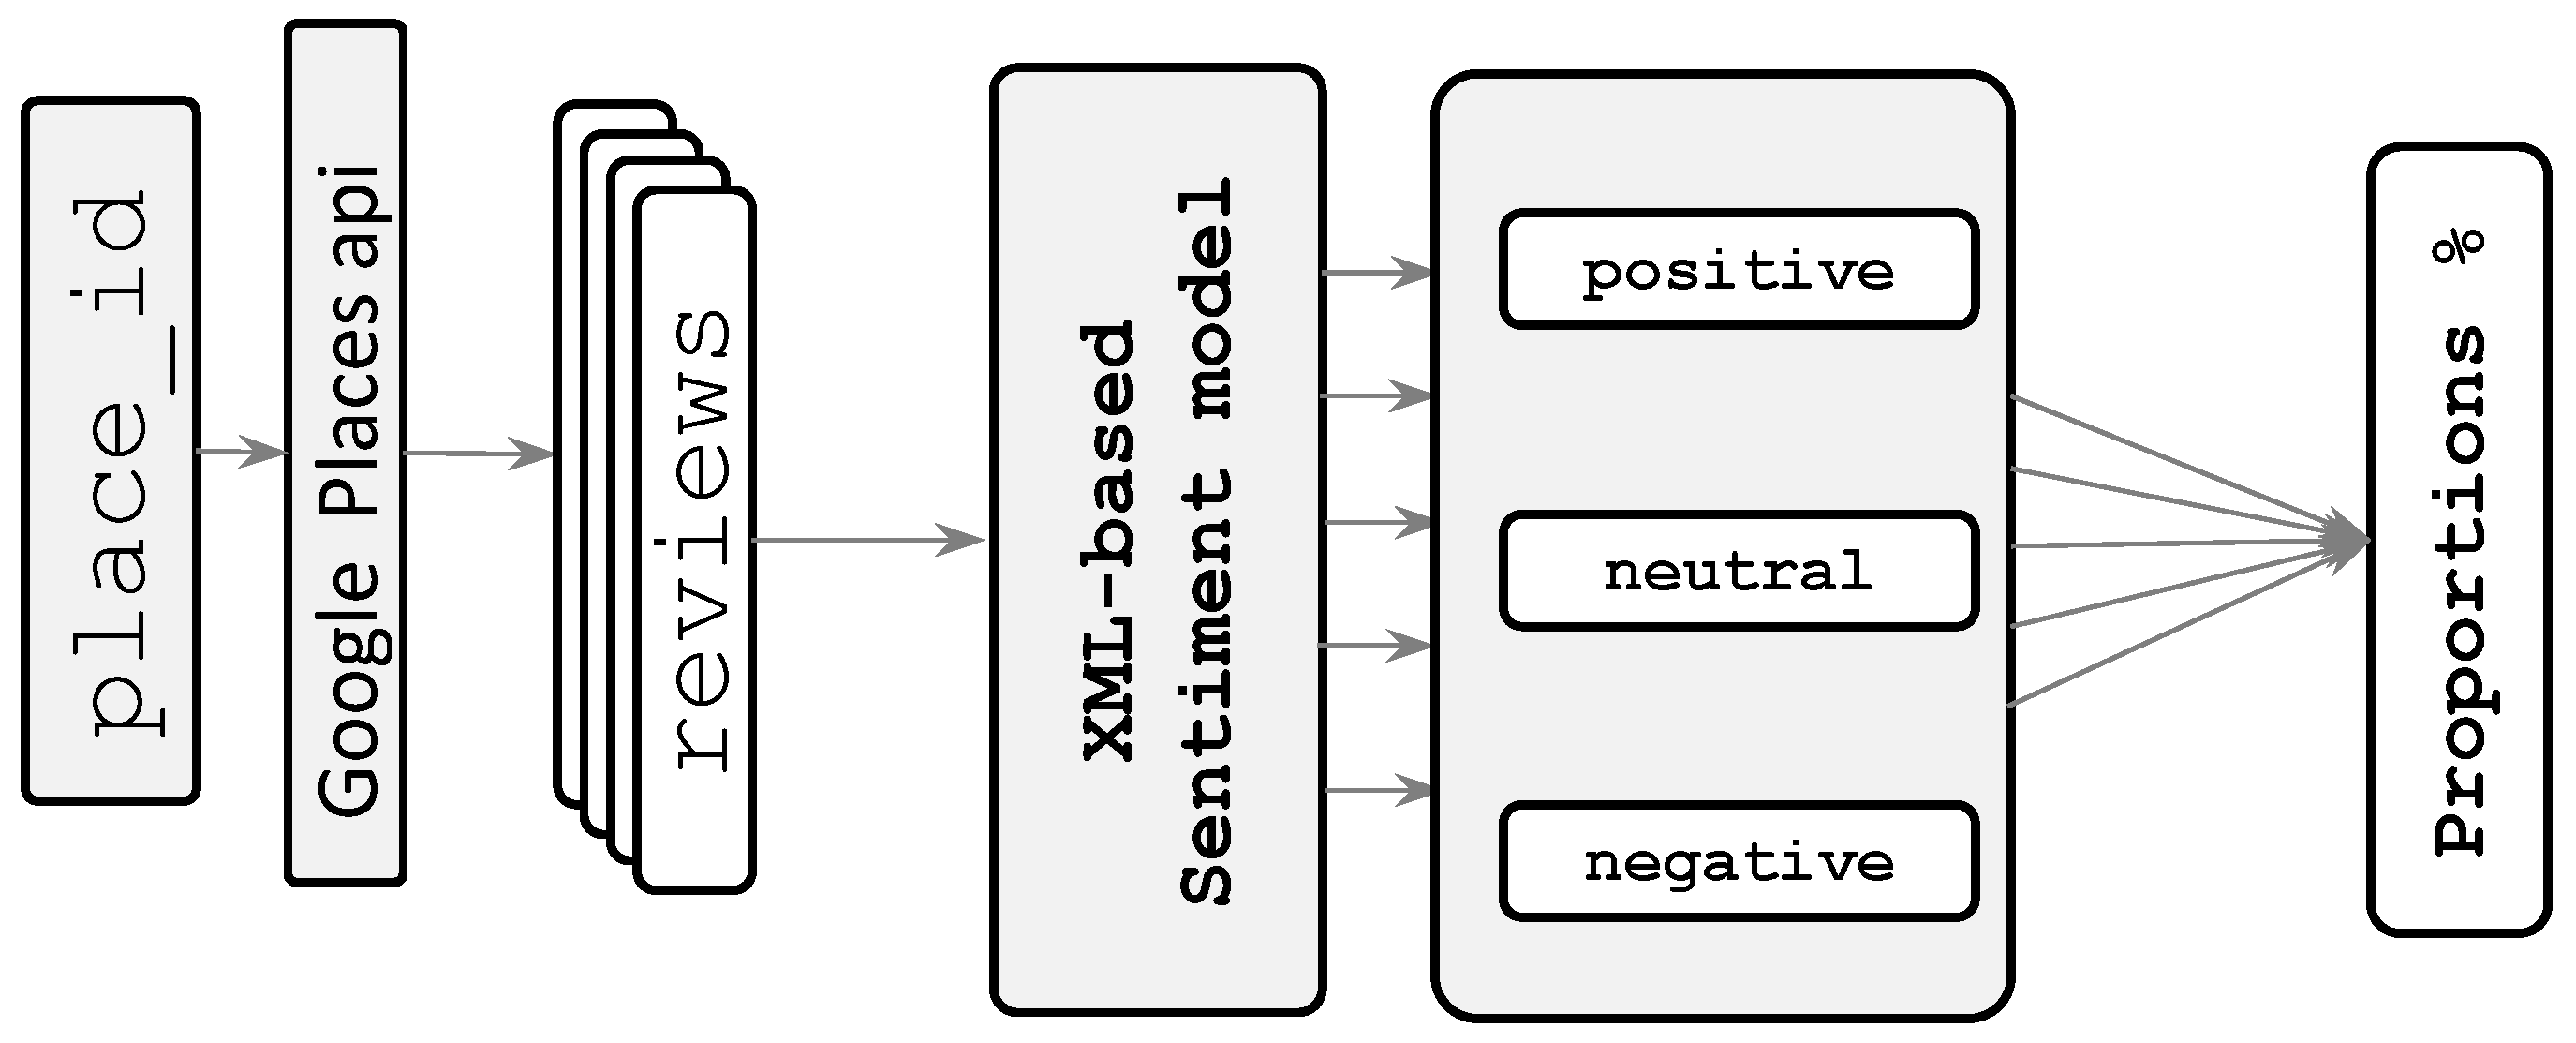
To include user opinions in the analysis, the textual reviews collected through the Place Details API were classified by sentiment. The goal was to see whether each review expressed a positive, neutral, or negative view of the healthcare facility.
For this task, the twitter-xlm-roberta-base-sentiment (
https://huggingface.co/cardiffnlp/twitter-xlm-roberta-base-sentiment, accessed on 24 February 2026) (a multilingual transformer-based model) was used. This model was trained on a large dataset of tweets in multiple languages, including Arabic and English. It has been shown to perform well on short texts that often mix languages, making it suitable for user reviews. Other studies have also confirmed the effectiveness of this type of multilingual model for sentiment tasks [
29,
30,
31].
Before classification, the review texts were normalised. Empty or missing reviews were marked as neutral. The model was applied in batches, and very long texts were shortened to 512 tokens (the model’s maximum input length).
For each review, the classifier produced both a sentiment label (positive, neutral, or negative) and a confidence score. The results for all reviews of a facility were then aggregated to compute proportions of each sentiment category.
Formally, for a facility
f, the proportion of sentiment
k was:
Figure 10 shows the workflow of this process: starting from review retrieval, passing through classification, and ending with sentiment aggregation at the facility level.
3.3. PSI Baseline
The Patient Satisfaction Index (PSI) was created as a metric to capture patient-perceived quality of healthcare services in Jeddah. It combines two components: the normalised rating score, where each facility’s star rating on the 1–5 scale was rescaled to the interval , and the positive sentiment proportion , representing the share of reviews classified as positive in the sentiment analysis step.
For a given facility
f, the raw rating
was transformed as:
where
is the raw rating (1–5) and
is the normalised rating in
.
The sentiment component was already expressed as a proportion between 0 and 1, so no further scaling was required.
The PSI for facility
f was then calculated as a weighted sum of the two components:
where
controls the relative weight assigned to the normalised rating compared with the sentiment proportion.
The weighting parameter was not intended to represent an optimised or definitive importance between ratings and sentiment. Instead, the selected values were used to conduct a sensitivity analysis that examines the robustness of PSI-based rankings under different weighting assumptions. Lower values of emphasise user sentiment, whereas higher values assign greater importance to numerical ratings. This approach allows the stability of facility rankings to be assessed without introducing additional assumptions or external weighting schemes. More advanced objective weighting methods, such as Analytic Hierarchy Process or entropy-based weighting, require expert judgement or auxiliary variables and are therefore left for future extensions of the PSI framework.
When facilities had the same PSI value, the number of submitted reviews was used to give priority to facilities with more feedback.
To test how stable the PSI rankings were, the selected three values of
were used. For each value, facilities were ranked, and the Top-
N and Bottom-
N facilities were compared. The consistency of these lists across values of
was measured with the Jaccard similarity index:
where
A and
B are two sets of facilities.
The results of this robustness test are presented later in the results section.
4. Results and Analysis
4.1. Grid Framework
To enable spatial analysis, the study area of Jeddah was divided into a uniform grid framework. A total of 55 cells were created, each with fixed dimensions of , ensuring consistency across the study area. Each cell was assigned a unique identifier (cell_number) along with a structured grid label (grid_id) denoting its row and column position. This framework provided the spatial basis for linking healthcare facilities to specific geographic units.
Table 3 presents a sample of the resulting GeoJed, including their unique identifiers and bounding coordinates. While the grid was designed to cover the entire administrative boundary of Jeddah, it is important to note that several peripheral cells extend partially beyond the official boundary. As shown earlier in
Figure 5, facilities were retrieved using the centroid of each grid cell with an approximate radius of 8 km. Consequently, some centres located just outside the administrative boundary of Jeddah were included in the dataset, as they fell within the coverage of the corresponding cell centroid.
4.2. GeoJedHF Retrieval
Healthcare facilities were retrieved using an 8 km radius query around each grid centroid, yielding a combined total of 583 entries. Because the search areas of neighbouring cells overlapped, many facilities were returned more than once. After systematic deduplication based on facility name and geographic coordinates, the dataset was reduced to 295 unique healthcare facilities. This refined dataset formed the foundation for subsequent spatial and quality analyses.
The retrieved attributes (described earlier in
Section 3.2.2) were linked to their corresponding grid cells.
Table 4 provides an example record from the
GeoJedHF dataset after integration with the grid framework.
4.3. Spatial Distribution of Retrieved Facilities
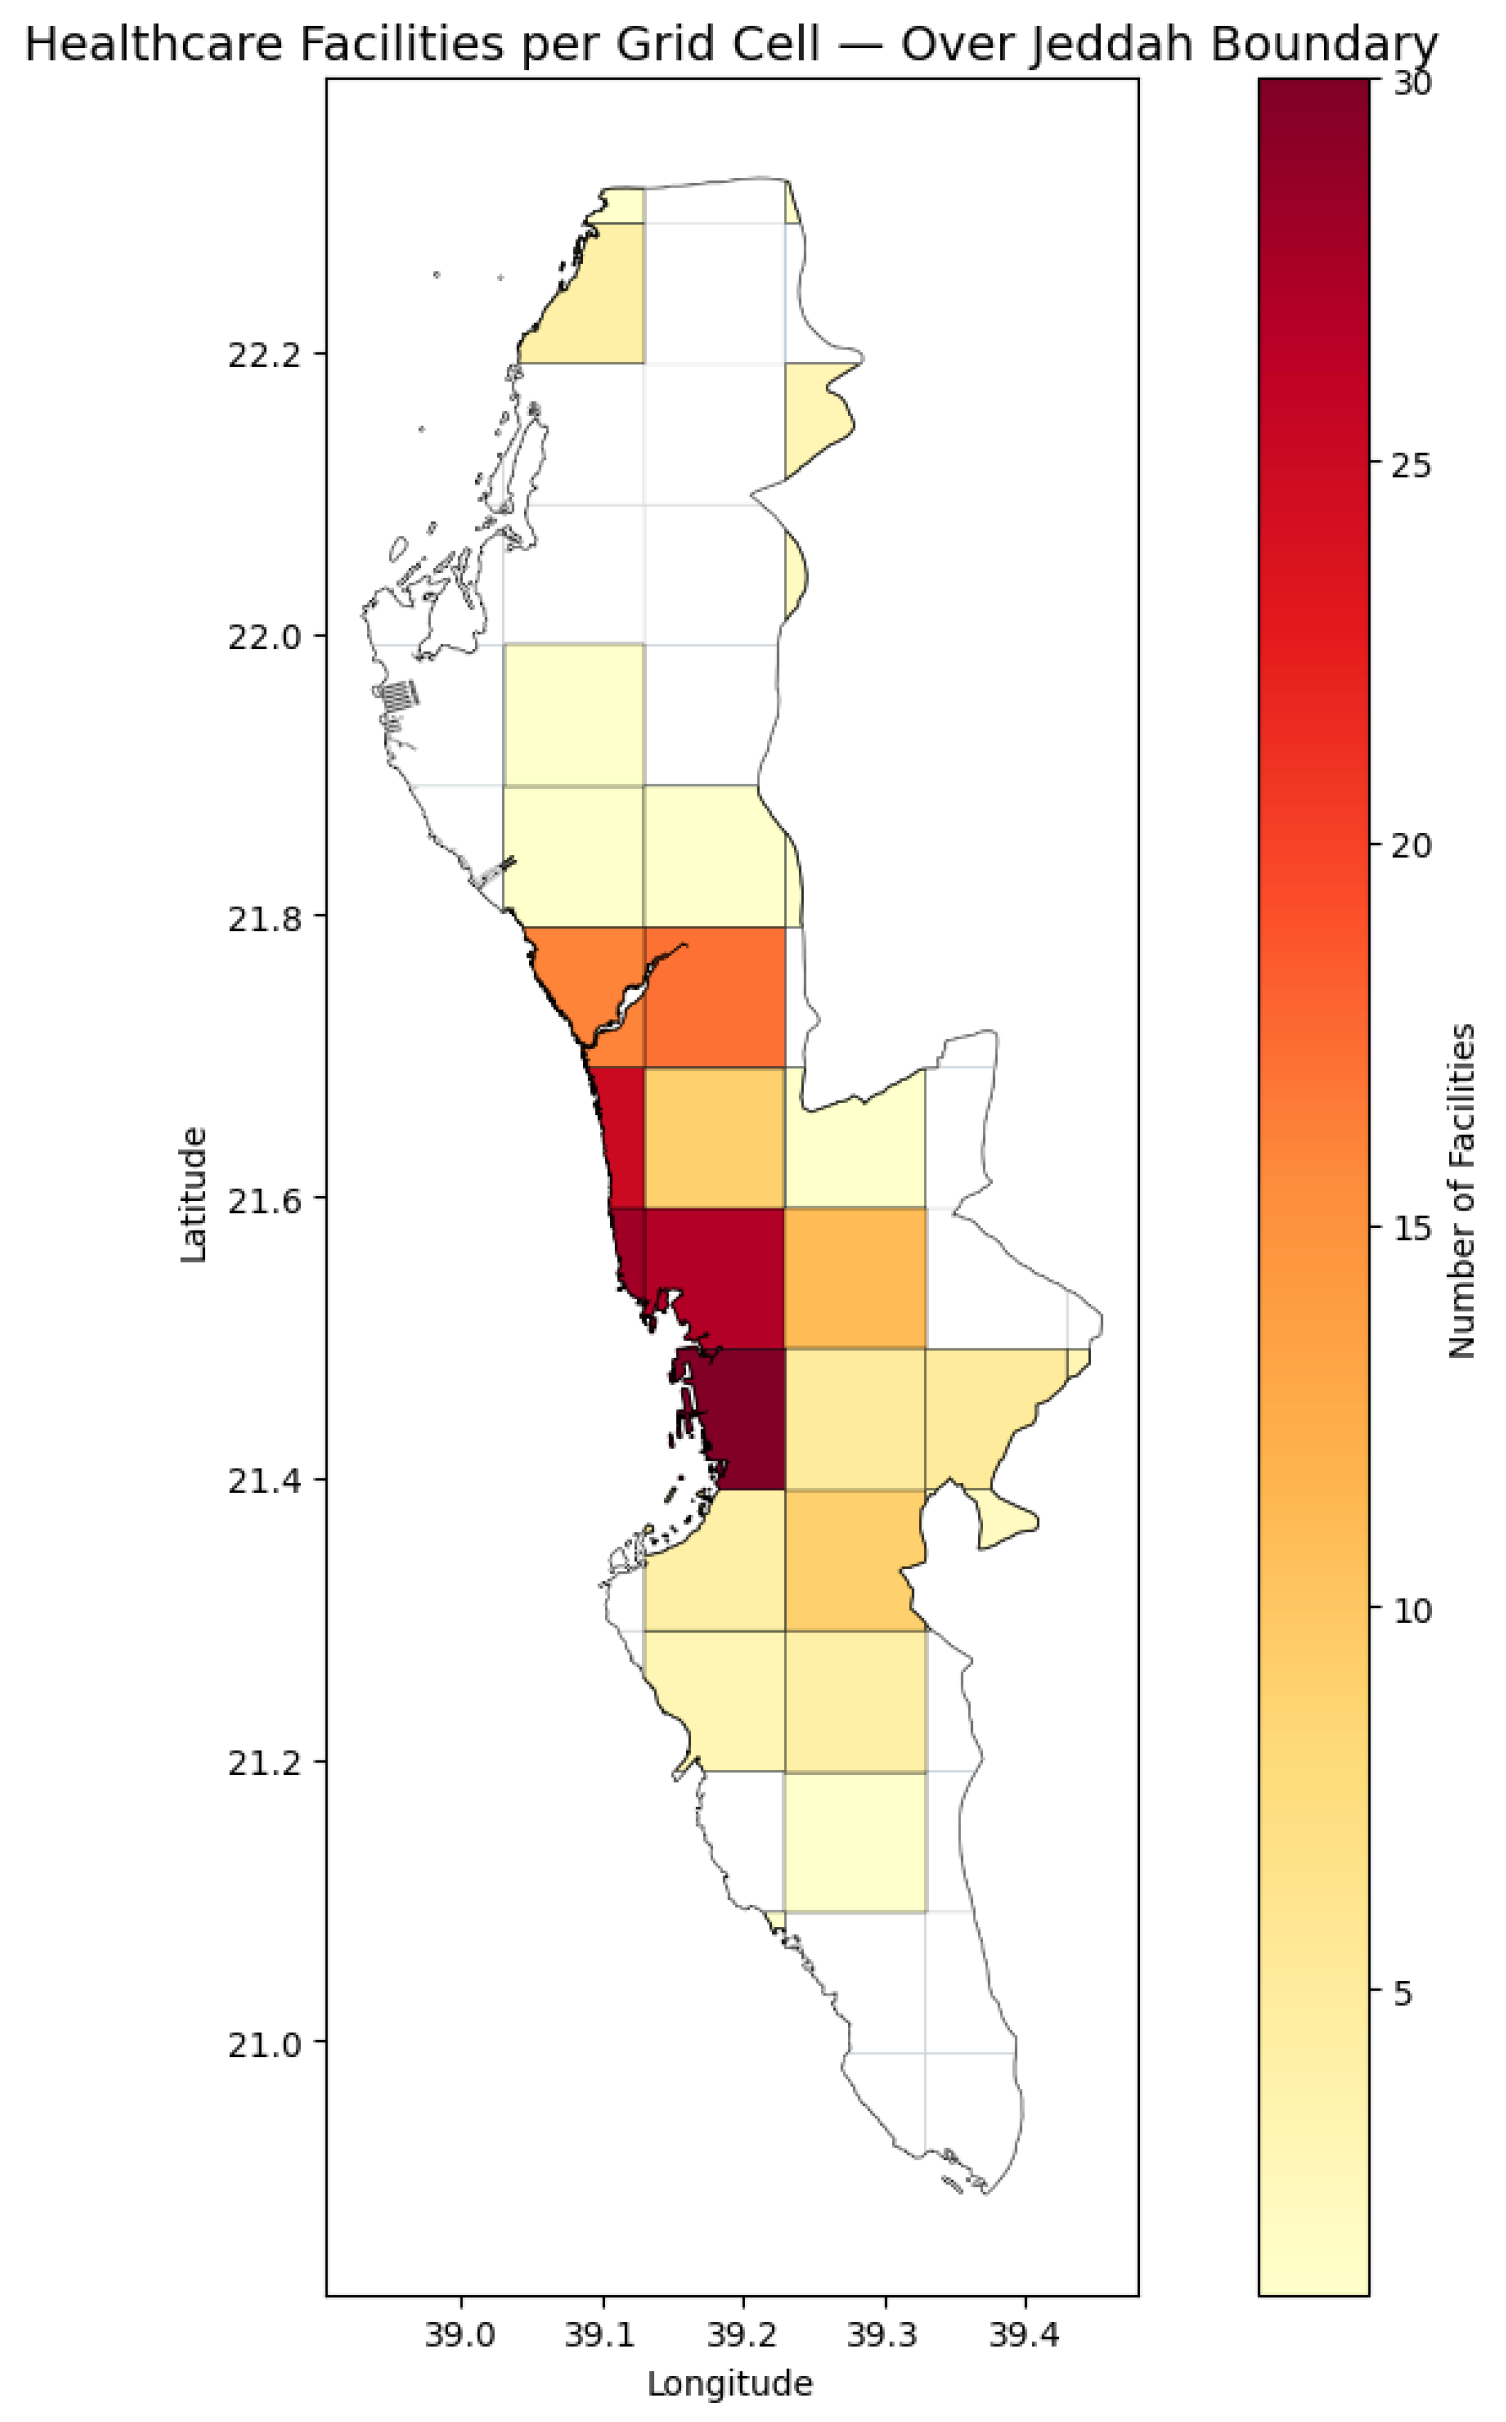
As shown in
Figure 11, the retained healthcare facilities revealed a highly skewed spatial pattern: a small number of cells concentrate most services, whereas many cells contain few (or zero) facilities.
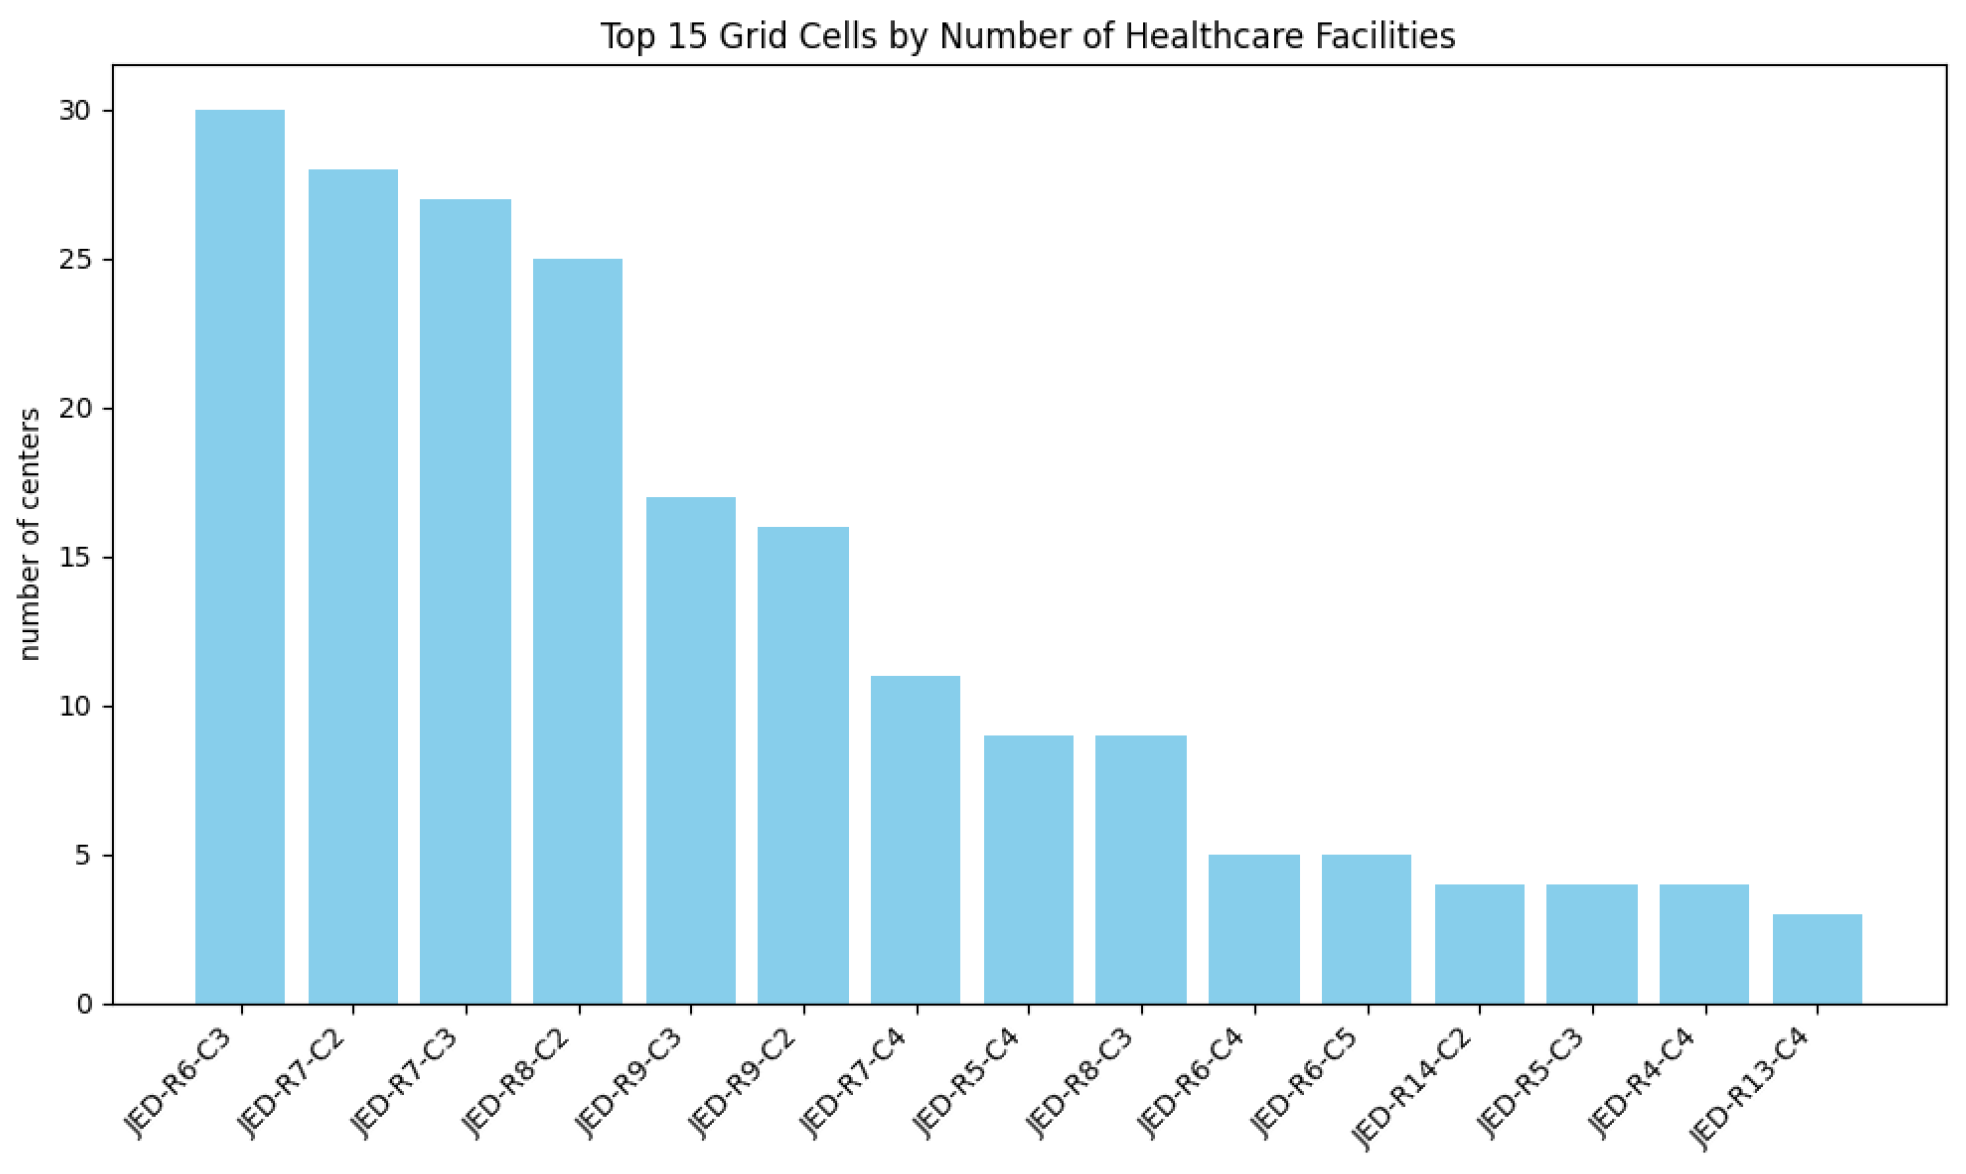
Figure 12 shows the Top-15 grid cells by facility count. The leading cell (JED-R6-C3) hosts 30 facilities, followed by JED-R7-C2 (28), JED-R7-C3 (27), and JED-R8-C2 (25). Beyond these peaks, counts drop quickly; most other cells in the Top-15 host fewer than 20 facilities each, and many cells have ≤5 facilities.
The overall spatial structure (
Figure 13) maps the number of facilities per cell across the Jeddah grid. A clear cluster emerges along the central urban corridor and adjacent coastal strip (roughly longitudes 39.10–39.30 and latitudes 21.50–21.65), while several northern and southern peripheral cells are sparsely populated or empty. This pattern indicates a potential oversupply within the urban core contrasted with underserved peripheral districts.
4.4. Review Retrieval
To enrich the dataset with qualitative user feedback, reviews were retrieved for each facility, up to five recent or relevant reviews per facility. A total of 216 healthcare facilities were queried, yielding 1027 reviews. Of these, 858 were non-empty textual comments, while the remainder were ratings without accompanying text. Almost all facilities had at least one review, with 93.1% returning the maximum of five reviews. The non-empty reviews contained on average 27 words. Most reviews were in Arabic (83.1%), with the remainder (16.9%) in non-Arabic languages.
To illustrate the nature of these reviews, consider three representative cases (translated from Arabic comments).
A very short entry such as “Closed centre” was automatically classified as neutral by the sentiment model, even though the user assigned a rating of 1; here, the numerical score provides the more reliable signal. Another example shows a long negative comment—“Poor service at reception …with unprofessional staff”—which received a star rating of 3. This illustrates that sentiment analysis adds value by aligning the text with the expressed dissatisfaction rather than the middling score alone. Finally, explicitly positive feedback such as “Respectable centre with good service, and the specialist was highly professional” came with a rating of 5, where the agreement between text and score was straightforward and sufficient. These examples highlight the complementarity between numeric ratings and sentiment classification.
4.5. Service Quality Analysis
4.5.1. Ratings Analysis
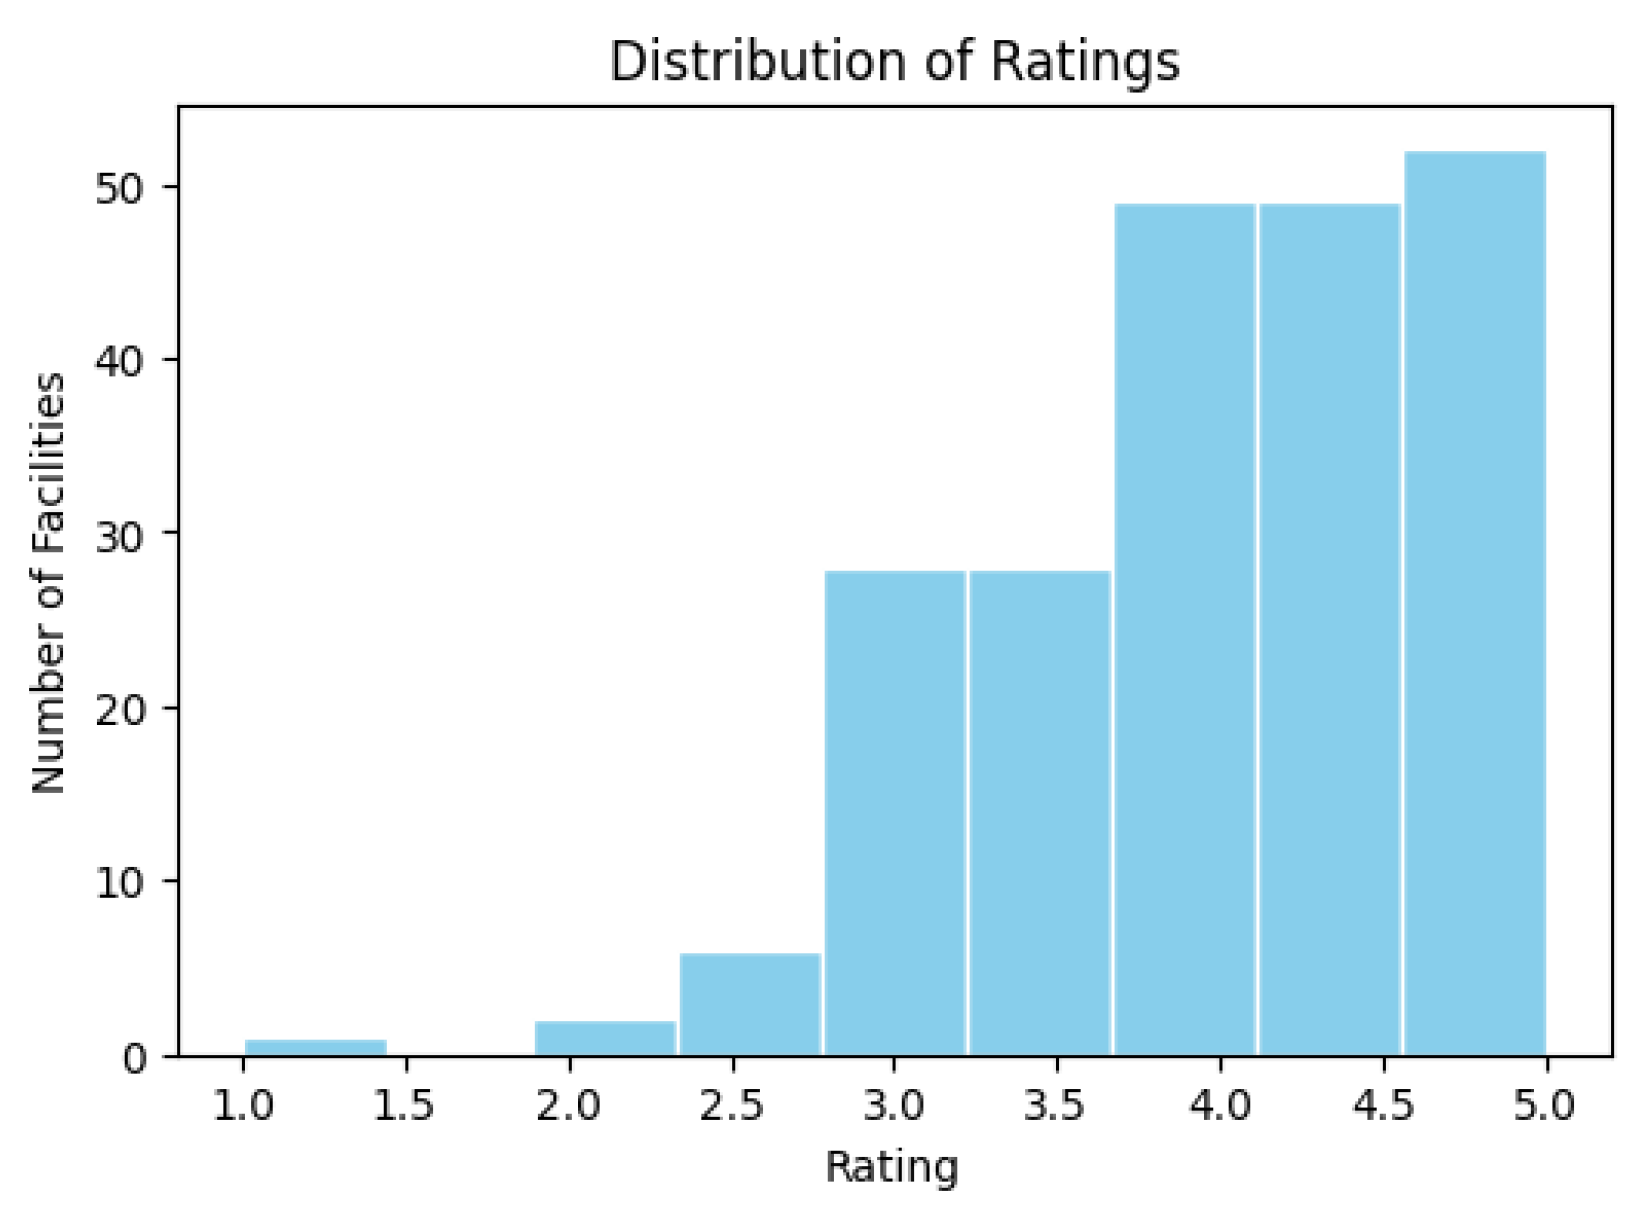
Across the 216 facilities, only one facility lacked a rating entry. The overall distribution shown in
Figure 14 is skewed toward higher scores of 3.0 to 5.0. The unweighted mean rating is 3.96. When weighting each facility’s rating
r by its number of user ratings
n using
, the overall score increases to 4.11.
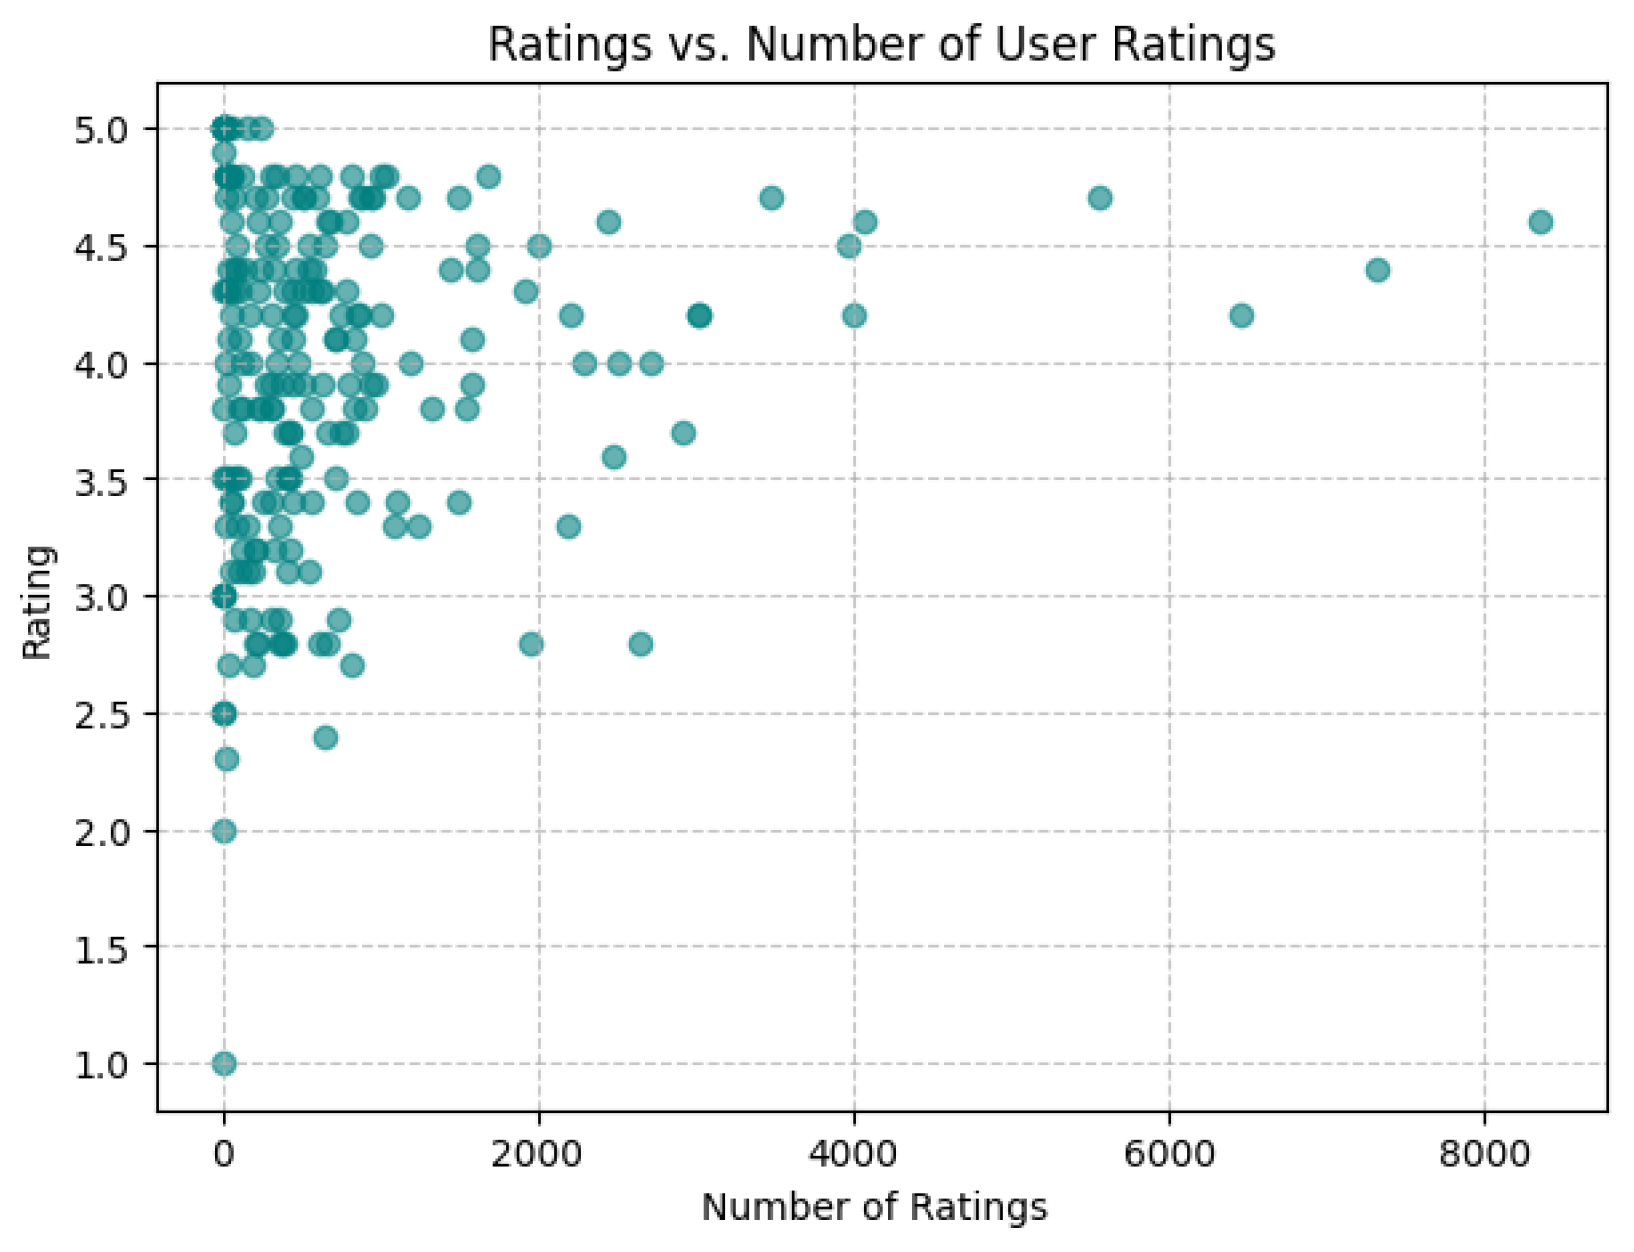
Figure 15 shows that most facilities cluster in the 3–5 range with fewer than 1000 reviews; a few centres attract thousands of reviews while maintaining high averages.
4.5.2. Review Sentiment Analysis
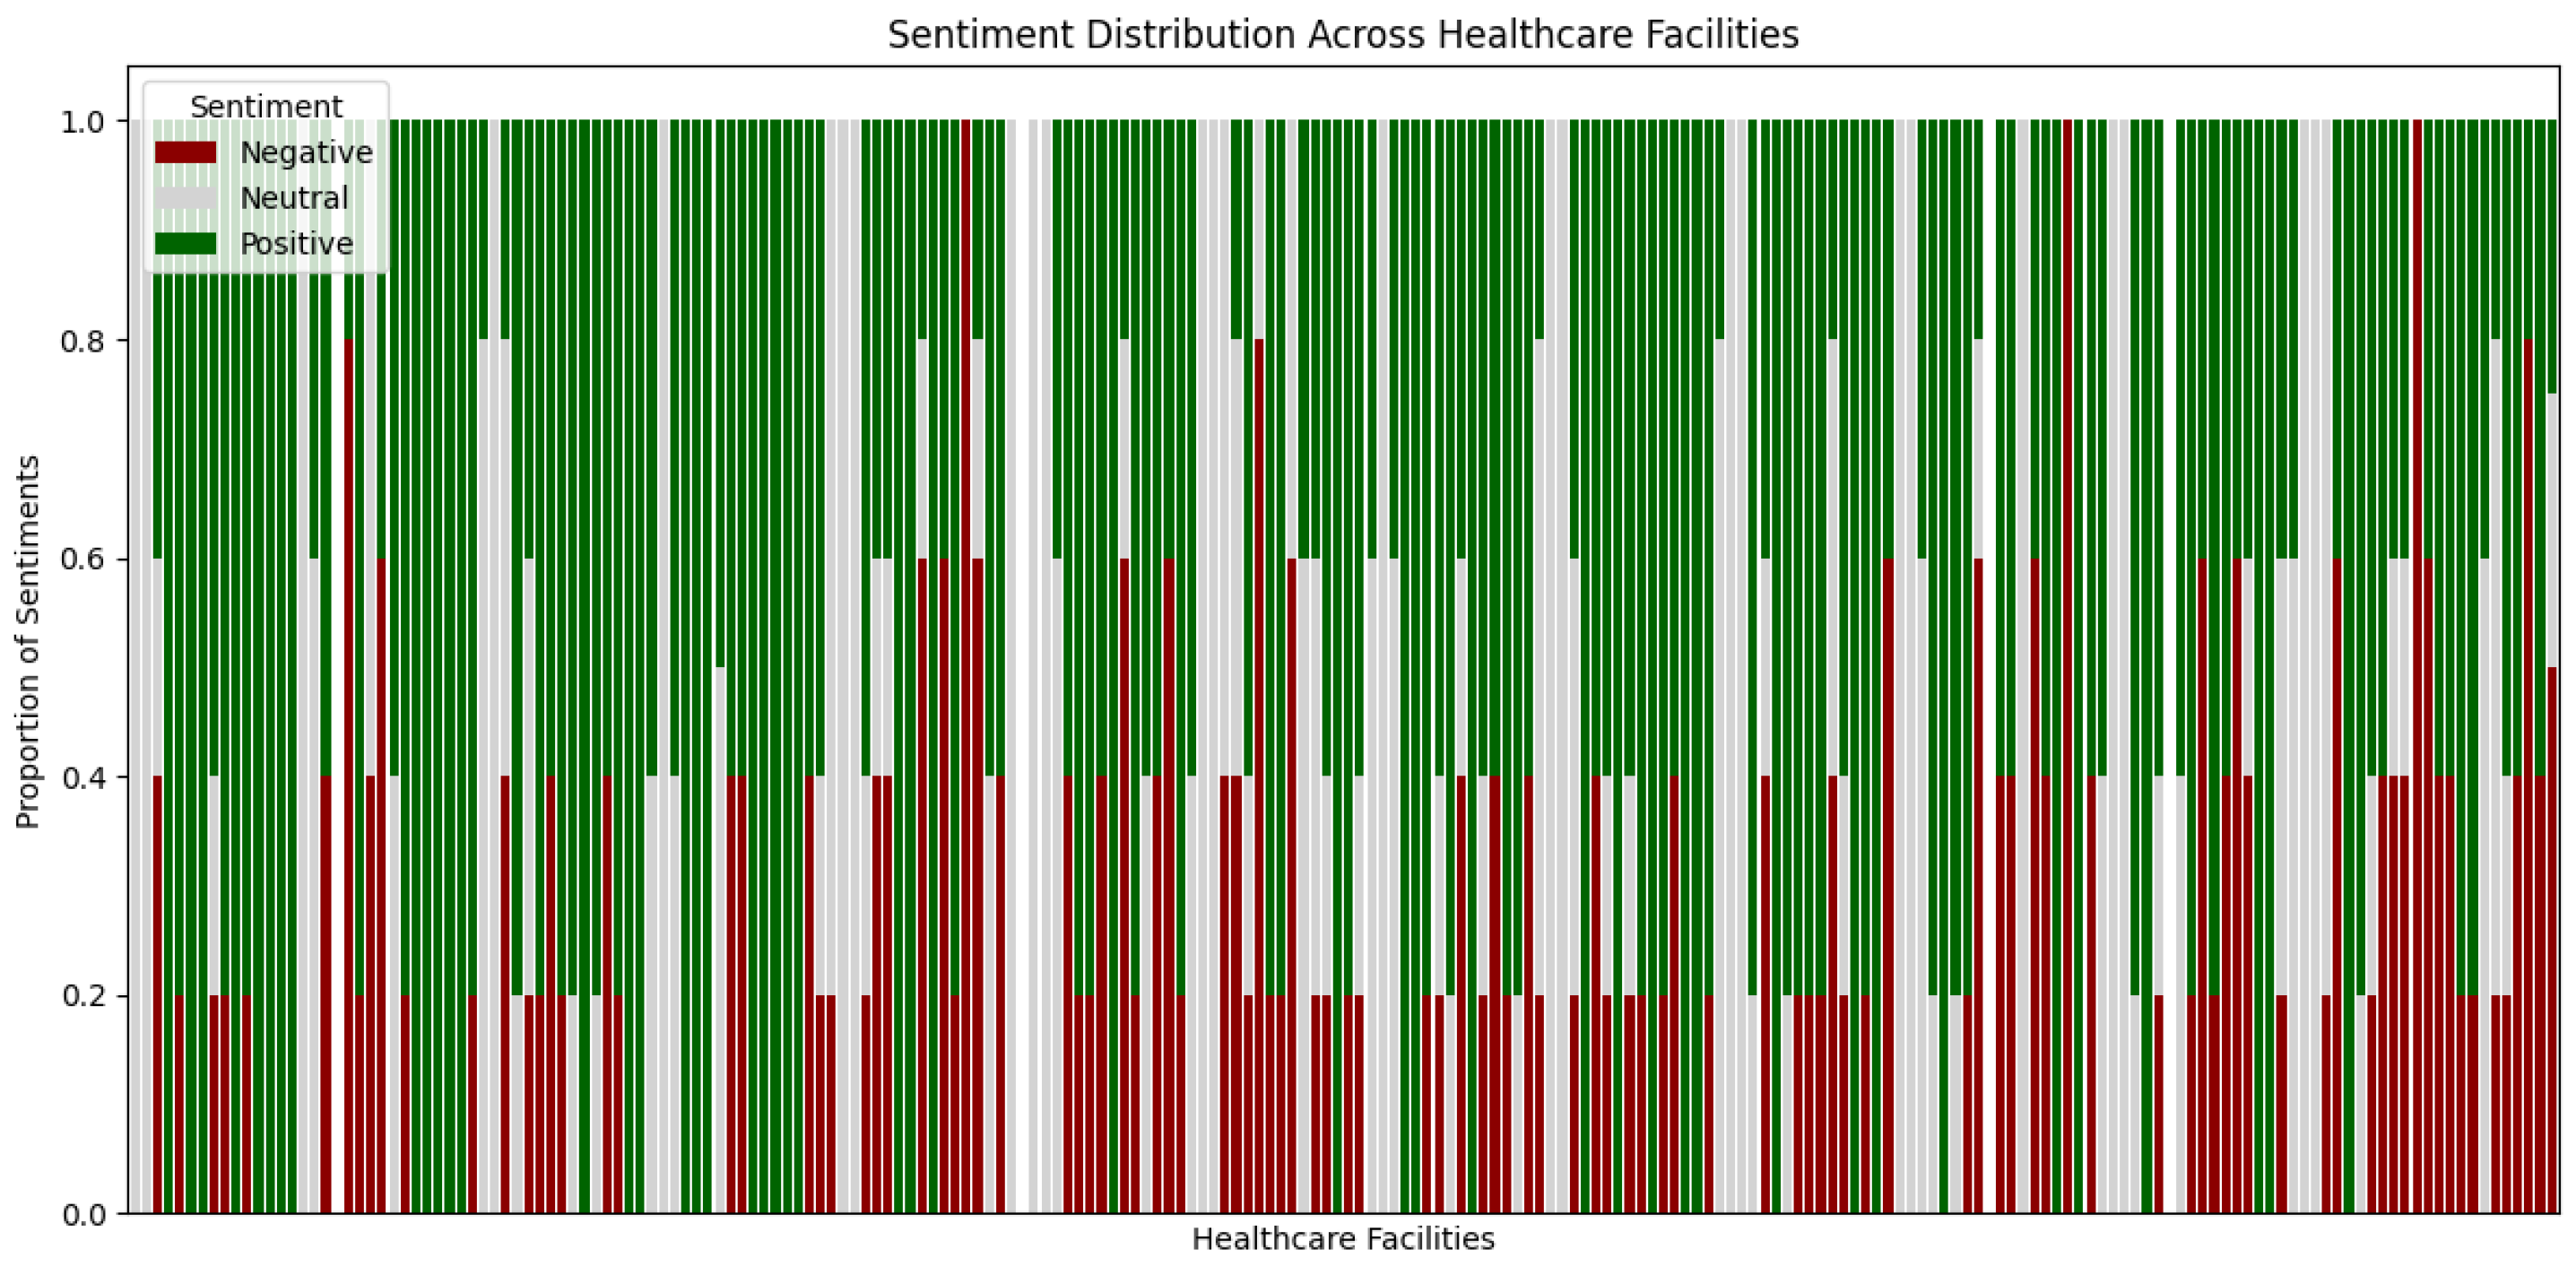
Each review was automatically labelled as positive, neutral, or negative using the multilingual transformer model xlm-roberta-base-sentiment. This model has been shown to perform well on short texts that often mix languages, making it suitable for user reviews. The facility-level proportions were then computed. Most facilities were dominated by positive sentiment (in many cases > 70%), but some examples showed mixed or negative sentiment.
The labelling step served as a baseline for constructing the index PSI, and while effective, its reliability requires further evaluation. Although previous studies have confirmed the effectiveness of this type of multilingual model for sentiment tasks [
29,
30,
31], further work is needed to refine and evaluate the model in order to determine the extent to which such automatic sentiment predictions can be relied upon in this dataset.
Figure 16 illustrates the sentiment composition across facilities.
4.6. PSI Baseline
The PSI was applied as a composite index to evaluate healthcare facilities across Jeddah. It integrates two complementary components: the normalised facility rating and the proportion of positive reviews obtained from sentiment classification. These two dimensions together provide a combined view of numerical ratings and qualitative patient feedback, enabling comparative analysis of facilities.
The PSI was computed using the formulation introduced earlier (see
Section 3.3). For this study,
was applied to control the weighting between ratings and sentiment. Lower values of
give greater emphasis to patient opinions, while higher values favour star ratings. Facilities with identical PSI values were ranked using the number of submitted reviews (user_ratings_total) as a tie-breaker.
4.6.1. Facility Rankings by PSI
Table 5 presents the Top-10 facilities (upper panel) and the Bottom-10 facilities (lower panel) for
. Entries with no reviews and no rating were excluded from subsequent analyses.
4.6.2. Stability Analysis
To assess robustness, we compared Top and Bottom facility rankings across
values using the Jaccard index (see
Section 3.3).
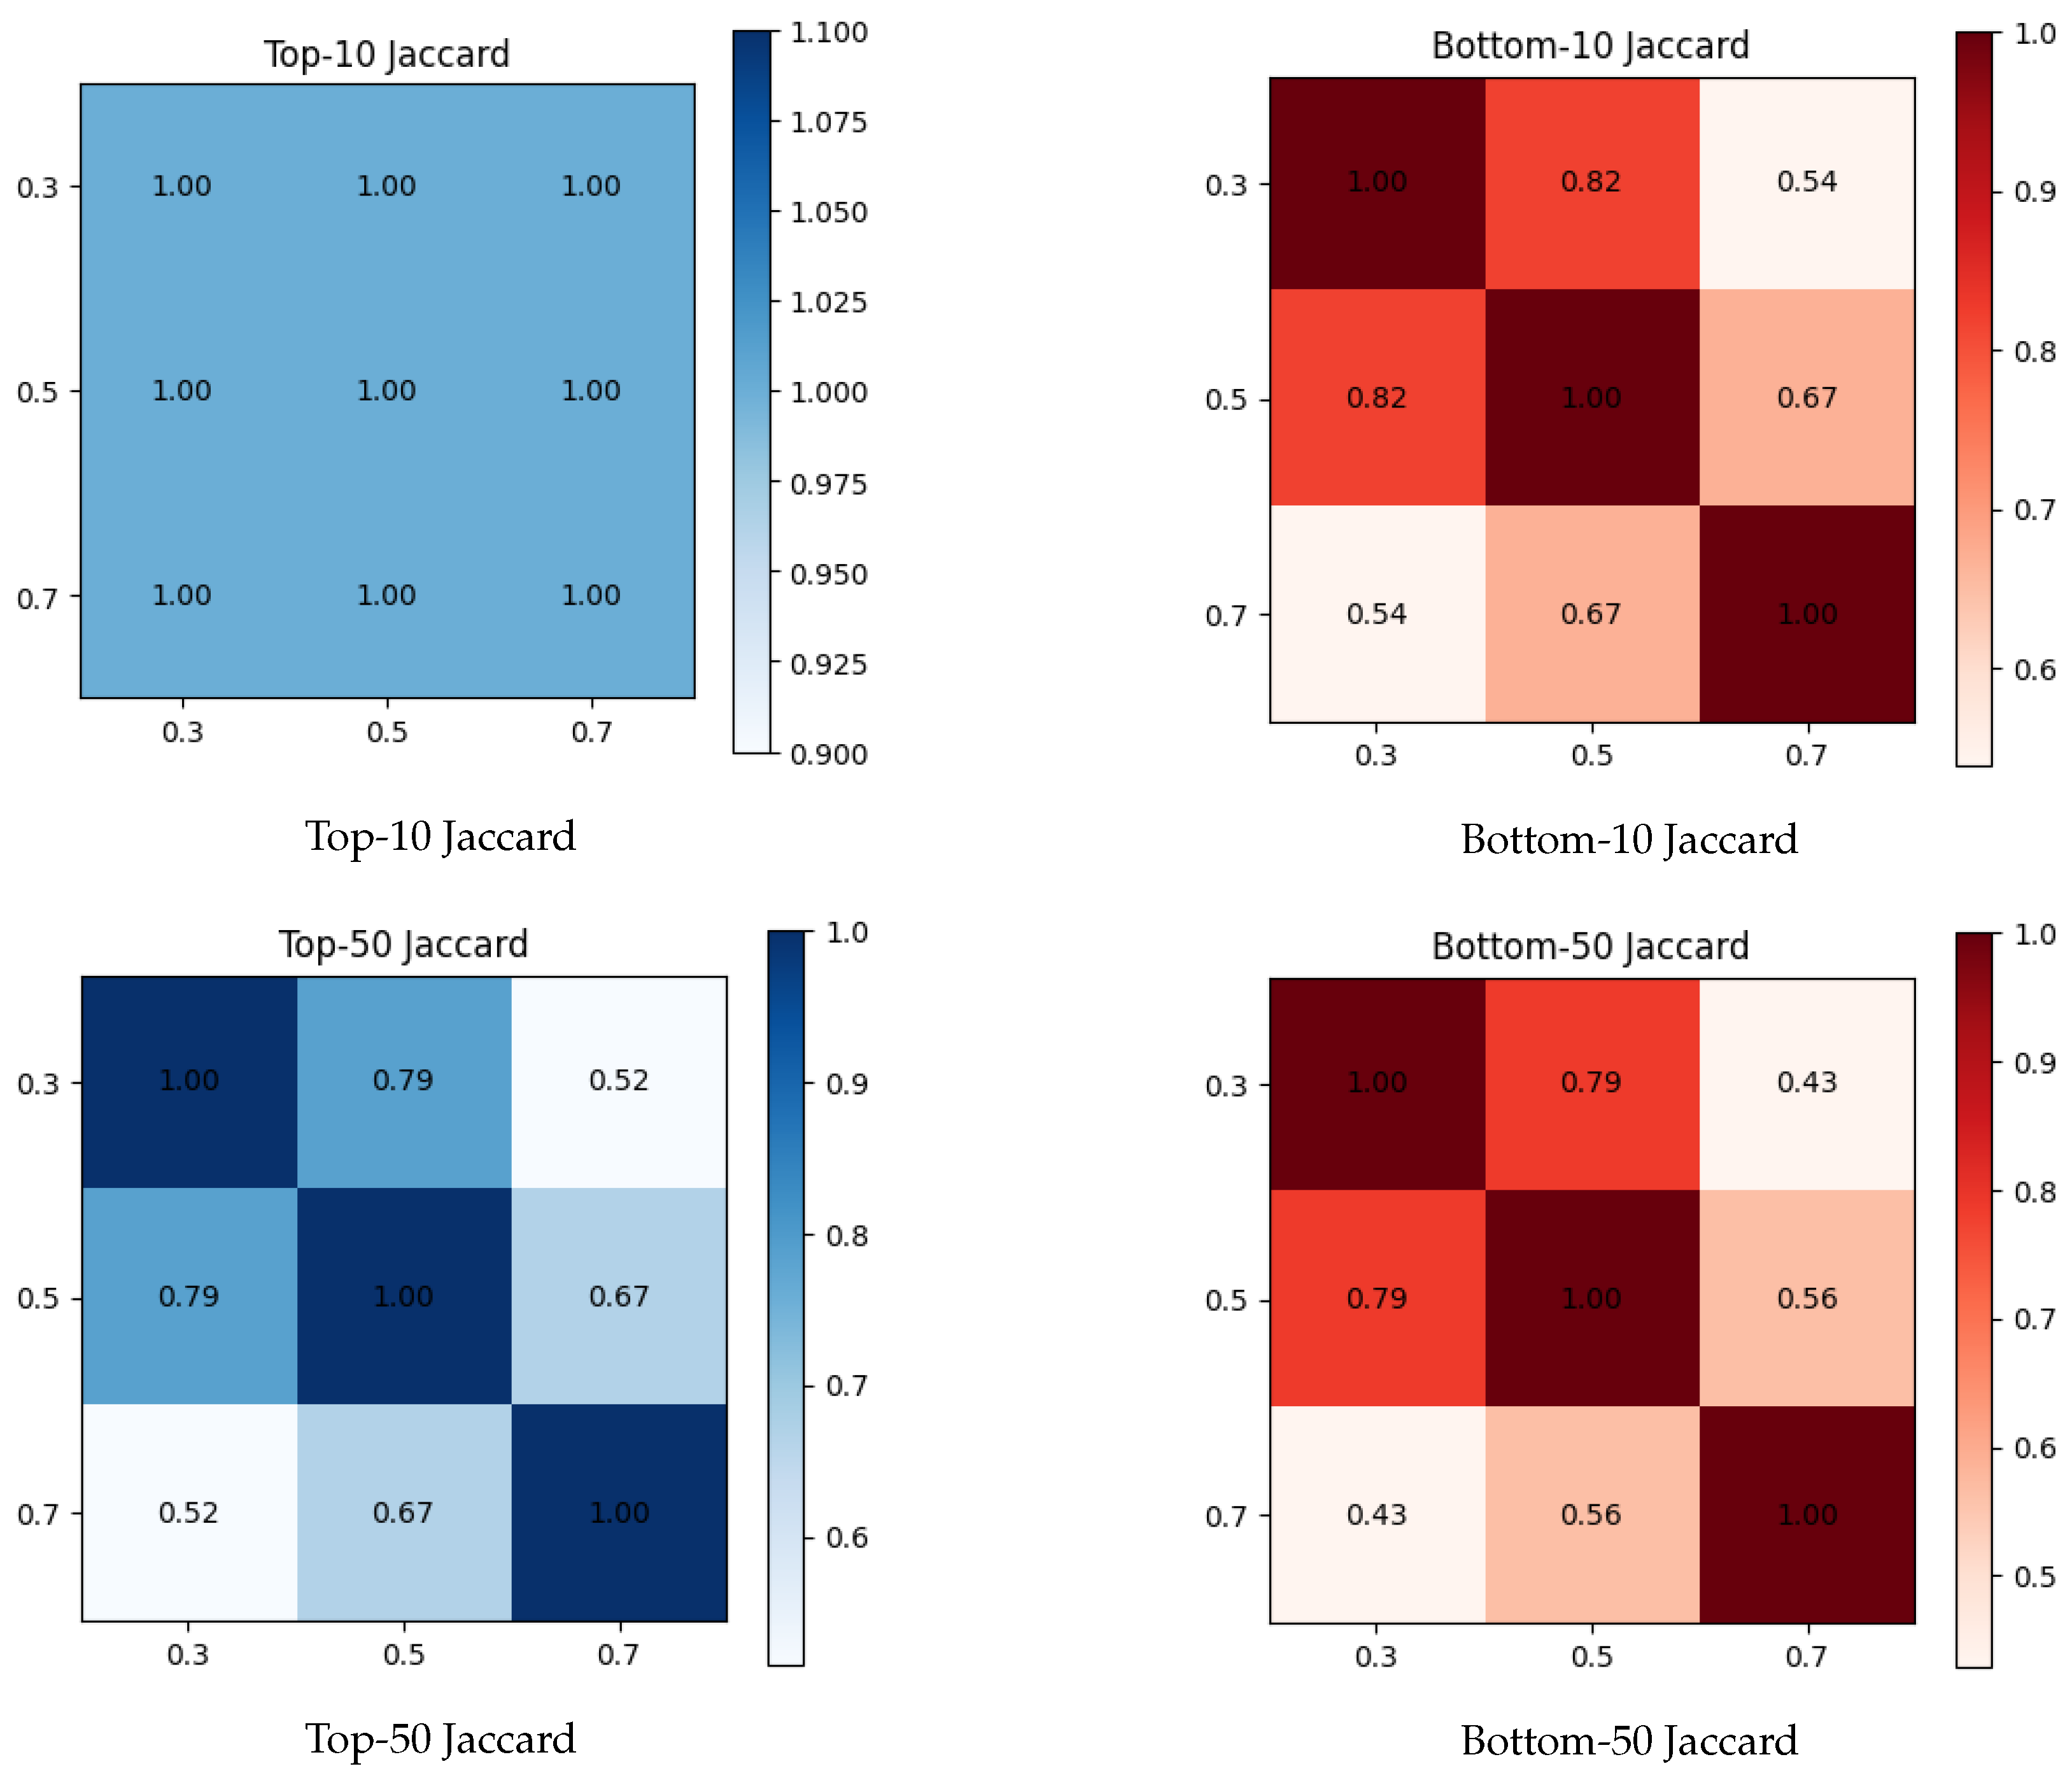
Figure 17 illustrates the overlaps between Top-10/Bottom-10 and Top-50/Bottom-50 lists. The Top-10 facilities remained identical across all
values (Jaccard = 1.00). For the Top-50, the overlap decreased as
diverged (0.79 for 0.3 vs. 0.5; 0.67 for 0.5 vs. 0.7; 0.52 for 0.3 vs. 0.7). Bottom-ranked facilities were more sensitive to weighting changes, with Jaccard dropping to 0.43, reflecting their greater dependence on small variations in ratings and review counts.
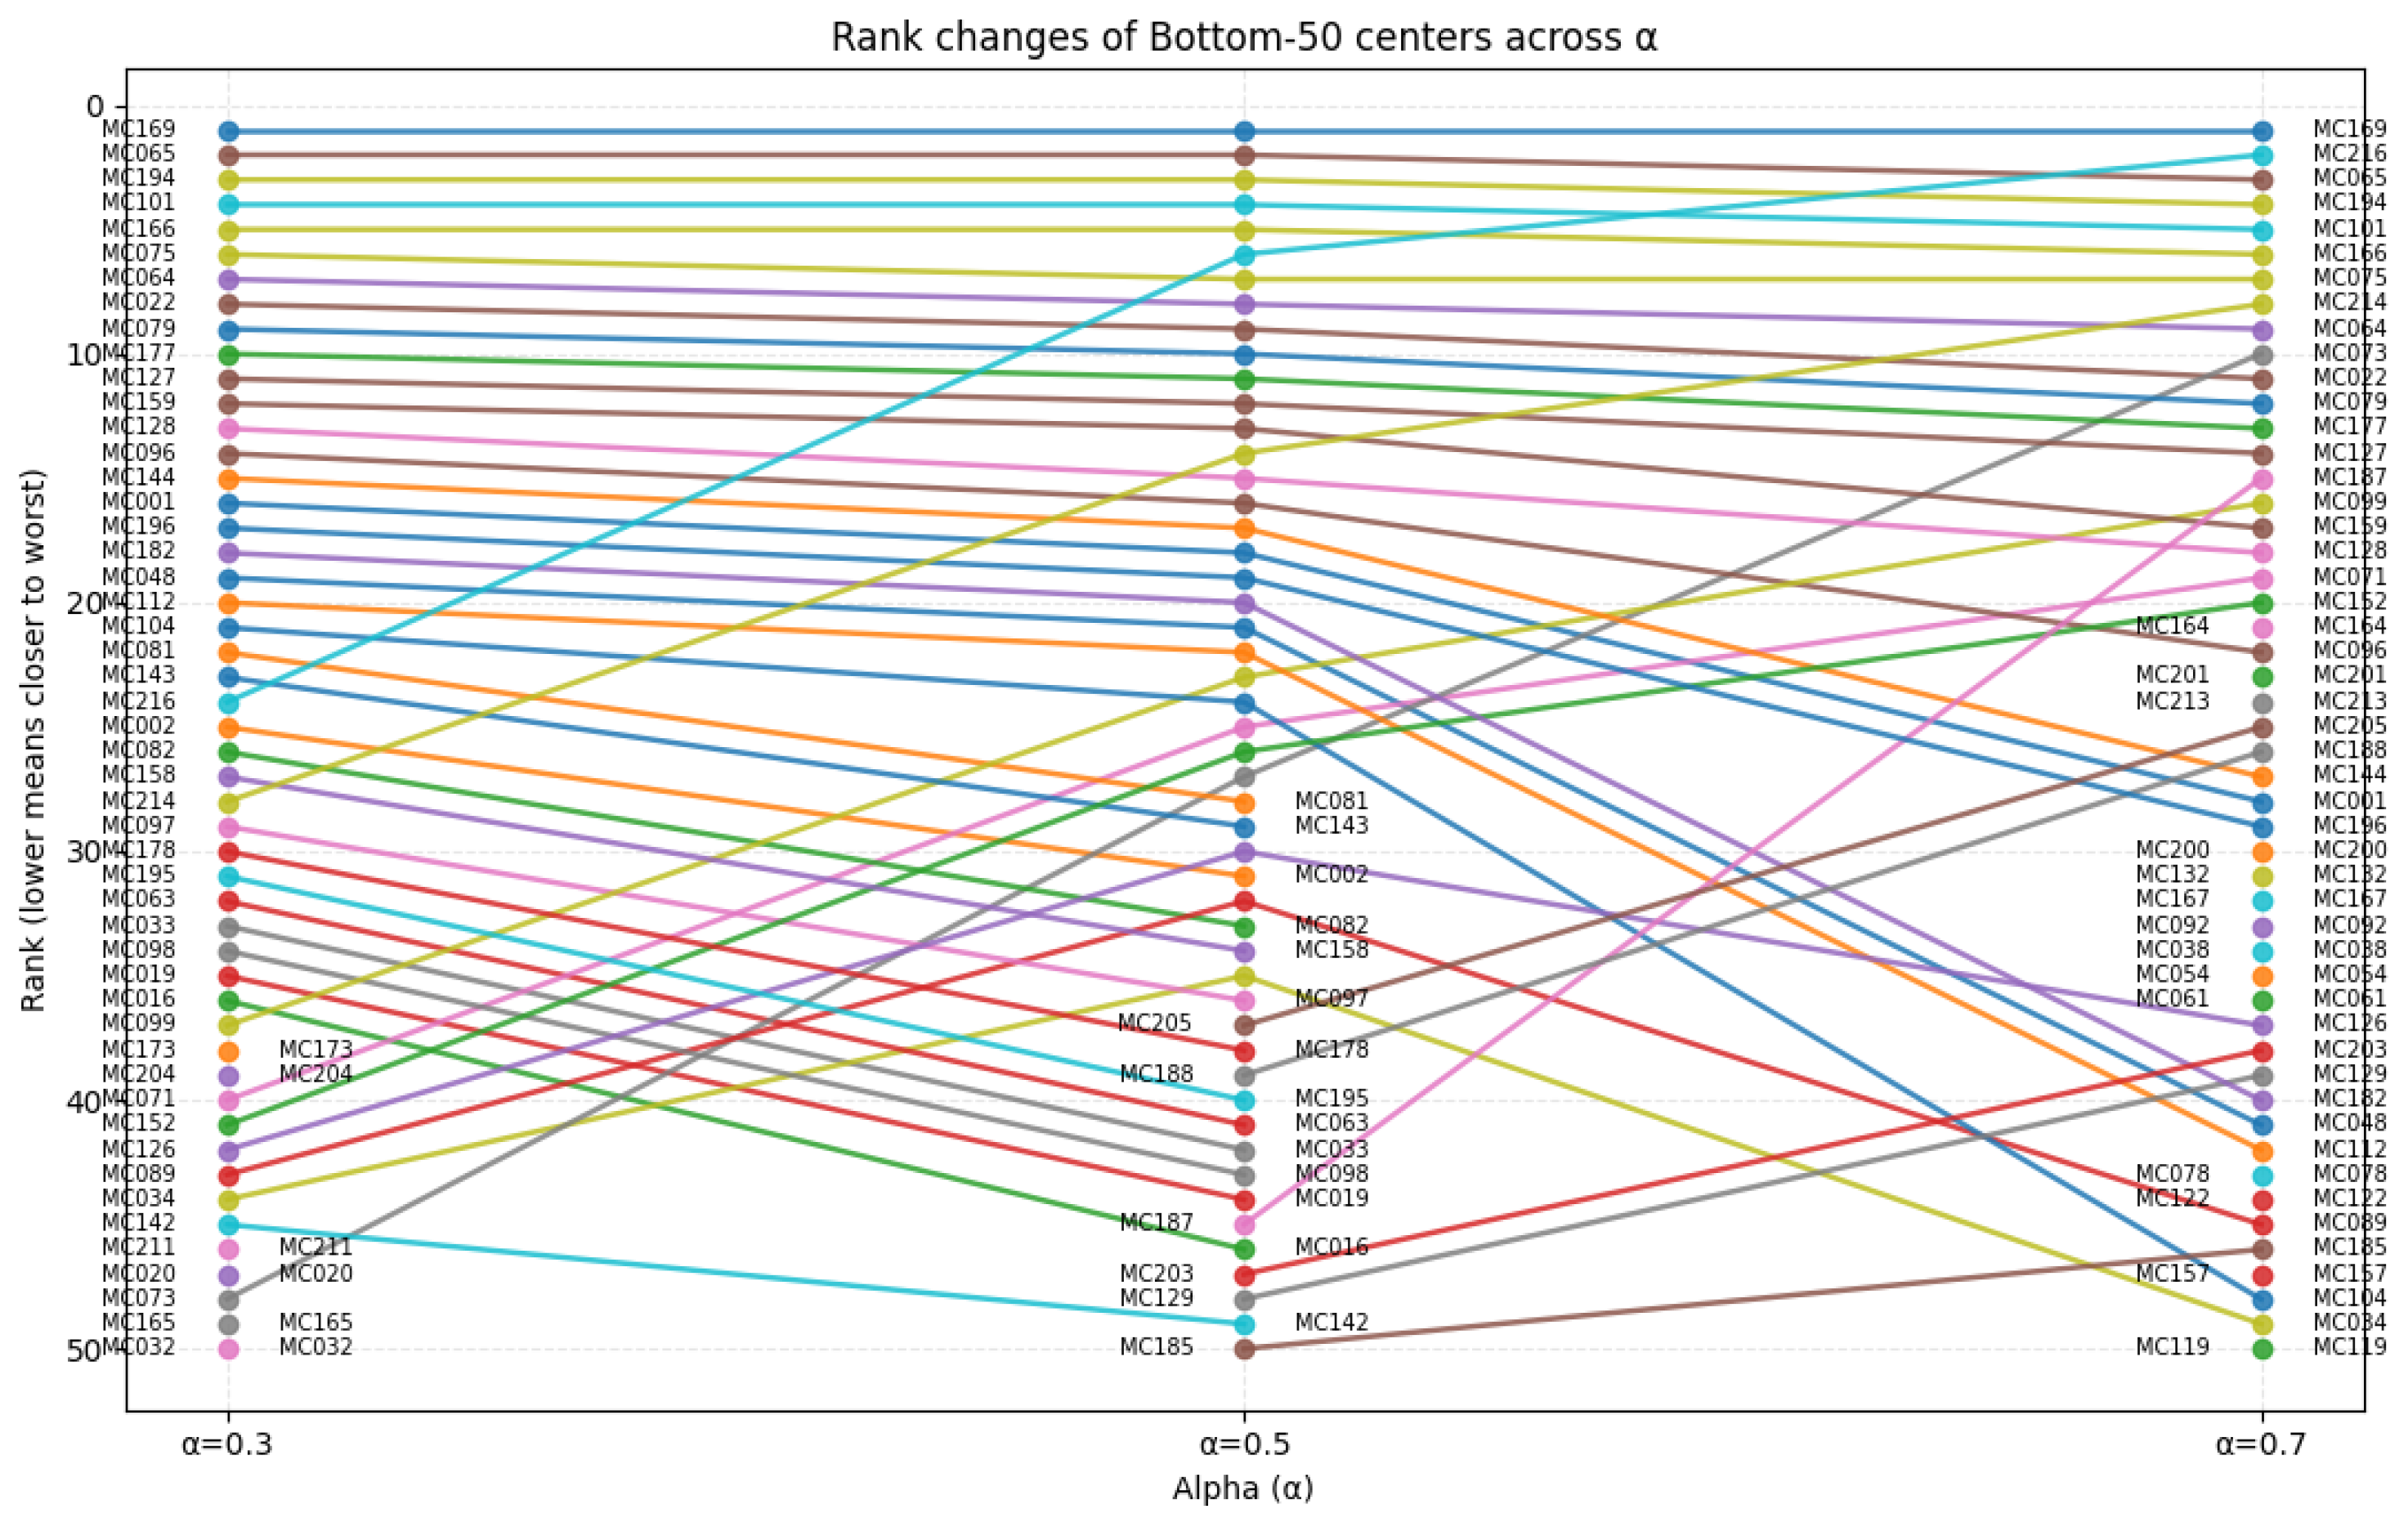
Rank trajectories provide another view of stability.
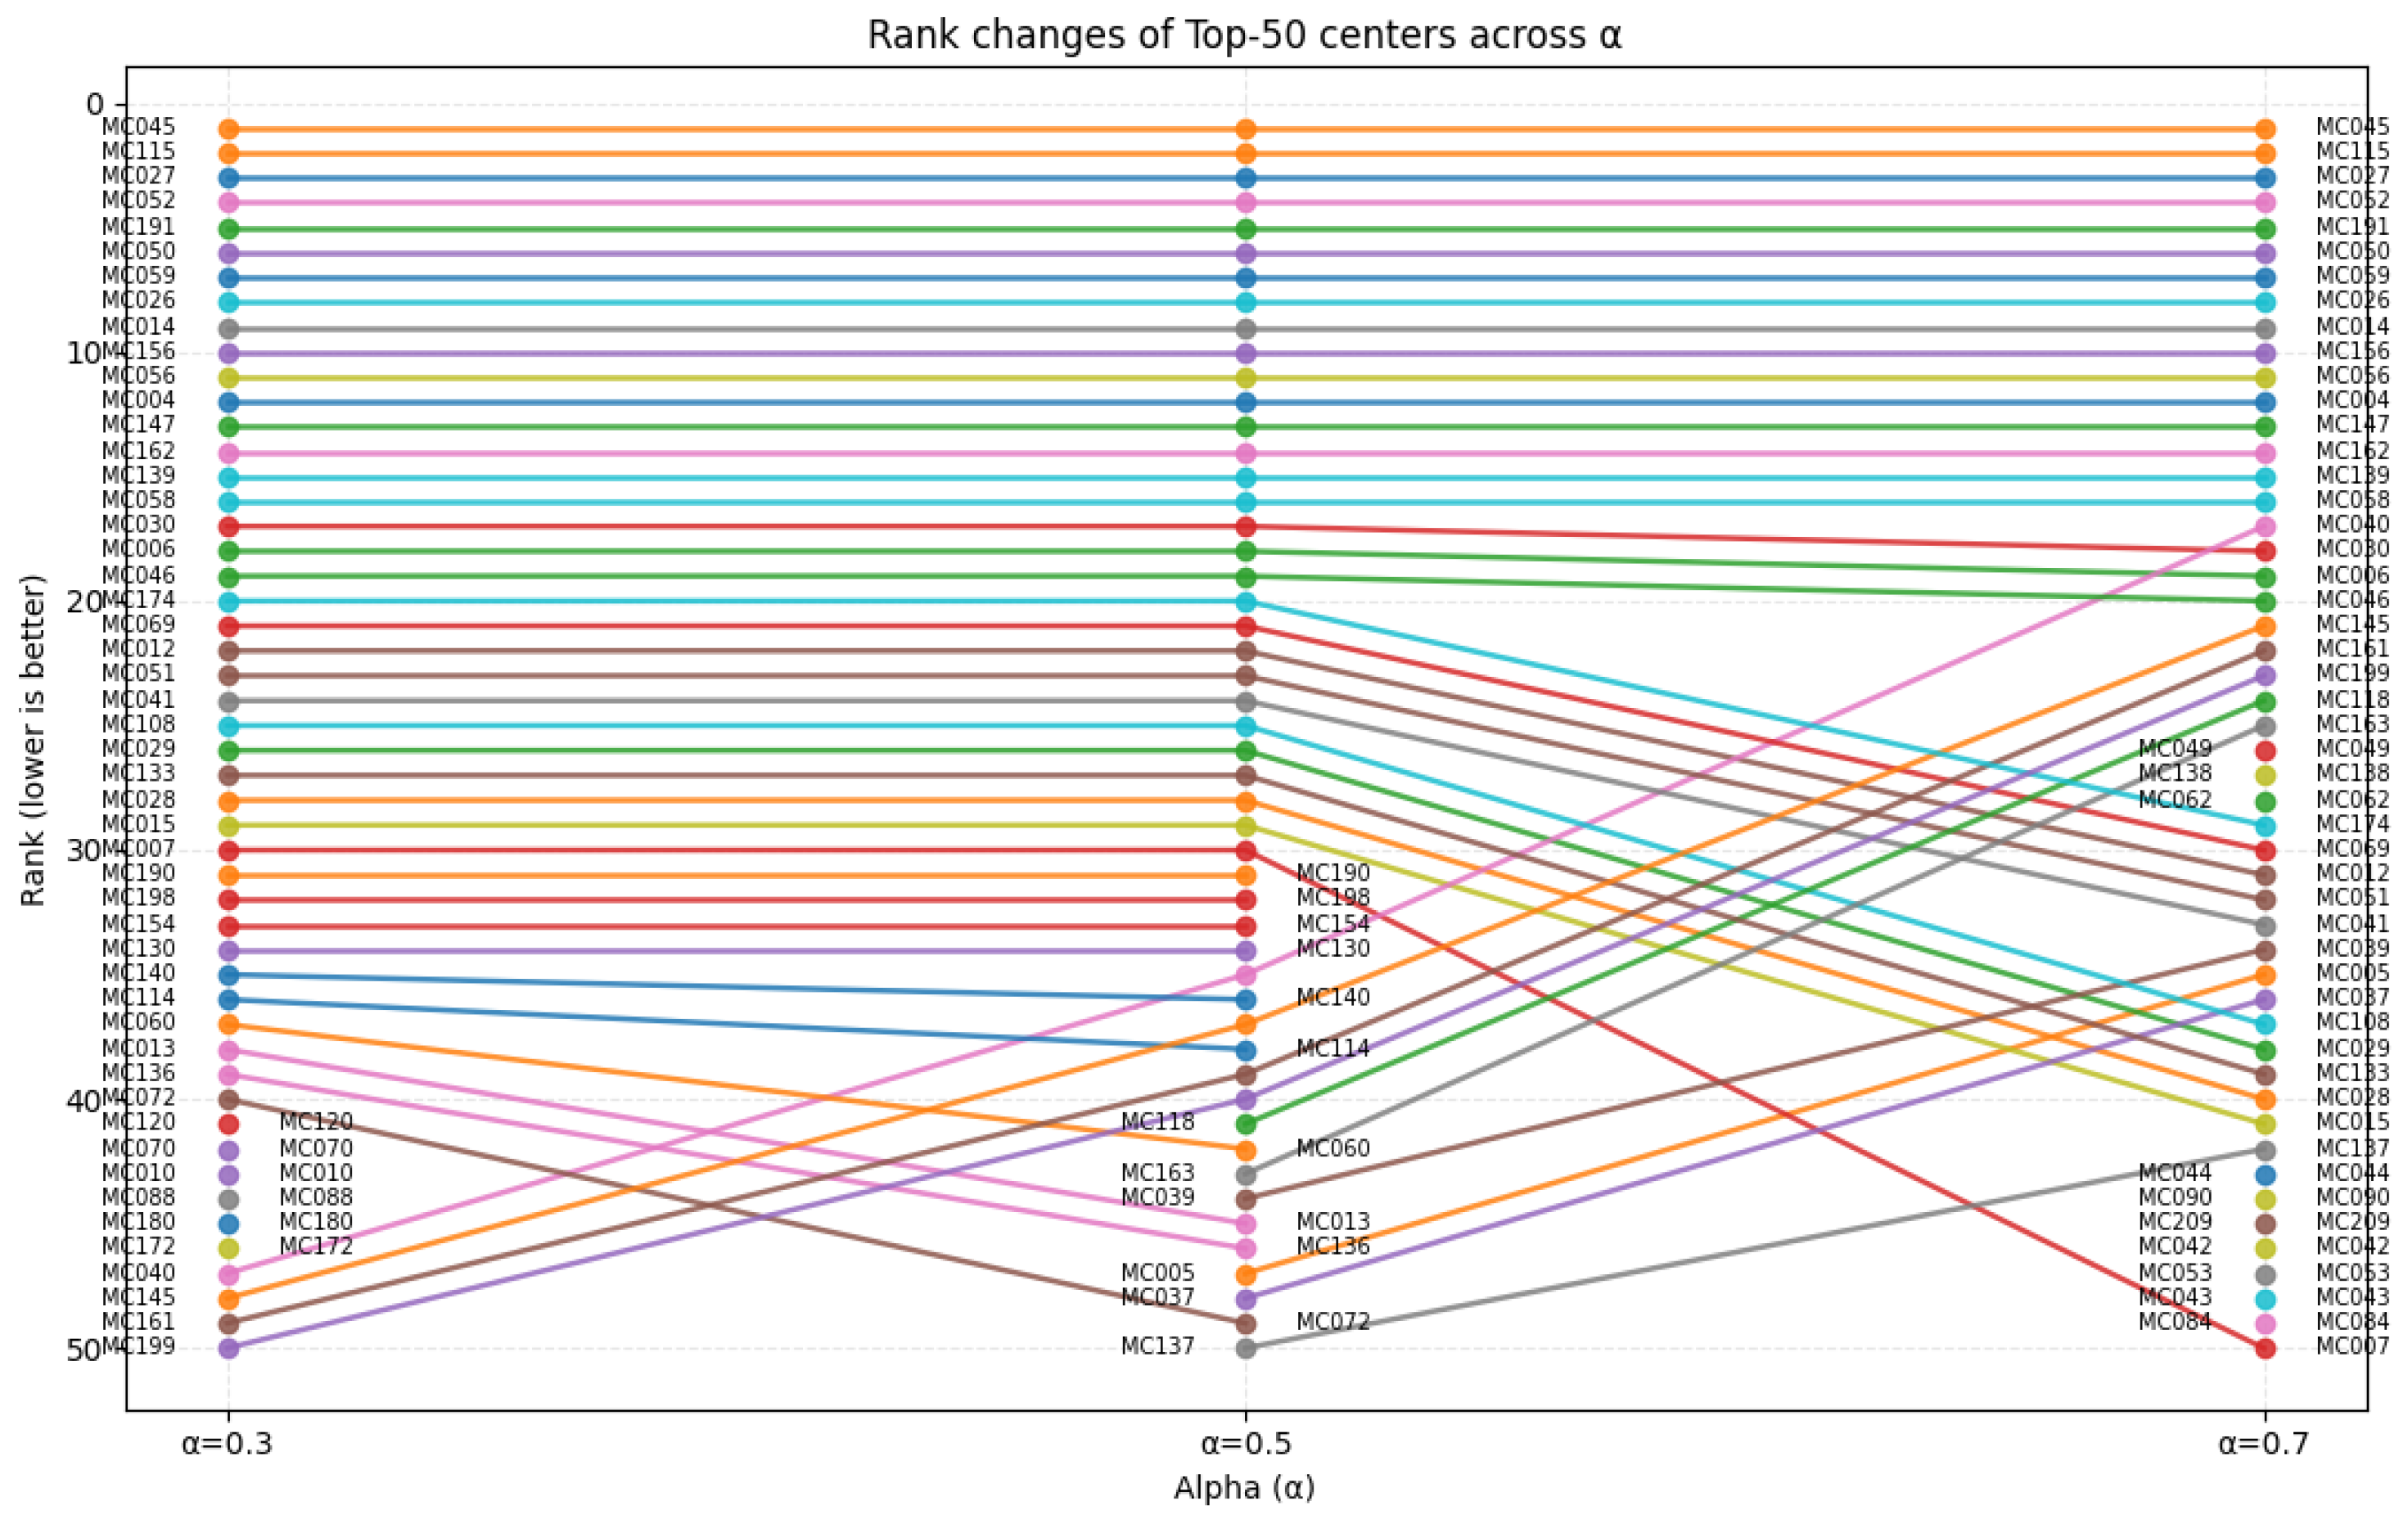
Figure 18 shows that the highest-ranked facilities remain stable across
values, while after the top ranks some facilities show minor changes, and towards the lower end of the Top-50 the variations become more evident. In contrast,
Figure 19 shows greater fluctuation among Bottom-50 facilities, indicating higher sensitivity to weighting.
4.6.3. Spatial Distribution of PSI
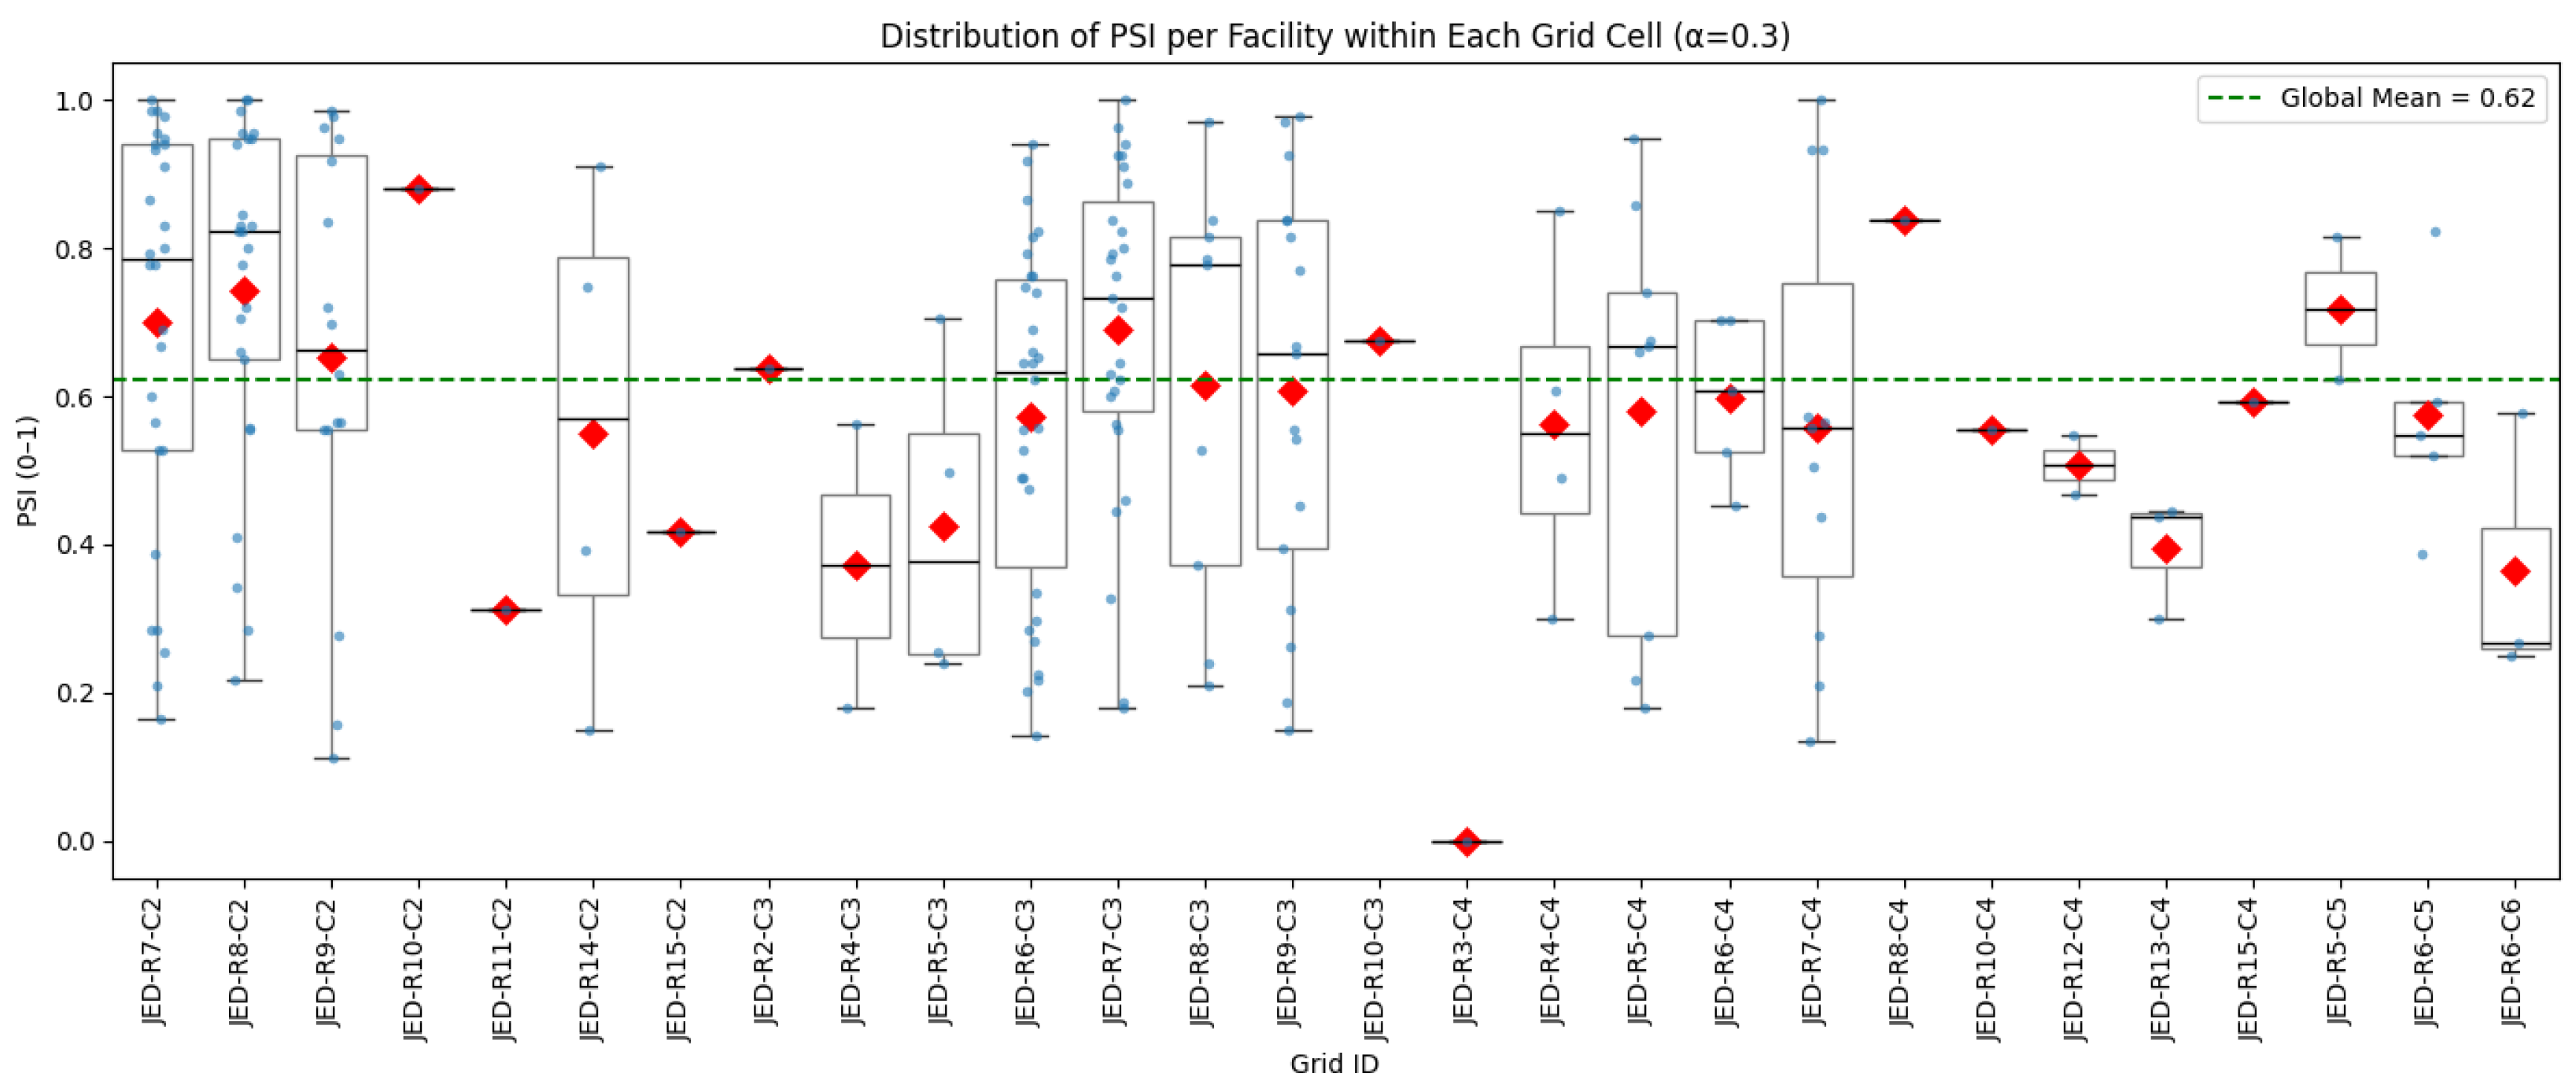
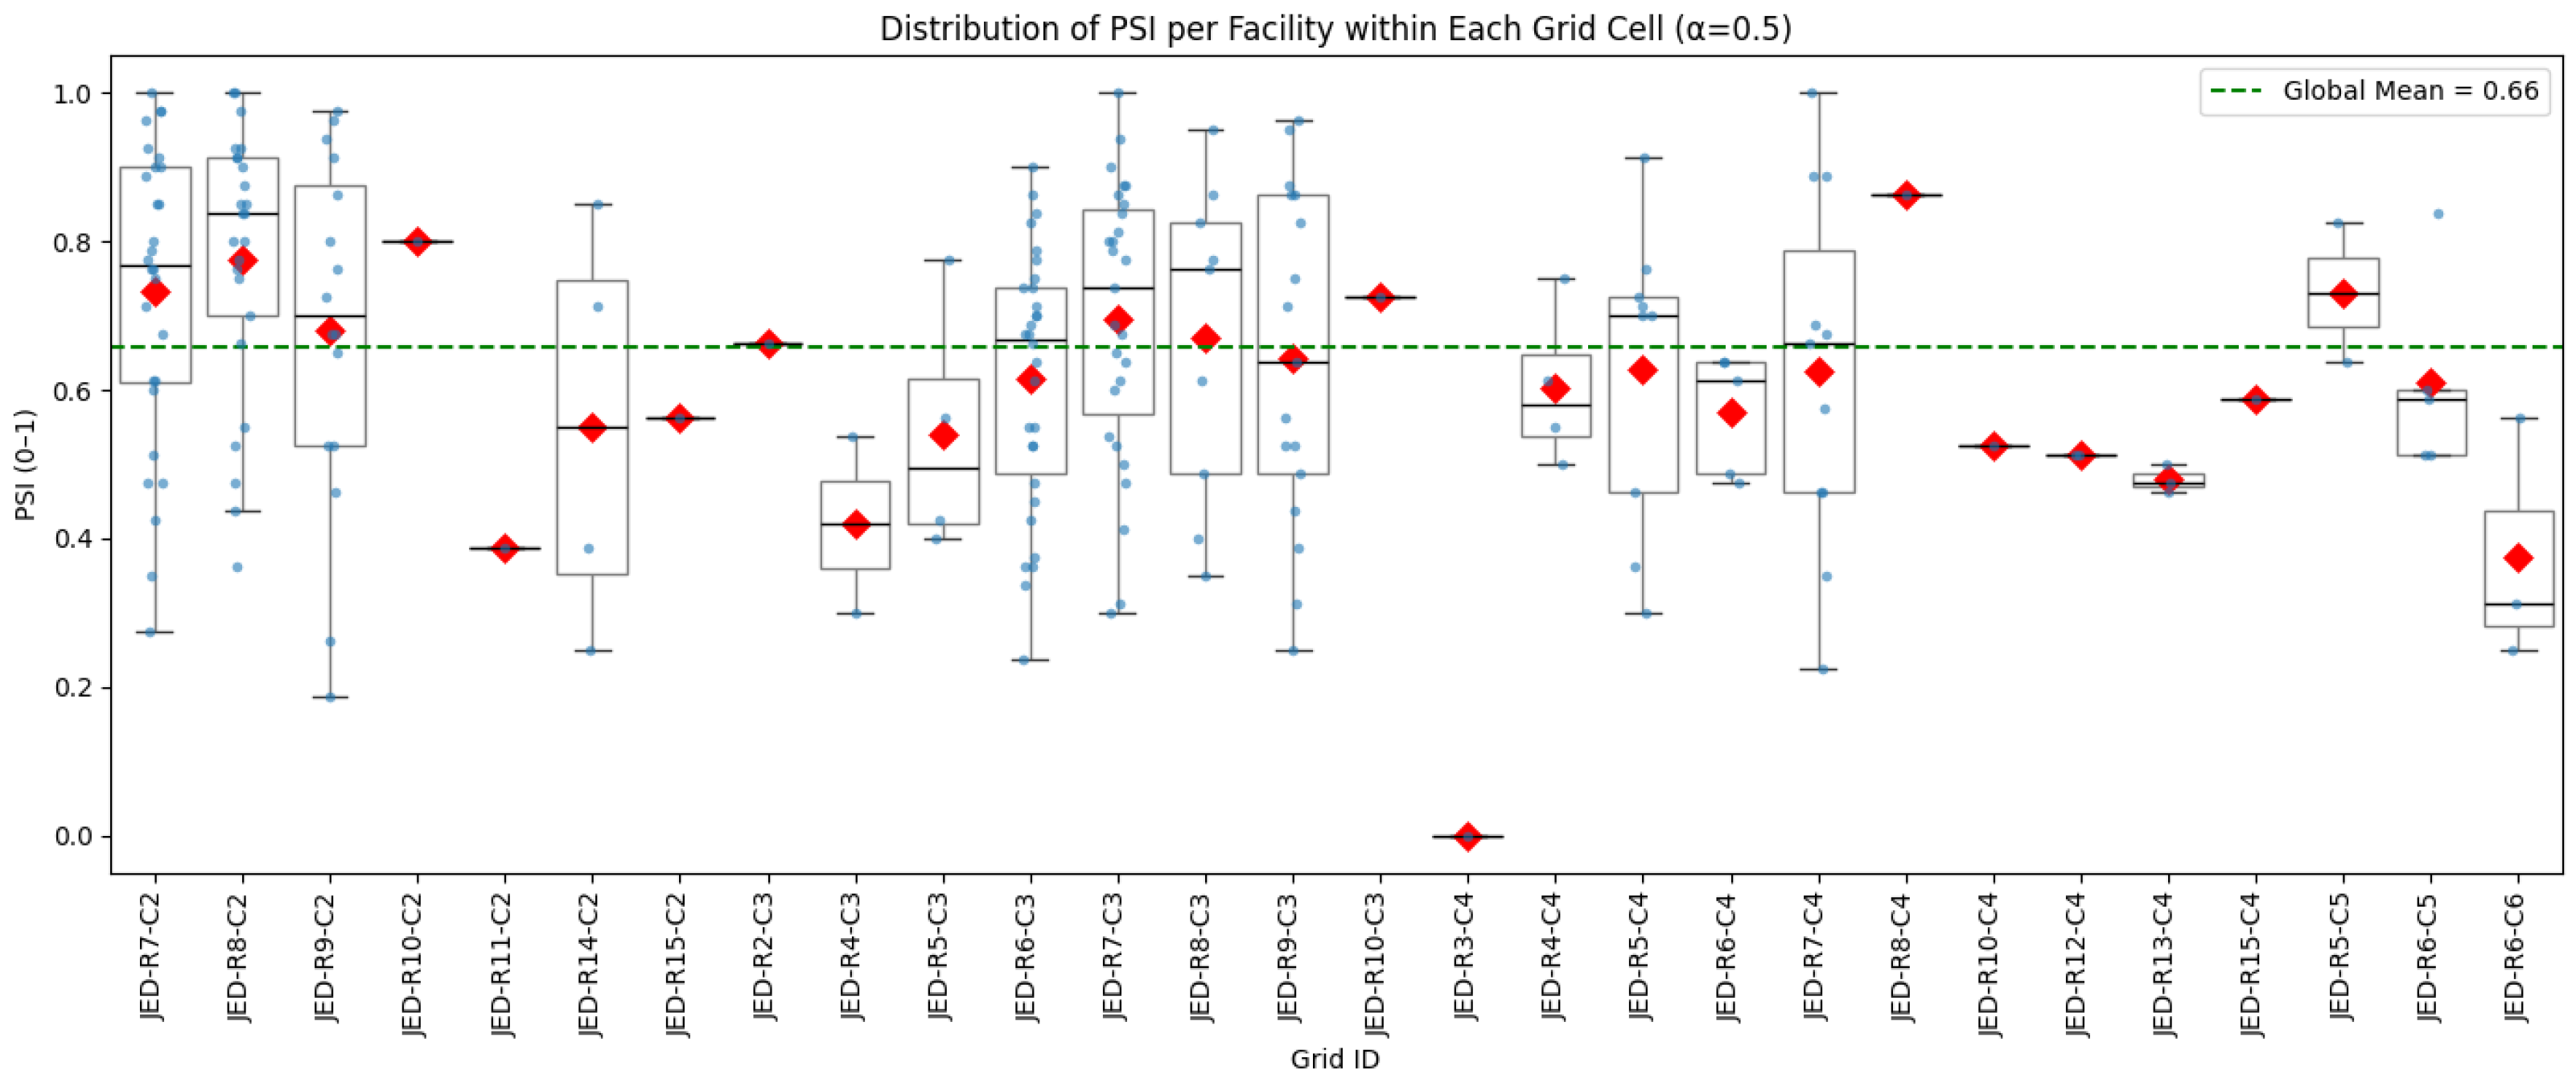
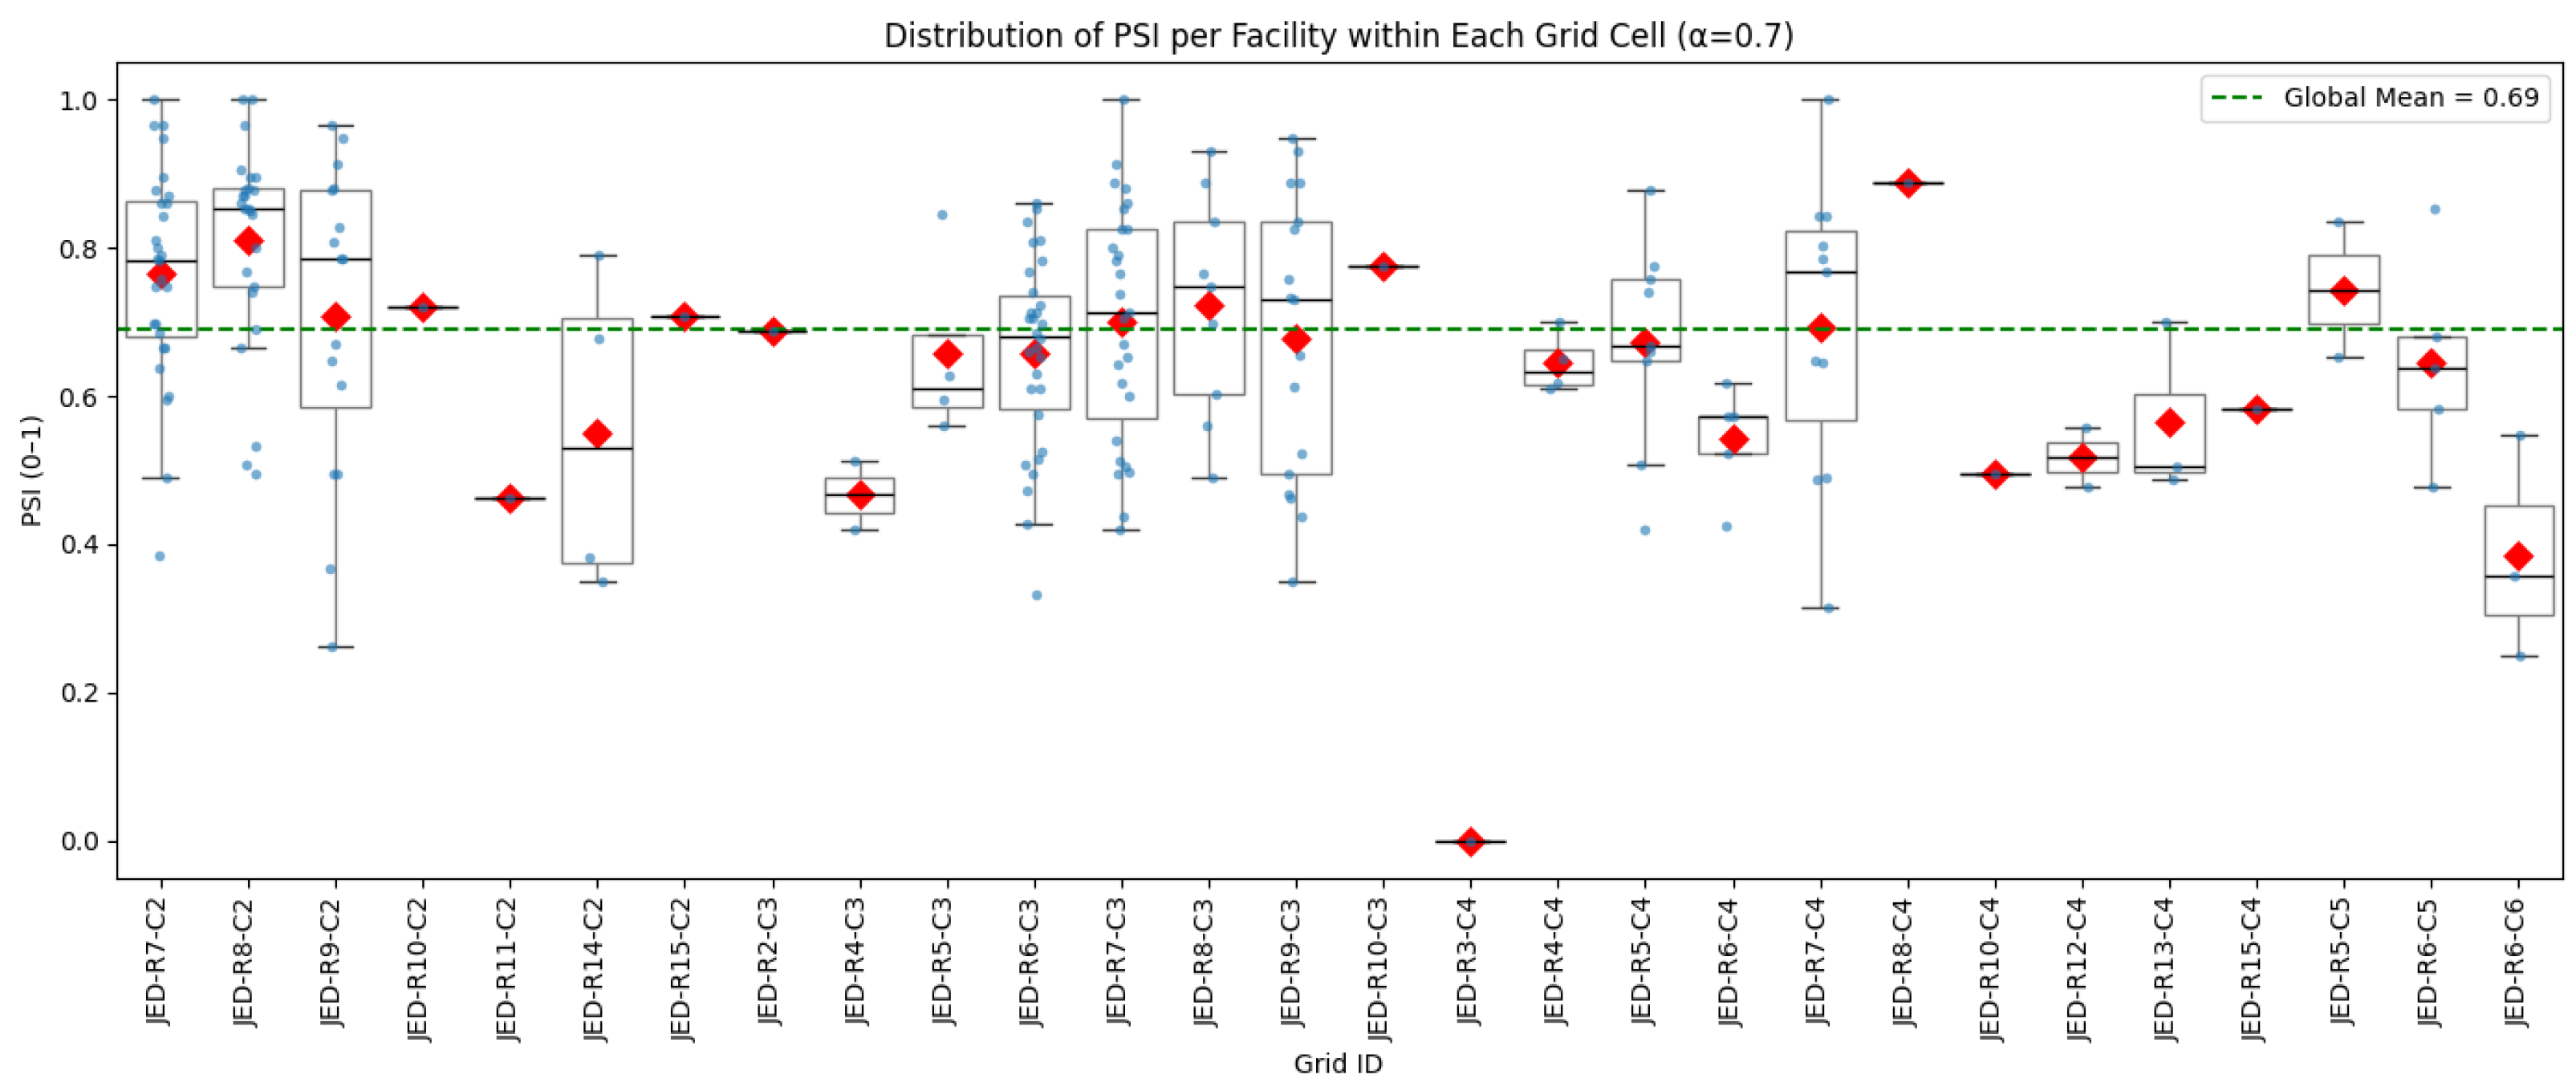
To analyse spatial variation in patient-perceived healthcare quality, PSI values were examined across grid cells. Two complementary views are presented: boxplots showing the distribution of PSI per facility within each grid, and a grid-level map providing an overall spatial perspective of Jeddah.
Figure 20,
Figure 21 and
Figure 22 present boxplots of PSI per facility within each grid cell for
. The blue dots represent the PSI values of individual facilities. The red diamonds denote cell means, and the dashed green line marks the global mean. Only populated grid cells containing at least one evaluated facility are shown. The global mean increases gradually from 0.62 (
) to 0.66 (
) and 0.69 (
).
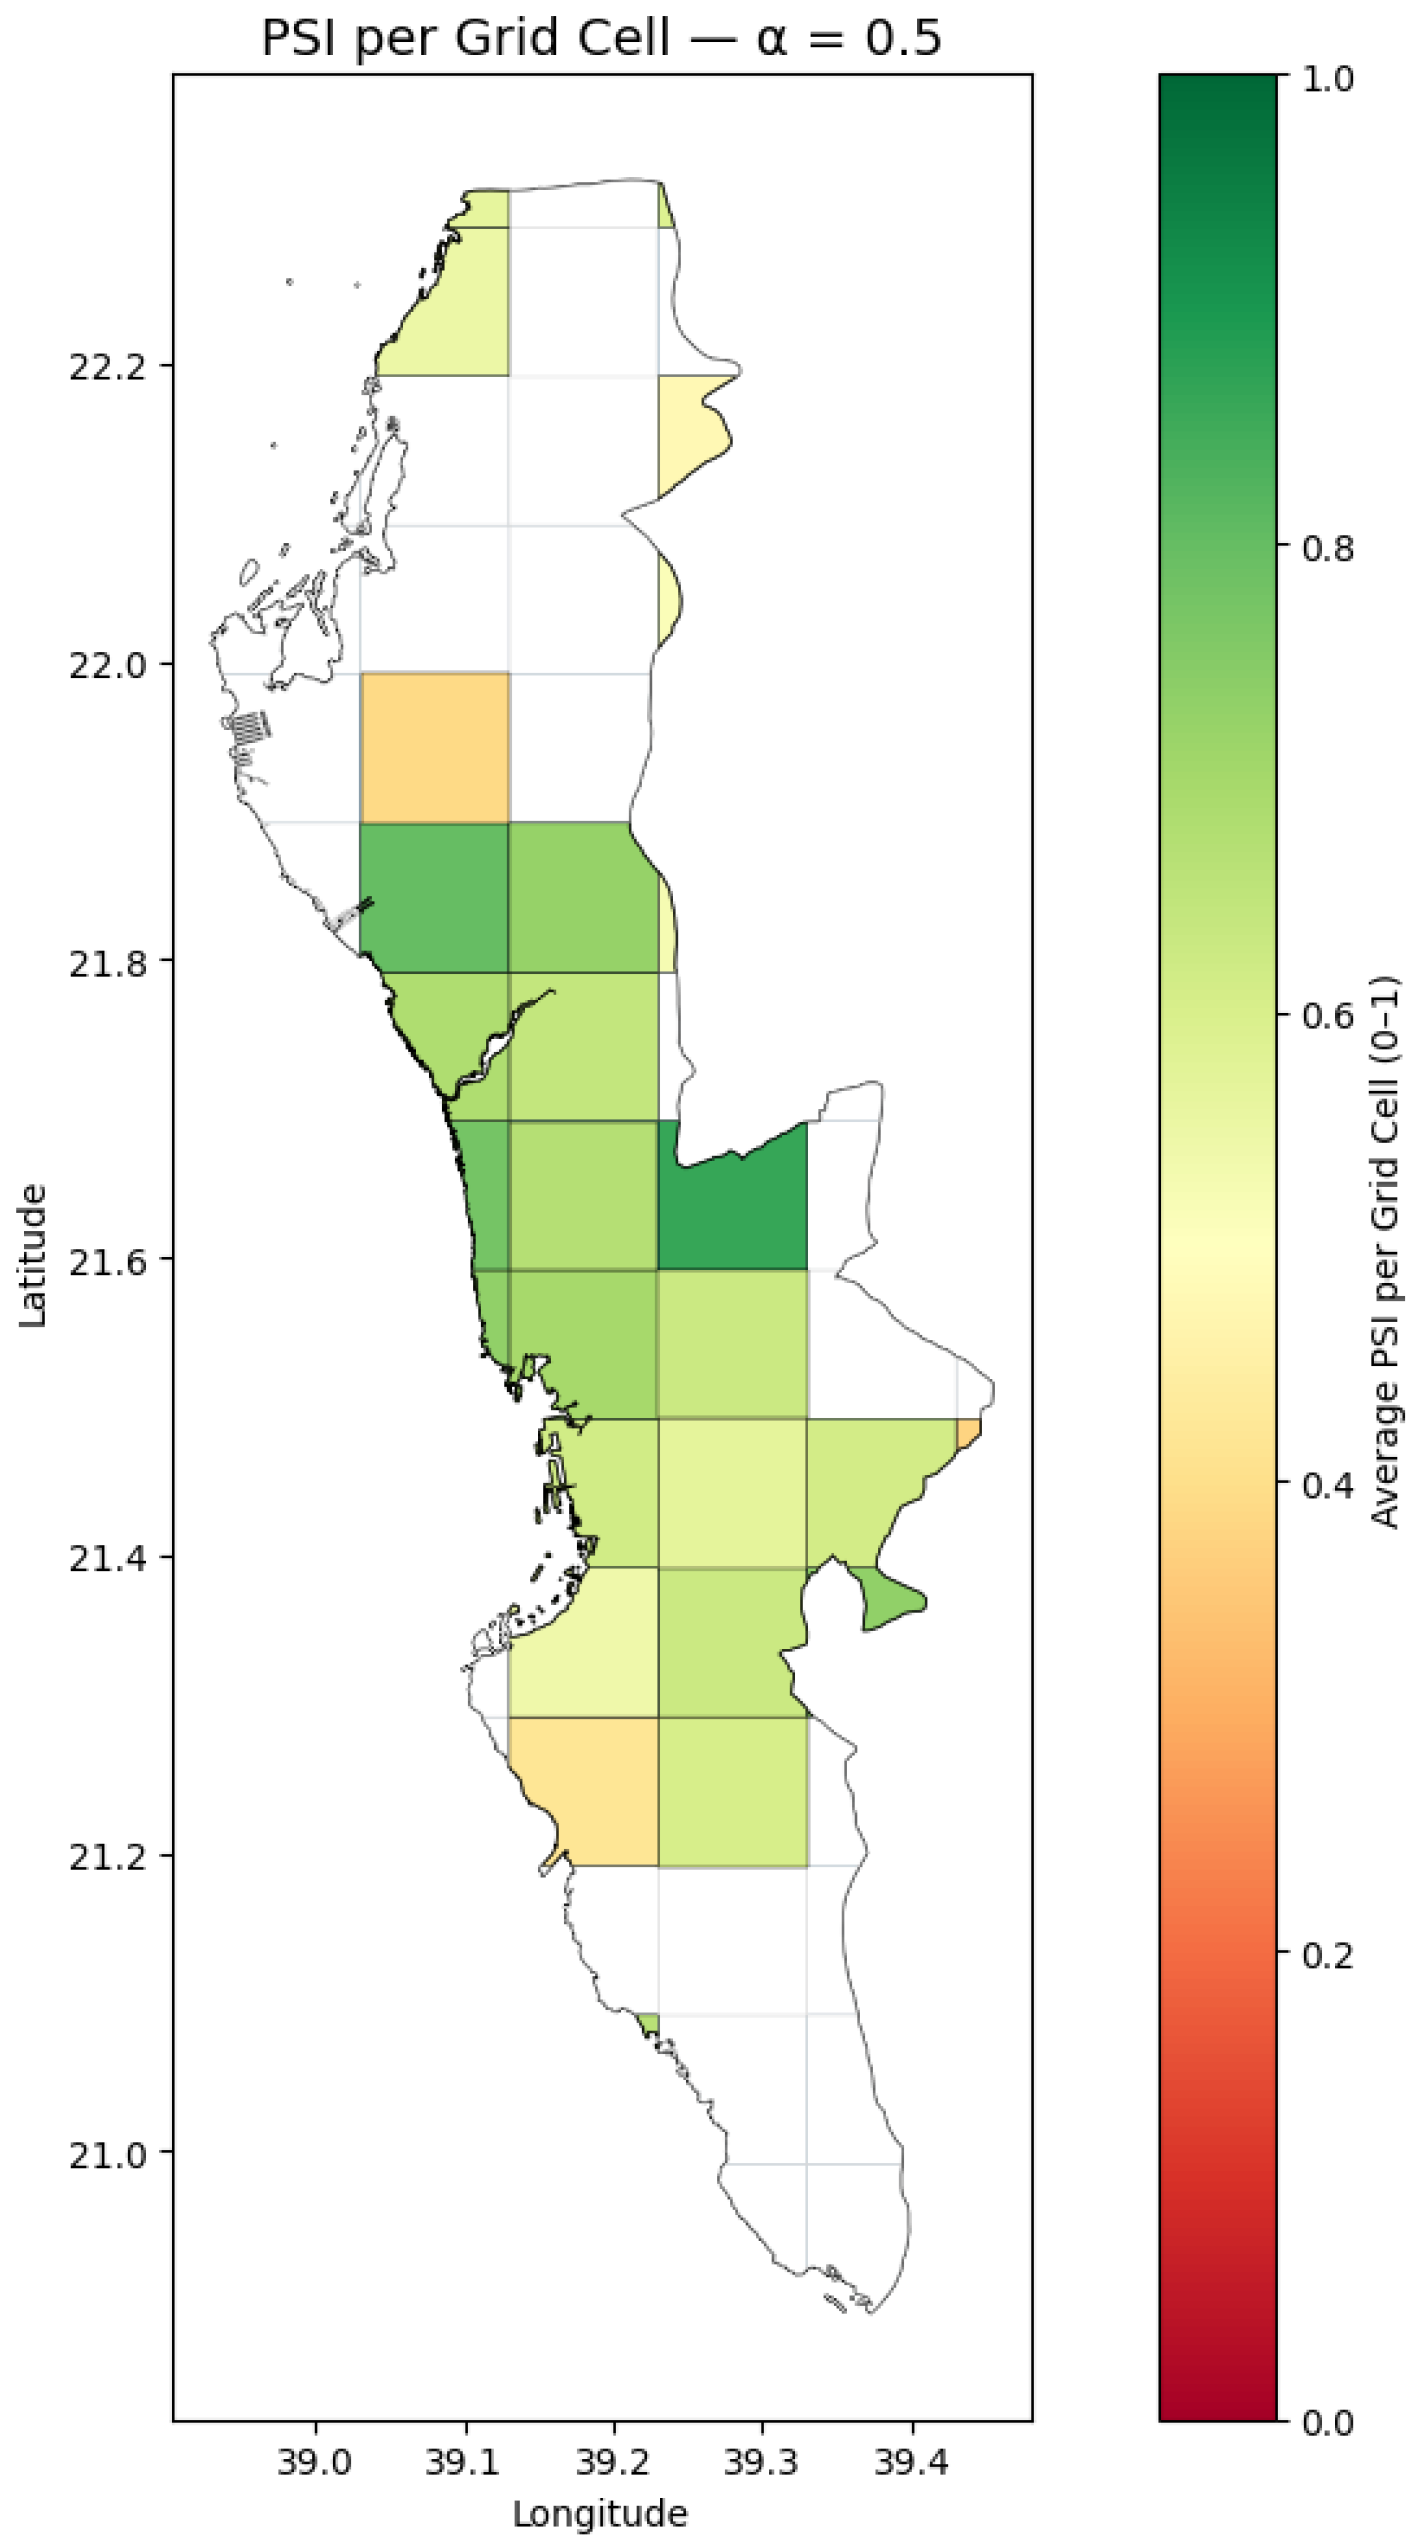
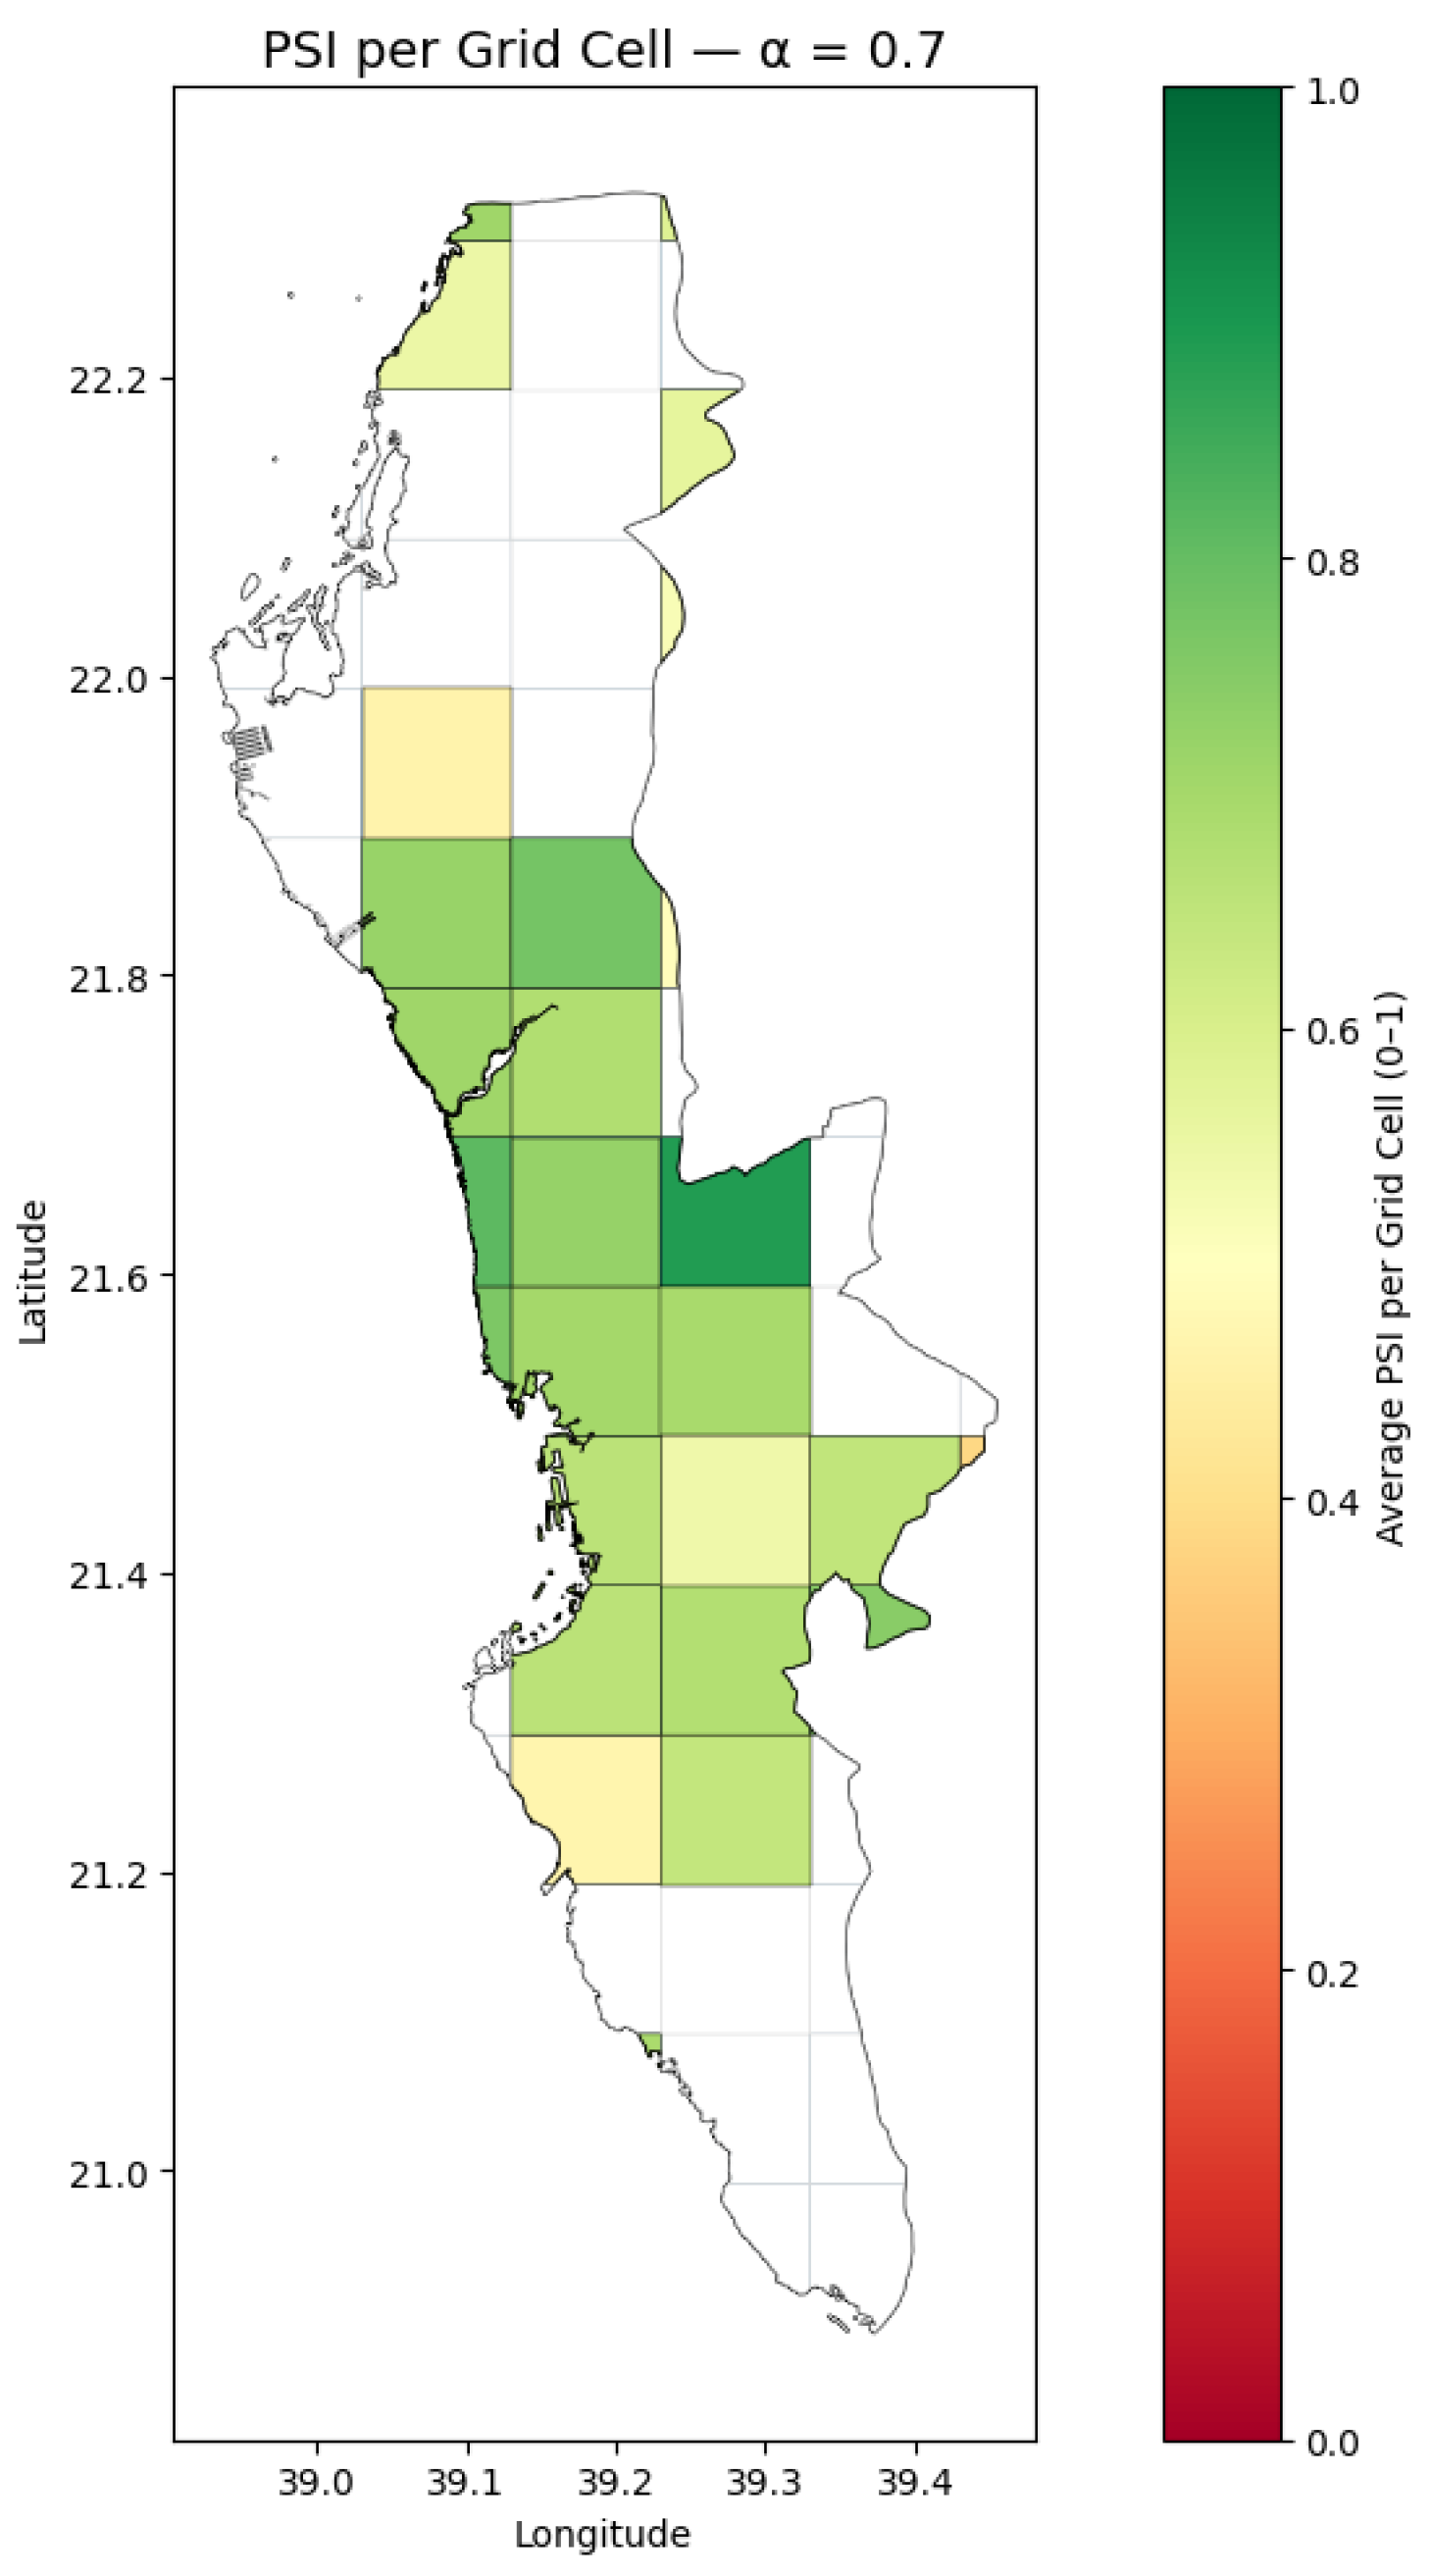
To provide a spatial overview,
Figure 23 shows the grid-level PSI distribution for
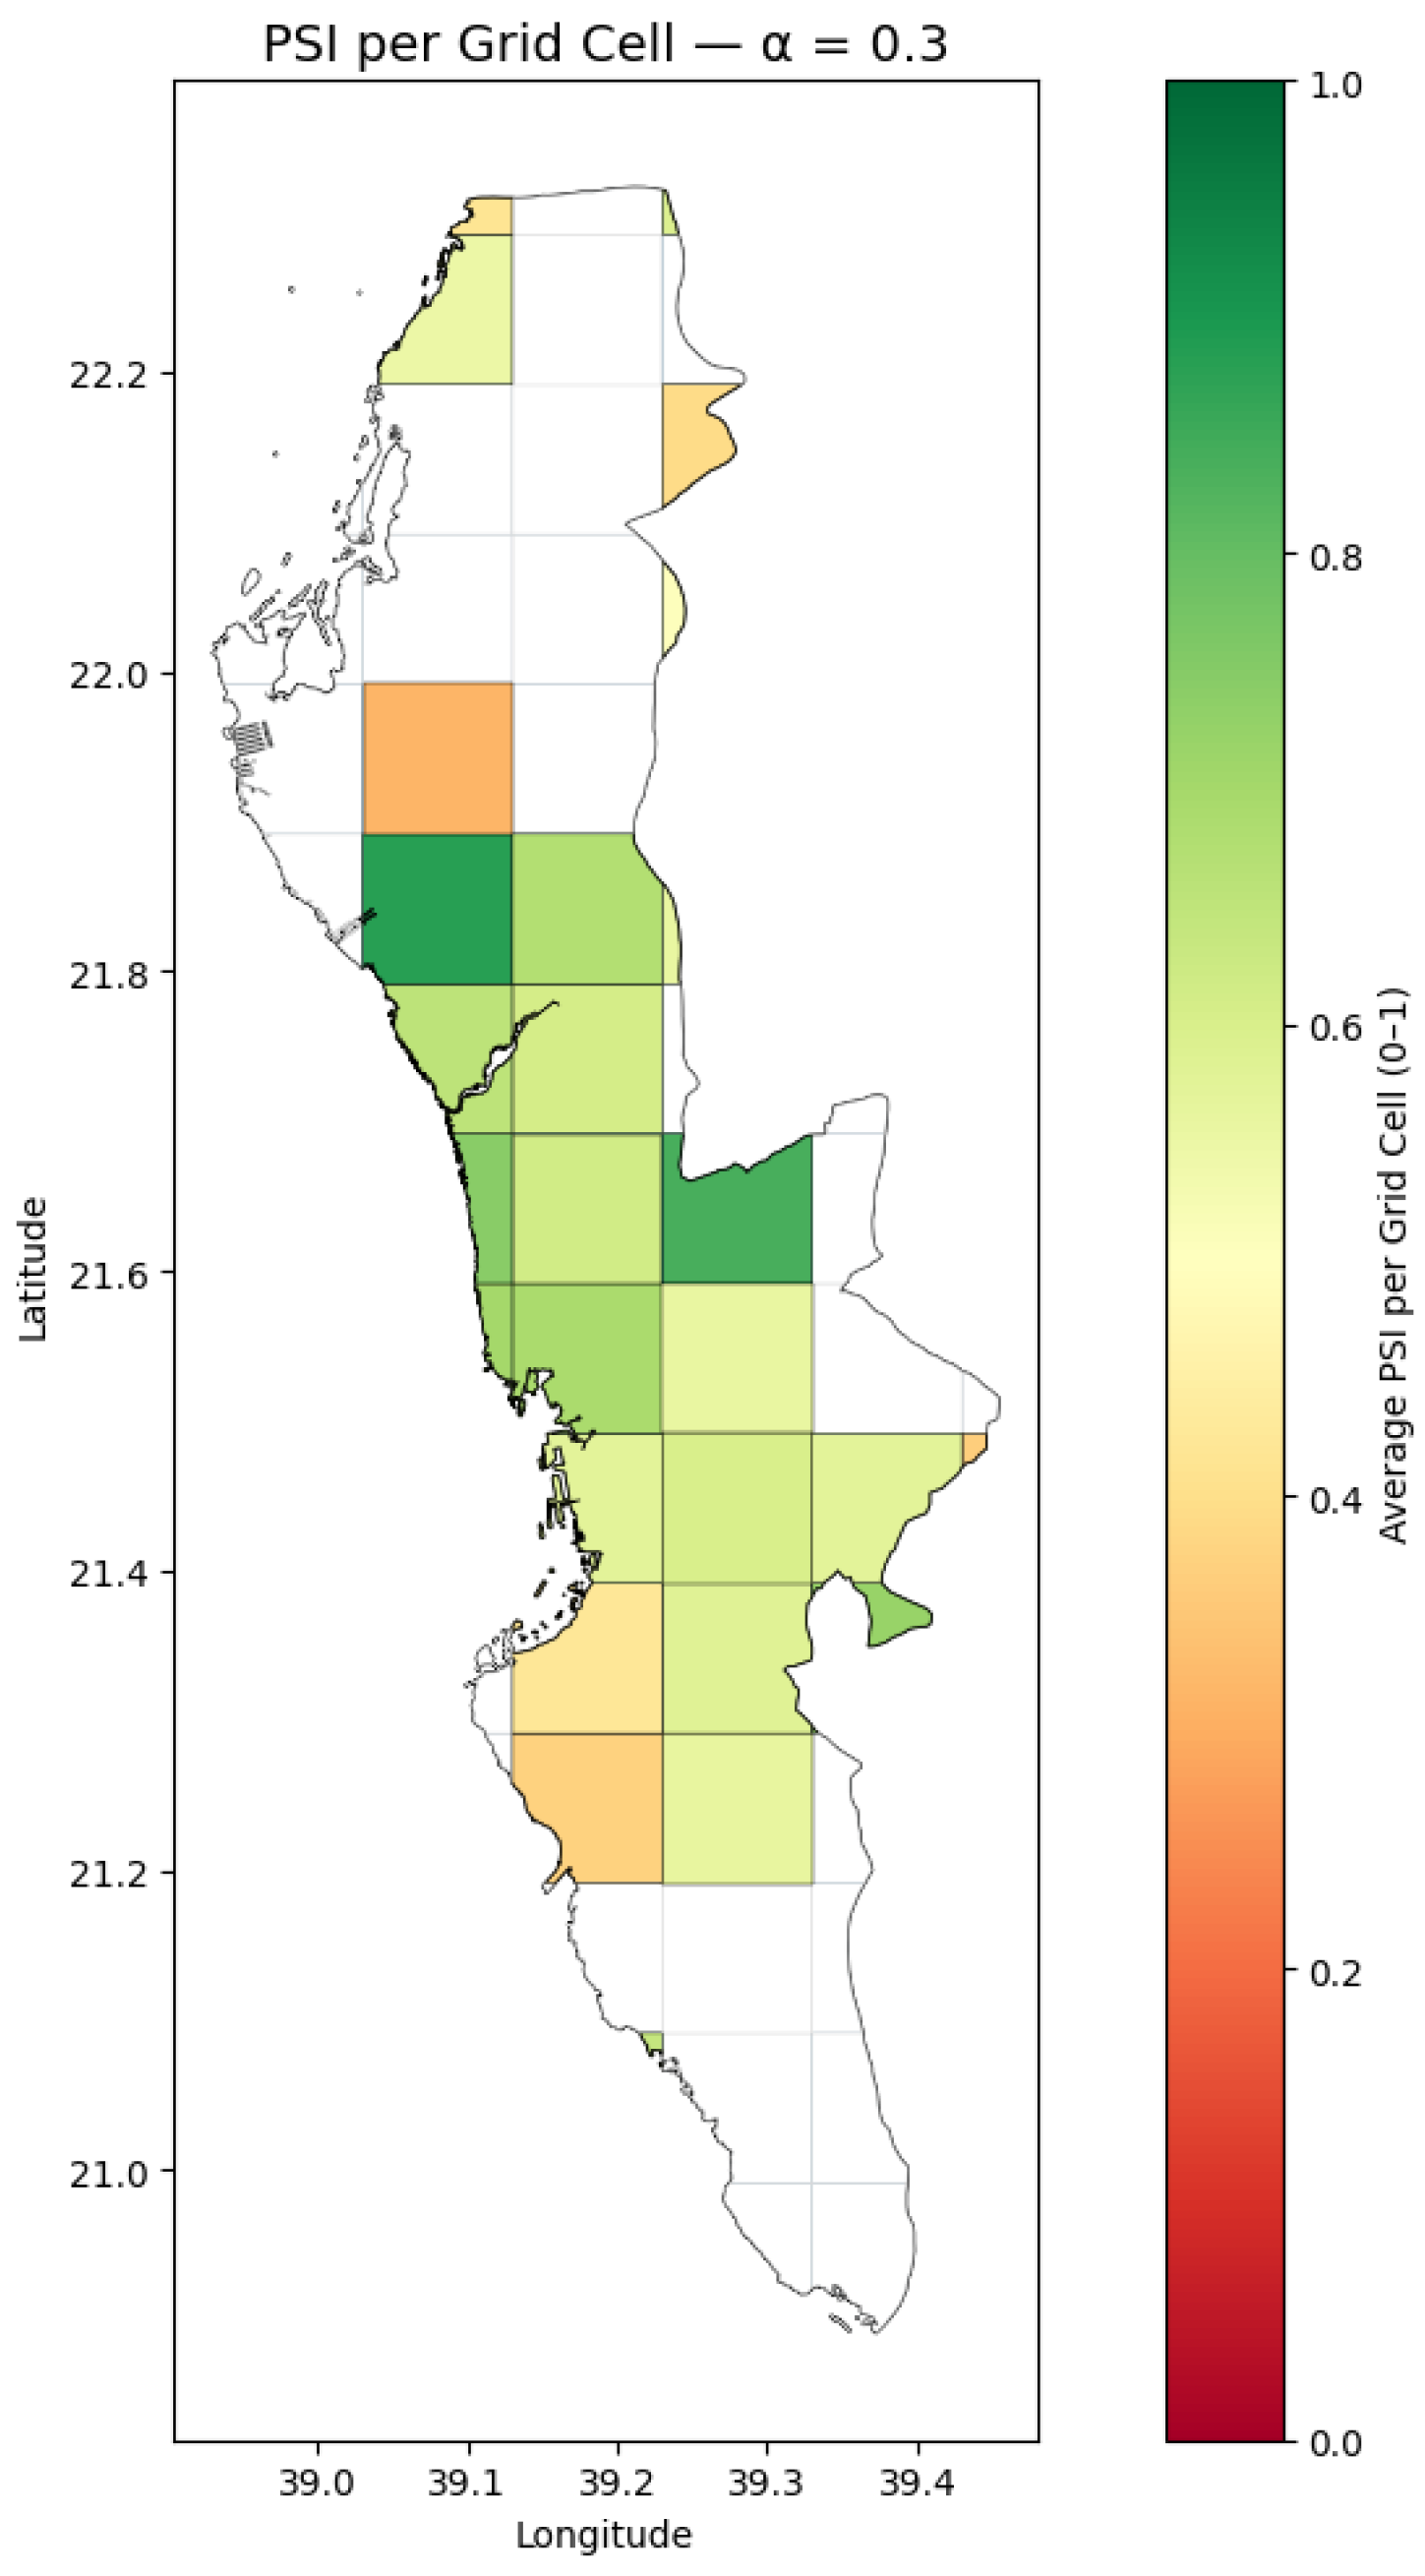
. Results for
and
showed similar patterns and are provided in
Appendix D. The map highlights consistently higher PSI scores in central and coastal areas, while peripheral grids show lower values. Cells without any evaluated facilities were excluded from the analysis to avoid bias from empty values.
5. Discussion and Limitations
The results show that the grid-based method proved effective in collecting and linking healthcare facility data across Jeddah. The city was divided into 55 grid cells that covered the full area and ensured clear and systematic data organisation. After removing duplicate entries, 295 unique facilities were identified, and 216 of them had user reviews suitable for analysis.
Most facilities were located along the central and coastal areas of the city, while outer areas had fewer or no services. This shows that central parts of Jeddah are better served than the edges. In terms of quality, most ratings and reviews were positive, which means that users generally expressed satisfaction. When these two measures were combined in the Patient Satisfaction Index (PSI), the highest-ranked facilities stayed the same even when the weighting changed, showing stable top results. The lowest-ranked facilities, however, were more sensitive to small changes.
Within the scope of the current analysis, GeoJed is used primarily as an automated framework for spatial data collection and organisation rather than a full demand–supply accessibility model. Accordingly, the absence of population-based indicators (e.g., per-capita availability or population density) constitutes a limitation of the current analysis and should be addressed in future extensions.
The reliance on Google Maps data may introduce biases related to user activity levels and commercial visibility, which can affect the representativeness of reviews across different areas.
Building on this, the main contribution of this study is the automated system for collecting data. The method turns a city boundary into cells and uses the centre of each cell as a search point. This design solves the API result limits and makes it easy to repeat the process for other cities or at later times. The same method can also be used to collect other kinds of urban data, such as restaurants, schools, or shops, by only changing the search keywords.
The dataset GeoJedHF can also be updated regularly. Because each facility has a fixed ID (place_id), the process can be repeated every month or year to find new facilities, closed ones, or changes in ratings. This makes it possible to track how healthcare quality changes over time. On the other hand, the PSI is only a starting point; it can be improved by checking some reviews manually, using better Arabic sentiment models, and adding new factors like service cost, accessibility, or waiting time.
From a planning view, the spatial patterns and PSI results can help local authorities find underserved areas, plan where to open new facilities, and compare the quality of services across the city. The same grid method can also help businesses and investors understand where services are lacking and where new opportunities might exist.
In short, this research introduces an automated and flexible method that can collect, analyse, and visualise healthcare data for any city using open digital sources.
Although the study achieved its goals, some limitations should be noted. First, the Google Places API has strict limits: each search returns up to 60 results and up to five reviews per place. This means that smaller or less-known facilities may not appear in the data. Some reviews were very short, which may reduce the accuracy of the sentiment model. Further work could include labeling the data and conduct comparative studies to check advanced and more recent models.
Second, the grid cells were created using degrees of latitude and longitude, not exact distances in kilometres. This can cause small distortions in size or distance, although the effect is small within Jeddah. Because the search radius was 8 km, a few facilities outside the official boundary were also included. This choice ensured full coverage but may slightly blur the city limits.
Third, the PSI was designed as a simple baseline that combines only ratings and positive review ratios with one fixed weight. While the top-ranked facilities were stable, the low-ranked ones were more affected by changes in weight. Using more factors or advanced weighting methods in future versions would make the index more reliable.
Fourth, the analysis used only one data source (Google Maps). Differences in user activity or rating habits between areas might affect results. combining this data with other open sources would provide a more comprehensive dataset.
Finally, the current index measures how users feel about healthcare quality, not actual service performance. Real-world factors such as distance, cost, staff capacity, or patient outcomes were not included but should be explored to provide a more complete view of healthcare quality in Jeddah.
6. Conclusions and Future Work
This study aimed to develop an automated and structured method for collecting and analysing healthcare facility data in Jeddah. The main goal was to create a process that supports both spatial coverage and data reliability. Rather than focusing only on numerical results, the research focused on designing a reusable framework that can support future studies and applications.
Three main outcomes were achieved. First, the proposed spatial framework, called GeoJed, was developed to divide Jeddah into consistent geographic cells. This grid ensured complete coverage of the city and provided a clear reference system that connects every facility to its specific location.
Second, the data collection process was automated using the Google Places API. Each grid cell acted as a search area, enabling the efficient retrieval of healthcare facilities, including both public and private providers. The resulting dataset, named GeoJedHF, forms an up-to-date and reusable data source that can be refreshed to monitor changes over time.
Third, an additional experiment introduced the Patient Satisfaction Index (PSI) as a baseline measure of perceived service quality. The PSI combined user ratings and review sentiment to reflect patient experiences and served as an initial step towards measuring perceived healthcare quality.
The study presented a complete and practical framework that automates data collection, ensures spatial consistency, and links user feedback with spatial analysis. The same approach can be applied to other cities and adapted for different service types such as education, retail, or transportation.
Future work can progress in three directions. First, the data collection framework can be expanded beyond Jeddah to other Saudi or international cities. The same grid design can be reused by simply changing the city boundary and search parameters, allowing consistent comparisons between different urban areas. The grid method can also support other business or research purposes, such as mapping restaurants, schools, or commercial outlets.
Second, the GeoJedHF dataset can be updated regularly to monitor how healthcare services change over time. This can reveal new openings, closures, and changes in user satisfaction. This makes the dataset not only a static collection of points but a living source of information that can support both city planners and business analysts. Beyond healthcare, GeoJedHF also represents a broader methodological contribution. The same grid system and automated data collection process can be applied to other sectors, such as education, retail, or hospitality, to explore how different services are distributed within a city. In this way, the approach offers a flexible framework that can be reused and adapted in future studies, both within and beyond Jeddah.
Third, the PSI baseline should be further improved by exploring the performance of different sentiment models, especially those designed for Arabic text. A practical next step would be to manually annotate a sample of the existing reviews to create reliable “gold standard” labels. This reference data can then be used to evaluate and compare multiple sentiment models, helping identify which provides the most accurate and consistent predictions for Arabic healthcare reviews. The selected model could then be applied to refine the PSI calculation and produce a more reliable assessment of patient satisfaction.