Article

Automated Identification and Spatial Pattern Analysis of Urban Slow-Moving Traffic Bottlenecks Using Street View Imagery and Deep Learning

1
School of Urban Construction, Wuhan University of Science and Technology, Wuhan 430065, China
2
Hubei Provincial Engineering Research Center of Urban Regeneration, Wuhan University of Science and Technology, Wuhan 430065, China
*
Author to whom correspondence should be addressed.
ISPRS Int. J. Geo-Inf. 2025, 14(9), 351; https://doi.org/10.3390/ijgi14090351
Submission received: 1 August 2025 / Revised: 9 September 2025 / Accepted: 12 September 2025 / Published: 15 September 2025

Abstract

With rapid urbanization and increasing emphasis on sustainable mobility, slow-moving traffic systems, including pedestrian and cycling infrastructure, have become critical to urban transportation and quality of life. Conventional assessment methods are labor-intensive, time-consuming, and limited in coverage. Leveraging advances in deep learning and computer vision, this study develops a framework for bottleneck detection using street-level imagery and the You Only Look Once version 5 (YOLOv5) model. An evaluation system comprising 15 indicators across continuity, safety, and comfort is established. In a case study of Wuhan’s Third Ring Road, the YOLOv5 model achieved 98.9% mean Average Precision (mAP)@0.5, while spatial hotspot analysis (p < 0.05) identified severe demand–infrastructure mismatches in southeastern Wuhan, contrasted with fewer problems in the northern region due to stronger management. To ensure adaptability, a dynamic optimization mechanism integrating temporal imagery updates, transfer learning, and collaborative training is proposed. The findings demonstrate the effectiveness of street-level remote sensing for large-scale urban diagnostics, extend the application of deep learning in mobility research, and provide practical insights for data-driven planning and governance of slow-moving traffic systems in high-density cities.

1. Introduction

With rapid urbanization, urban traffic systems have become increasingly complex. The development of slow-moving traffic infrastructure, including pedestrian and cycling facilities, is essential for promoting sustainable mobility. These systems not only serve daily short-distance travel but also mitigate congestion, reduce emissions, and improve public health. Yet many cities continue to face severe bottlenecks—such as narrow sidewalks, discontinuous paths, excessive obstacles, and unclear signage—that compromise continuity and safety [1].
Identifying such bottlenecks has long been a focus of transport research. Traditional methods, including on-site surveys, manual observations, and questionnaires, provide localized insights but are constrained by time, labor, and coverage [2]. On-site surveys are time-consuming and difficult to scale; manual observations risk subjectivity; and questionnaires often suffer from small sample sizes and poor representativeness. These limitations undermine the reliability and efficiency of bottleneck identification. Advances in sensing technologies now enable the integration of high-resolution spatial data into urban studies. In particular, street view imagery provides rich information on pedestrian conditions, road facilities, signage, and obstacles [3]. Meanwhile, deep learning, especially convolutional neural networks (CNNs), has achieved strong performance in image classification, object detection, and feature extraction [4]. By learning from large image datasets, these models can automatically identify bottleneck-related features. For example, street view images can capture sidewalk width, detect obstructions such as poles or trash bins, and evaluate signage clarity—key factors for diagnosing slow-moving traffic bottlenecks [5].
Despite these advances, the integration of street view imagery and deep learning for diagnosing slow-moving traffic bottlenecks remains limited. Existing studies largely focus on detection, with little attention to spatial clustering or environmental drivers [6]. Yet spatial analysis is essential for understanding how bottlenecks relate to land use, population density, and traffic characteristics [7]. Both domestic and international research on these dimensions remains scarce. From a policy perspective, many countries have shifted from car-centered planning to active or slow-moving strategies, such as the Netherlands’ pioneering bicycle policy, Canada’s National Active Transportation Strategy (NATS, 2021–2026), and China’s recent standards and the Beijing 14th Five-Year Transportation Plan [8,9]. However, these initiatives emphasize infrastructure provision while neglecting analytical tools that can map slow-moving traffic bottlenecks at scale, limiting alignment between technology and planning. Technically, some pilot efforts in developed countries have introduced artificial intelligence (AI)-based street monitoring [10], and early attempts in China have used deep learning to extract features such as sidewalk width and obstacle density [11]. Yet these efforts remain fragmented and preliminary, with most spatial analyses continuing to emphasize motorized traffic. In contrast, the spatial dynamics of slow-moving traffic bottlenecks remain largely understudied [12].
This study addresses these gaps by integrating street view imagery with deep learning to detect bottlenecks and analyze their spatial clustering and urban determinants. Unlike prior studies that focus solely on detection models (e.g., You Only Look Once version 5, YOLOv5), our framework pioneers the integration of Moran’s I spatial autocorrelation with a multi-dimensional indicator system encompassing continuity, safety, and comfort. This directly links technical innovation with the policy challenge of diagnosing slow-moving traffic bottlenecks at scale.
Accordingly, this study is guided by three research questions:
(1)
How can street view imagery and deep learning automatically identify bottlenecks in slow-moving traffic systems?
(2)
What are the spatial distribution and clustering patterns of these bottlenecks in a dense city such as Wuhan?
(3)
Which urban factors contribute to the formation of these bottlenecks?
To answer these questions, this study proposes a comprehensive framework for identifying and analyzing bottlenecks in urban streets through the integration of street view imagery and deep learning. Using Wuhan’s Third Ring Road as a case study, the framework develops an automated detection model based on YOLOv5, constructs a scientifically grounded indicator system, and applies geographic information system (GIS)-based spatial analysis to examine distribution patterns and environmental interactions. This approach provides an efficient, accurate, and scalable method for diagnosing bottlenecks, deepens understanding of their spatial mechanisms, and supports evidence-based urban planning and governance. More broadly, it highlights the potential of combining street-level remote sensing with deep learning to enhance transportation research and promote sustainable urban development.

2. Literature Review

2.1. Research Progress on Slow-Moving Traffic Bottleneck Identification Methods

The identification of bottlenecks in slow-moving traffic systems is a critical step toward improving slow-moving traffic infrastructure and achieving sustainable urban mobility. In recent years, research paradigms have shifted from a vehicle-centric perspective to a human-centric one, reflecting a broader trend toward fine-grained, dynamic, and multimodal analyses of urban space [13]. Existing approaches to bottleneck identification can be broadly categorized into three levels: macro-level identification based on spatiotemporal detection, micro-level identification based on individual movement trajectories, and structural identification through complex network analysis [14]. Traditional methods primarily rely on field surveys, manual observations, and questionnaires. While these approaches provide localized insights, they suffer from significant drawbacks. Field surveys are time-consuming, labor-intensive, and difficult to scale. Manual observations lack consistency and are prone to subjectivity, whereas questionnaires may suffer from small sample sizes and non-representative data, leading to biased outcomes [15]. The rapid advancement of information and sensing technologies has opened new avenues for bottleneck detection. Among these, street view imagery has emerged as a valuable source of high-resolution geospatial data. These images provide rich visual information about road infrastructure, signage, obstacles, pedestrians, and buildings, and offer wide spatial coverage at relatively low cost [16].
In China, early research focused mainly on traditional traffic monitoring techniques. For example, Wang [17] developed a plugin using Aimsun’s Application Programming Interface (API) and Software Development Kit (SDK) to monitor road risks and identify hotspots on the Shanghai G15 expressway through simulated traffic events such as speeding or sudden stops. Tang [18] utilized loop detector data from the PeMS platform to identify congestion points on urban roads by integrating multi-period traffic data. Li [19] proposed a congestion propagation model using a maximum spanning tree to capture causal relationships between congested segments. Zhao [20] introduced a TCD-AIM (Traffic Congestion Detection—Approximate Impact Maximization) method to identify real-time bottlenecks at the metropolitan scale. Hua [21] constructed a simulation-based predictive model using deep neural networks (DNNs) for traffic speed prediction in SUMO, integrating multi-source data and comparing evaluation metrics. Pan [22] applied Vision Transformer models to classify road widths using street view imagery, distinguishing between impassable narrow roads, passable narrow roads, and wide roads, with applications in Beijing’s Second Ring Road area.
Internationally, scholars have pioneered the integration of visual data with computational techniques to support slow-traffic analysis. Early work, such as that by Chin [23], used aerial imagery to construct pedestrian networks and compared them with street networks based on metrics like node connectivity and pedestrian route directness. Badland [24] applied data from the Australian AURIN platform to design agent-based walkability tools, focusing on vulnerable populations such as the elderly and children. Song [25] introduced a data-driven framework for identifying recurring bottlenecks on North Carolina highways, using long-term spatial activation patterns. Pandapotan et al. [26] found that pedestrian path characteristics influence transit use in Jakarta, with trip distance identified as the dominant factor. Budholiya [27] combined YOLOv5, Deep Convolutional Networks, and LSTM for traffic monitoring in vehicular ad hoc networks (VANET), contributing to congestion detection and urban traffic forecasting.
Both domestic and international research has made significant progress in algorithm development, multi-source data fusion, and applied implementations. Chinese studies emphasize algorithmic adaptability in high-density urban environments, evolving from single-frame analysis toward dynamic, data-driven approaches using street view imagery and deep learning. Comfort evaluation frameworks based on feature recognition and the analytic hierarchy process (AHP) methods have also emerged. International research tends to focus on dynamic background modeling, cross-regional generalization, and multimodal integration. Recent studies have explored the fusion of satellite imagery, street view data, and points of interest (POI) information through multi-task learning frameworks, enabling simultaneous identification of physical and social bottlenecks. Nevertheless, several research gaps remain. Existing methods often lack generalization capabilities across cities, provide limited analysis of spatial causes and impacts, and rarely integrate social perception data. Future directions are expected to include the application of multimodal large-scale models, real-time monitoring technologies, and the construction of human-centered comprehensive evaluation systems for street environments.

2.2. Research Status on Spatial Effects Analysis of Slow-Moving Traffic Bottlenecks

The spatial effects analysis of slow-moving traffic bottlenecks examines how the built environment of urban streets shapes traffic flow and user behavior. It is essential for understanding bottleneck distribution and its interactions with land use, population density, and traffic dynamics [28]. It provides valuable insights for urban planning, infrastructure optimization, and traffic management. In recent years, research in this area has progressed significantly in terms of theoretical models, analytical techniques, and practical applications [29]. The analytical paradigm has evolved from early qualitative descriptions toward more systematic, quantitative, and model-based investigations. Methodologically, studies have shifted from traditional survey-based approaches to comprehensive, data-driven analyses that integrate multi-source big data and intelligent algorithms. Moreover, the research perspective has expanded from a single-dimensional focus on traffic flow to interdisciplinary inquiries that incorporate urban planning, behavioral science, and spatial design. This body of work is now characterized by theoretical depth, methodological innovation, and broader practical application. A notable trend is the transition from reactive congestion management toward proactive detection of spatial imbalance, supported by a growing framework that links spatial structure, behavioral feedback, and diffusion effects across urban scales [30].
In China, most spatial analyses of urban traffic bottlenecks have focused on motorized traffic, with limited attention to slow-moving traffic systems. Existing studies mainly emphasize high-density urban areas and often follow policy directives to propose optimization strategies. For instance, Li [31] employed 2D and 3D GIS tools to quantify urban design quality and correlated these metrics with pedestrian counts and walkability scores. Zhang [32] developed an enhanced walkability assessment method based on a hierarchical evaluation process and incorporated both perceived and objectively measured environmental factors to explain spatial variations in pedestrian accessibility. Xu [33] introduced a self-learning node embedding framework and employed an adaptive graph fusion convolutional recurrent network to dynamically model the spatiotemporal characteristics of traffic flow, enabling the discovery of evolving interdependencies without prior structural knowledge. Mao [34] proposed the T-CCM method to infer causal relationships among road segments using time-series traffic data, addressing challenges related to uncertainty and inter-sensor dependencies in dynamic urban traffic systems. Pan [35] provided a comprehensive review of artificial intelligence-based image analysis, highlighting its applications in transportation domains such as autonomous driving and traffic management. Their work underscores the growing potential of computer vision and deep learning in diagnosing and alleviating non-motorized traffic bottlenecks, offering methodological insights highly relevant to the present study.
Internationally, research has focused more on the dynamic propagation and spatial constraints of bottlenecks on travel behavior. Methodologies commonly include simulation modeling, data-driven inference, spatial regression, and empirical surveys. Noland [36] conducted spatial classification analyses using STATS19 crash data from London, applying GIS-based geocoding to examine the relationship between street congestion and safety. Ha [37] applied spatial regression models to investigate the effects of physical road characteristics, development density, and socioeconomic attributes on travel patterns. Fuentes [38] used GIS and OLS regression to assess the spatial relationships among land use, transportation, and demographics in Ciudad Juárez, Mexico, offering targeted intervention strategies. Natapov [39] integrated behavioral experiments in virtual environments with spatial visibility metrics, combining urban attractor theory and spatial configuration analysis to better understand pedestrian behavior. Droj [40] combined GIS-T with real-time traffic data, simulation tools, and network analysis to identify key contributors to urban street congestion. Körmeçli [41] used spatial syntax and GIS-based quantitative assessment to evaluate the walkability potential of Çankırı’s urban core, linking urban form with pedestrian capacity. Jerath [42] introduced the concept of “Zones of Influence” using connected vehicle data to model the non-linear propagation of highway congestion and proposed event-triggered control strategies to improve flow efficiency.
This study addresses these gaps by proposing a comprehensive framework that integrates street view imagery and deep learning to identify and analyze slow-moving traffic bottlenecks. The framework develops an automated detection model based on YOLOv5 and street-level imagery to capture bottlenecks related to continuity, safety, and comfort, while also establishing a scientifically grounded indicator system for systematic evaluation. In addition, it incorporates GIS-based spatial analysis to examine the distribution, clustering, and environmental determinants of bottlenecks, using Wuhan’s Third Ring Road as a case study. By overcoming the limitations of conventional approaches, this research provides an efficient, accurate, and scalable method for diagnosing slow-moving traffic bottlenecks in complex urban environments. The integration of detection, multi-dimensional evaluation, and spatial autocorrelation analysis not only advances methodological tools for transportation research but also delivers actionable insights for evidence-based urban planning and governance. Ultimately, the study demonstrates how combining street-level remote sensing and deep learning can strengthen urban diagnostics and support the sustainable development of slow-moving traffic systems.

3. Methodology

3.1. Study Area

Wuhan, a core city in central China and a strategic hub along the Yangtze River Economic Belt, covers 8569 km2 and accommodates a permanent population of approximately 13.6 million. As shown in Figure 1, in this study, we focus on three representative sub-areas within the Third Ring Road—Hankou old urban core, Donghu University Town, and the Guiyuan Temple commercial district—selected for their distinctive urban functions, demographic characteristics, and mobility demands. Hankou, dominated by high-density commercial land use, hosts population densities exceeding 20,000 persons/km2 and pedestrian volumes on the order of tens of thousands per day, thereby representing the congestion pressures of historical cores. Donghu University Town contains over 300,000 students and faculty, with a population density of approximately 12,000 persons/km2, highlighting the mobility challenges of rapidly expanding educational zones and the growing competition between motorized and slow-moving traffic. The Guiyuan Temple district, located in Hanyang District with over 830,000 permanent residents, combines religious heritage and intensive commercial activity; seasonal tourism often attracts over 30,000 daily visitors, producing recurrent pedestrian bottlenecks under constrained spatial conditions. Together, these sub-areas capture the heterogeneity of land use structures, population pressures, and slow-traffic dynamics in high-density urban environments, thereby providing a representative basis for systematic bottleneck identification and spatial effect analysis.

3.2. Research Framework

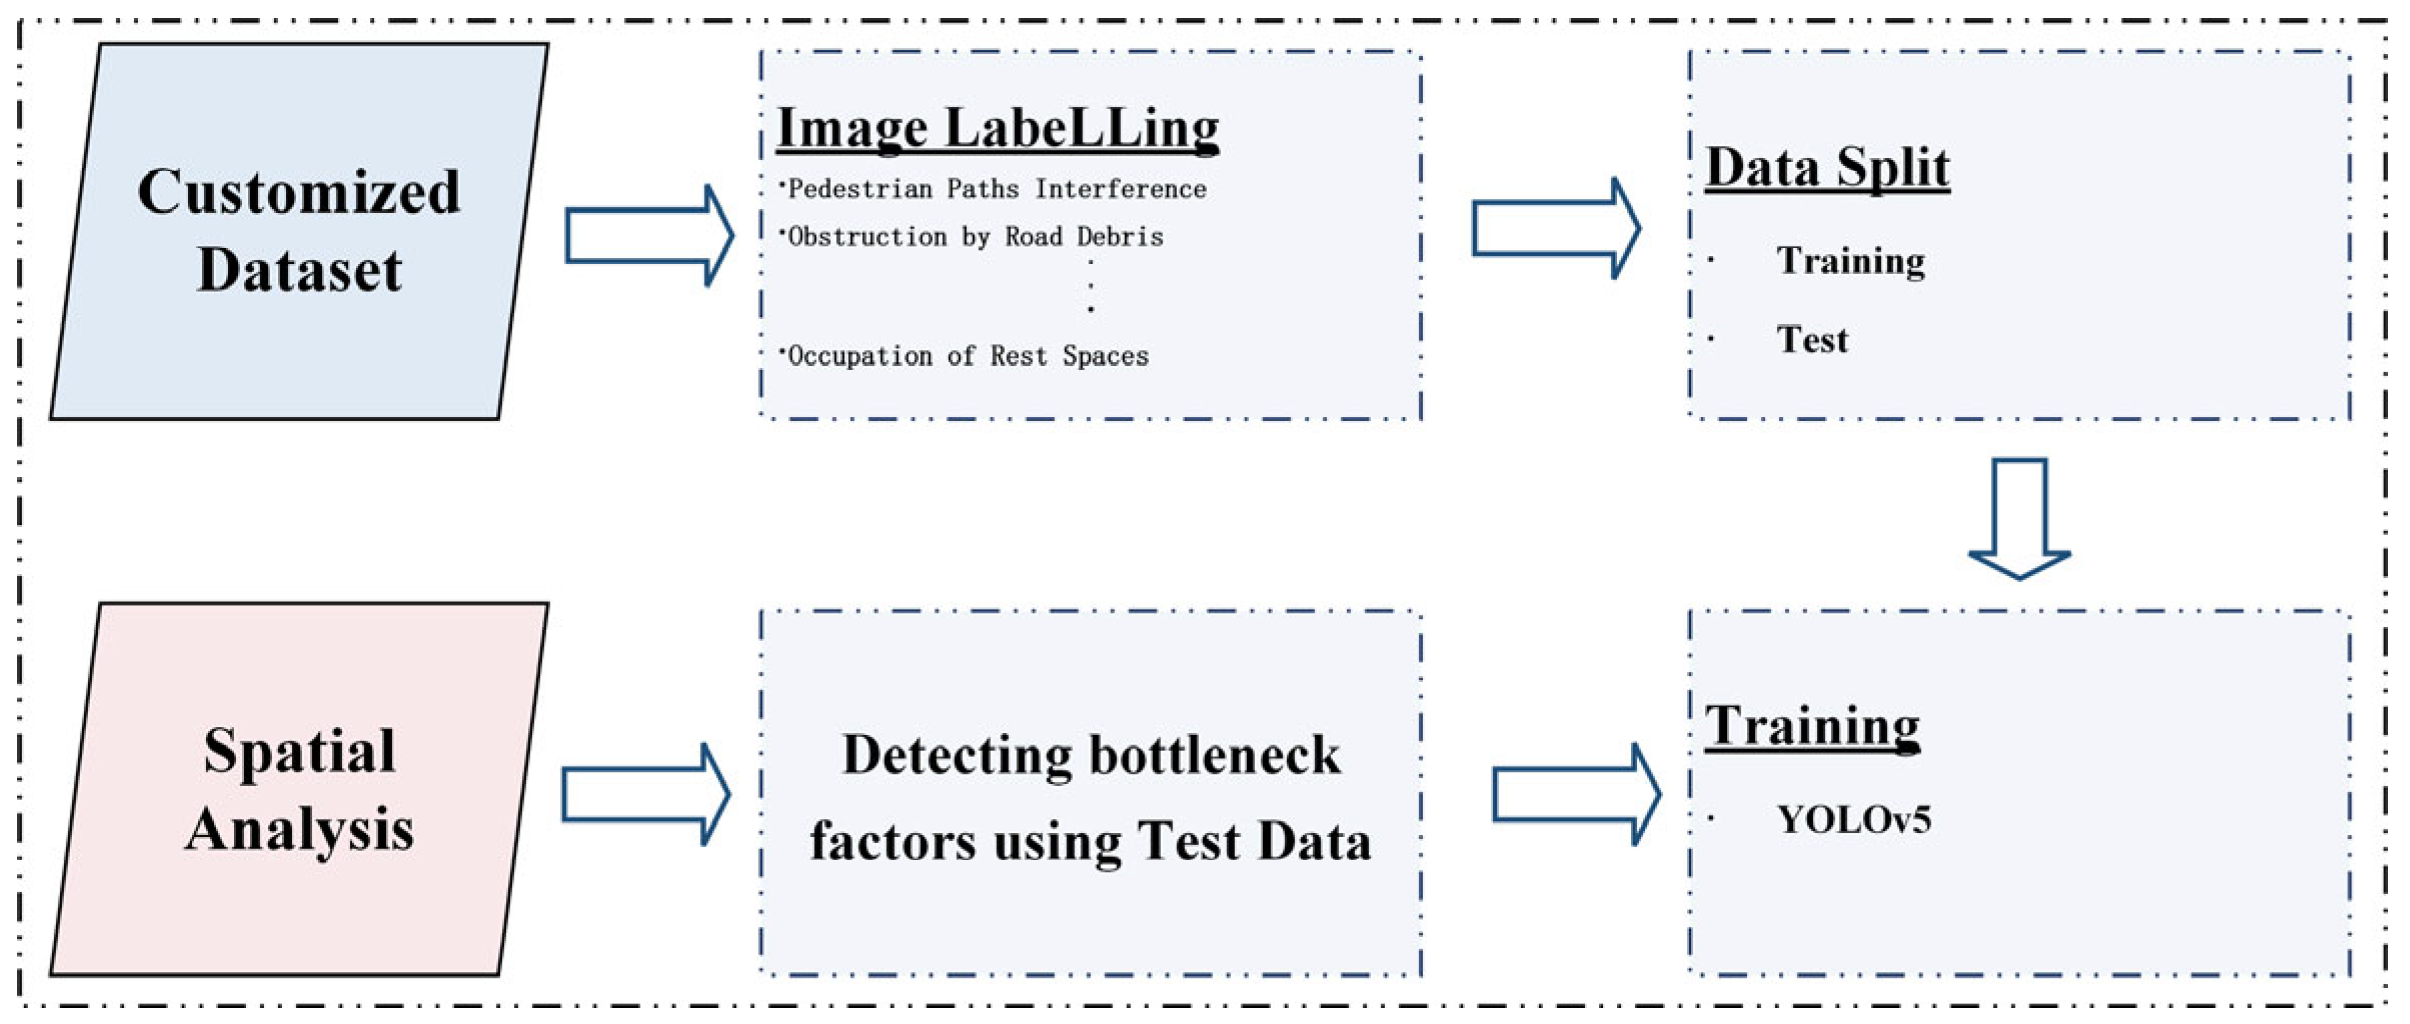
The methodological workflow of this study, as illustrated in Figure 2, consists of the following three main steps: (1) Street view images related to slow-moving traffic were obtained via the Baidu Street View API, simulating a human eye-level perspective. To enhance spatial coverage and representativeness, supplemental image data were collected through fixed-point sampling in areas with typical slow-moving traffic scenarios across Wuhan. This ensured the completeness and diversity of the dataset, capturing real-world pedestrian and cycling conditions. (2) The YOLOv5 model was employed for object detection and training on the collected street view imagery. Based on the constructed slow-moving traffic bottleneck indicator system, manual annotation was conducted using the LabelImg tool. Annotated labels were converted into YOLO-compatible format, and the model was trained and then applied to a test dataset to evaluate its accuracy and reliability. The recognition results were visualized to derive preliminary insights into pedestrian traffic issues. Leveraging the efficiency of automated detection, the model was used to process large volumes of imagery, extracting spatial features associated with slow-moving traffic bottlenecks in the study area. (3) Spatial analysis techniques were employed to assess the spatial heterogeneity of slow-moving traffic system problems at the neighborhood level. A bottleneck distribution map was generated based on three key dimensions of pedestrian travel: safety, continuity, and comfort. Global Moran’s I was used to assess overall spatial autocorrelation, while hotspot and coldspot analysis were performed to detect significant local clusters of bottleneck issues. ArcGIS was used to generate spatial visualizations, revealing the spatial distribution patterns and potential influencing factors of slow-moving traffic bottlenecks across the study area.

3.2.1. Construction of the Street View Image Dataset for the Study Area Within Wuhan’s Third Ring Road

We examined the street network within Wuhan’s Third Ring Road by integrating four categories of data: road vectors, street view imagery, POIs, and field surveys. Road network data from OpenStreetMap were filtered to exclude expressways, alleys without coverage, and service roads, resulting in 39,294 valid segments. We collected street view images through the official Baidu Maps API, in strict compliance with its data-use policy. Parameters were set to approximate the human field of view (tilt 6°, 500 × 375 px resolution, 50 m intervals, and four directions per point), producing 314,264 images from 78,566 sampling locations. For model training, we applied ArcGIS resampling at 10 m intervals generating 54,280 images suitable for YOLOv5 transfer learning. POI data were obtained from the Amap Open Platform API, yielding 220,748 records of schools, commercial facilities, and transit hubs. These were matched to street segments and incorporated as explanatory covariates in clustering and hotspot analyses.
To validate and enrich the imagery and POI datasets, we conducted monthly field surveys between April and September 2023 at approximately 300 locations, covering both peak and off-peak periods. Observations documented sidewalk continuity, temporary obstructions, and rush-hour crowding, providing essential ground-truth references. All datasets underwent systematic cleaning, resizing to 640 × 640 pixels, and augmentation (cropping, flipping, brightness adjustment, normalization) before integration into a unified geodatabase. Bottleneck-related features—including obstructions, pedestrian–bicycle conflicts, signage clarity, and facility conditions—were manually annotated and used to train and validate the YOLOv5 model. This multi-source integration established a robust foundation for subsequent spatial effect analyses.

3.2.2. Construction of a Slow-Moving Traffic Bottleneck Identification Indicator System

We developed the indicator system based on field surveys and image recognition analysis of common issues within the slow-moving traffic environment in Wuhan’s Third Ring Road area. This study classifies factors affecting the user experience of slow-moving traffic systems into two major categories: structural factors and usage factors. Structural factors refer to the static physical characteristics of street spaces and associated facilities, while usage factors capture dynamic interferences and maintenance or management conditions during real-world use.
Drawing on both domestic and international research on slow traffic environments, and incorporating residents’ preferences and subjective perceptions, we established a systematic bottleneck identification indicator system structured around three dimensions: continuity, safety, and comfort [43]. During indicator selection, we referenced existing frameworks such as the Green View Index (GVI) and the Connectivity Index were referenced, and incorporated both street view image recognition data and perceptual analysis techniques were incorporated to enhance scientific rigor and completeness [44]. The system is organized into three hierarchical dimensions: Continuity, the fundamental condition for the usability of slow-moving traffic systems, focusing on the seamlessness and barrier-free nature of pedestrian and bicycle travel paths. Constraints to continuity include lane conflicts, insufficient road width, and temporary obstructions such as parked vehicles or debris [45]. Indicators include pedestrian–bike lane interference, slow-moving traffic congestion, illegal parking, and temporary lane blockages. For instance, improper shared bicycle parking often obstructs pedestrian movement in central Wuhan [46]. Quantifying such obstacles provides a direct measure of travel smoothness. Safety is a critical determinant of residents’ willingness to use slow-moving traffic infrastructure. This dimension covers both physical protection (e.g., barriers, refuge islands) and dynamic risks such as visual obstructions or hazards near transit stops. Recent empirical studies reinforce this perspective by showing that the built environment surrounding transit stations often lacks supportive features for safe and active mobility, including continuous sidewalks, bicycle-friendly facilities, and integrated land use planning, thereby limiting opportunities for utilitarian physical activity and safe access to transit [47]. Key indicators include the lack of safety islands, blocked sightlines, damaged accessible facilities, and hazards near bus stations. Field surveys revealed that dense roadside vegetation in southeastern Wuhan impairs visibility, raising safety risks. Prior studies confirm a positive correlation between absent safety facilities and accident frequency [48]. Comfort refers to how well the slow-moving system accommodates diverse user needs and enhances psychological and physical experiences. This dimension integrates indicators related to functionality, environmental quality, and street vitality, such as damaged facilities, resident encroachment, greenery, and occupation of public rest areas [49]. Metrics like the green view index (GVI) and vegetation coverage positively influence comfort, while excessive rest area occupancy signals inadequate pedestrian-friendliness [50]. Studies further confirm that street greening significantly correlates with residents’ perceived vitality, supporting the inclusion of greenery-related indicators in the comfort assessment [51].
To ensure validity and avoid redundancy, we applied Kendall’s rank correlation coefficient to test inter-indicator relationships. For instance, “perceived street vitality” and “lack of safety facilities” exhibited moderate correlation. After comprehensive evaluation, we retained indicators with higher discriminatory power, resulting in 15 core indicators (see Table 1).

3.2.3. Identification of Slow-Moving Traffic Bottleneck Element Indicators

To enable efficient identification and quantitative analysis of slow-moving traffic bottleneck features in urban street scenes, we employed the YOLOv5 object detection algorithm based on the previously established indicator system. YOLOv5 formulates detection as a regression task, dividing each input image into an S × S grid, where each grid cell predicts B bounding boxes along with corresponding confidence scores and class probabilities. Non-maximum suppression (NMS) is applied to eliminate redundant predictions, allowing for fast, end-to-end detection. Although newer versions such as YOLOv8 and two-stage frameworks like Faster R-CNN are available, we adopted YOLOv5 for its balance of accuracy, efficiency, and lightweight architecture, which makes it well suited to large-scale urban imagery. In empirical evaluation, YOLOv5 achieved an mAP@0.5 of 98.9% with an inference speed of 20 ms per image, outperforming Faster R-CNN (94.7%) and SSD (91.2%) under identical conditions. These comparative results underscore its suitability for detecting diverse and small-scale bottleneck features in complex street environments.
YOLOv5 has been widely adopted in both academia and industry for its speed, accuracy, and ease of deployment, particularly in tasks requiring recognition of small, dense, and heterogeneous objects such as pedestrians, obstacles, and signage in urban scenes [52]. By batch-processing street view images, the model automatically outputs bounding box coordinates, object sizes, and categorical labels for bottleneck-related elements. The bounding box parameters are computed using the following regression formulas:
b x = 2 σ t x 0.5 + c x b y = 2 σ t y 0.5 + c y b w = p w 2 σ t w 2 b h = p h 2 σ t h 2    
where b x , b y , b w , b h are the center coordinates of the predicted bounding box (normalized); σ denotes the Sigmoid function (output range: (0,1)); c x , c y represent the offset of the grid cell; p w , p h are the width and height of the anchor box.
To enhance detection performance and robustness, we conducted customized training as shown in Figure 3. Images were resized to 640 × 640 pixels and trained with a batch size of 16 over 100 epochs. The Stochastic Gradient Descent (SGD) optimizer was applied with a learning rate of 0.01 and weight decay of 5 × 10⁴. Three loss functions were jointly optimized: Binary Cross-Entropy (BCE) loss for classification, confidence loss, and Generalized Intersection over Union (GIoU) loss for bounding box localization. To improve model generalization to complex urban environments, we employed data augmentation techniques including Mosaic augmentation, color jittering, random horizontal flipping, and affine transformations. The model was initialized with COCO pre-trained weights to accelerate convergence, and anchor box self-clustering was also applied to improve the detection of small-scale objects such as poles, road barriers, and bicycles. During training, we monitored mean Average Precision (mAP), Precision, and Recall were monitored in real time. These ensured that the model achieved optimal performance on the Wuhan street view dataset. This process established a robust technical foundation for the large-scale identification of bottleneck elements in subsequent analyses.
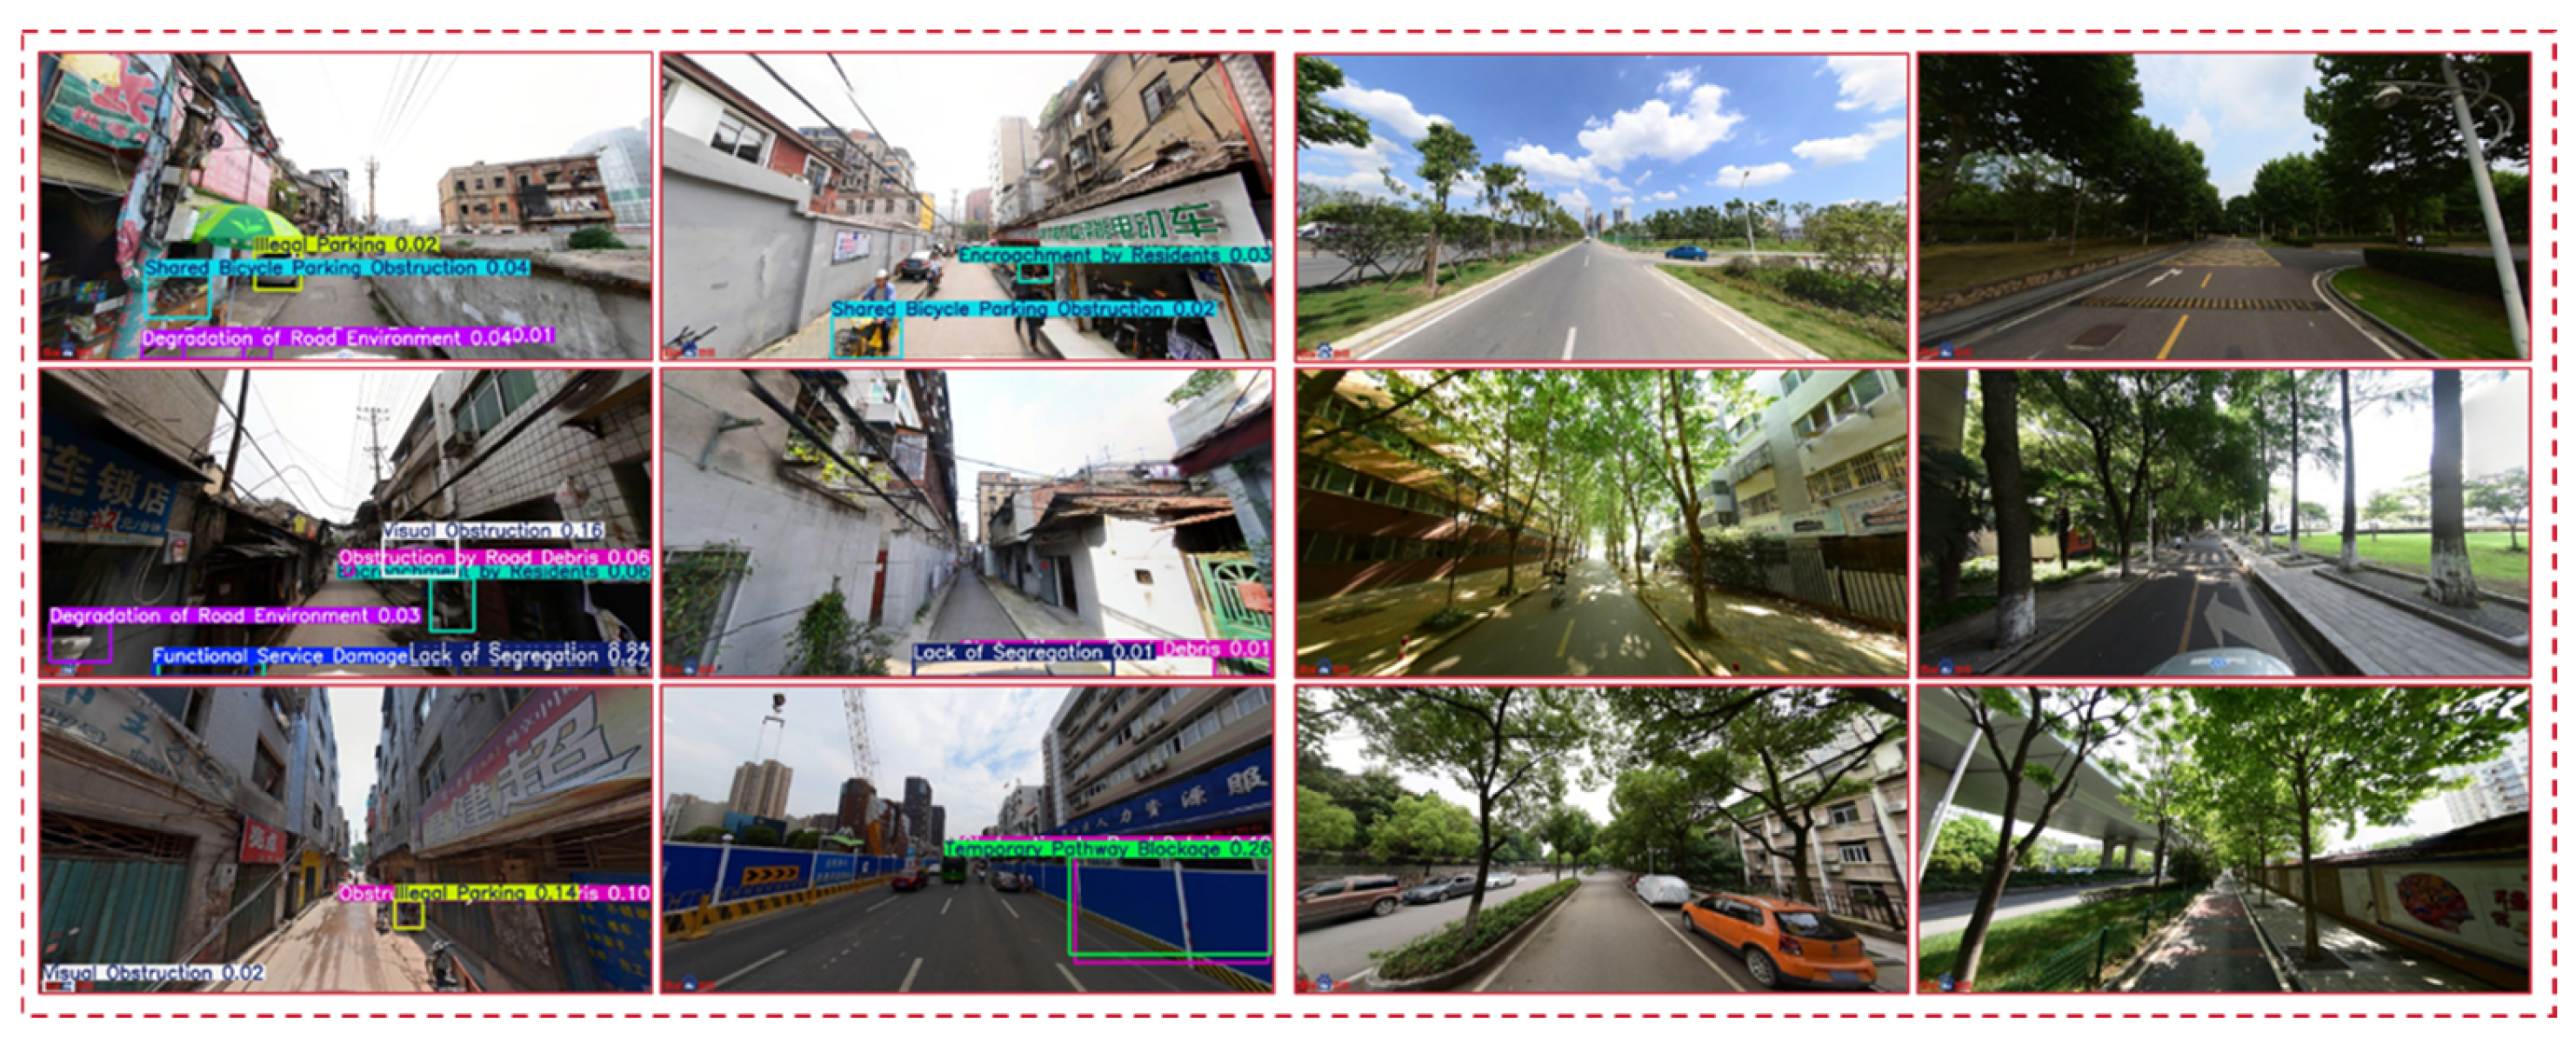
The recognition results were further used to derive statistical features, including the count, density, and spatial distribution of identified bottleneck-related elements. For instance, obstacle density (e.g., utility poles and slow-moving traffic vehicles such as bicycles) was calculated for each image to quantify obstruction levels along street segments. Similarly, the extent of visual obstruction from street greenery was measured to assess visibility, and the frequency of missing accessibility features was recorded to reflect potential pedestrian safety risks. To enhance detection accuracy, the YOLOv5 architecture employs techniques such as automatic anchor box clustering, adaptive image scaling (AutoShape), and Mosaic data augmentation. These methods increase stability and improve recognition of small objects and multiple categories in complex urban street environments. As shown in Figure 4, the YOLOv5 outputs are aligned with the predefined bottleneck indicator system, enabling automated detection, classification, quantification, and spatial annotation of multiple slow-moving traffic bottleneck factors. This integration generates high-resolution, structured data that provides a robust foundation for segment-level traffic evaluation and subsequent spatial effect analyses.

3.2.4. Spatial Effect Analysis of Bottlenecks in Slow-Moving Systems

Guided by Tobler’s First Law of Geography—“everything is related, but near things are more related than distant things” [53]—this study conducts spatial effect analysis based on the previously identified slow-moving traffic bottlenecks within Wuhan’s Third Ring Road. To quantify spatial dependence and clustering, both Global Moran’s I and Local Moran’s I statistics were applied. While Global Moran’s I provides an overall measure of spatial autocorrelation, Local Moran’s I, as proposed by Anselin, captures local heterogeneity and reveals fine-grained patterns in bottleneck distribution [54]. It distinguishes four clustering types: High-High Cluster, High-Low Outlier, Low-High Outlier, and Low-Low Cluster. The formula for Global Moran’s I is as follows:
I = n i = 1 n j = 1 n w i j x i x x j x i = 1 n j = 1 n w i j i = 1 n x i x 2
where n is the total number of spatial units, x i and x j are the observed values at locations i and j. x is the mean of all observed values, S 2  is the variance, and  w i j is the spatial weight matrix. In this study, w i j was constructed using a fixed 500 m Euclidean distance threshold between street segment centroids. Two street segments were considered neighbors if the distance between their centroids was ≤500 m. This approach was chosen over queen or rook contiguity, which are more suitable for polygon-based areal units, because the research objects here are linear road segments rather than contiguous administrative zones. The 500 m threshold was selected to reflect both the average block length in Wuhan’s central districts (300–500 m) and the typical pedestrian catchment radius (5–10 min, approximately 400–800 m). This ensures that the weight matrix captures meaningful neighborhood effects between functionally related street segments while avoiding over-smoothing across distant, unrelated links. To test the significance of spatial autocorrelation, the Z-score was used, with Z > 1.96 (p < 0.05) indicating clustering and Z < −1.96 indicating dispersion [55].
Global Moran’s I was applied to assess the overall clustering of bottleneck severity across the street network, with values approaching 1 indicating strong aggregation and values near 0 suggesting randomness. We then employed Local Moran’s I to examine clustering at the street-segment level, enabling detection of localized patterns in the distribution of slow-moving traffic bottlenecks [56]. The analysis revealed that sub-central areas such as Bashazhou and Hankoubei exhibit a combination of High-Low Outlier patterns and Low-Low Clusters, indicating that some segments experience significantly higher bottleneck pressure than their surrounding environments, while others consistently maintain low levels. This suggests localized disruptions that have not yet expanded into larger contiguous hotspot zones. In contrast, peripheral industrial and mining areas outside the Third Ring Road are predominantly identified as Low-Low Clusters, reflecting sparse slow-traffic infrastructure and limited pedestrian activity.
To enhance explanatory power, we refined spatial granularity by conducting sub-regional analyses across the urban core, transition zones, and periphery. We overlaid these layers with high human activity zones (e.g., metro stations, commercial hubs, and school catchment areas) and constructed a weighted interaction matrix incorporating pedestrian traffic intensity to assess demand-driven clustering. Results reveal strong spatial overlap between identified hotspots and high-density human activity areas, suggesting that urban design and population intensity are key drivers of bottleneck clustering. This analysis systematically uncovers aggregation mechanisms, diffusion patterns, and spatial evolution of slow-moving traffic bottlenecks, providing empirical support for zoning optimization, hierarchical management, and spatially differentiated governance of slow-moving traffic infrastructure in high-density cities.

4. Experiments and Results

4.1. Street View Image Annotation and Preprocessing

We focused on the core urban area within Wuhan’s Third Ring Road, covering three representative districts: the old urban center of Hankou, Donghu University Town, and the Guiyuan Temple commercial area. We collected a total of 54,280 high-resolution street view images were collected from 2023 to 2024, covering all four seasons (spring, summer, autumn, and winter) and various periods (weekdays, weekends, and holidays), thereby capturing diverse lighting conditions, pedestrian and vehicle flows, and environmental elements. To ensure robust model performance, we divided the dataset into a training set (43,424 images) and a test set (10,856 images) in an 80:20 ratio, which allowed the YOLOv5 model to learn a wide range of slow-moving traffic bottleneck features while retaining sufficient independent samples for generalization evaluation.
We organized the annotated dataset was organized around 15 bottleneck indicators (see Table 1) across the three dimensions of continuity, safety, and comfort. Most indicators contained more than 1000 labeled instances, but the frequency varied considerably: common conditions such as illegal parking (6200 instances), shared bicycle congestion (5800), and damaged service facilities (5000) were abundant, whereas relatively rare cases such as lack of safety islands (1200) or hazards near bus stations (1500) appeared less frequently. To address this imbalance, we applied category-aware sampling and targeted augmentation were applied. We enriched rare categories using techniques such as Mosaic image composition, rotations, and HSV adjustments, and incorporated additional annotations from monthly field surveys (300 locations between April–September 2023) were incorporated to supplement underrepresented classes. These measures ensured that all indicators exceeded 1000 samples, improving category balance and enhancing the model’s robustness across heterogeneous scenarios.
During preprocessing, we resized to 640 × 640 pixels to match YOLOv5 input requirements, and we normalized pixel values were normalized to the [0, 1] range to accelerate convergence. To enhance the model’s adaptability and simulate real-world conditions such as rain, snow, back-lighting, and occlusion, we employed diverse data augmentation techniques were employed, including random cropping, horizontal flipping, random rotation (±15°), HSV-based brightness and saturation adjustment, Gaussian blurring, and Mosaic image stitching. These strategies strengthened the model’s ability to detect both small objects (e.g., road cones, pavement cracks) and densely distributed obstacles (e.g., shared bicycles, illegally parked vehicles). Additionally, we used the LabelImg tool to manually annotate the 15 indicator categories following the proposed evaluation framework, thereby ensuring category balance and geometric accuracy. As illustrated in Figure 5, the model demonstrates high-precision detection performance across diverse slow-traffic scenarios, providing a solid foundation for subsequent bottleneck analysis and spatial effect evaluation.
The YOLOv5 deep learning model was applied to identify custom-labeled bottleneck element types from urban street scene images. A series of comparative detection experiments was conducted to classify and analyze slow-moving traffic bottlenecks across selected areas within Wuhan’s Third Ring Road. Figure 6 presents the distribution characteristics of the training set and the corresponding detection outcomes. The bar chart in the upper left shows the frequency of detection instances across 15 bottleneck categories, thereby indicating which issues are most prevalent within a consistent sample size and how they relate to the surrounding spatial context. Among all categories, dilapidated functional service facilities ranked first, with approximately 5000 instances, followed by shared bicycle parking obstructions and visual obstructions. The relatively high occurrence of illegal parking and visibility-related issues underscores their significant impact on the performance of Wuhan’s slow-moving traffic system. The scatter plots at the bottom illustrate the relationship between spatial dimensions and bottleneck severity. The x-axis (0.0–1.0) represents normalized measures of street width, sidewalk width, and image width ratios, while the y-axis corresponds to outputs such as bottleneck severity index, YOLOv5 detection confidence, and spatial accessibility index. Results reveal a strong negative correlation between sidewalk width and bottleneck severity (R2 = 0.73). In Donghu University Town, for example, streets with sidewalk widths below 0.3 generally exhibited bottleneck severity scores above 0.7, suggesting the need to prioritize sidewalk widening or obstacle removal. Furthermore, the overall scatter plot demonstrates a clear bimodal distribution, with most points concentrated around 0.2 and 0.8 on the x-axis. This pattern indicates that bottlenecks occur predominantly along street edges rather than central lanes, consistent with the placement of street furniture, vegetation, and parking facilities. Collectively, these findings provide critical spatial insights for the planning and targeted optimization of slow-moving traffic infrastructure.

4.2. Model Training and Validation Methods

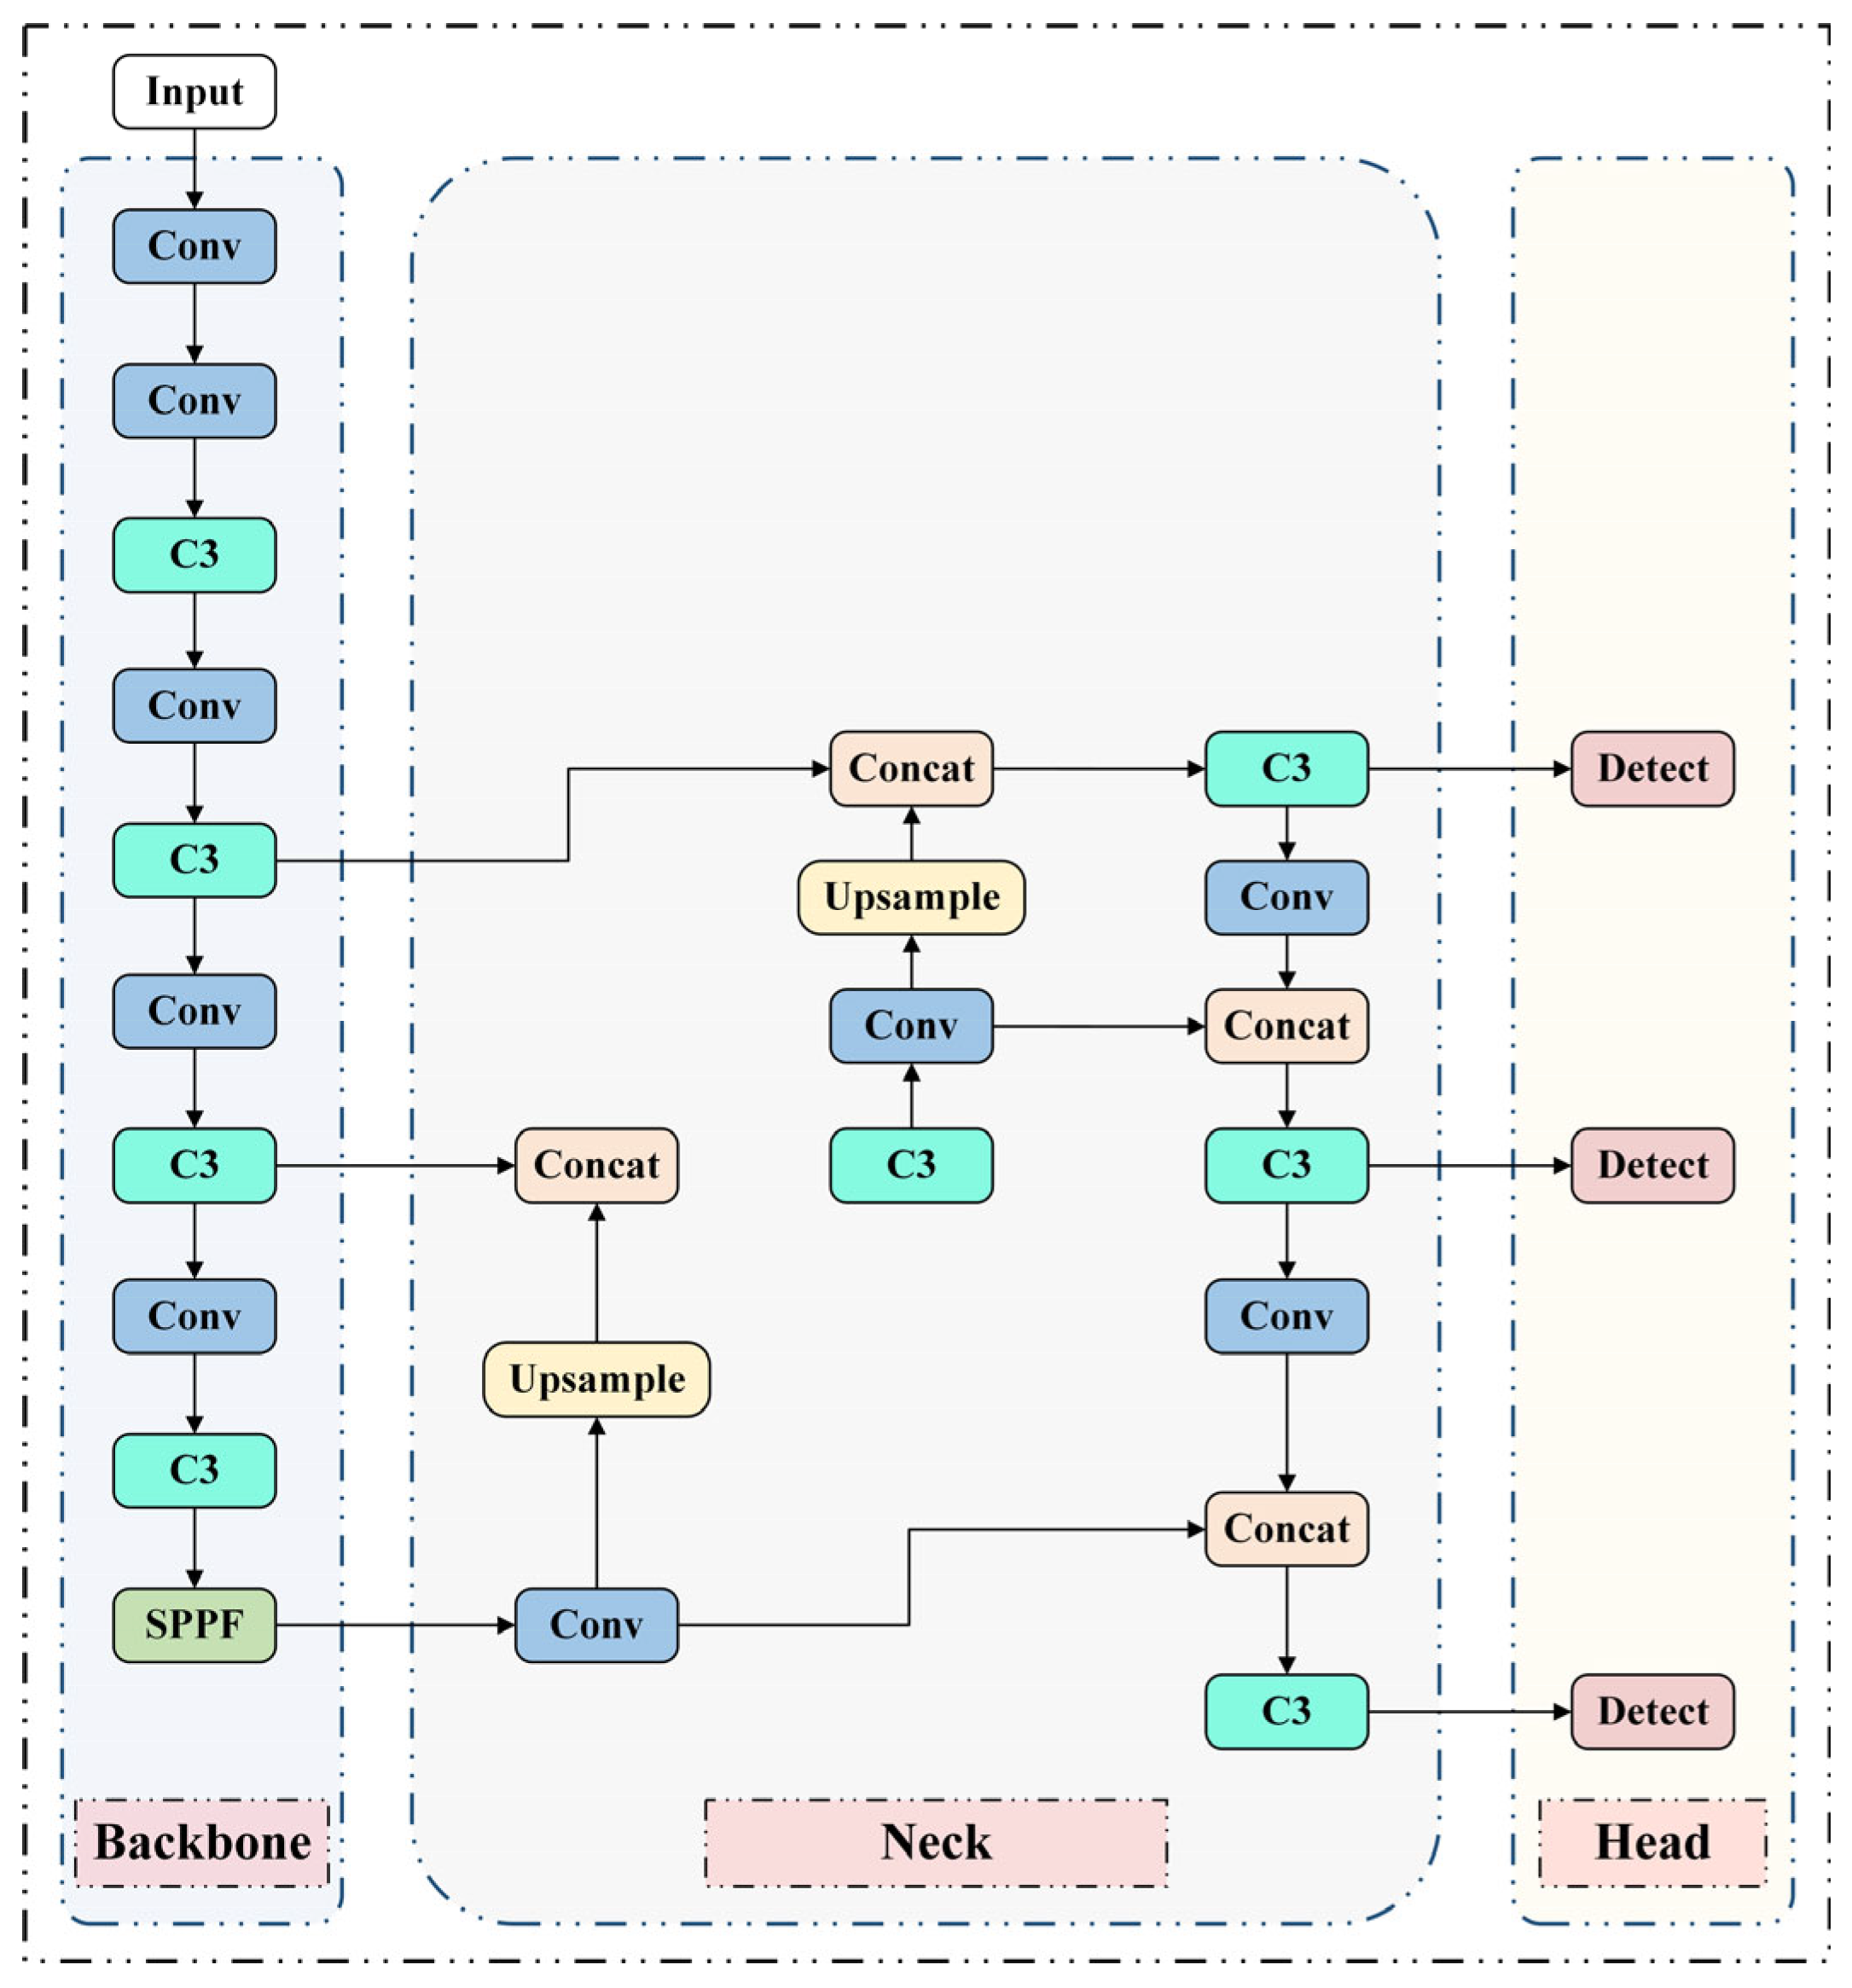
In this study, the YOLOv5 model was adopted as the backbone network for training and inference. The YOLOv5 framework achieves a balance between high detection accuracy and computational efficiency by incorporating depth-wise separable convolutions, Cross Stage Partial (CSP) connections, and Focus slicing. Its lightweight architecture and real-time detection capabilities make it well-suited for large-scale street view datasets and the specific requirements of slow-moving traffic bottleneck detection. The overall network architecture is composed of three main components: Backbone, Neck, and Head. The Backbone utilizes CSP-Darknet53 to hierarchically extract spatial-semantic features across multiple layers. The Neck integrates a Feature Pyramid Network (FPN) and Path Aggregation Network (PAN) to enable effective multi-scale feature fusion, allowing the model to detect small, medium, and large objects across three scales: 8×, 16×, and 32×. The Head outputs three detection branches that directly regress the object’s center coordinates (x,y), bounding box width and height (w,h), and associated confidence scores. During training, the model was optimized using Stochastic Gradient Descent (SGD) with momentum (momentum = 0.937). The initial learning rate was set to 0.01, and the batch size was 16. A total of 300 epochs were trained, incorporating cosine annealing and warm-up strategies to ensure faster and more stable convergence. Statistical analysis of the annotated dataset indicated that the target center points were uniformly distributed across the image plane, with bounding box dimensions (width and height) consistent with real-world object scales. No significant outliers or skewed distributions were observed, demonstrating high annotation quality and reliable learning signals for model training.
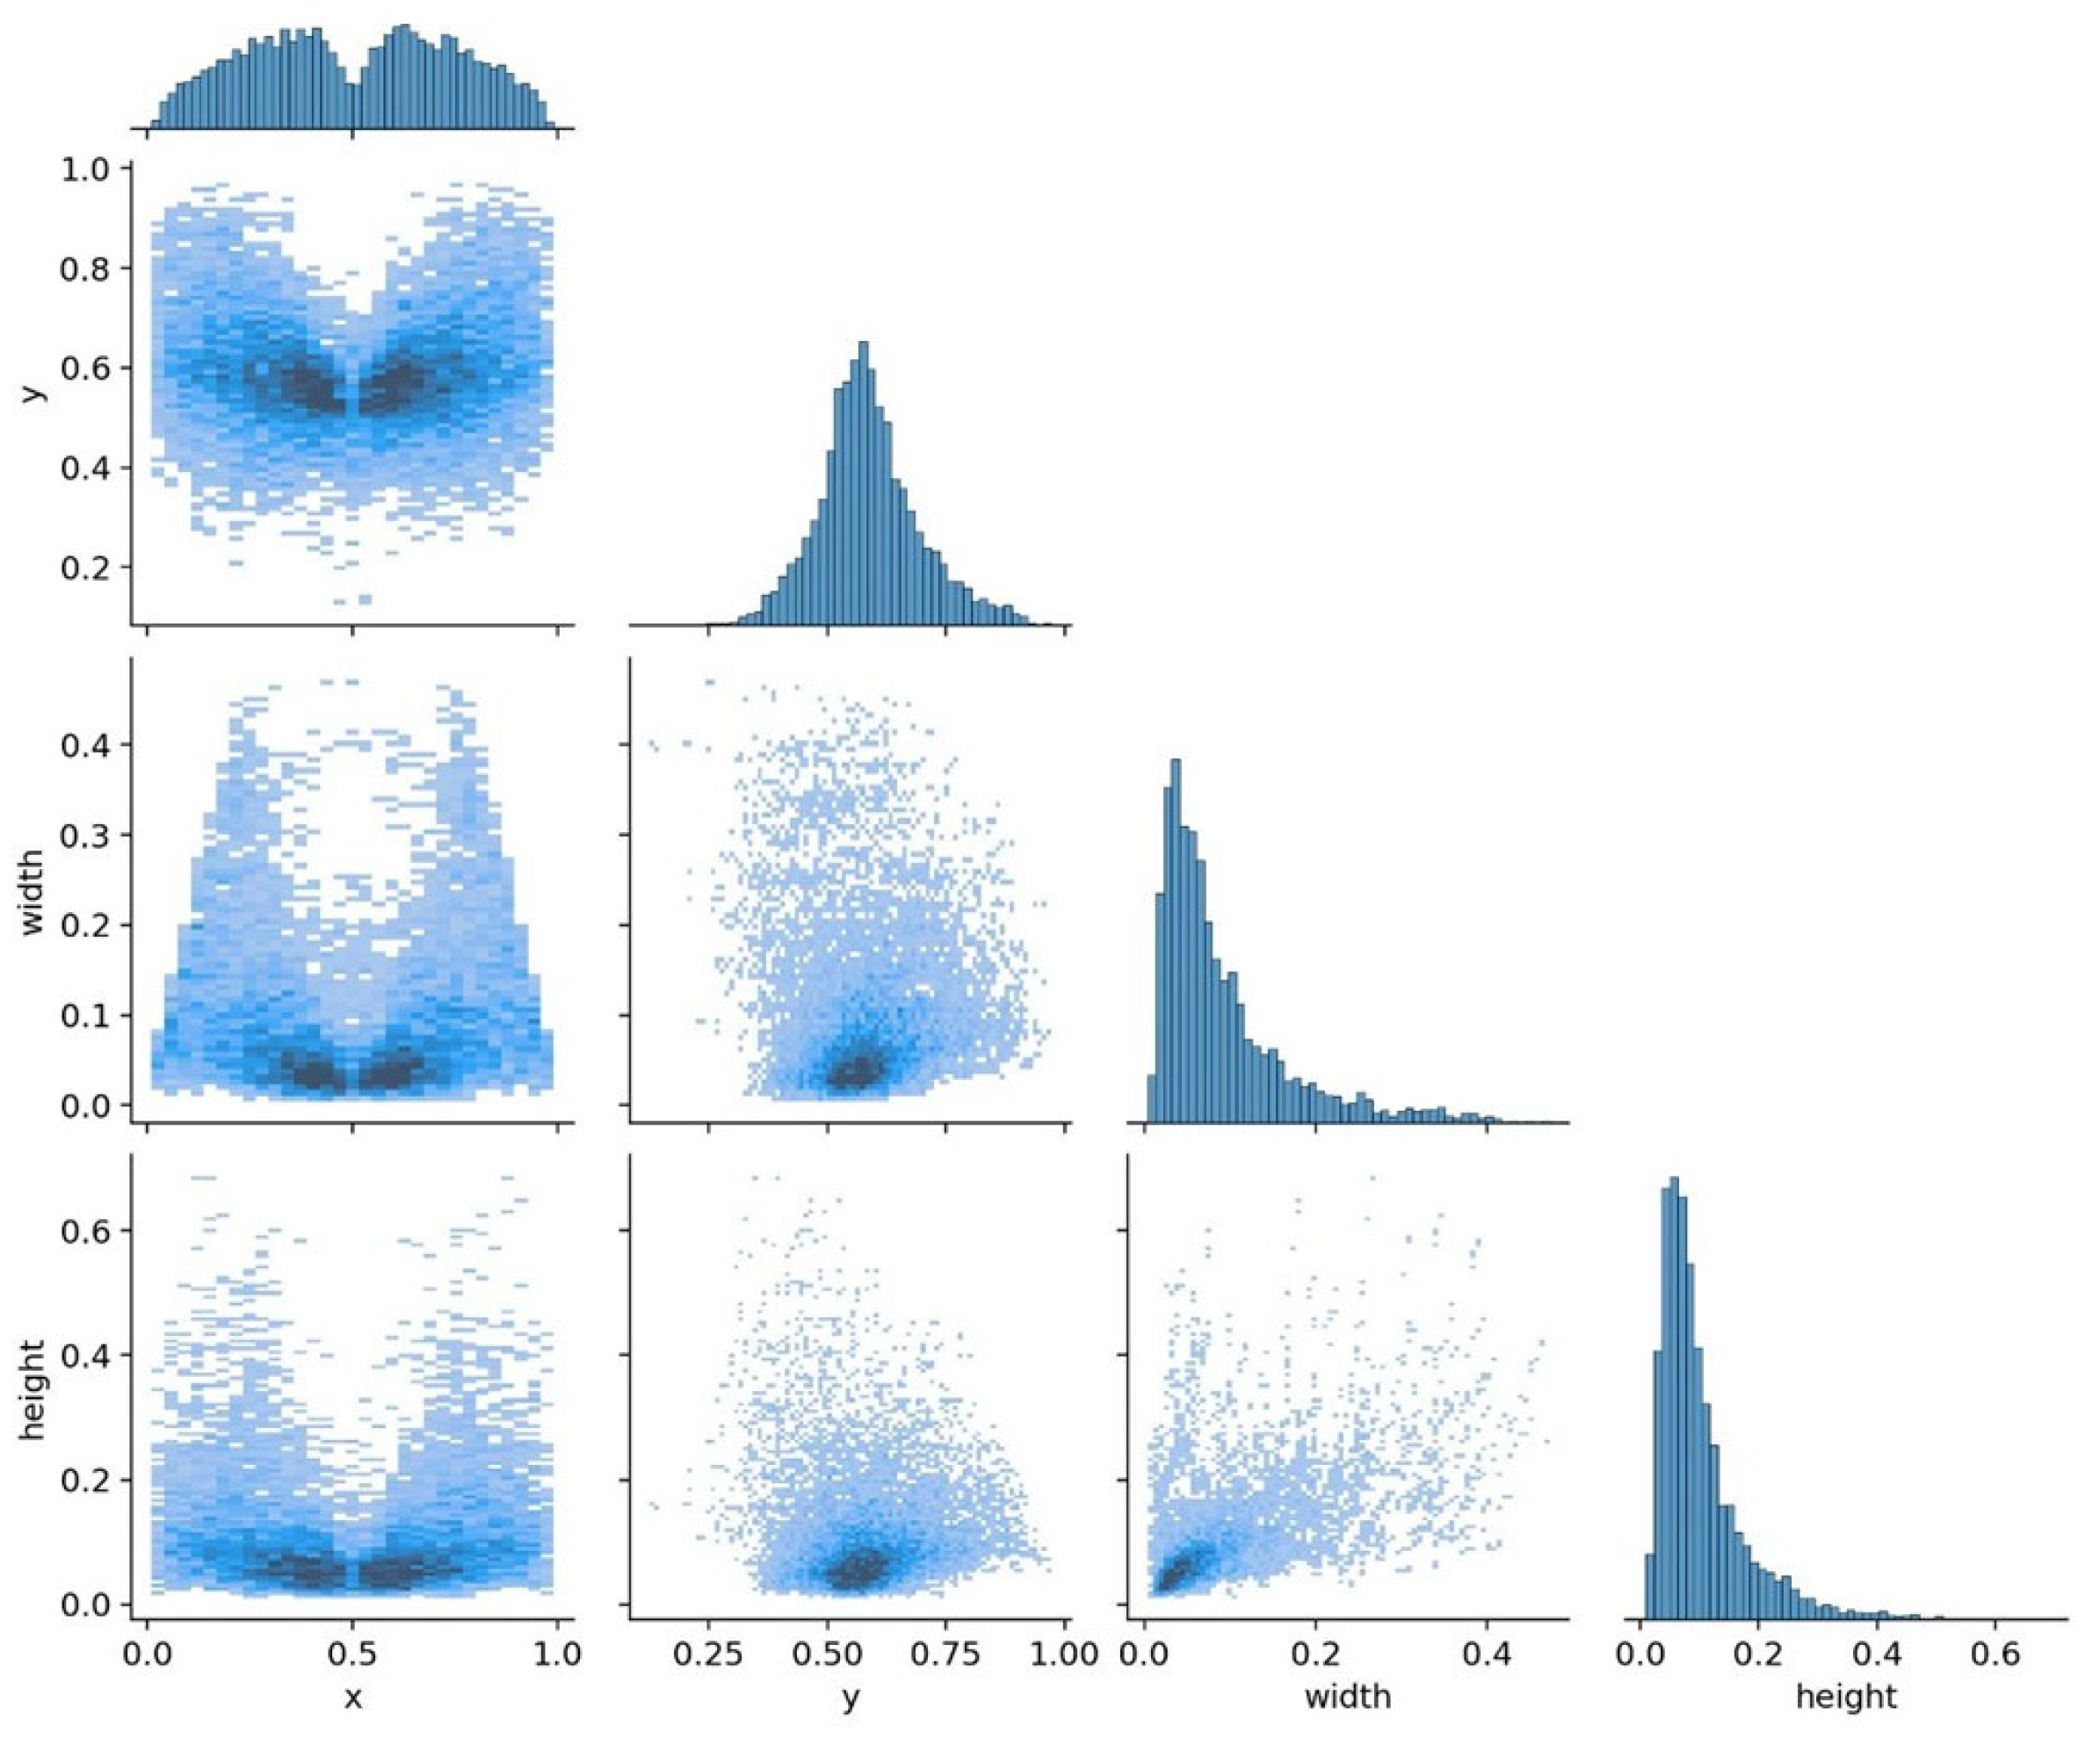
Figure 7 presents a comprehensive analysis of the annotated target distributions in the training dataset, based on scatter plots and histograms across four dimensions. The x-coordinate distribution of object centers shows a pronounced bimodal pattern, with peaks near 0.2 and 0.8. This spatial pattern reflects real-world conditions where slow-moving traffic bottlenecks—such as parked bicycles, roadside debris, or signage—typically occur along both sides of the street rather than in the central lane. The y-coordinate distribution is concentrated in the range of 0.4–0.7, which is consistent with ground-level elements captured by street view cameras. Both the width and height distributions of annotated targets exhibit right-skewed characteristics, indicating a predominance of small-scale objects, such as trash bins, utility poles, and shared bicycles—elements commonly found in slow-moving traffic bottleneck scenarios. Overall, the high-quality annotation, reasonable target size variation, and well-distributed object positions provide a solid foundation for deep learning feature extraction, ensuring the effectiveness of YOLOv5 in identifying diverse bottleneck factors in complex urban street environments.
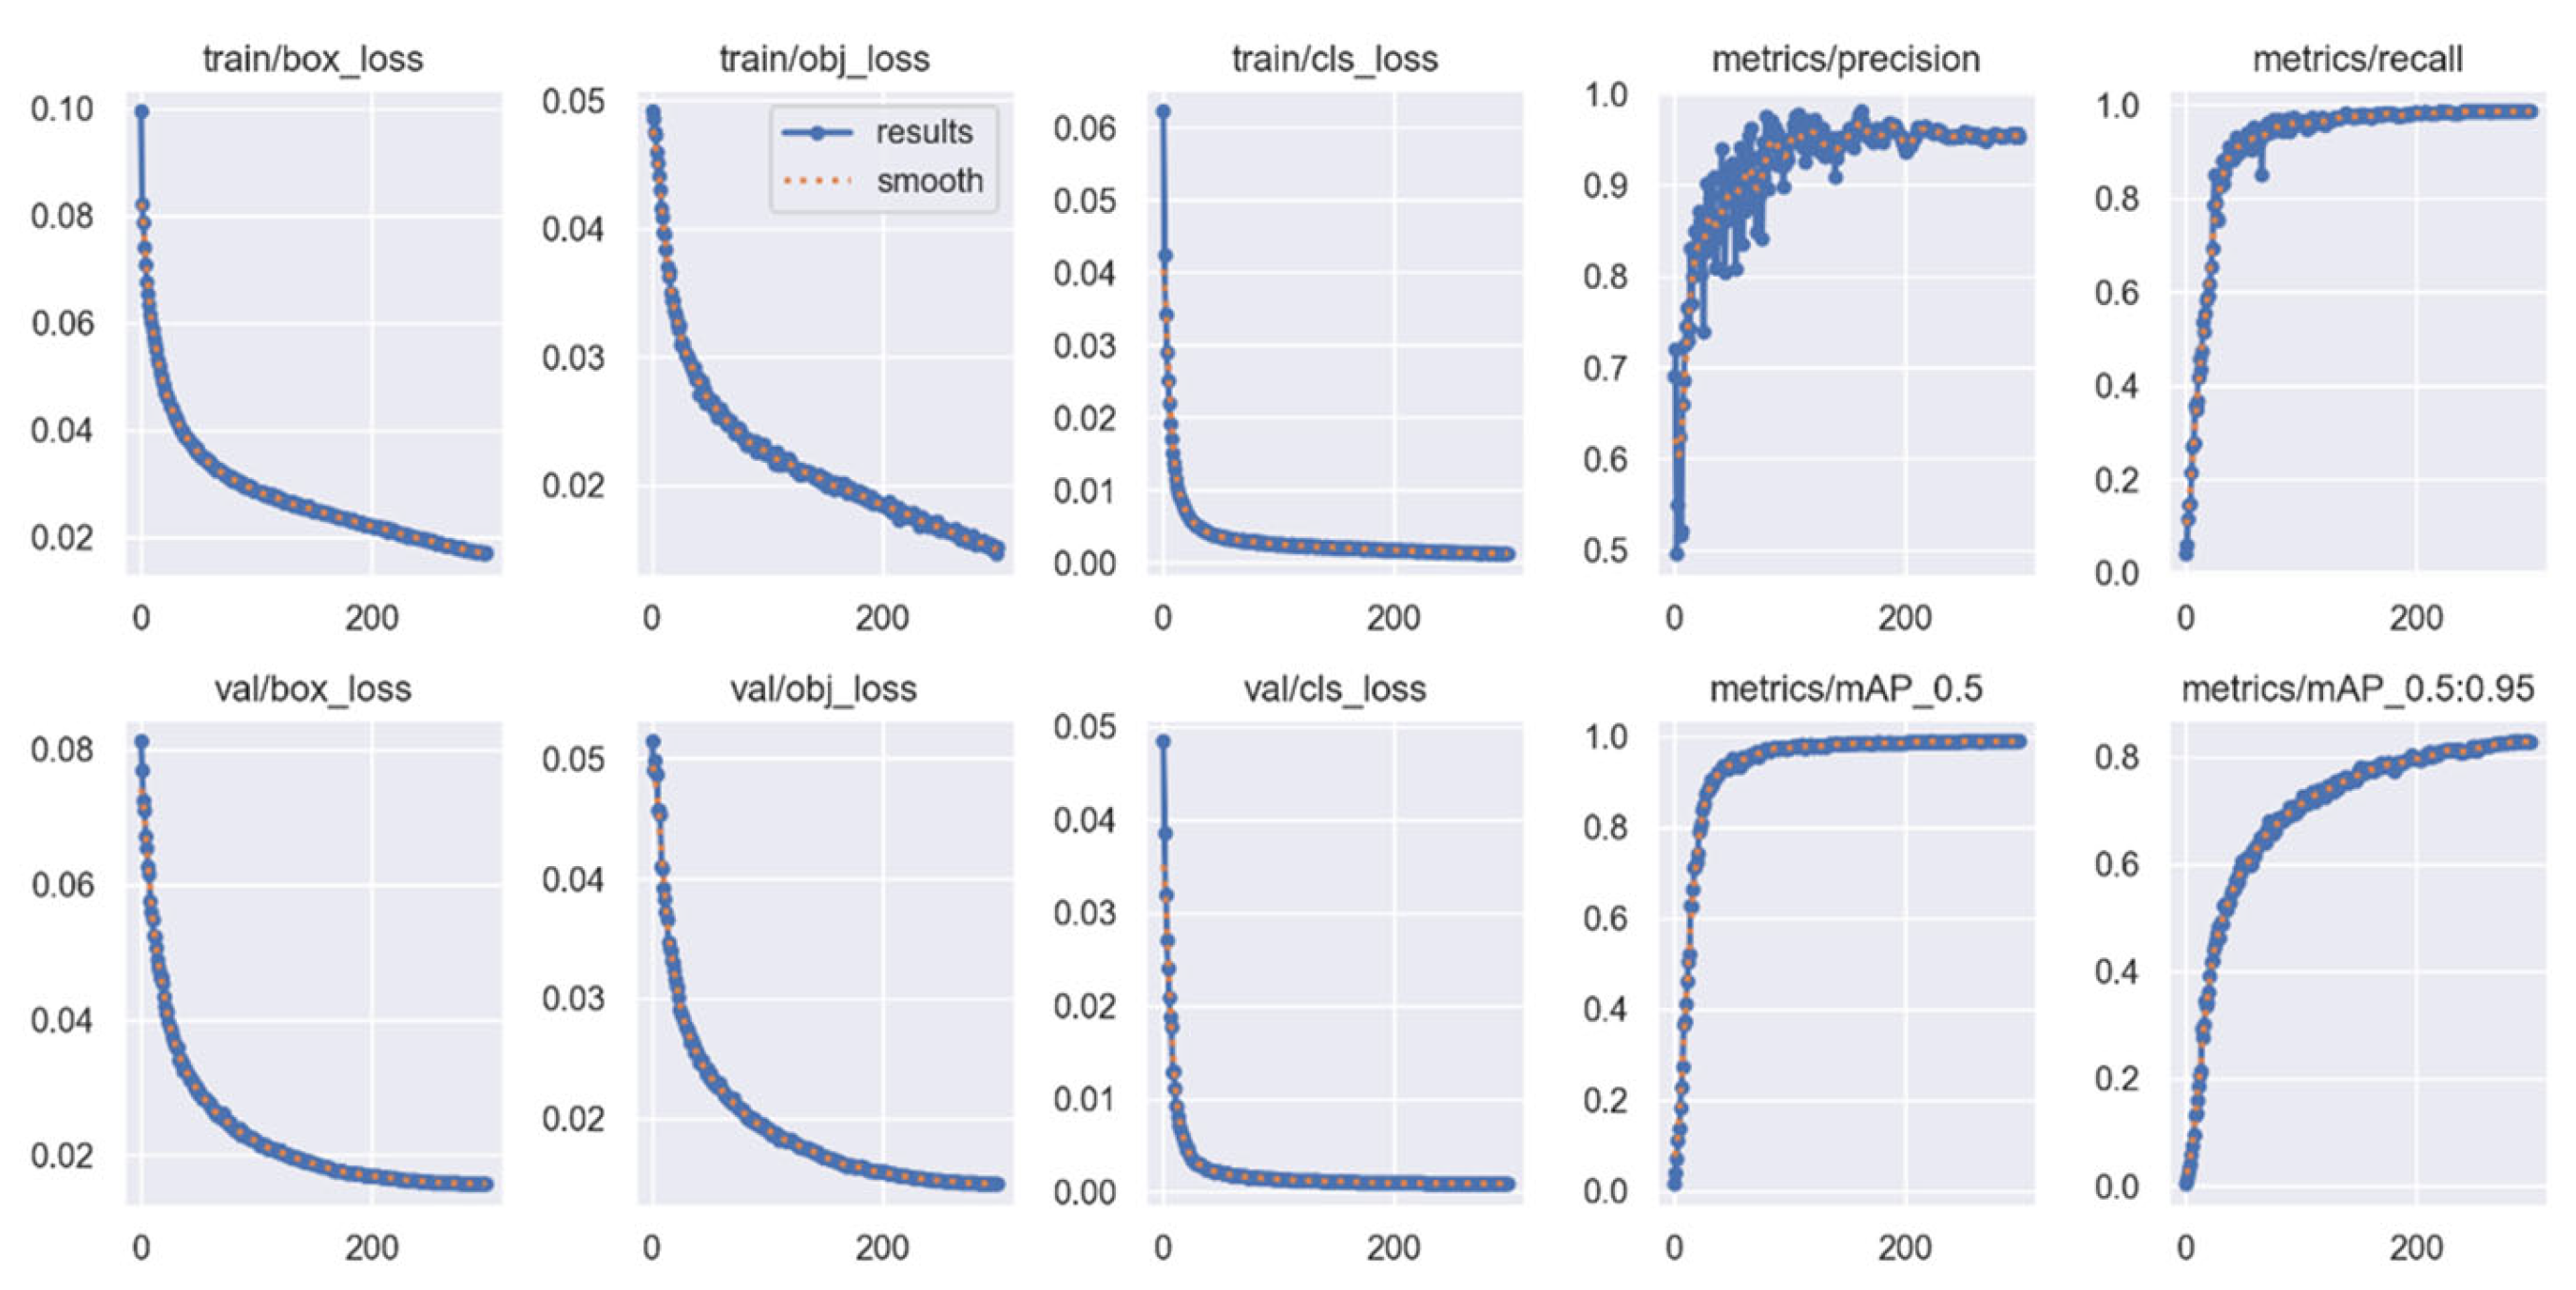
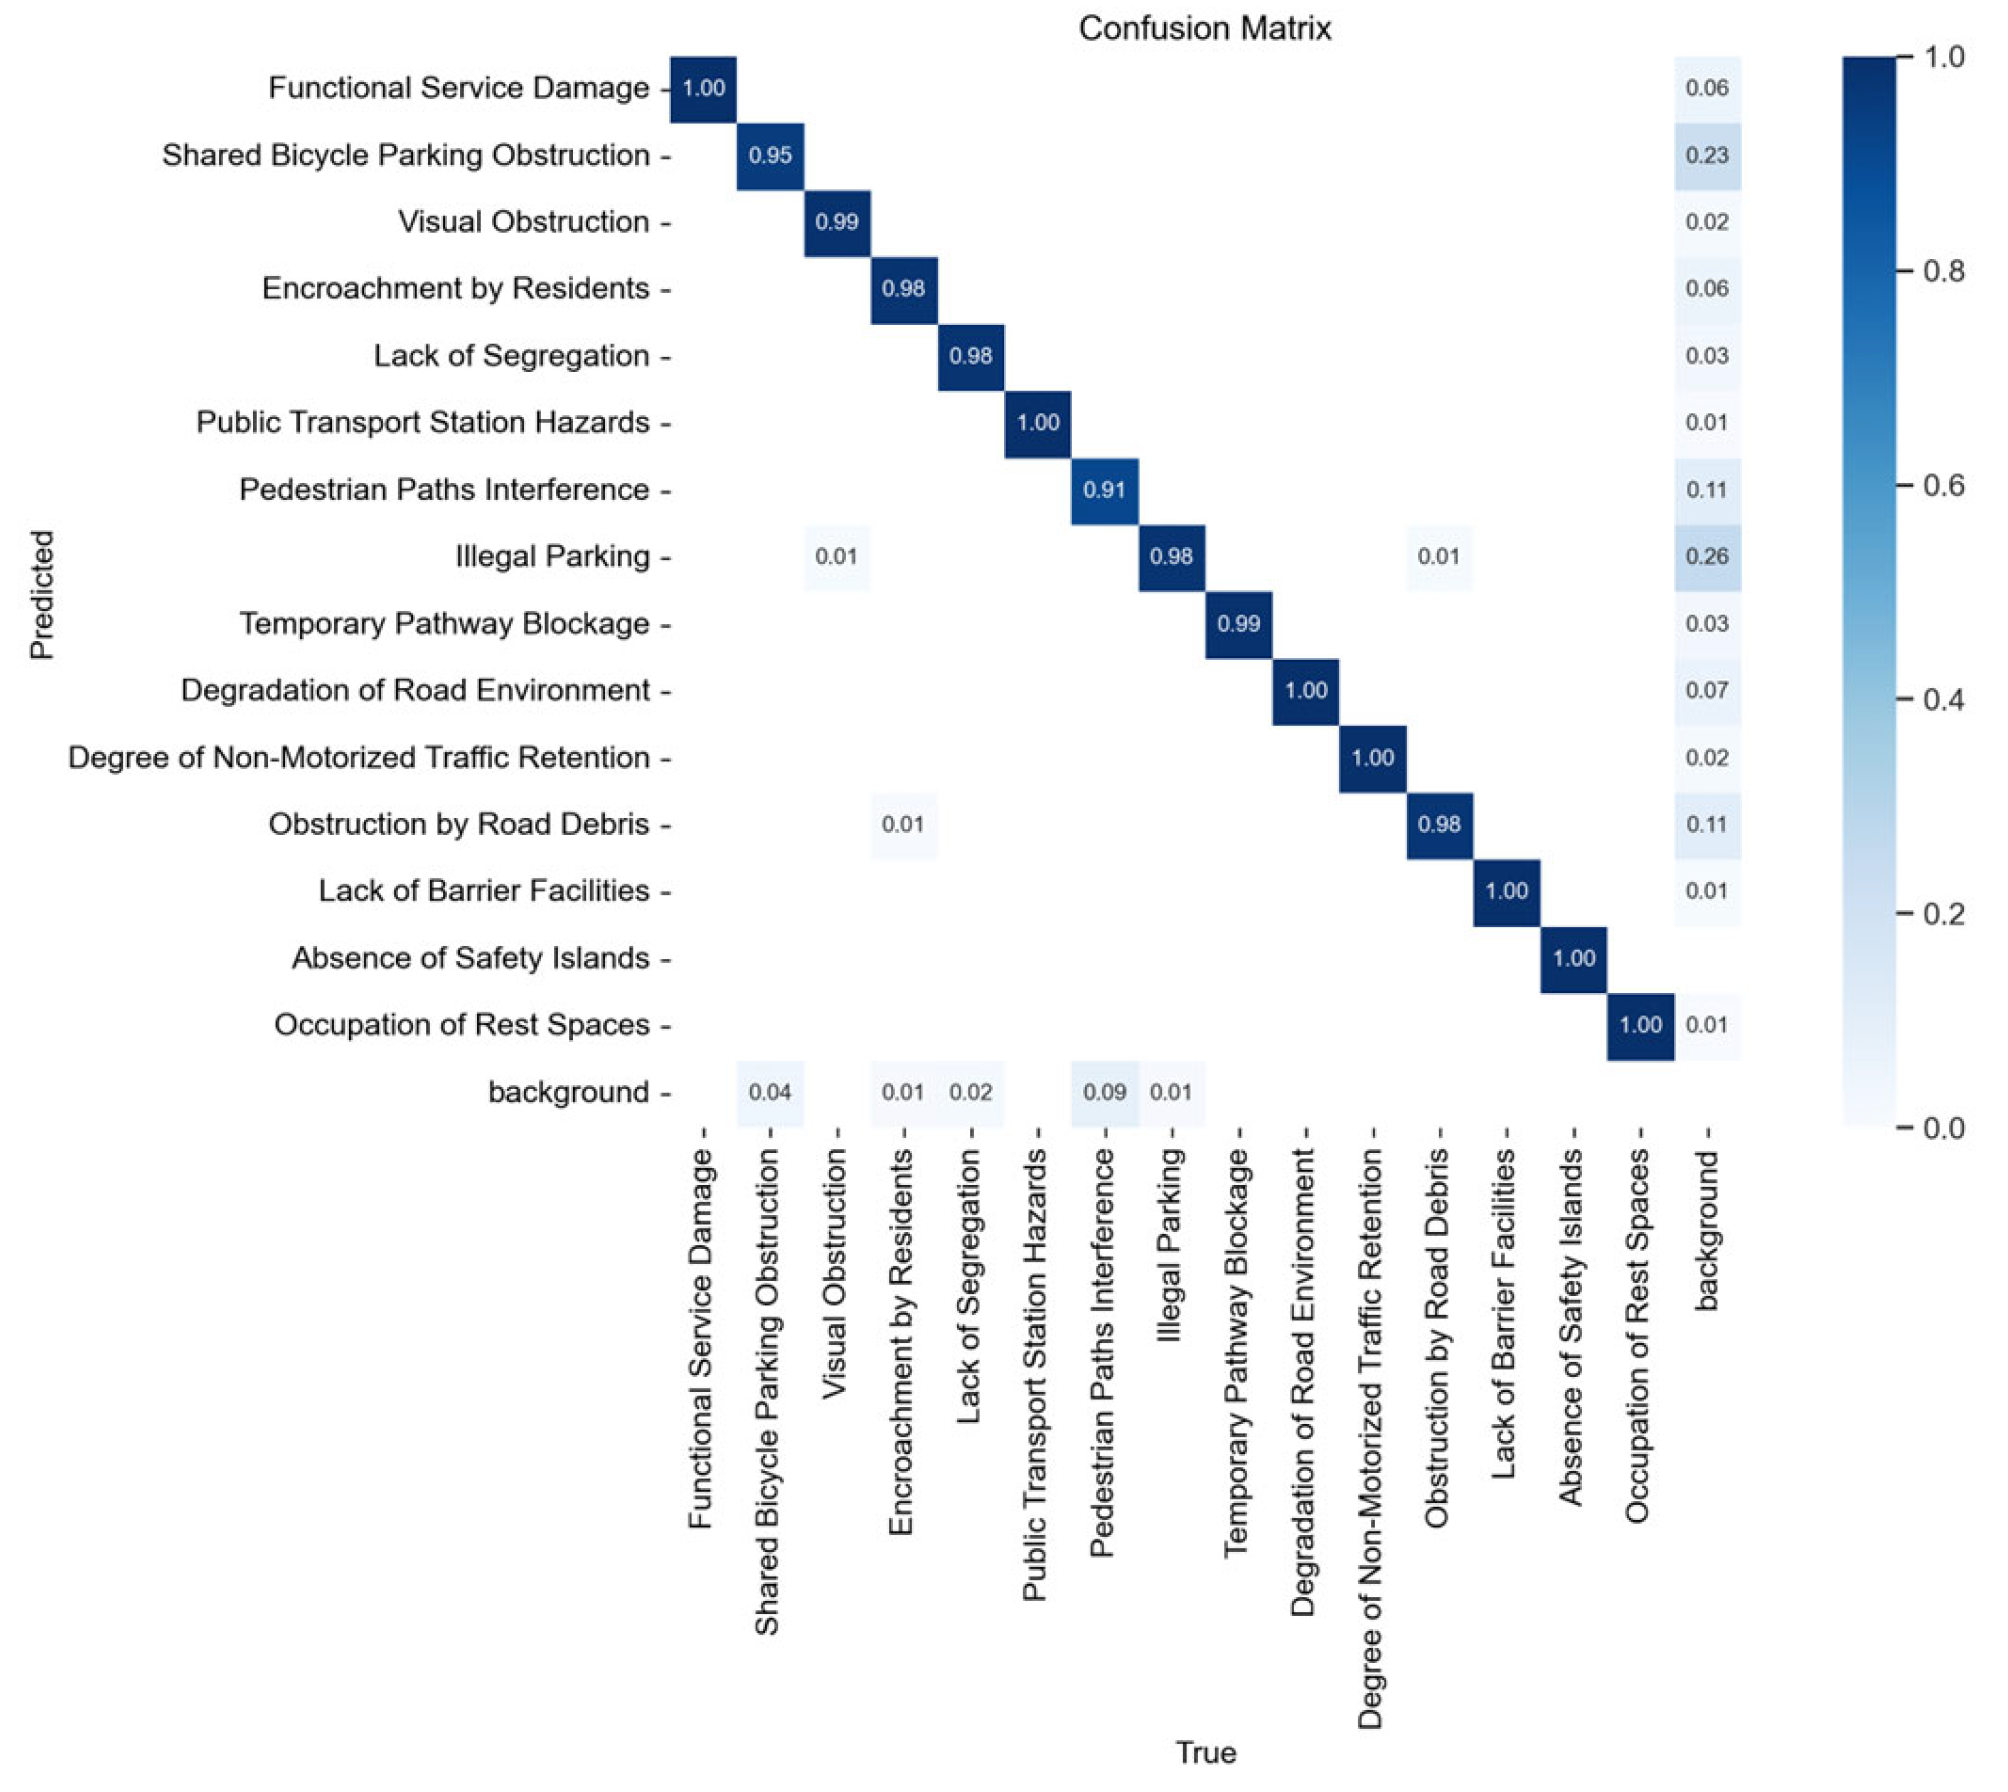
As the spatial attribute values gradually stabilize during model fitting, Figure 8 documents the evolution of the YOLOv5 model’s loss functions and performance metrics over 300 training epochs. The training and validation loss curves indicate a stable and consistent convergence process. Specifically, the bounding box loss (box_loss) steadily decreases from an initial value of 0.1 to approximately 0.02; the objectness confidence loss (obj_loss) declines from 0.08 to 0.015; and the classification loss (cls_loss) drops from 0.06 to nearly zero. All three loss functions exhibit smooth convergence trends, and the validation losses closely follow the training losses, indicating a stable training process without overfitting. In terms of performance, the model demonstrates strong learning ability and generalization. The precision stabilizes above 95% during the later stages of training, while the recall also remains at a high level of around 95%, reflecting the model’s capacity to detect bottleneck elements accurately and completely. The mean Average Precision (mAP) at IoU = 0.5 reaches 98%, and the mAP@0.5:0.95 metric achieves 75%, confirming the model’s effectiveness across a range of intersection-over-union thresholds. Analysis of the confusion matrix further reveals that misclassification primarily occurs between visually similar categories. For example, “residential encroachment” was occasionally misclassified as “temporary blockages,” and “damaged facilities” sometimes overlapped with “obstacles” such as roadside debris. However, the frequency of such errors remained below 5% for all classes, indicating that while category boundaries can blur in complex street scenes, their overall impact on model reliability is minimal.
These results collectively validate the model’s excellent performance in identifying slow-moving traffic bottlenecks in complex urban street environments, demonstrating both high detection accuracy and robust generalization ability.

4.3. Model Performance and Results Analysis

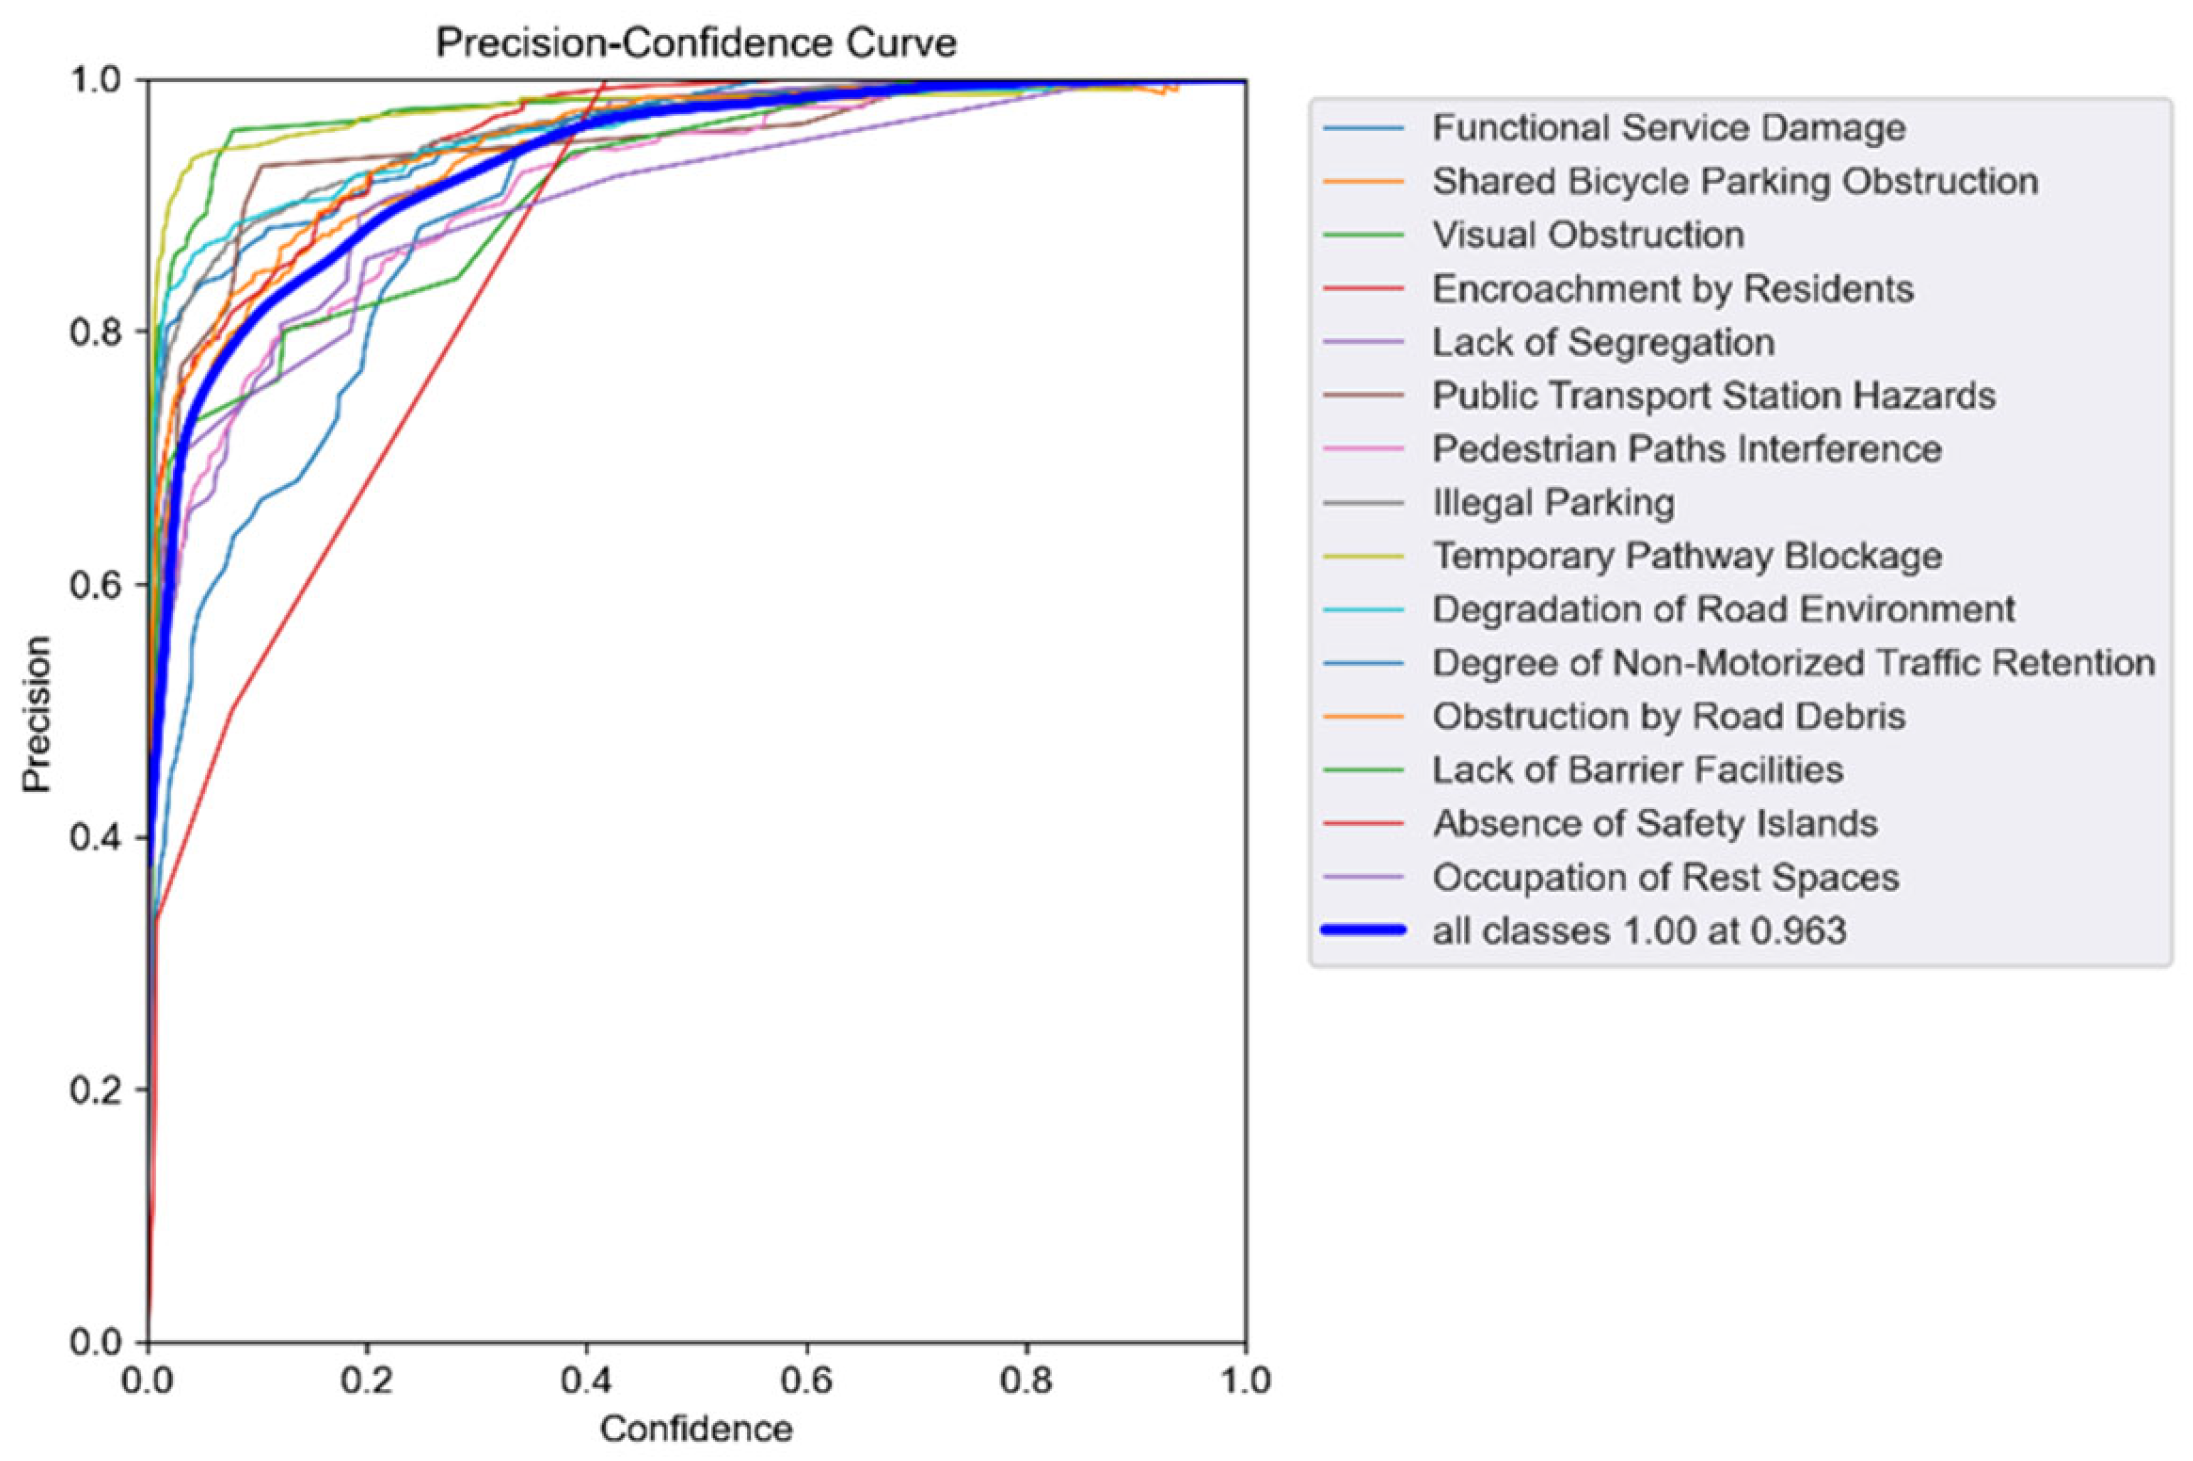
On the test dataset, the YOLOv5 model achieved an overall mean Average Precision (mAP)@0.5 of 0.989, demonstrating excellent accuracy in detecting slow-moving traffic bottlenecks. Figure 9 presents the variation in detection accuracy across different categories under varying confidence thresholds. The x-axis represents the confidence threshold (ranging from 0 to 1), while the y-axis shows the corresponding accuracy (also from 0 to 1). The thick blue line depicts the aggregated performance across all 15 categories, reaching perfect accuracy (100%) at a confidence threshold of 0.963. The thin colored lines represent the detection performance of individual bottleneck types. From the overall trend, it is evident that most categories maintain accuracy rates above 90% within the 0.4–0.6 confidence interval, indicating that the model consistently delivers high-quality predictions even at moderate confidence levels. The steepness of the performance curves further indicates strong confidence calibration, enabling the model to effectively distinguish between correct and uncertain predictions. Furthermore, the small performance variance across different bottleneck types highlights the model’s balanced recognition ability and strong generalization across a diverse set of slow traffic bottleneck scenarios. These findings provide valuable guidance for selecting appropriate confidence thresholds in real-world deployment to balance detection precision and recall.
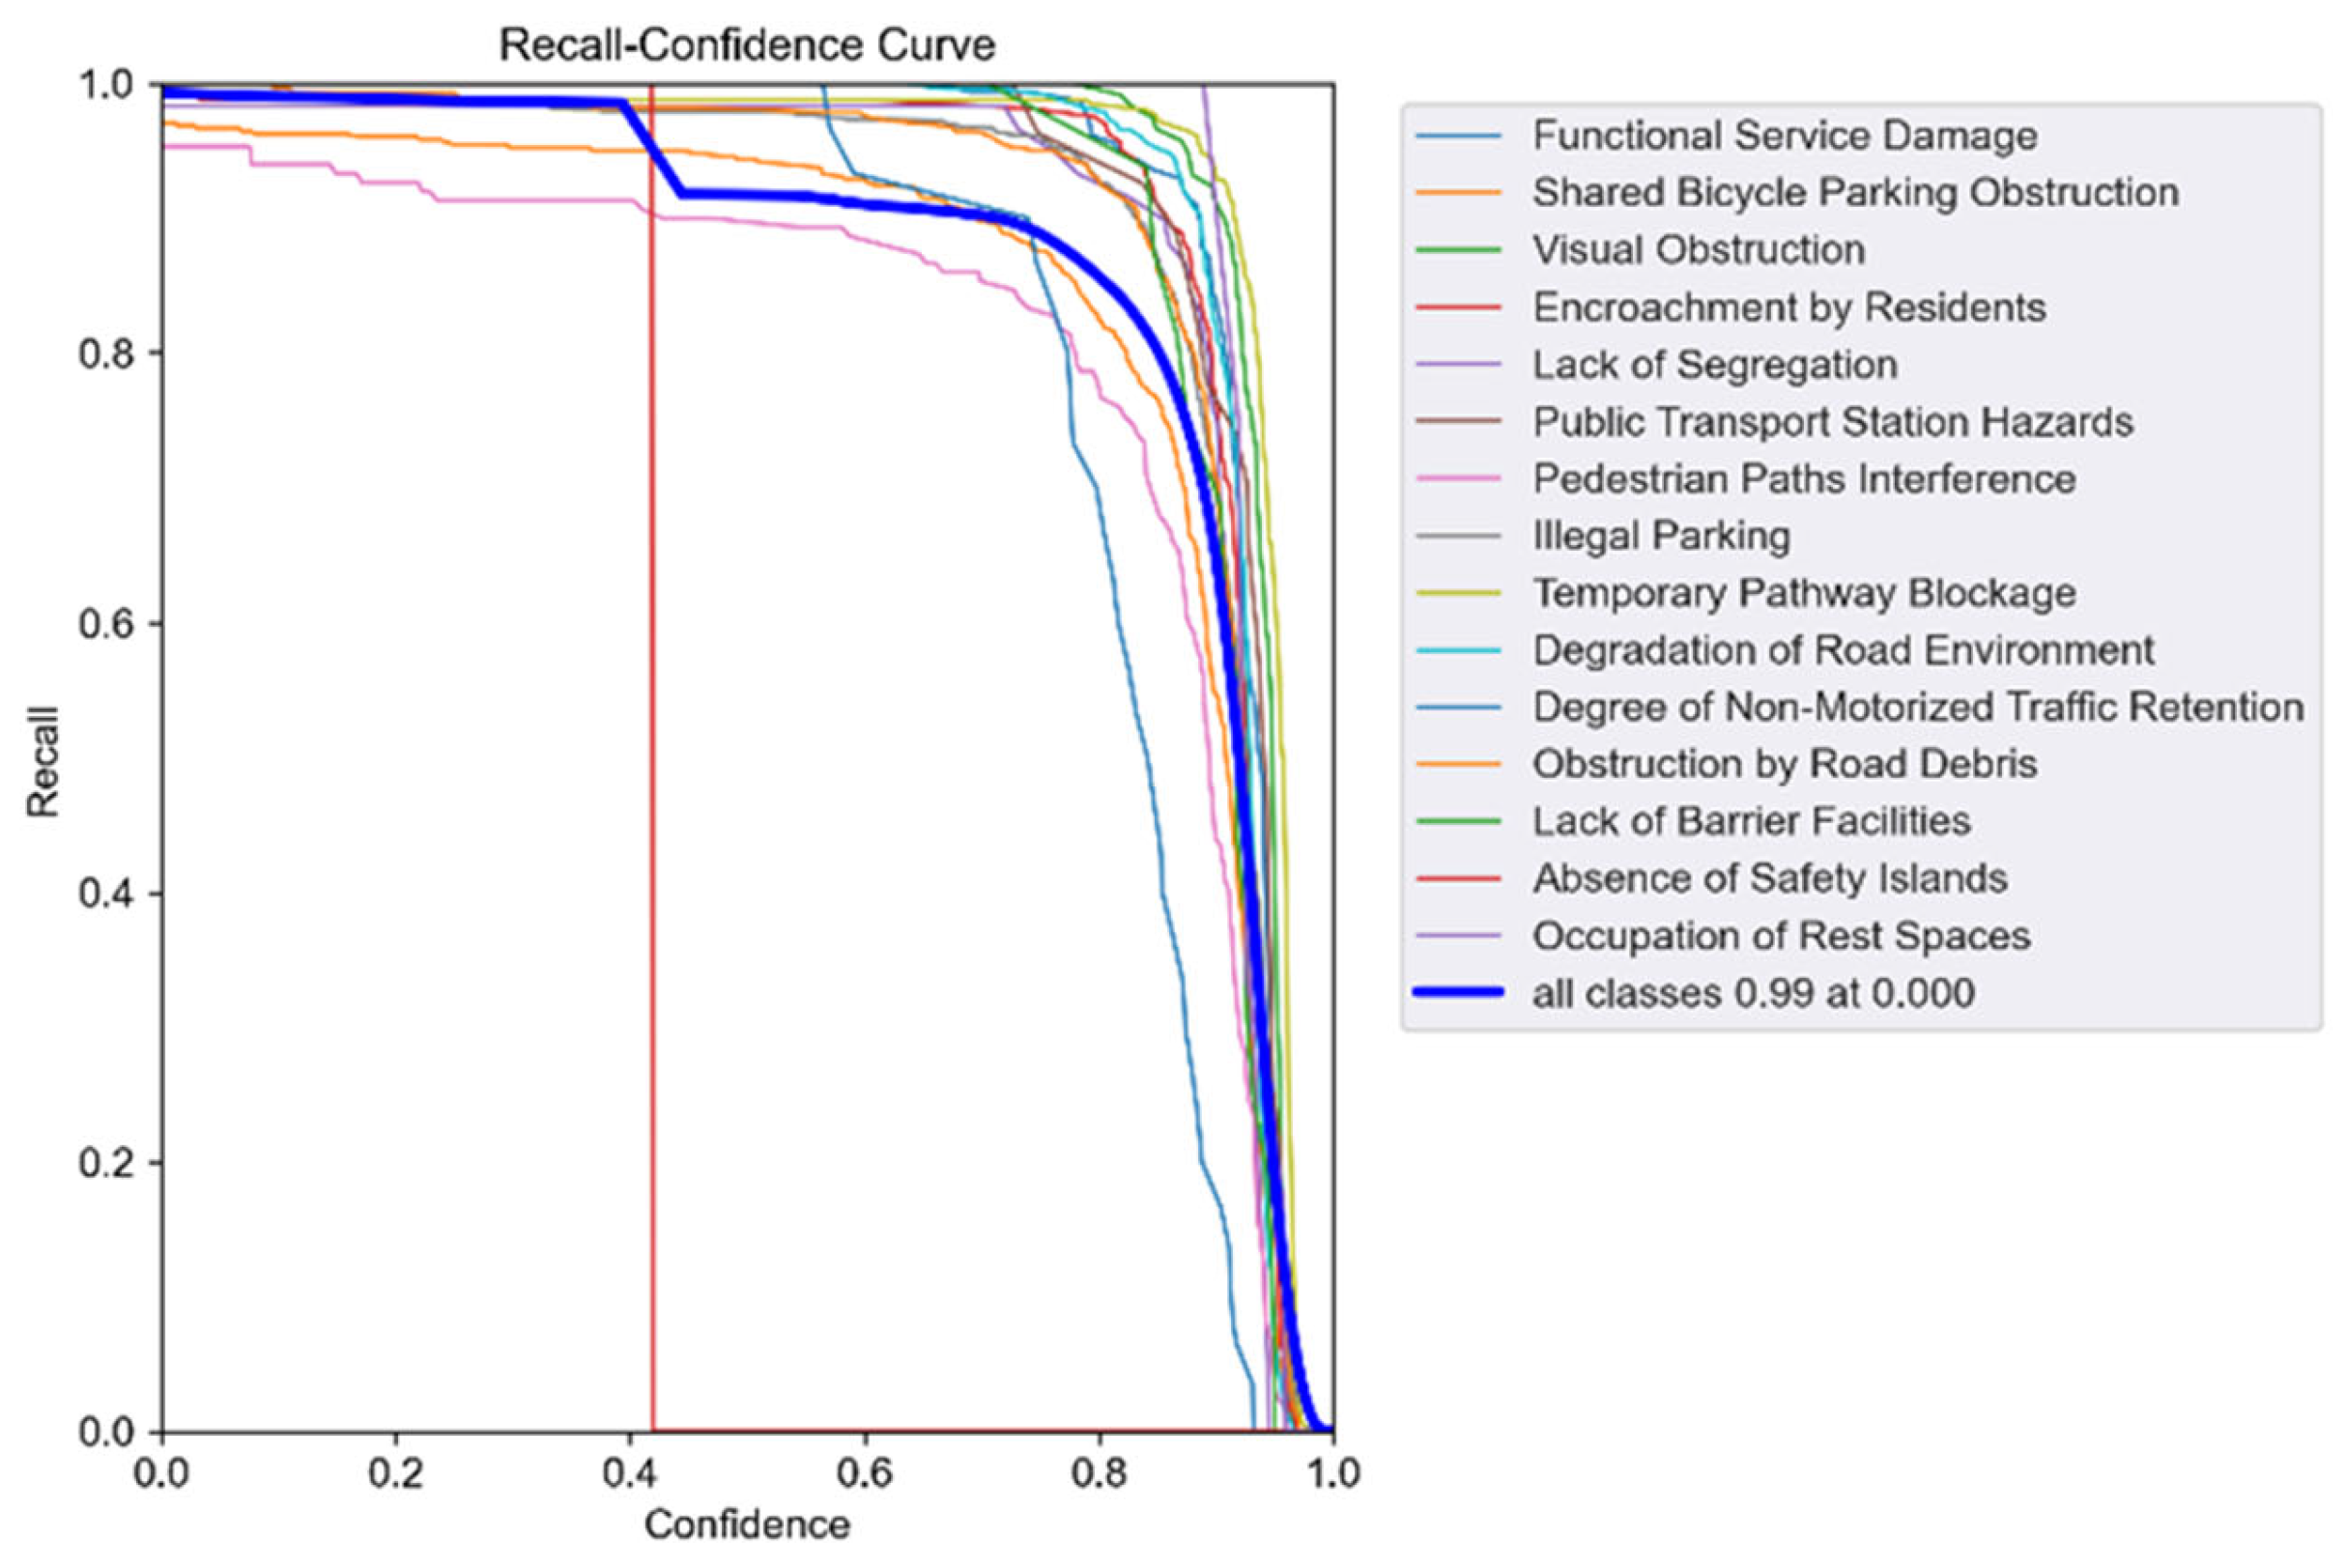
Figure 10 illustrates the variation in recall rates across different bottleneck categories under varying confidence thresholds, reflecting the model’s performance consistency throughout the evaluation stages. The overall recall curve displays a typical monotonically decreasing trend: at a confidence threshold of 0.0, the recall rate approaches 100%, indicating that the model successfully detects the majority of true positive instances. As the confidence threshold increases, the recall rate gradually decreases, since higher thresholds filter out some low-confidence but valid detections. The thick blue line represents the aggregated recall across all categories. Notably, the model achieves an overall recall of 99% at a confidence threshold of 0.000, suggesting an extremely low false-negative rate and high sensitivity to actual bottleneck elements. As the confidence threshold reaches the 0.6–0.8 range, the recall curves for different categories begin to diverge. While some categories maintain relatively stable recall rates even under stricter thresholds, others show greater sensitivity, with recall performance dropping more sharply. These differences highlight the model’s category-specific response to confidence filtering, offering an important reference for setting adaptive, category-specific confidence thresholds in real-world applications where the balance between precision and recall must be fine-tuned.
Figure 11 presents the classification accuracy matrix (confusion matrix) for the 15 identified types of slow-moving traffic bottlenecks. The diagonal elements represent the correct classification rates for each category, while the off-diagonal elements reflect instances of misclassification between different categories. As shown in the matrix, all diagonal values are close to 1.0 and are visually marked in dark blue, indicating that the model achieves outstanding recognition accuracy (above 95%) across all categories. Notably, categories such as deteriorated functional service facilities, obstructed shared bicycle parking, and visual obstructions exhibit recognition accuracies approaching 99%, reflecting the model’s strong ability to detect features with distinct and consistent visual patterns. The off-diagonal elements are generally below 0.05 and rendered in lighter shades, indicating a very low frequency of misclassification. Only slight confusion is observed between a few visually similar categories, such as certain forms of encroachment and temporary blockages. These minor errors are expected in complex urban street scenes with overlapping features. Overall, the results from the confusion matrix further confirm the robustness, precision, and generalization capability of the YOLOv5 model in multi-class object detection tasks involving complex and fine-grained street-level bottleneck elements. This provides a reliable and high-quality foundation for subsequent spatial clustering and effect analyses.

4.4. Spatial Heterogeneity and Influencing Factors of Slow-Moving System Bottlenecks

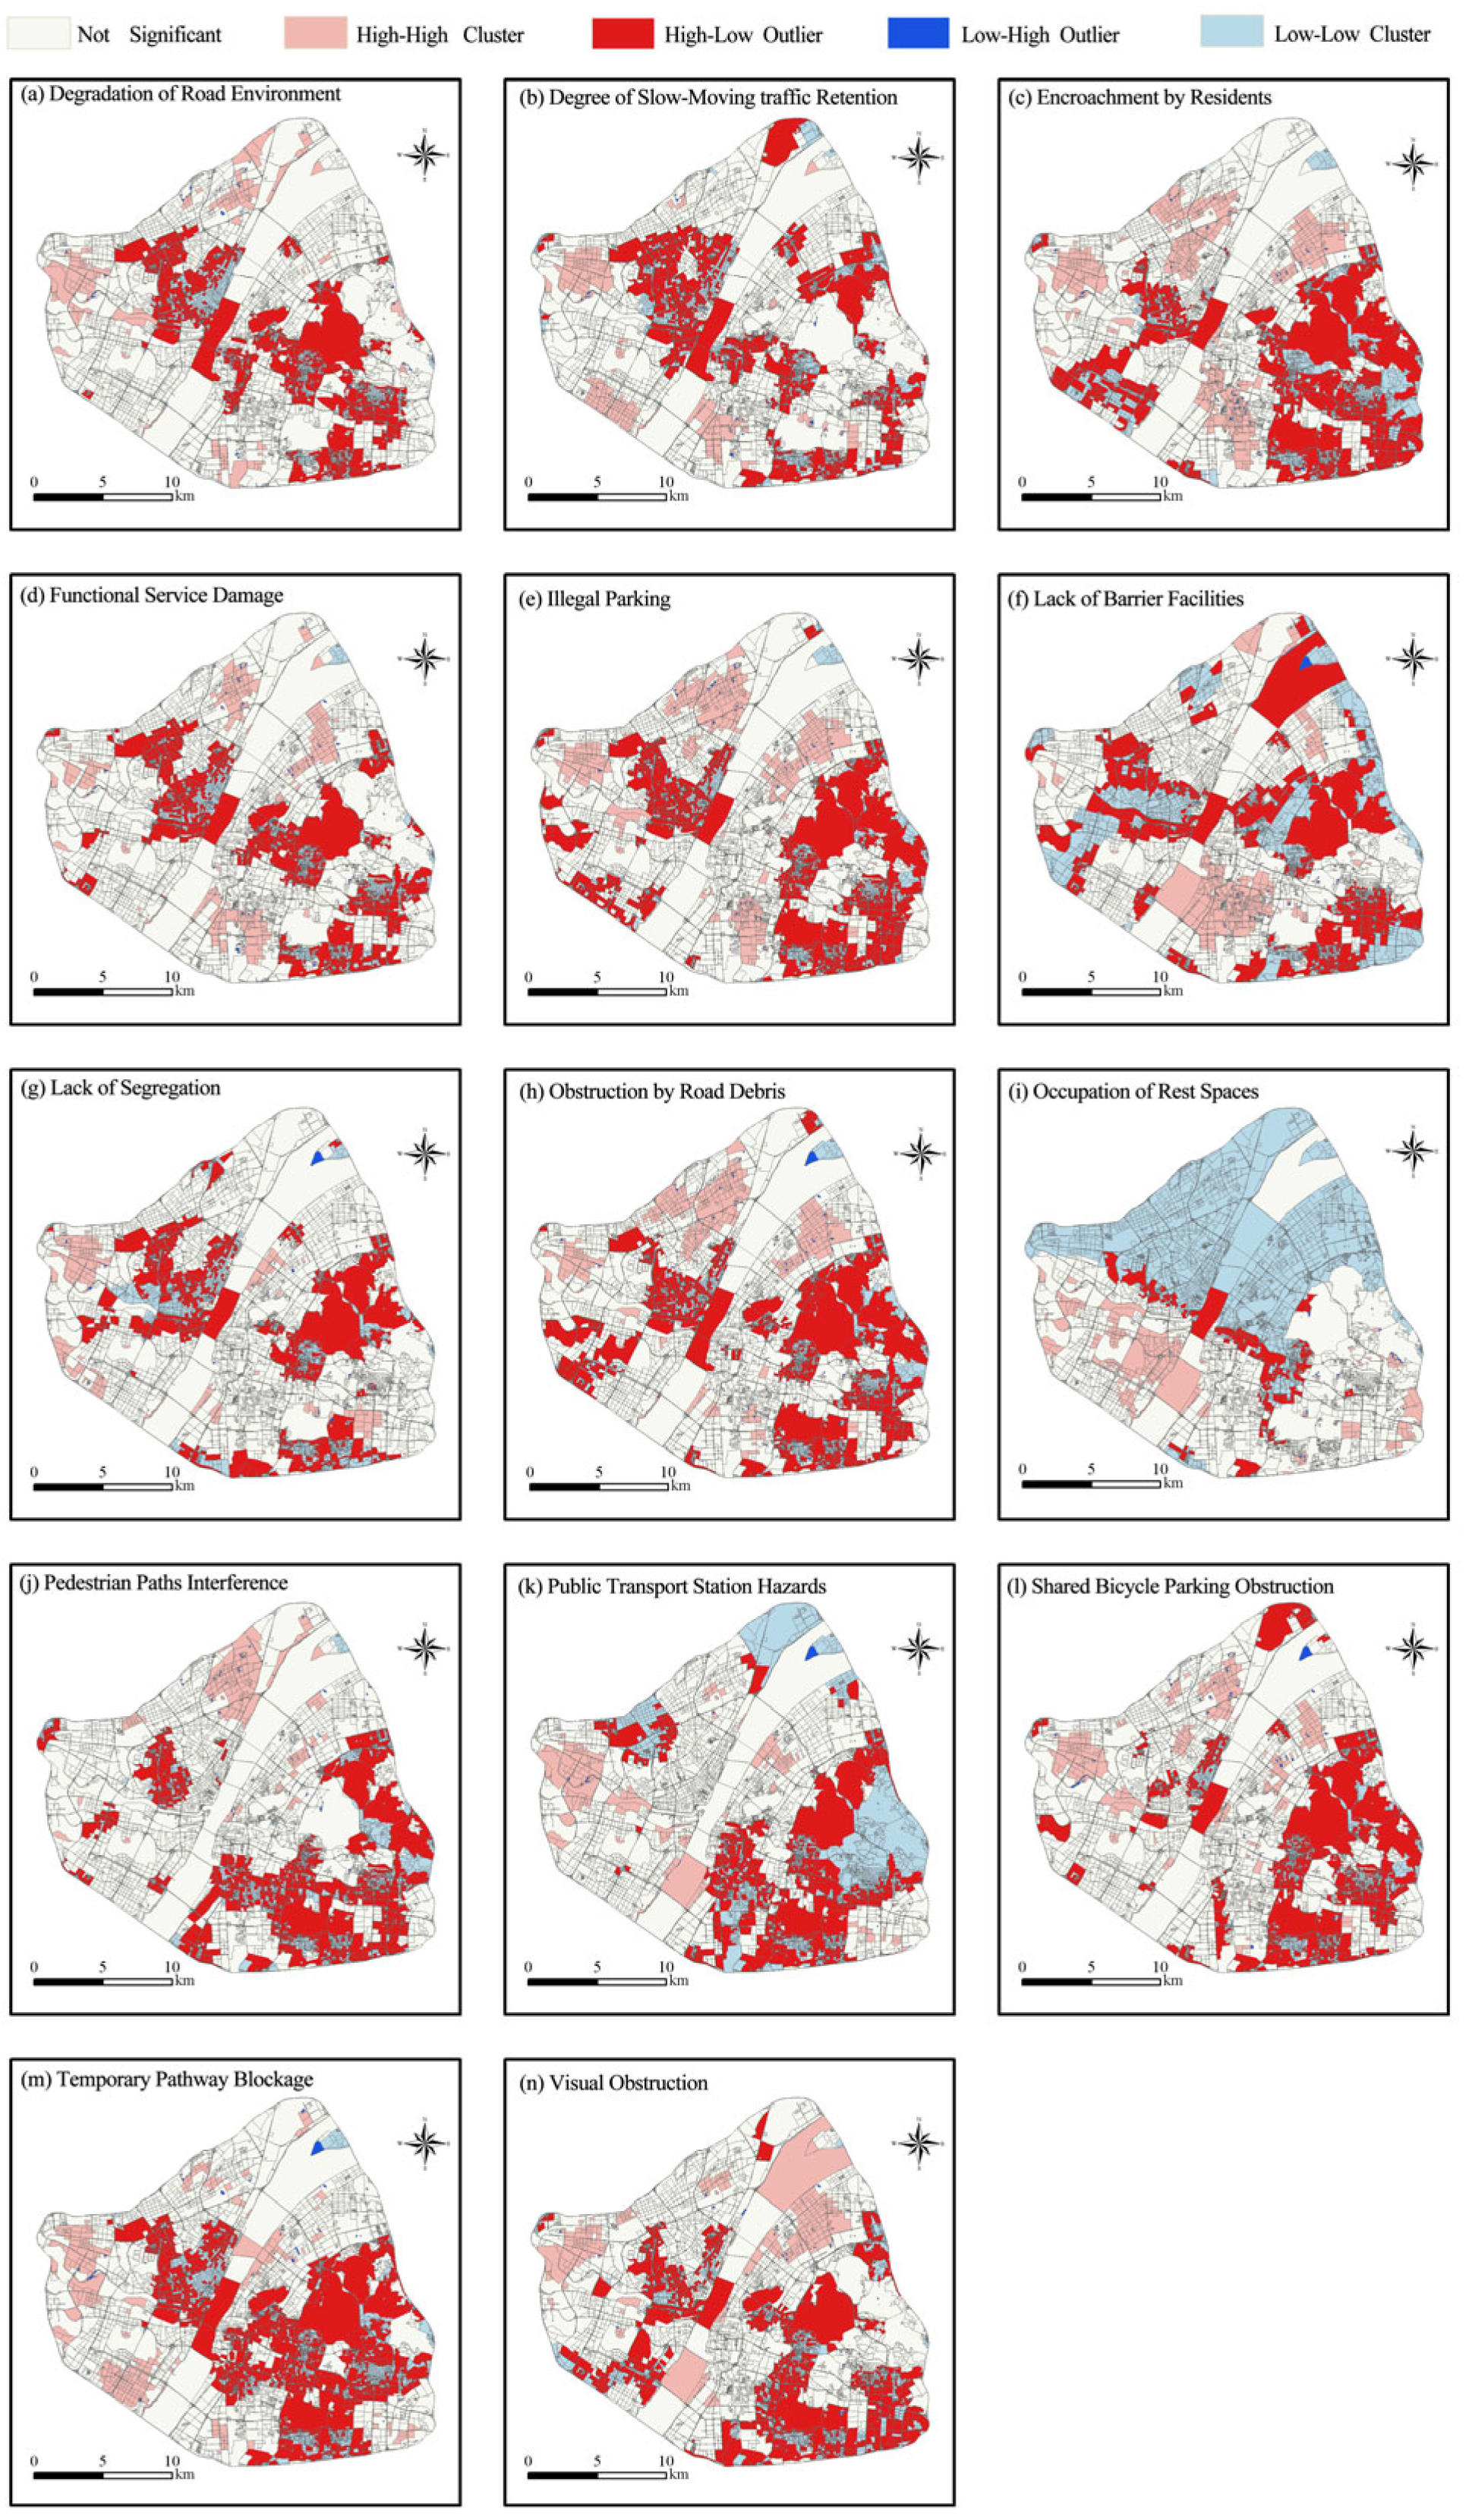
To analyze the spatial distribution characteristics of slow-moving traffic bottlenecks within the Third Ring Road of Wuhan, this study employed the global Moran’s I index to examine spatial autocorrelation across neighborhoods. Based on local indicators of spatial association (LISA), bottlenecks were classified into five spatial clustering patterns: High-High Cluster, High-Low Outlier, Low-High Outlier, Low-Low Cluster, and Not Significant. These categories were mapped using a color-coded scheme to illustrate regional differences and visualize spatial correlations of slow-moving traffic issues [57]. As shown in Figure 12, the spatial clustering patterns of 14 bottleneck types were derived using LISA. Dark red indicates High-High Clusters, where a given area experiences severe bottlenecks and is surrounded by similarly affected areas, highlighting concentrated hotspots. Light red represents High-Low Outliers, or problem-intensive areas embedded in relatively problem-free surroundings. Dark blue denotes Low-High Outliers, where low-problem areas are surrounded by high-problem zones, possibly reflecting resilience or stronger governance under external pressure. Light blue corresponds to Low-Low Clusters, where both the area and its surroundings exhibit low bottleneck density. White regions show no significant spatial correlation, indicating random or isolated distribution.
The analysis reveals several key patterns. Road surface degradation, slow-moving traffic congestion, and residential encroachment display clear High-High clustering in the southeast, pointing to persistent infrastructure and governance deficiencies. Of particular concern are the absence of safety islands and pedestrian walkway obstructions, which cluster most densely in this region, highlighting acute weaknesses in traffic safety infrastructure. In contrast, recreational space occupation tends to form Low-Low Clusters in the north, reflecting more effective spatial design and management. Illegal parking and shared bicycle obstructions are more dispersed overall, but form distinct clusters near major commercial areas and transit hubs, revealing pressure points in zones of high human and vehicle activity. These findings suggest that the spatial heterogeneity of slow-moving traffic bottlenecks is shaped by the interplay of infrastructure quality, urban design, policy enforcement, and land use intensity. The results provide a strong empirical basis for targeted interventions, such as priority improvement zones and differentiated street governance strategies.
This spatial heterogeneity analysis provides a scientific foundation for urban management departments to develop differentiated governance strategies. High-High Cluster areas require systematic and comprehensive interventions, High-Low Outliers can be addressed through targeted measures, while Low-Low Cluster areas should maintain current management standards and be promoted as best-practice cases. All clustering patterns passed rigorous statistical significance tests (p < 0.05), with typical High-High Clusters in the southeastern sector exhibiting Z-scores above 2.3, and Low-Low Clusters in the northern districts showing Z-scores around −2.1, confirming the robustness of the spatial clustering results. The spatial distribution of slow-moving traffic system bottlenecks in the study area demonstrates pronounced High-High and Low-Low clustering, reflecting disparities in infrastructure planning, management intensity, and population density across different regions.
Based on the 15 analysis indicators, statistically significant clustering patterns of slow-moving traffic bottlenecks were observed across Wuhan’s Third Ring Road. High–High Clusters are mainly concentrated in the southeastern, southern peripheral, and parts of the central regions. Hazards related to public transport stations—such as poor safety design and visual obstruction—form extensive High–High Clusters in the southeastern and southern peripheral areas (Z = 2.5, p < 0.01). Shared bicycle parking obstructions are most prevalent in the central and southern high-demand zones (Z = 2.1, p < 0.05), while pedestrian path obstructions are widespread in the south and southeast (Z = 2.4, p < 0.05), reflecting high traffic volumes and suboptimal street design. Temporary pathway blockages are concentrated in the eastern area (Z = 2.0, p < 0.05), and visual obstructions cluster at the southeastern edge and in central districts (Z = 2.2, p < 0.05), indicating severe interference from billboards and illegal structures. Illegal parking shows a broad distribution, forming multiple high-value clusters in the central, southern, and eastern regions (Z = 2.3, p < 0.01), further exacerbating inefficiencies in the slow-moving system.
Conversely, Low–Low Clusters are predominantly located in the north and parts of the central region, where problems such as missing safety islands and damaged service facilities are relatively mild (Z ≈ −2.0, p < 0.05), reflecting higher infrastructure quality and stronger management capacity. Low values for slow-moving traffic congestion and resident encroachment are also concentrated in the north (Z ≈ −2.1, p < 0.05), suggesting lower traffic pressure and more effective governance. Beyond these cluster patterns, additional spatial heterogeneity is evident: shared bicycle obstructions and slow-moving traffic congestion display localized high-value clusters in central commercial zones, while visual obstructions and service facility damage are more prominent in southeastern and peripheral areas. These variations indicate that bottleneck formation is shaped not only by infrastructure quality and governance but also by population density, traffic intensity, and land use structure. Overall, the southeastern and southern peripheral areas—characterized by insufficient infrastructure and weak planning—emerge as the primary high-value bottleneck zones, while the northern and selected central areas—with well-developed facilities and orderly management—constitute low-intensity zones, offering instructive references for the targeted optimization of urban slow-traffic systems.

5. Discussion

5.1. Model Performance and Applicability Assessment

The YOLOv5 model achieved outstanding detection accuracy within Wuhan’s Third Ring Road, reaching an mAP@0.5 of 98.9% on 10,856 independent test images and outperforming Faster R-CNN (94.7%) and SSD (91.2%). Training was conducted for 100 epochs with a batch size of 16, learning rate 0.01, and SGD optimizer (momentum 0.937, weight decay 5 × 10⁴). To mitigate class imbalance across the 15 annotated bottleneck categories, rare classes (e.g., absence of safety islands) were augmented through Mosaic, rotation, and brightness perturbations, combined with focal loss weighting to reduce bias toward majority classes. The model demonstrated strong efficiency, processing a 640 × 640 image in 20 ms on an NVIDIA RTX 3080 GPU (10 GB VRAM) and 55 ms on an Intel i7-12700H CPU (32 GB RAM) under PyTorch 1.12.0 with CUDA 11.6. With a lightweight size of 7.3 MB (YOLOv5s), the network can be readily deployed on edge, mobile, or cloud platforms using ONNX, TensorRT, or OpenVINO frameworks. Generalization performance was robust, with less than 1.2% accuracy drop during peak traffic and nighttime conditions. Under adverse weather, the model maintained high accuracy (mAP@0.5: 97.8% in rain/snow, 97.1% in haze), validating the effectiveness of augmentation strategies for environmental adaptation. Overall, YOLOv5 provides a fast, accurate, and transferable solution for large-scale street scene analysis and bottleneck detection in complex urban environments.

5.2. Analysis of the Spatial Distribution Patterns of Slow-Moving Traffic Bottlenecks

In this study, the global Moran’s I index was employed to investigate the spatial correlations and distribution patterns of slow-moving traffic bottlenecks across the study area, based on 15 representative indicators. The results revealed a significant positive spatial autocorrelation of bottleneck problems within the Third Ring Road of Wuhan, manifesting as a distinct hotspot–cold spot distribution pattern. A prominent “L-shaped” high-high cluster zone was identified, extending from the southeastern sector to the southern fringe, encompassing the southern part of the old Hankou urban area and the periphery of the Guiyuan Temple district. Within this zone, eight indicators—including the absence of safety islands, pedestrian path obstructions, slow-moving traffic congestion, and deteriorating road environments—were found to spatially overlap. This area is not only a major interchange node for subway lines but also a traditional mixed-use commercial and tourism district, with peak pedestrian volumes exceeding 6000 people per hour. However, the average sidewalk width remains below 2.1 m, and approximately 37% of road segments lack physical separation between modes, highlighting a severe mismatch between infrastructure capacity and user demand as the root cause of these bottlenecks. In addition, a secondary hotspot cluster was observed in the city center, specifically around the Wuguang–Jianghan Road commercial core. Here, disorganized shared bicycle parking and illegal vehicle encroachment accounted for 54% of all recorded bottleneck incidents. This reflects the combined impact of a 28% shortfall in designated parking facilities and the delayed implementation of shared bicycle redistribution mechanisms. Resident encroachment issues were found to be dispersed throughout the central area, whereas northern zones such as the East Lake University Town and certain mature central communities exhibited distinct low-low clustering (cold spots), with sidewalk integrity rates exceeding 92% and facility integrity rates over 88%, indicative of a robust planning-management-maintenance system in place.
From the perspective of issue specificity, a notable spatial overlap (correlation coefficient = 0.74) was observed between areas lacking safety islands and the 300 m buffer zones around metro stations in the southeast, suggesting that the rapid pedestrian throughput generated by rail transit is not being met by adequate crossing facilities. On the eastern periphery, over 12% of designated public rest areas were found to be occupied by construction hoardings, indicating a lack of foresight in the temporary planning of large-scale infrastructure projects. Additionally, visual obstructions and station-related safety hazards were concentrated near the southern long-distance bus terminals, where minimal spacing between bus shelters and street trees led to visual blind spots and increased pedestrian-vehicle conflict risks. Overall, the bottlenecks exhibited a spatial pattern of “hot in the south, cold in the north; dense in the center, sparse on the periphery,” shaped jointly by high traffic pressure and delays in adaptive urban planning. To address these disparities, the southeastern and southern sectors should prioritize “micro-renovations” and facility retrofitting, focusing on improving sidewalk continuity and safety features. The central commercial core would benefit from time-sharing parking mechanisms and the implementation of digital bicycle parking boundaries (e-fencing). Furthermore, the establishment of a real-time, street–view–based dynamic monitoring platform is recommended to support data-driven, adaptive governance of slow-moving traffic systems across diverse urban contexts.

5.3. Optimization and Improvement Strategies for Urban Street Slow-Moving Traffic Bottlenecks

In response to the observed spatial pattern of “high-high clusters in the southeast and south, secondary hotspots in the central area, and cold spots in the north” within Wuhan’s Third Ring Road, this study proposes a systematic optimization framework based on the principles of “regional adaptation + element supplementation + dynamic monitoring.” For the high-high aggregation belt along the southeast-southern corridor, a “micro-renovation plus facility enhancement” strategy is recommended. Specifically, prefabricated pedestrian refuge islands should be installed at intersections near major rail transit transfer corridors to shorten construction cycles and control implementation costs. Simultaneously, reducing the number of motor vehicle lanes to release pedestrian space, removing roadside parking strips, and improving pedestrian flow capacity can significantly alleviate bottlenecks. Deploying mobile tidal flow barriers to dynamically reconfigure lane usage during peak hours is also suggested to mitigate congestion and reduce pedestrian–cyclist conflicts. In the central commercial hotspot areas, a “spatiotemporal optimization” strategy is advocated. Within the urban core of the Third Ring Road, shared parking schemes and electronic fencing systems should be deployed to regulate bicycle parking, especially during peak hours. By integrating Bluetooth sniffing technology with visual recognition systems, real-time detection of parking violations can be achieved. Immediate clearance operations and on-site enforcement can then be triggered, reducing the response time for illegal parking and shared bicycle disorder. These measures help balance high demand with limited infrastructure resources in dense commercial zones. For the cold spot areas in the north, a long-term three-tier maintenance mechanism should be established, consisting of a “community–street–platform” governance structure. Community grid officers, property management teams, and municipal law enforcement units can form joint inspection squads to conduct monthly audits of street facility integrity, with damaged elements to be repaired within 48 h. Street interfaces should reserve capacity for real-time monitoring and be linked with the city’s big data platform.
Comparative insights suggest that the spatial polarization observed in Wuhan is not unique. In Beijing, Shanghai, and Guangzhou, high bottleneck densities have also been documented in southern and southeastern corridors, where population density and infrastructure pressures are greatest, while northern districts—often with newer developments and stronger management—show relatively fewer problems. Internationally, studies of Seoul and Tokyo similarly report spatial asymmetry, with older high-density cores experiencing clustered bottlenecks and peripheral zones maintaining more balanced conditions. This indicates that “south hot, north cold” patterns may be a recurring phenomenon in compact, rapidly urbanizing cities.
To ensure sustainability, this study also emphasizes the dynamic optimization mechanism introduced in the abstract. Specifically, quarterly updates of street view imagery enable continuous monitoring of slow-traffic conditions, while transfer learning techniques allow the detection model to adapt to newly emerging bottleneck types without full retraining. In addition, multi-agent collaborative training can integrate data from municipal sensors, crowdsourced reports, and mobility platforms, continuously refining the model’s detection and prediction accuracy. This feedback loop not only enhances temporal adaptability but also prevents cold spot deterioration or reversion. A co-governance point system could further incentivize public participation: citizens may report issues via a mobile app and receive redeemable credits (e.g., parking discounts) for verified reports.
Through the parallel advancement of high-density remediation, central area balancing, cold spot stabilization, and dynamic optimization, this study offers a replicable, data-driven governance model for improving slow-moving traffic systems in compact urban environments.

6. Conclusions

This study established a comprehensive framework for identifying slow-moving traffic bottlenecks and analyzing their spatial effects in urban streets, using street view images and the YOLOv5 deep learning model. Focusing on the area within Wuhan’s Third Ring Road, the study validated technical methods, revealed spatial distribution patterns, investigated influencing mechanisms, and proposed policy recommendations. To our knowledge, this represents the first application of YOLOv5 for diagnosing slow-moving traffic bottlenecks, bridging a methodological gap in the field. Furthermore, by integrating machine-based detection with spatial autocorrelation analysis (Global and Local Moran’s I) and a scientifically grounded indicator system across continuity, safety, and comfort, the study provides a novel framework for linking computer vision with urban transport planning.
The results show that bottleneck issues are not randomly distributed but exhibit significant spatial clustering. High-value clusters are mainly concentrated in the southeastern and southern peripheral areas, where infrastructure deficiencies and weak management prevail, while low-value clusters appear in the northern and selected central areas, reflecting stronger facilities and governance. The analysis also identified key drivers, including location, facility planning standards, and management intensity, underscoring the multi-dimensional nature of bottleneck formation.
The novelty of this study lies not only in its technical contribution—leveraging YOLOv5 for large-scale street view diagnostics—but also in its theoretical advancement, by demonstrating how spatial heterogeneity and clustering patterns of bottlenecks can inform differentiated governance strategies. The findings provide actionable guidance: comprehensive renovation in high-value clusters, spatio-temporal regulation in central hotspots, and long-term maintenance in low-value areas, supported by dynamic monitoring and multi-sector collaboration.
Nevertheless, some limitations remain. The dataset represents a static snapshot, mostly under fair-weather conditions, with limited coverage of temporal dynamics such as peak versus off-peak periods. The focus on Wuhan’s Third Ring Road also raises questions about generalizability. Future work will address these issues by incorporating time-series street view images to capture rush-hour congestion and seasonal variations, expanding data collection to include adverse weather scenarios (e.g., rain, snow), and employing transfer learning with cross-city validation (e.g., Beijing, Shanghai, or Seoul) to build a scalable, collaborative update mechanism. This dynamic framework will ensure adaptability across diverse urban contexts.
Ultimately, this research provides both a methodological breakthrough in urban slow-traffic studies and a practical pathway toward smart, responsive, and sustainable governance of slow-moving traffic systems, with strong potential for replication in other dense urban environments.

Author Contributions

Conceptualization, Hong Xu and Zixuan Guo; methodology, Hong Xu and Zixuan Guo; software, Zixuan Guo and Qiushuang Lin; validation, Zixuan Guo and Qiushuang Lin; formal analysis, Hong Xu and Zixuan Guo; investigation, Zixuan Guo and Qiushuang Lin; resources, Hong Xu; data curation, Zixuan Guo and Qiushuang Lin; writing—original draft preparation, Hong Xu and Zixuan Guo; writing—review and editing, Hong Xu; visualization, Zixuan Guo and Qiushuang Lin; supervision, Hong Xu; project administration, Hong Xu; funding acquisition, Hong Xu. All authors have read and agreed to the published version of the manuscript.

Funding

This work is supported by the General Project of Social Science Foundation of Hubei Province (HBSKJJ20233416)and the Key Project for Graduate Students’ Innovation and Entrepreneurship of Wuhan University of Science and Technology (JCX2023022).

Data Availability Statement

Not applicable. Data are annotated by architectural professionals and can be contacted if needed.

Conflicts of Interest

The authors declare no conflicts of interest.

References

  1. Yao, S.; Wang, N.; Wu, J. How does the built environment affect pedestrian perception of road safety on sidewalks? Evidence from eye-tracking experiments. Transp. Res. Part F 2025, 110, 57–73. [Google Scholar] [CrossRef]
  2. Deselnicu, O.; Wallis, J. A Framework for Identifying Recurring Bottlenecks in the State Planning Process in Colorado. Transp. Res. Rec. 2018, 2672, 20–30. [Google Scholar] [CrossRef]
  3. Zhao, X.; Lu, Y.; Lin, G. An integrated deep learning approach for assessing the visual qualities of built environments utilizing street view images. Eng. Appl. Artif. Intell. 2024, 130, 107805. [Google Scholar] [CrossRef]
  4. Kang, Y.; Kim, J.; Park, J.; Lee, J. Assessment of Perceived and Physical Walkability Using Street View Images and Deep Learning Technology. Isprs Int. J. Geo-Inf. 2023, 12, 186. [Google Scholar] [CrossRef]
  5. Ogawa, Y.; Oki, T.; Zhao, C.; Sekimoto, Y.; Shimizu, C. Evaluating the subjective perceptions of streetscapes using street-view images. Landsc. Urban Plan. 2024, 247, 105073. [Google Scholar] [CrossRef]
  6. Lieberthal, E.B.; Serok, N.; Duan, J.; Zeng, G.; Havlin, S. Addressing the urban congestion challenge based on traffic bottlenecks. Philos. Trans. A Math. Phys. Eng. Sci. 2024, 382, 20240095. [Google Scholar] [CrossRef]
  7. Liard, T.; Piccoli, B. Well-Posedness for Scalar Conservation Laws with Moving Flux Constraints. Siam J. Appl. Math. 2019, 79, 641–667. [Google Scholar] [CrossRef]
  8. Pucher, J.; Dijkstra, L. Promoting safe walking and cycling to improve public health: Lessons from the Netherlands and Germany. Am. J. Public Health 2003, 93, 1509–1516. [Google Scholar] [CrossRef]
  9. Wei, H.; Nian, M.; Li, L. China’s Strategies and Policies for Regional Development During the Period of the 14th Five-Year Plan. Chin. J. Urban Environ. Stud. 2020, 8, 2050008. [Google Scholar] [CrossRef]
  10. Zheng, Z.; Li, X. A novel vehicle lateral positioning methodology based on the integrated deep neural network. Expert Syst. Appl. 2020, 142, 112991. [Google Scholar] [CrossRef]
  11. Yihan, L.; Karimi, H.A. Real-Time Sidewalk Slope Calculation through Integration of GPS Trajectory and Image Data to Assist People with Disabilities in Navigation. ISPRS Int. J. Geo-Inf. 2015, 4, 741–753. [Google Scholar] [CrossRef]
  12. Fan, Z.; Zhang, F.; Loo, B.P.Y.; Ratti, C. Urban visual intelligence: Uncovering hidden city profiles with street view images. Proc. Natl. Acad. Sci. USA 2023, 120, e2220417120. [Google Scholar] [CrossRef] [PubMed]
  13. Hou, X.; Zhang, R.; Yang, M.; Cheng, S. Modeling the lane-changing behavior of non-motorized vehicles on road segments via social force model. Phys. A-Stat. Mech. Its Appl. 2024, 633, 129415. [Google Scholar] [CrossRef]
  14. Petrasova, A.; Hipp, J.A.; Mitasova, H. Visualization of Pedestrian Density Dynamics Using Data Extracted from Public Webcams. Isprs Int. J. Geo-Inf. 2019, 8, 559. [Google Scholar] [CrossRef]
  15. Bolten, N.; Caspi, A. Towards routine, city-scale accessibility metrics: Graph theoretic interpretations of pedestrian access using personalized pedestrian network analysis. PLoS ONE 2021, 16, e0248399. [Google Scholar] [CrossRef]
  16. Guzel, M.S. Performance evaluation for feature extractors on street view images. Imaging Sci. J. 2016, 64, 26–33. [Google Scholar] [CrossRef]
  17. Wang, J.; Kong, Y.; Fu, T.; Stipancic, J. The impact of vehicle moving violations and freeway traffic flow on crash risk: An application of plugin development for microsimulation. PLoS ONE 2017, 12, e0184564. [Google Scholar] [CrossRef]
  18. Tang, L.; Wang, Y.; Zhang, X. Identifying Recurring Bottlenecks on Urban Expressway Using a Fusion Method Based on Loop Detector Data. Math. Probl. Eng. 2019, 2019, 5861414. [Google Scholar] [CrossRef]
  19. Li, C.; Yue, W.; Mao, G.; Xu, Z. Congestion Propagation Based Bottleneck Identification in Urban Road Networks. IEEE Trans. Veh. Technol. 2020, 69, 4827–4841. [Google Scholar] [CrossRef]
  20. Hua, C.; Fan, W. Freeway Traffic Speed Prediction under the Intelligent Driving Environment: A Deep Learning Approach. J. Adv. Transp. 2022, 2022, 6888115. [Google Scholar] [CrossRef]
  21. Adaimi, G.; Kreiss, S.; Alahi, A. Deep visual Re-identification with confidence. Transp. Res. Part C-Emerg. Technol. 2021, 126, 103367. [Google Scholar] [CrossRef]
  22. Pan, S.; Liu, Z.; Yan, H.; Chen, N.; Zhao, X.; Li, S.; Witlox, F. Automatic identification of bottlenecks for ambulance passage on urban streets: A deep learning-based approach. Adv. Eng. Inform. 2024, 62, 103931. [Google Scholar] [CrossRef]
  23. Chin, G.K.W.; Van Niel, K.P.; Giles-Corti, B.; Knuiman, M. Accessibility and connectivity in physical activity studies: The impact of missing pedestrian data. Prev. Med. 2008, 46, 41–45. [Google Scholar] [CrossRef] [PubMed]
  24. Badland, H.; White, M.; MacAulay, G.; Eagleson, S.; Mavoa, S.; Pettit, C.; Giles-Corti, B. Using simple agent-based modeling to inform and enhance neighborhood walkability. Int. J. Health Geogr. 2013, 12, 58. [Google Scholar] [CrossRef]
  25. Song, T.-J.; Williams, B.M.; Rouphail, N.M. Data-driven approach for identifying spatiotemporally recurrent bottlenecks. Iet Intell. Transp. Syst. 2018, 12, 756–764. [Google Scholar] [CrossRef]
  26. Pandapotan, S.; Jachrizal Sumabrata, R. Analysis Of The Pedestrian Path Toward Duren Kalibata Train Station As A Part Of The Transit Development Area. In AIP Conference Proceedings; American Institute of Physics: College Park, MD, USA, 2020; Volume 2227, p. 030006. [Google Scholar] [CrossRef]
  27. Budholiya, A.; Manwar, A.B. Efficient traffic monitoring and congestion control with GGA and deep CNN-LSTM using VANET. Multimed. Tools Appl. 2024, 83, 70937–70960. [Google Scholar] [CrossRef]
  28. Li, Z.; Jiao, L.; Zhang, B.; Xu, G.; Liu, J. Understanding the pattern and mechanism of spatial concentration of urban land use, population and economic activities: A case study in Wuhan, China. Geo-Spat. Inf. Sci. 2021, 24, 678–694. [Google Scholar] [CrossRef]
  29. Gallego-Valades, A.; Rodenas-Rigla, F.; Garces-Ferrer, J. Spatial Distribution of Public Housing and Urban Socio-Spatial Inequalities: An Exploratory Analysis of the Valencia Case. Sustainability 2021, 13, 11381. [Google Scholar] [CrossRef]
  30. Shao, Z.; Wang, Z.; Yao, X.; Bell, M.G.H.; Gao, J. ST-MambaSync: Complement the power of Mamba and Transformer fusion for less computational cost in spatial-temporal traffic forecasting. Inf. Fusion 2025, 117, 102872. [Google Scholar] [CrossRef]
  31. Yin, L. Street level urban design qualities for walkability: Combining 2D and 3D GIS measures. Comput. Environ. Urban Syst. 2017, 64, 288–296. [Google Scholar] [CrossRef]
  32. Zhang, X.; Mu, L. The perceived importance and objective measurement of walkability in the built environment rating. Environ. Plan. B-Urban Anal. City Sci. 2020, 47, 1655–1671. [Google Scholar] [CrossRef]
  33. Xu, Y.; Lu, Y.; Ji, C.; Zhang, Q. Adaptive Graph Fusion Convolutional Recurrent Network for Traffic Forecasting. IEEE Internet Things J. 2023, 10, 11465–11475. [Google Scholar] [CrossRef]
  34. Mao, J.; Huang, H.; Gu, Y.; Lu, W.; Tang, T.; Ding, F. A convergent cross-mapping approach for unveiling congestion spatial causality in urban traffic networks. Comput.-Aided Civ. Infrastruct. Eng. 2025, 40, 301–322. [Google Scholar] [CrossRef]
  35. Wu, P.; He, X.; Dai, W.; Zhou, J.; Shang, Y.; Fan, Y.; Hu, T. A Review on Research and Application of AI-Based Image Analysis in the Field of Computer Vision. IEEE Access 2025, 13, 76684–76702. [Google Scholar] [CrossRef]
  36. Noland, R.B.; Quddus, M.A. Congestion and safety: A spatial analysis of London. Transp. Res. Part A-Policy Pract. 2005, 39, 737–754. [Google Scholar] [CrossRef]
  37. Ha, H.-H.; Thill, J.-C. Analysis of traffic hazard intensity: A spatial epidemiology case study of urban pedestrians. Comput. Environ. Urban Syst. 2011, 35, 230–240. [Google Scholar] [CrossRef]
  38. Mario Fuentes, C.; Hernandez, V. Spatial environmental risk factors for pedestrian injury collisions in Ciudad Juarez, Mexico (20082009): Implications for urban planning. Int. J. Inj. Control Saf. Promot. 2013, 20, 169–178. [Google Scholar] [CrossRef]
  39. Natapov, A.; Fisher-Gewirtzman, D. Visibility of urban activities and pedestrian routes: An experiment in a virtual environment. Comput. Environ. Urban Syst. 2016, 58, 60–70. [Google Scholar] [CrossRef]
  40. Droj, G.; Droj, L.; Badea, A.-C. GIS-Based Survey over the Public Transport Strategy: An Instrument for Economic and Sustainable Urban Traffic Planning. ISPRS Int. J. Geo-Inf. 2022, 11, 16. [Google Scholar] [CrossRef]
  41. Kormecli, P.S. Analysis of Walkable Street Networks by Using the Space Syntax and GIS Techniques: A Case Study of cankiri City. ISPRS Int. J. Geo-Inf. 2023, 12, 216. [Google Scholar] [CrossRef]
  42. Jerath, K.; Gayah, V.V.; Brennan, S.N. Mitigating delay due to capacity drop near freeway bottlenecks: Zones of influence of connected vehicles. PLoS ONE 2024, 19, e0301188. [Google Scholar] [CrossRef]
  43. Fan, Z.; Loo, B.P.Y. Street life and pedestrian activities in smart cities: Opportunities and challenges for computational urban science. Comput. Urban Sci. 2021, 1, 26. [Google Scholar] [CrossRef]
  44. Huang, X.; Zeng, L.; Liang, H.; Li, D.; Yang, X.; Zhang, B. Comprehensive walkability assessment of urban pedestrian environments using big data and deep learning techniques. Sci. Rep. 2024, 14, 26993. [Google Scholar] [CrossRef]
  45. Handy, S.; Cao, X.; Mokhtarian, P. Correlation or causality between the built environment and travel behavior? Evidence from Northern California. Transp. Res. Part D Transp. Environ. 2005, 10, 427–444. [Google Scholar] [CrossRef]
  46. Cheng, L.; Chen, X.; Yang, S.; Cao, Z.; De Vos, J.; Witlox, F. Active travel for active ageing in China: The role of built environment. J. Transp. Geogr. 2019, 76, 142–152. [Google Scholar] [CrossRef]
  47. Oluyomi, A.O.; Knell, G.; Durand, C.P.; Mercader, C.; Salvo, D.; Sener, I.N.; Gabriel, K.P.; Hoelscher, D.M.; Kohl, H.W. Foot-based audit of streets adjacent to new light rail stations in Houston, Texas: Measurement of health-related characteristics of the built environment for physical activity research. BMC Public Health 2019, 19, 238. [Google Scholar] [CrossRef] [PubMed]
  48. Sun, G.; Webster, C.; Chiaradia, A. Objective assessment of station approach routes.: Development and reliability of an audit for walking environments around metro stations in China. J. Transp. Health 2017, 4, 191–207. [Google Scholar] [CrossRef]
  49. Nieuwenhuijsen, M.J.; Khreis, H. Car free cities: Pathway to healthy urban living. Environ. Int. 2016, 94, 251–262. [Google Scholar] [CrossRef]
  50. Lu, Y.; Yang, Y.; Sun, G.; Gou, Z. Associations between overhead-view and eye-level urban greenness and cycling behaviors. Cities 2019, 88, 10–18. [Google Scholar] [CrossRef]
  51. Wang, R.; Liu, Y.; Lu, Y.; Yuan, Y.; Zhang, J.; Liu, P.; Yao, Y. The linkage between the perception of neighbourhood and physical activity in Guangzhou, China: Using street view imagery with deep learning techniques. Int. J. Health Geogr. 2019, 18, 18. [Google Scholar] [CrossRef]
  52. Song, Q.; Fang, Y.; Li, M.; van Ameijde, J.; Qiu, W. Exploring the coherence and divergence between the objective and subjective measurement of streetscape perceptions at the neighborhood level: A case study in Shanghai. Environ. Plan. B-Urban Anal. City Sci. 2025, 52, 1231–1251. [Google Scholar] [CrossRef]
  53. Miller, H. Tobler’s First Law and Spatial Analysis. Ann. Assoc. Am. Geogr. 2004, 94, 284–289. [Google Scholar] [CrossRef]
  54. Anselin, L. LOCAL INDICATORS OF SPATIAL ASSOCIATION—LISA. Geogr. Anal. 1995, 27, 93–115. [Google Scholar] [CrossRef]
  55. Anselin, L.; Bera, A.K.; Florax, R.; Yoon, M.J. Simple diagnostic tests for spatial dependence. Reg. Sci. Urban Econ. 1996, 26, 77–104. [Google Scholar] [CrossRef]
  56. Anselin, L.; Rey, S. Properties of Tests for Spatial Dependence in Linear-Regression Models. Geogr. Anal. 1991, 23, 112–131. [Google Scholar] [CrossRef]
  57. Jiang, Y.; Sun, Z.; Wei, D.; Zhao, P.; Yang, L.; Lu, Y. Revealing the spatiotemporal pattern of urban vibrancy at the urban agglomeration scale: Evidence from the Pearl River Delta, China. Appl. Geogr. 2025, 181, 103694. [Google Scholar] [CrossRef]
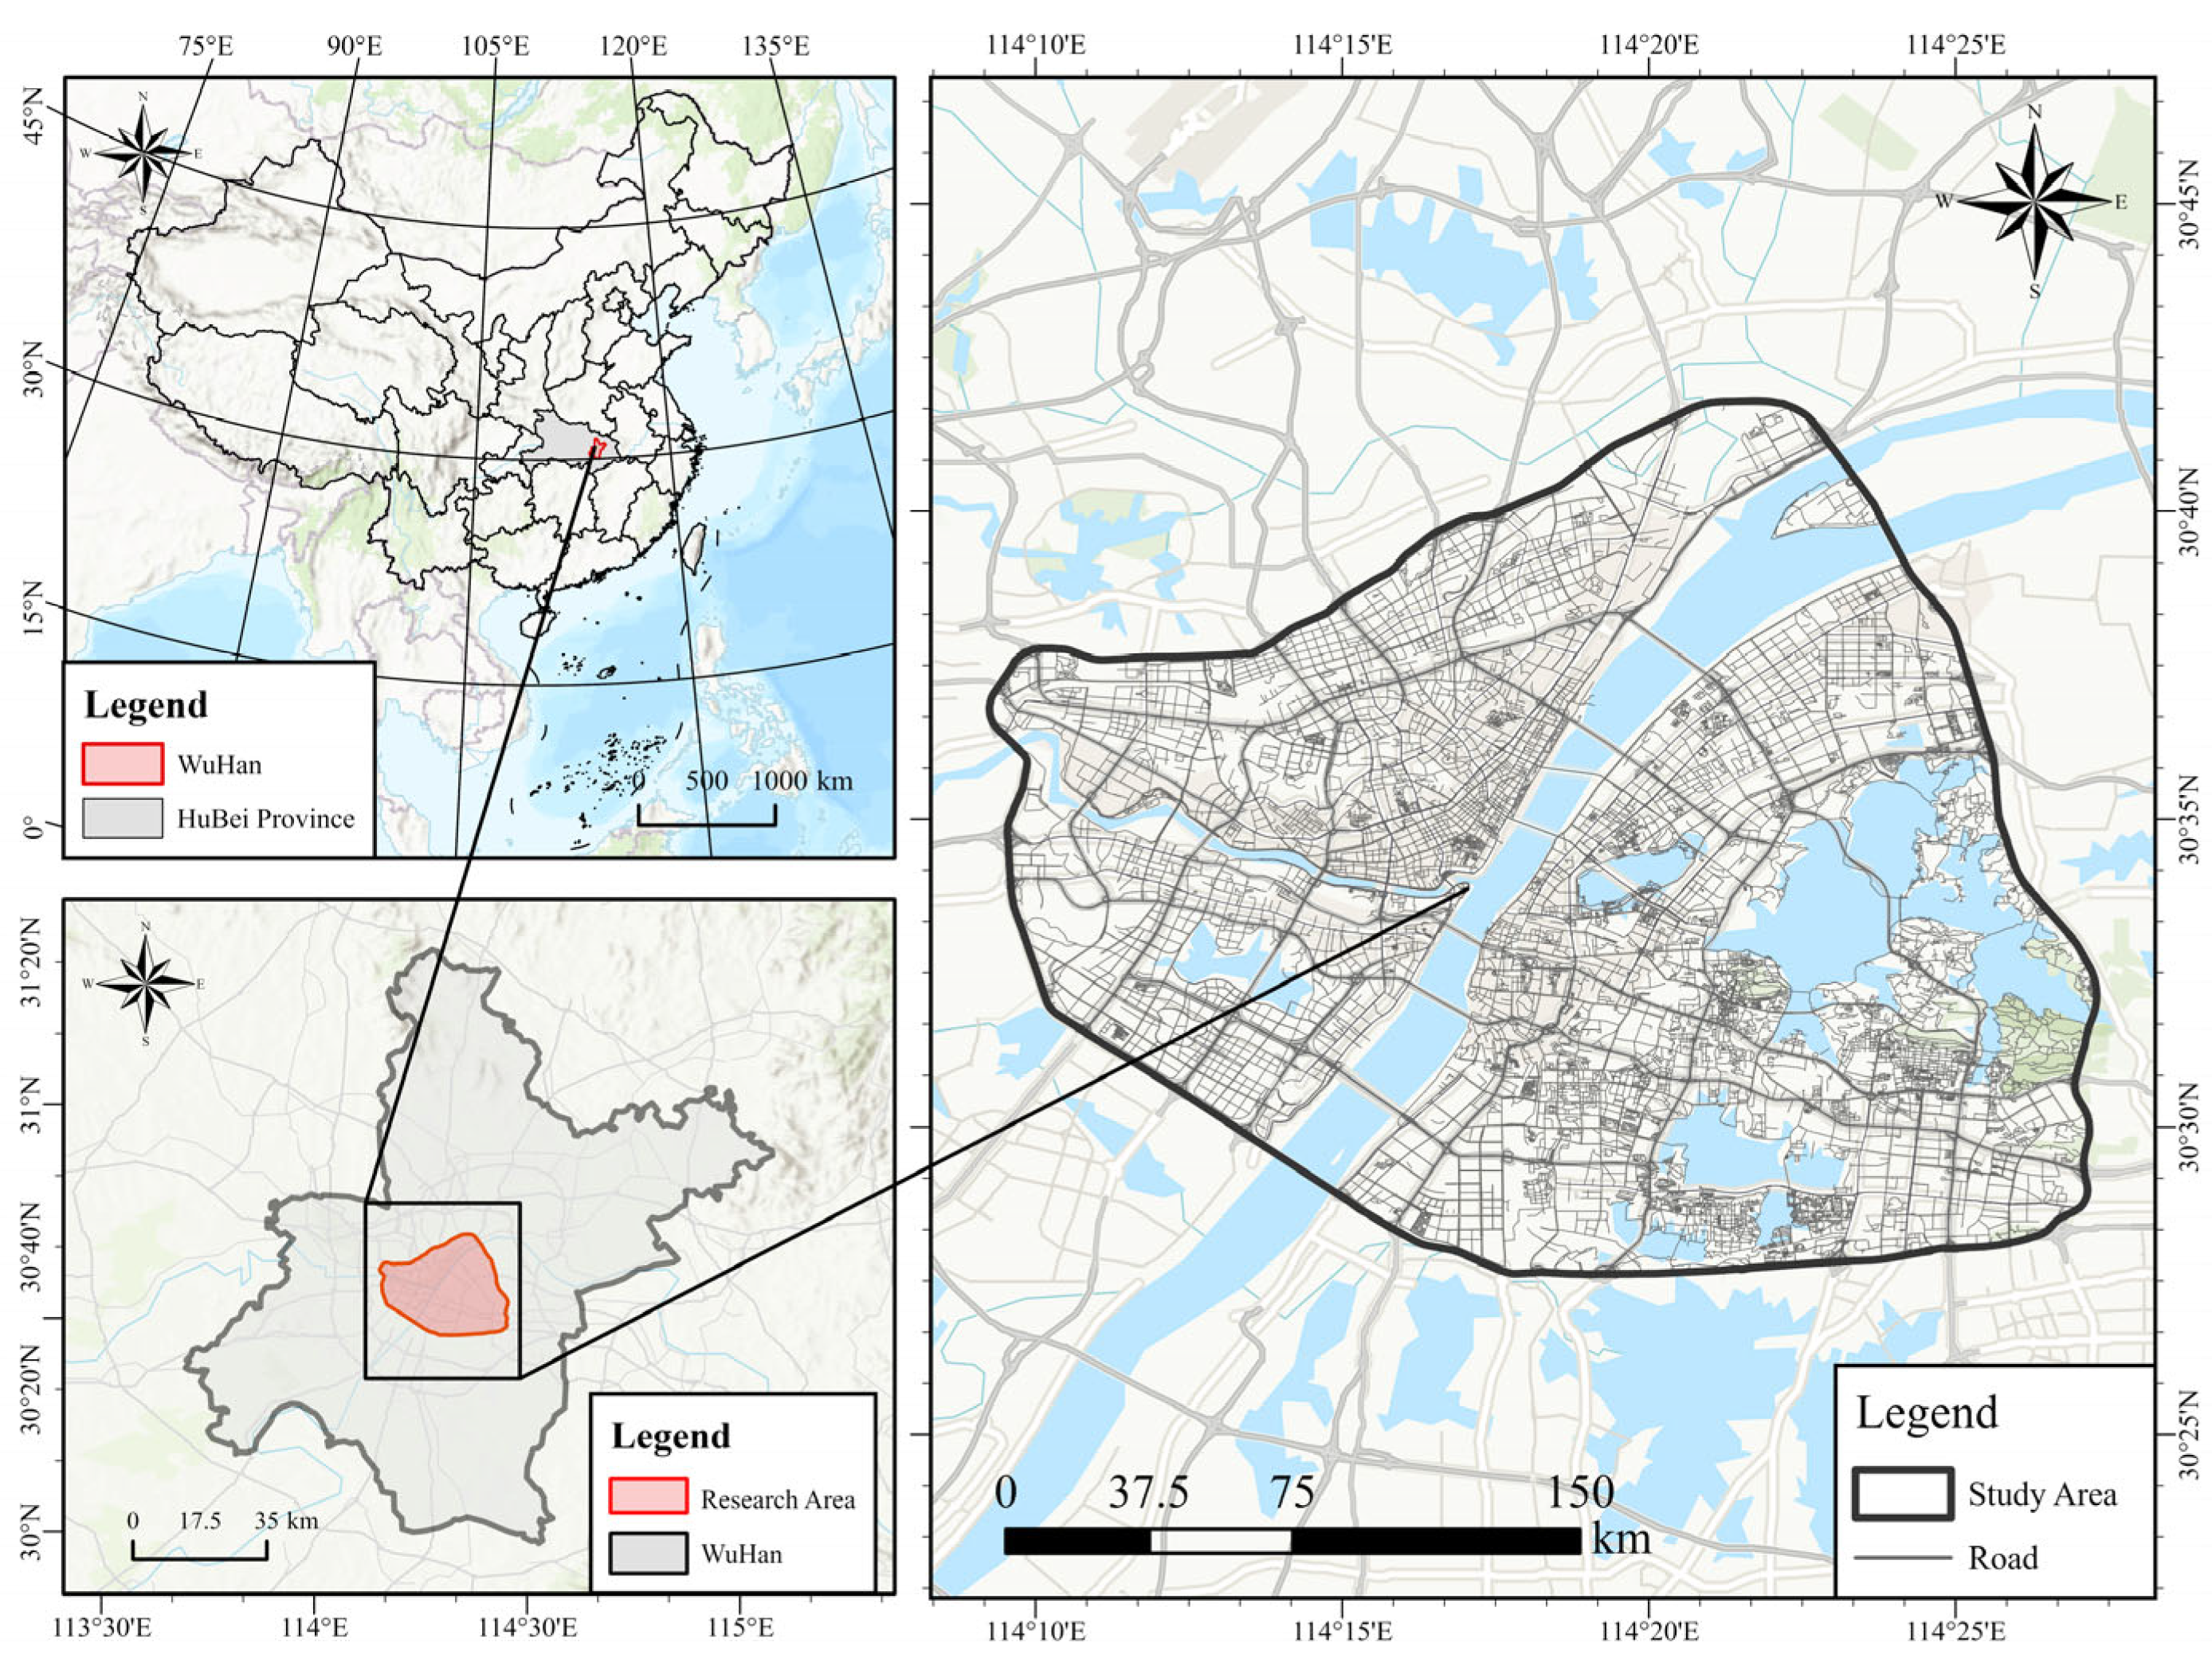
Figure 1. The location of the research area: Some districts within the Third Ring Road of Wuhan City (The brown lines in the picture on the right represent the road network of the research area).
Ijgi 14 00351 g001
Figure 2. Research framework.
Ijgi 14 00351 g002
Figure 3. YOLOv5 network architecture.
Ijgi 14 00351 g003
Figure 4. Research workflow diagram.
Ijgi 14 00351 g004
Figure 5. Street view detection comparison chart.
Ijgi 14 00351 g005
Figure 6. Distribution of urban bottleneck instances and spatial feature analysis.
Ijgi 14 00351 g006
Figure 7. Spatial attribute correlation matrix.
Ijgi 14 00351 g007
Figure 8. Loss function variations and performance metrics.
Ijgi 14 00351 g008
Figure 9. Variation in detection precision for each category under different confidence thresholds.
Ijgi 14 00351 g009
Figure 10. Variation in recall rates for each category under different confidence thresholds.
Ijgi 14 00351 g010
Figure 11. Classification accuracy matrix for 15 types of slow traffic congestion problems.
Ijgi 14 00351 g011
Figure 12. Spatial clustering distribution map of urban issues.
Ijgi 14 00351 g012
Table 1. Selection and Construction of Bottleneck Element Indicators for the Slow-Moving Traffic System.
(A) Classification of Bottlenecks in Slow-moving Traffic(B1)Traffic System Continuity(C1-1) Pedestrian Path Interference
(Obstruction caused by internal elements such as street trees or other physical barriers within the sidewalk.)
(C1-2) Road Debris Obstruction
(Accumulation of miscellaneous items or litter that impedes pedestrian or cyclist movement.)
(C1-3) Capacity for Slow-moving Traffic
(Whether the road provides sufficient width and design to accommodate slow-moving traffic.)
(C1-4) Illegal Parking
(Encroachment on pedestrian or cycling paths due to a lack of designated parking spaces for motorized or slow-moving traffic vehicles.)
(C1-5) Temporary Pathway Blockage
(Disruptions caused by temporary construction, road maintenance, or event activities.)
(C1-6) Shared Bicycle Parking Obstruction
(Lack of designated parking areas for shared bicycles results in obstruction of sidewalks or cycling lanes.)
(B2)Traffic System Safety(C2-1) Lack of Segregation
(Absence of dedicated lanes for pedestrians and cyclists, increasing the risk of conflict with vehicles.)
(C2-2) Absence of Safety Islands
(Lack of pedestrian refuge islands or protected waiting areas at crossings.)
(C2-3) Visual Obstruction
(Visual interference from vegetation, signage, billboards, or other elements that block sightlines and compromise safety.)
(C2-4) Lack of Barrier Facilities
(Insufficient accessibility features such as ramps, overpasses, or underpasses at intersections.)
(C2-5) Public Transport Station Hazards
(Safety risks near bus or transit stations due to poor pedestrian-cyclist-vehicle interaction.)
(B3)Traffic System Comfort(C3-1) Encroachment by Residents
(Use of sidewalks by nearby businesses or residents for commercial, entertainment, or other non-transportation activities.)
(C3-2) Functional Service Damage
(Deterioration of infrastructure such as utility boxes, fire hydrants, or other essential service equipment.)
(C3-3) Degradation of Road Environment
(Poor paving conditions, lack of greenery, or general deterioration of the streetscape.)
(C3-4) Encroachment of Resting Spaces
(Lack or misuse of public resting spaces (e.g., benches, pocket parks) needed for pedestrian and cyclist comfort.)
Disclaimer/Publisher’s Note: The statements, opinions and data contained in all publications are solely those of the individual author(s) and contributor(s) and not of MDPI and/or the editor(s). MDPI and/or the editor(s) disclaim responsibility for any injury to people or property resulting from any ideas, methods, instructions or products referred to in the content.