1. Introduction
People can go missing for many reasons, whether intentionally or unintentionally [
1]. The method of conducting a search depends on the circumstances: the characteristics of the missing person, the conditions under which they disappeared, and the surrounding environment [
2]. In cases of unintentional loss in forests or rural landscapes, when a person cannot orient themselves and return, the police initiate a search operation. It is then necessary to define the area where the person is most likely located and conduct a systematic search [
3]. Such operations follow different procedures than searches in urban areas [
4] and often involve other components of the rescue system, such as firefighters, mountain rescue services, and even volunteers from the public.
The search process begins with gathering information about the missing person’s last known appearance, as well as their physical and psychological condition. This information is used to analyze and estimate the area where the person is most likely to be found, expressed as the Probability of Area (POA) [
5]. Factors such as time of disappearance, the individual’s condition, and the permeability of the environment are taken into account. Within this area, search operations are coordinated by the search leader, who organizes and directs the work of the search teams. The leader must divide the estimated area into sub-areas that fully cover the territory and correspond to the teams’ capabilities. Each search team is then assigned a sector, and its internal route is determined by the team leader. Because the definition of search sectors directly affects the effectiveness of the search, sectors must be carefully designed to reflect the fitness, expertise, and size of the team, as well as the environmental conditions. Teams must also be able to navigate the terrain effectively to avoid overlooking parts of the area.
Segmentation of an area into smaller parts is widely applied in contexts where the area must be analyzed separately. It is often used for the spatial representation of continuous phenomena, spatial analysis, or for defining areas in field surveys. In geographic information systems (GIS), related terms include tessellation [
6] and area subdivision [
7], both describing ways of representing continuous spatial phenomena and analyzing areas in the context of a specific process.
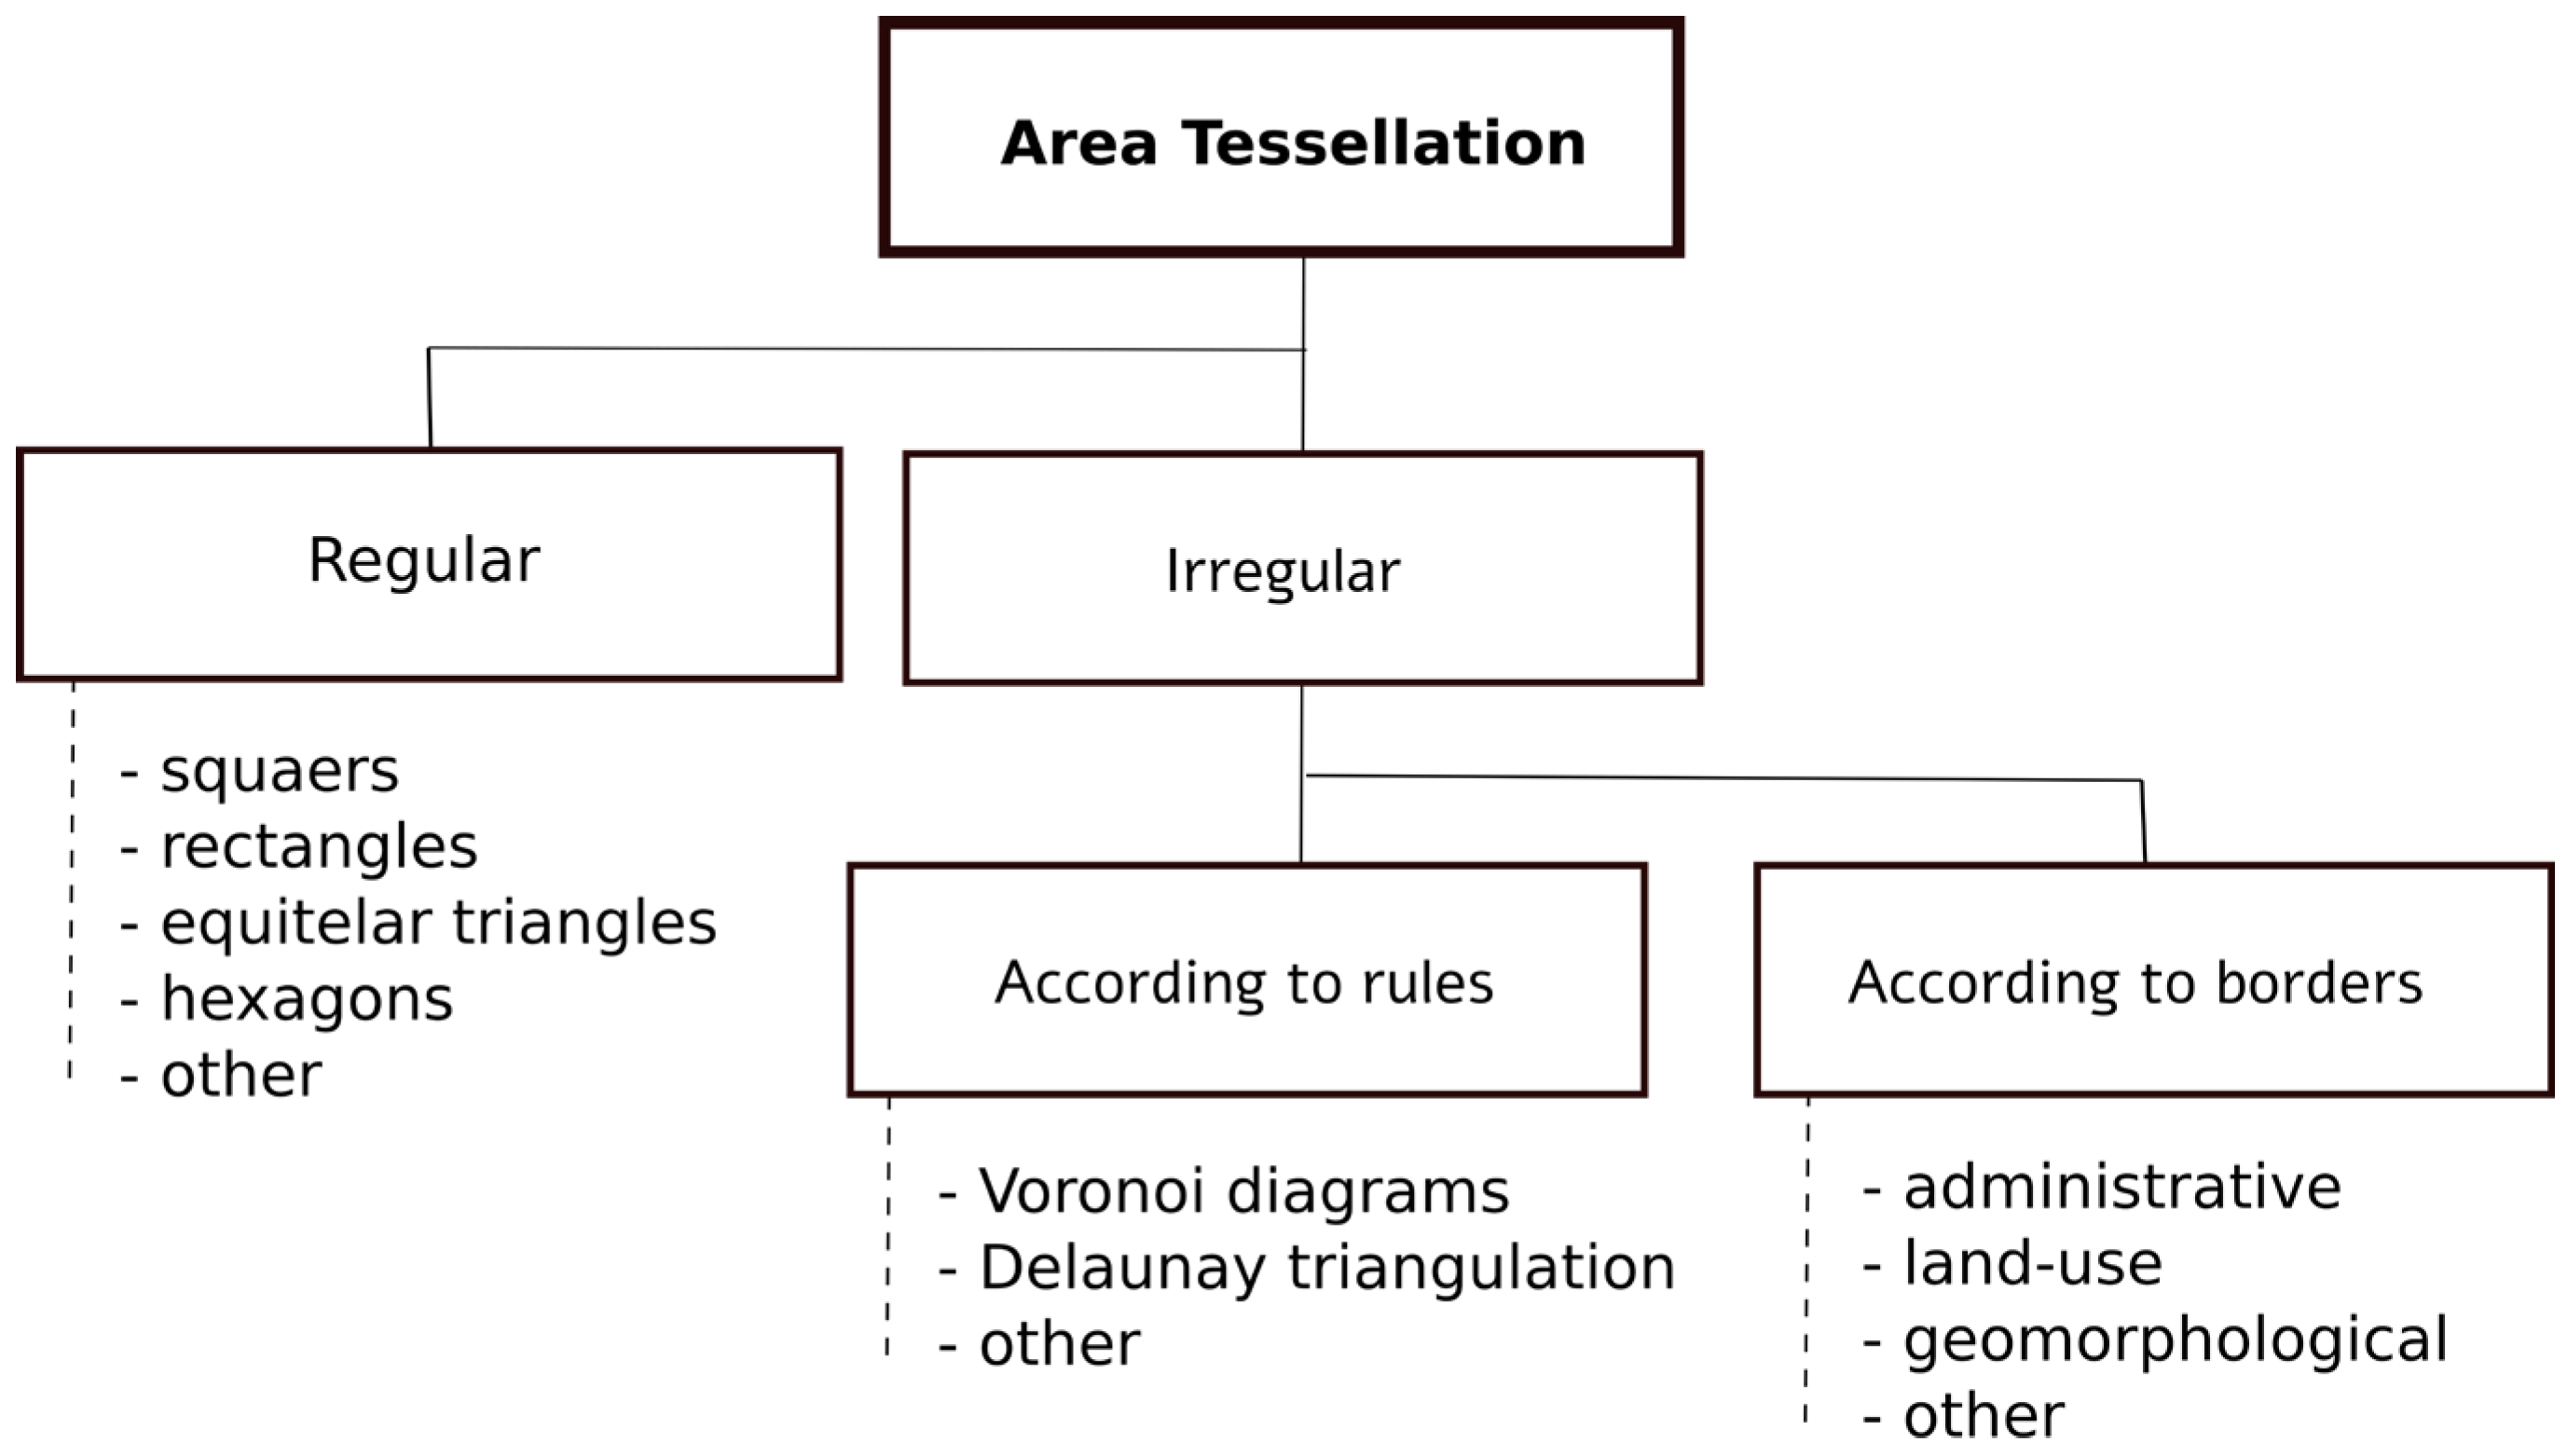
Surface segmentation methods are generally divided into two categories: regular and irregular [
7] (
Figure 1).
Regular subdivision is suitable for representing continuous phenomena and for automated processing when irregularities in the studied area are negligible. The territory can be divided into equal squares, rectangles, triangles, or hexagons [
8,
9]. Rectangles may also be irregularly arranged within a spatial framework [
6]. For analyses requiring multiple scales, a hierarchical structure of sub-areas can be applied [
10].
Irregular subdivision, in contrast, is based on either natural or artificial boundaries or generated analytically according to the spatial distribution of the phenomenon. Blocks are created according to rules of spatial proximity and the homogeneity of observed attributes. Commonly used approaches include Voronoi or Thiessen diagrams [
11] and Delaunay triangulation [
12]. For territorial analyses, administrative boundaries, land-use transitions, or geomorphological features such as landforms [
13] may also serve as delimiters.
A particular challenge arises when dividing areas for field surveys. In such cases, searchers must be able to orient themselves in the terrain, especially in locations without access to global navigation systems. Visually recognizable features are therefore essential, including natural elements such as lakes, forests, meadows, fields, ridges, and depressions, as well as man-made features such as paths or roads. Artificially generated or invisible boundaries (e.g., administrative lines) are unsuitable because they lack visibility in the field. Regularly generated units, such as squares, also offer no visual cues and may be easily misinterpreted. Some administrative boundaries coincide with rivers, roads, or land-use edges and can be recognized in the terrain, but this is inconsistent and cannot be systematically relied upon.
Survey sub-areas must be designed to ensure full coverage of the territory. This requirement is especially critical in searches for missing persons in non-urban environments, where every part of the area must be thoroughly examined. Such searches often involve difficult or hazardous terrain, which underscores the need for careful planning [
14]. Inaccessible or restricted zones must be identified in advance. Remote sensing is increasingly used, but it does not always provide sufficient accuracy or resolution [
15]. A combined approach—remote sensing and field surveys—is therefore often required, as individuals hidden under tree canopies or in abandoned buildings may not be visible from above.
The size of sub-areas is another critical factor. They must be manageable for movement on foot or by vehicle within a reasonable timeframe, while also allowing for breaks [
16]. Terrain passability further influences the effective size of sectors. Detailed methodologies for missing-person searches are already available [
2,
5], but in non-urban settings the efficient subdivision of space remains essential. Different types of search groups—such as police, soldiers, dog handlers, mounted patrols, mountain services, divers, or volunteers—vary in their suitability for different terrains. Each type also requires different sector sizes, as for instance volunteers and dogs tire more quickly and require longer breaks [
17]. Despite the availability of advanced algorithms (e.g., walkability calculations [
2]), defining search sections remains a demanding task.
This research introduces a novel approach to segmenting large areas into manageable sectors tailored for search and rescue operations. Traditional methods often rely on manual segmentation or regular square grids. Manual division can be useful when a commander knows the terrain well, but it is slow and makes it difficult to maintain consistent sector sizes. Regular square segmentation, meanwhile, produces boundaries that are hard for teams to identify in the field. Our methodology employs automated processes to improve both efficiency and accuracy, particularly in complex terrain. By integrating topographical datasets and land-use categories, it offers a practical solution for field survey planning. Importantly, it also provides a systematic way to divide large, topologically homogeneous areas that are otherwise challenging to segment.
2. Materials and Methods
2.1. Developed Methodology
The methodology was originally developed and tested for search operations involving missing persons in natural landscapes in the Czech Republic, but it can also be adapted for planning other types of field surveys.
The key requirements for creating survey sectors were defined as follows:
Maintain segment sizes within a specified range, with both minimum and maximum limits.
Delineate homogeneous land-use areas.
Ensure borders that are easily recognizable in the field.
Avoid barriers to movement within individual segments.
Preserve polygon compactness, preventing thin, elongated, or irregular shapes.
An overview of the methodological steps is provided in
Figure 2.
Methodology steps:
Identification and Selection of Line Features
Line features were extracted from the topographical geodatabase and stored in three separate datasets (
Figure 3):
Field-identifiable lines such as roads, tracks, streams, and engineering networks, as well as land-use borders (e.g., forest–field or field–water boundaries).
Barriers to movement, including railways, rivers, or ravines. These features restrict walkability and may pose safety risks for walking, cycling, or motorbiking.
Additional orientation lines, consisting of roads, paths, streams, and engineering networks, which can serve as supplementary navigation aids in the field.
Creation of Polygons from Recognizable Lines and Land-Use Borders
A line spaghetti model was generated from the selected line features (step 1). The spaghetti model represents lines as simple X, Y coordinates of their points without any inherent structure [
18]. From this model, polygons were subsequently derived.
Polygonization of Barrier Lines and Borders
Barrier lines were polygonized in a process similar to step 2. Since some barriers do not form closed loops (e.g., a rivulet ending in a spring), only basic area segments could be created.
Evaluation and Categorization of Polygons
The resulting polygons were evaluated according to their area. Those within the required size range were included in the final dataset. Oversized polygons were stored in a separate dataset, while undersized polygons were placed in a ‘Below-size’ dataset.
Merging of Below-Size Polygons
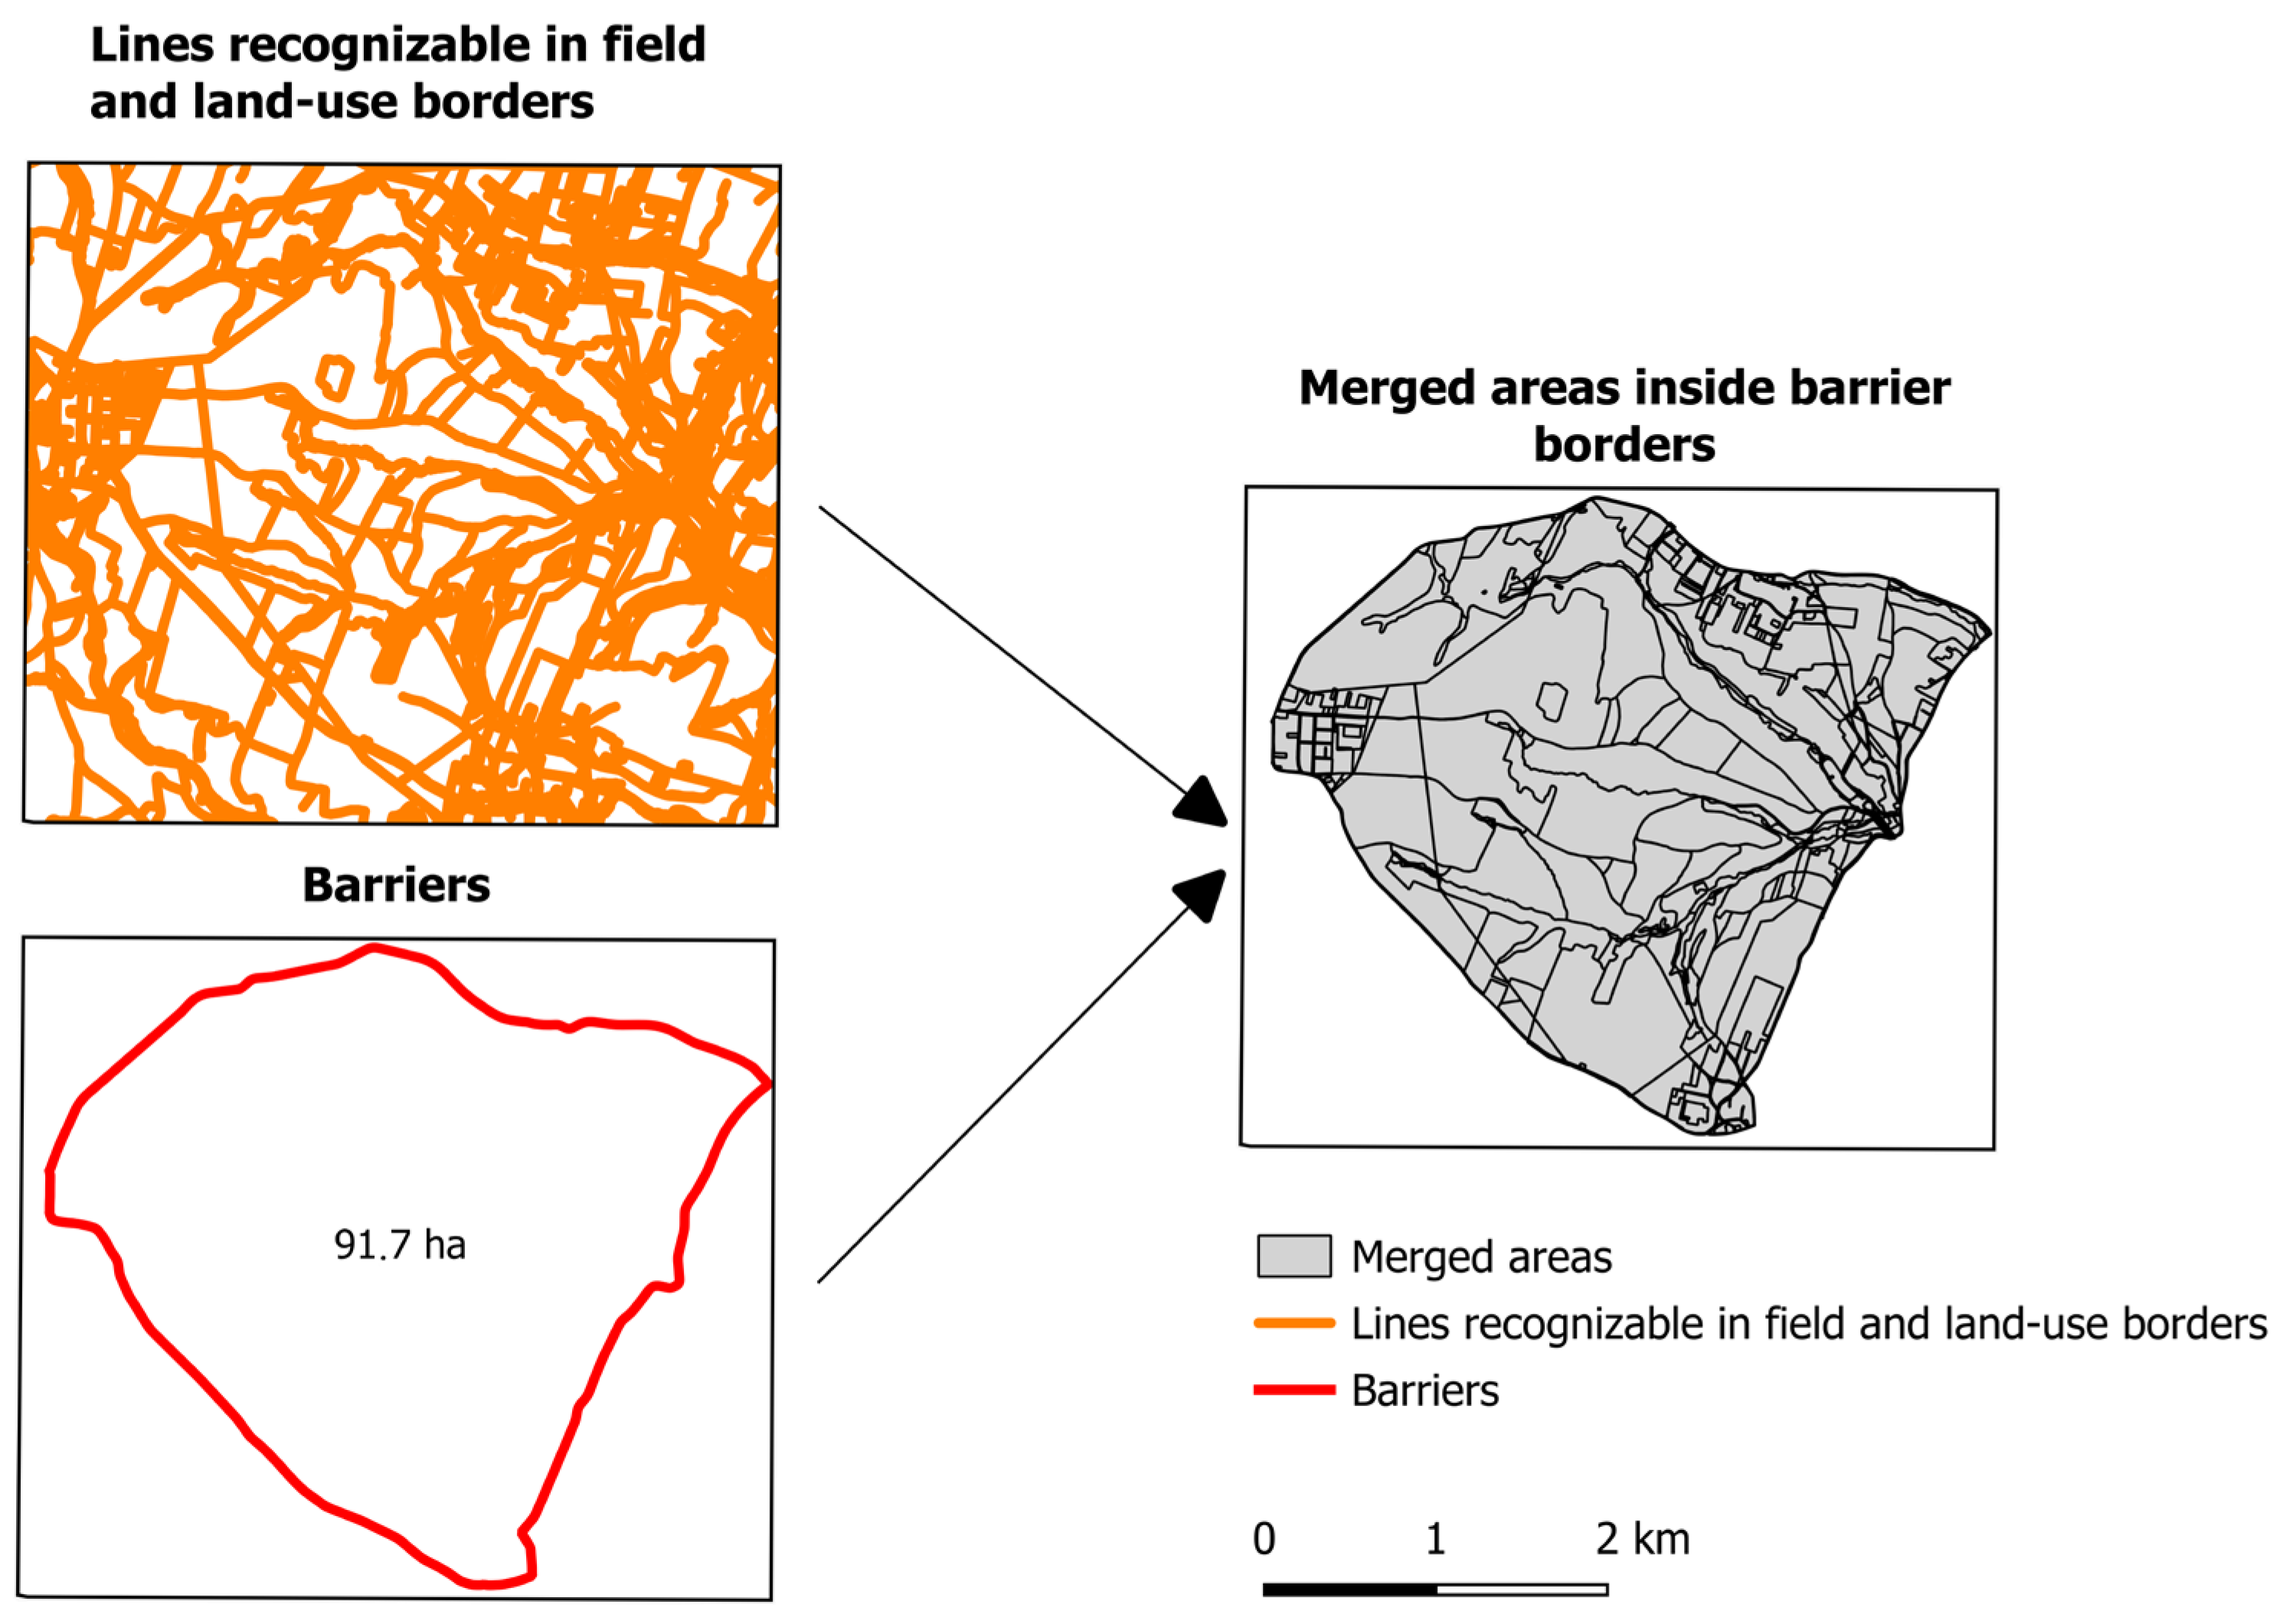
Polygons from the ‘Below-size’ dataset were merged based on spatial adjacency and land-use continuity. The merging process was parallelized and optimized by subdividing areas along barrier boundaries. Smaller areas within larger ones were processed in separate threads, with rules applied to merge adjacent areas until the specified minimum size limit was reached.
Figure 4 illustrates the merging process within a block bounded by barriers.
Special Procedure for Oversized Polygons
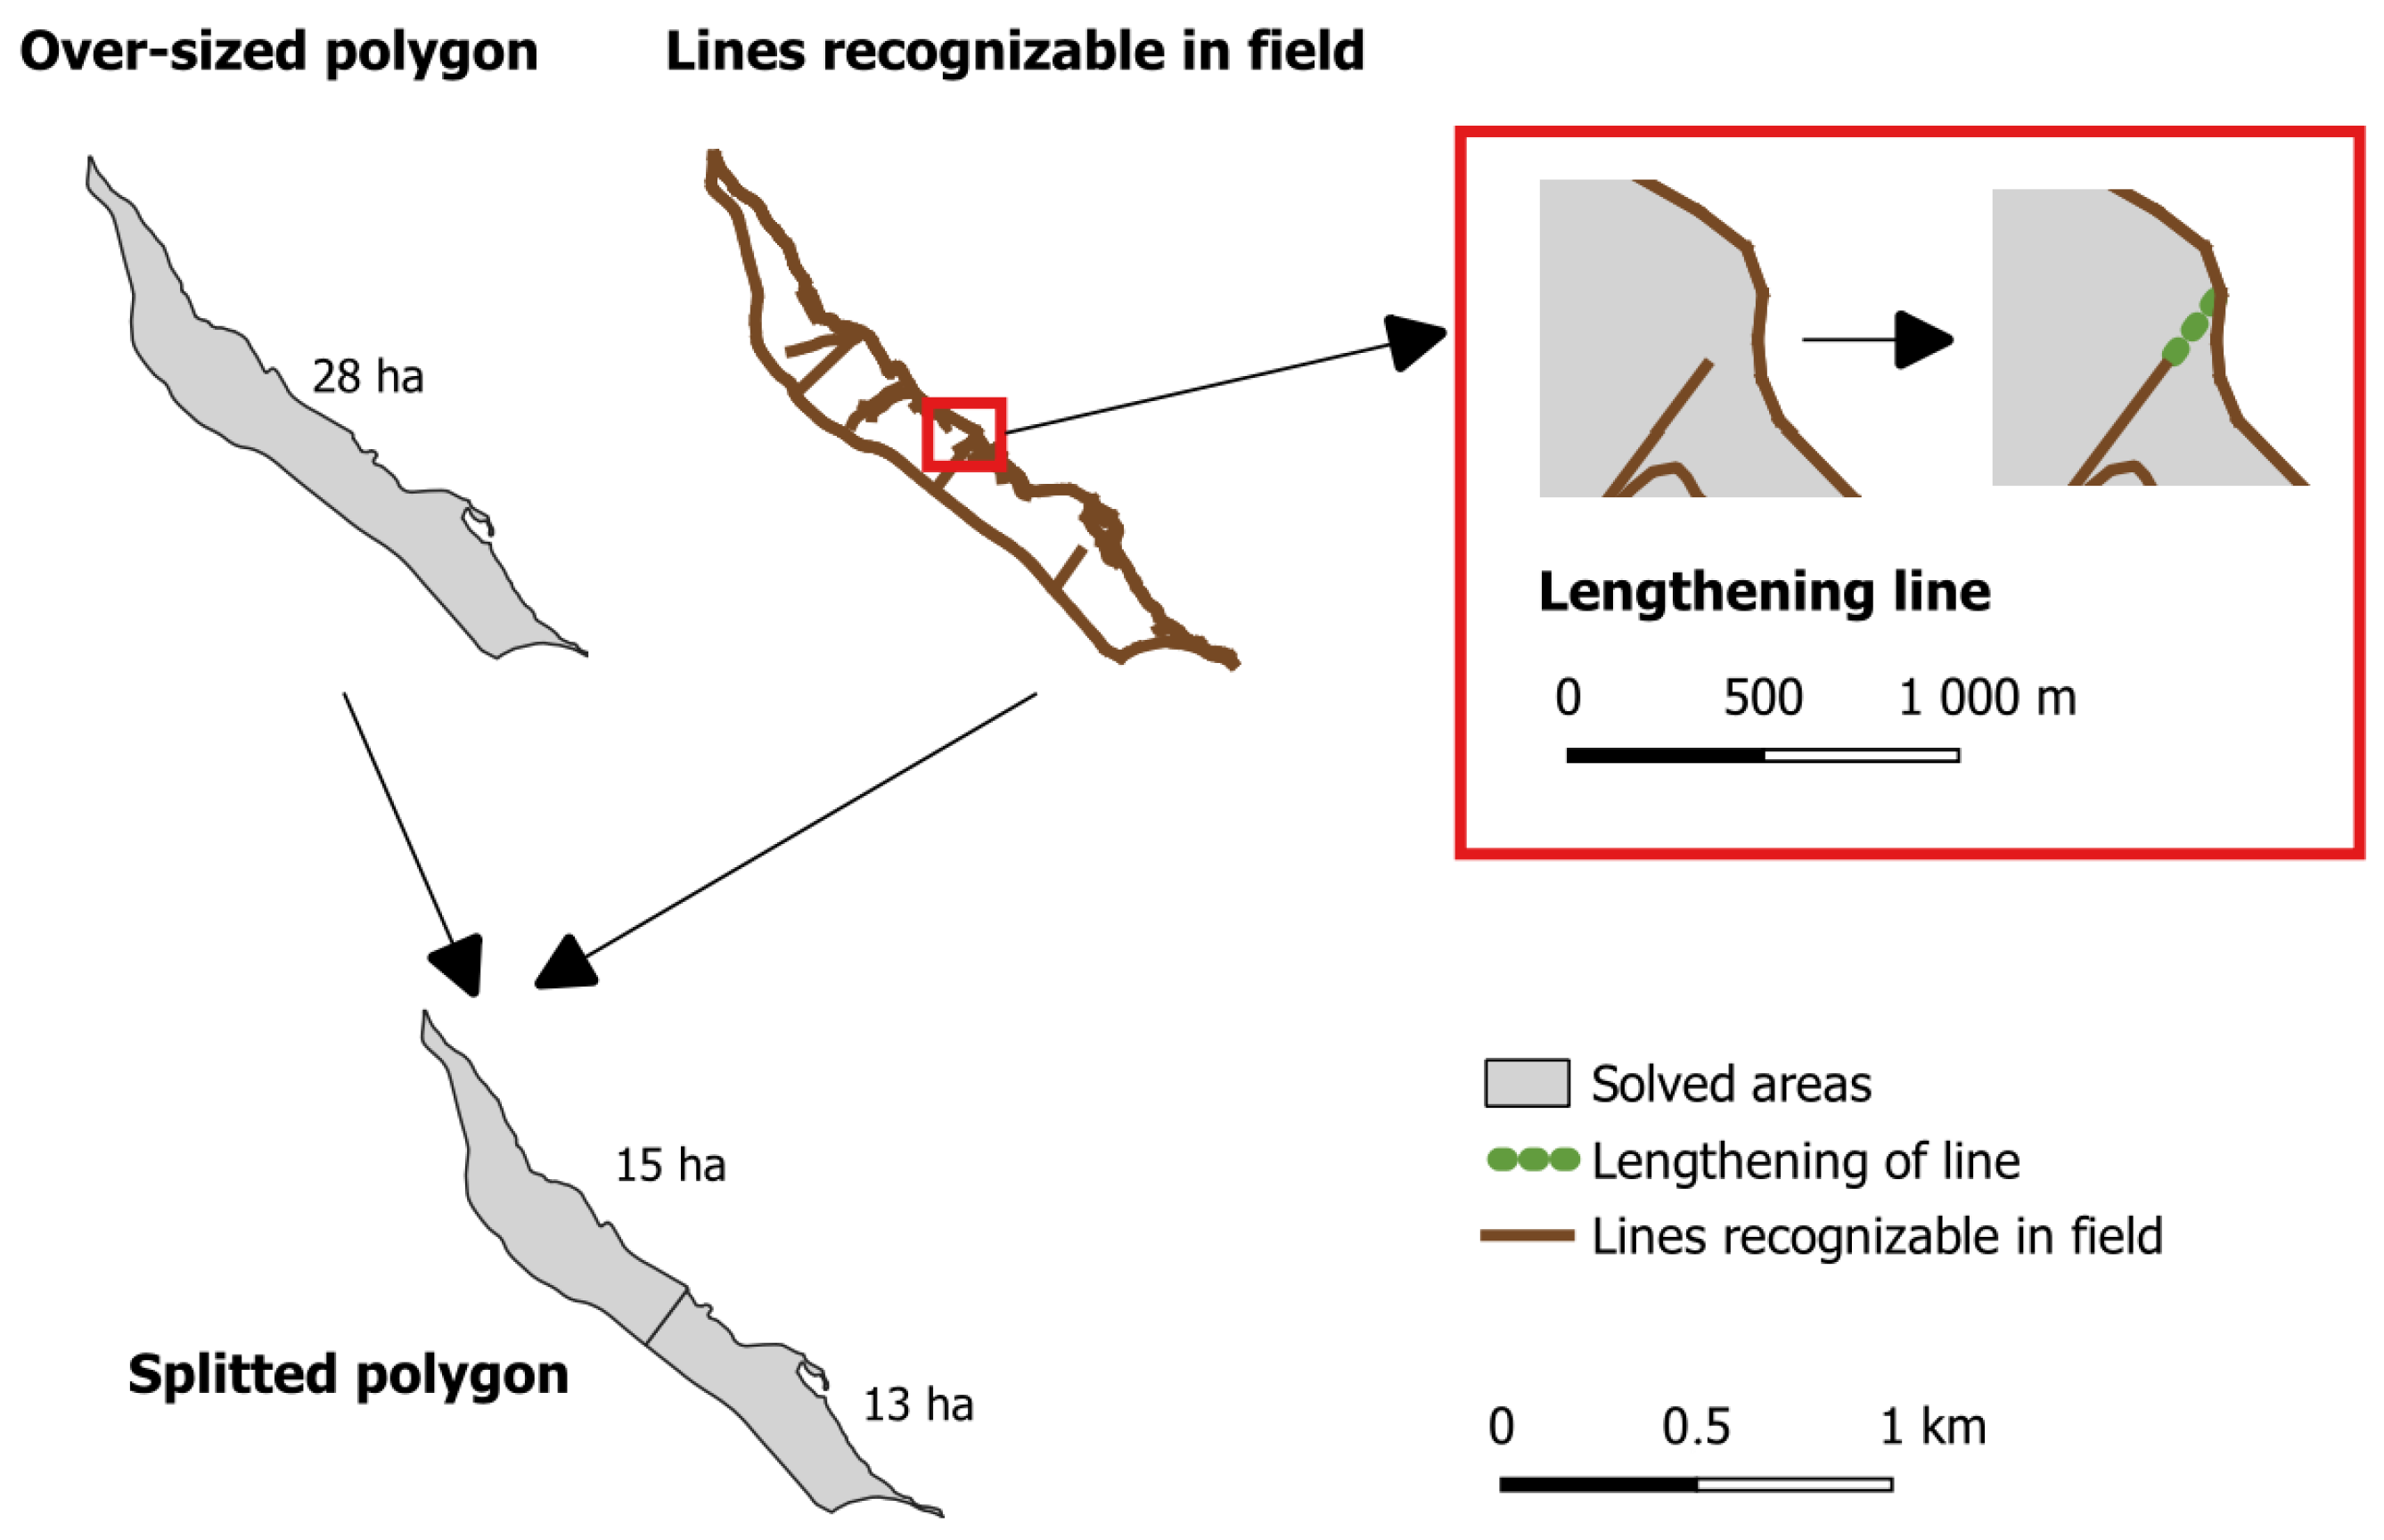
Lines located within excessively large polygons were detected and extended, including those that did not originally reach the polygon boundaries. All the lines were considered. These extended lines were then assessed to determine whether they could effectively subdivide the polygon without creating excessively small parts. If the subdivision was appropriate, the polygon was split.
Figure 5 illustrates the division of an oversized polygon.
Final Dataset Creation
Polygons of appropriate size, together with merged below-size polygons and subdivided oversized polygons, were combined into a single dataset. Large monolithic areas that could not be divided automatically were subjected to manual review and editing.
Figure 3,
Figure 4 and
Figure 5 provide practical examples from the case study.
2.2. Case Study
The suggested method was developed to define search areas for search and rescue operations for missing persons in the Czech Republic. It forms part of the comprehensive Patrac application [
19,
20], designed for the needs of the Police of the Czech Republic. This application provides a wide range of functions, such as evaluating areas with the highest probability of a missing person’s presence and assessing terrain accessibility based on morphological features. However, only a subset of these functions is discussed in this article.
The methodology was implemented as a set of tools, using Java 11.0.28, Python 3.12, and BASH 5.2.21 as the main programming languages. Key libraries and tools include GDAL 3.8.4, PostgreSQL 16.10/PostGIS 3.4.2, and GeoTools 17.1. Processing was parallelized to improve efficiency.
The requirements for creating area segments, as outlined in
Section 2.1, were defined as follows:
Only natural landscape areas are considered (detailed building data are not used; urban areas are divided using main roads through a separate procedure).
Segments are approximately 10–20 hectares in size (suitable for 2–3 h of searching with dogs or other search units).
Segments are defined by recognizable field lines, including objects such as roads, streets, tracks, streams, and walls (a complete list of geofeatures from the ZABAGED dataset is available in
Appendix A).
Barriers include major roads, railways, and rivers (a complete list of geofeatures from the ZABAGED dataset is available in
Appendix B).
Objects, including fields, forests, and water bodies, define borders between land-use types (a complete list of geofeatures from the ZABAGED dataset is available in
Appendix C).
Rules for merging land-use areas: the current version merges only identical land-use types, although the implementation allows specification of which types may be merged.
Parameters for splitting oversized polygons:
- ○
Splitting lines are extended by 50 m.
- ○
The direction of splitting lines is adjusted within a range of −5° to +5°.
- ○
The minimum size of a split section is 4 hectares.
The specific parameter values were defined based on the expert experience of the Police of the Czech Republic in determining the optimal and minimum size of search sectors, and on the characteristics of the topographic dataset used for selecting relevant objects and parameters for splitting oversized polygons.
A key criterion in determining the length by which lines were extended was that a searcher in the field should be able to clearly recognize the boundary of a search sector, even in cases where no visible land-use boundary was present. The range of possible line rotations was empirically tested on several samples. A small angular rotation of ±5° was introduced to simulate minor deviations in direction that commonly occur during field operations due to terrain obstacles, visibility constraints, or navigation inaccuracies. This adjustment enhances the robustness of the method, as it reflects realistic uncertainties in human movement. The parameter settings were also consulted with professional searchers to ensure operational relevance.
After generating candidate lines through this procedure, all lines intersecting the polygon are selected. An optimization step is then applied to identify the most suitable solution, ensuring that the resulting polygons fall within the target size range of 4–20 hectares. This range reflects operational requirements: search sectors smaller than 4 hectares may be inefficient to assign, while sectors larger than 20 hectares may exceed the practical limits of thorough field coverage.
Together, these modifications and constraints ensure that the guiding lines not only provide technically valid intersections but also produce subdivisions that are operationally feasible and closely aligned with realistic search scenarios. This approach improves the methodological reliability of polygon subdivision while maintaining consistency with field conditions.
The Fundamental Base of Geographic Data of the Czech Republic (ZABAGED) served as the primary database [
21]. It contains 143 geographic features (vector layers) [
22] at a scale of 1:10,000. The dataset is regularly updated using Earth observation data, publicly available Internet sources, investigations by local authorities, and field inspections. Special emphasis is placed on incorporating outputs from public administration information systems. The current version corresponds to the situation in 2021–2025 (with updates implemented progressively). The average positional error ranges from 1 to 10 m depending on the feature type, and for many objects it is better than 1 m.
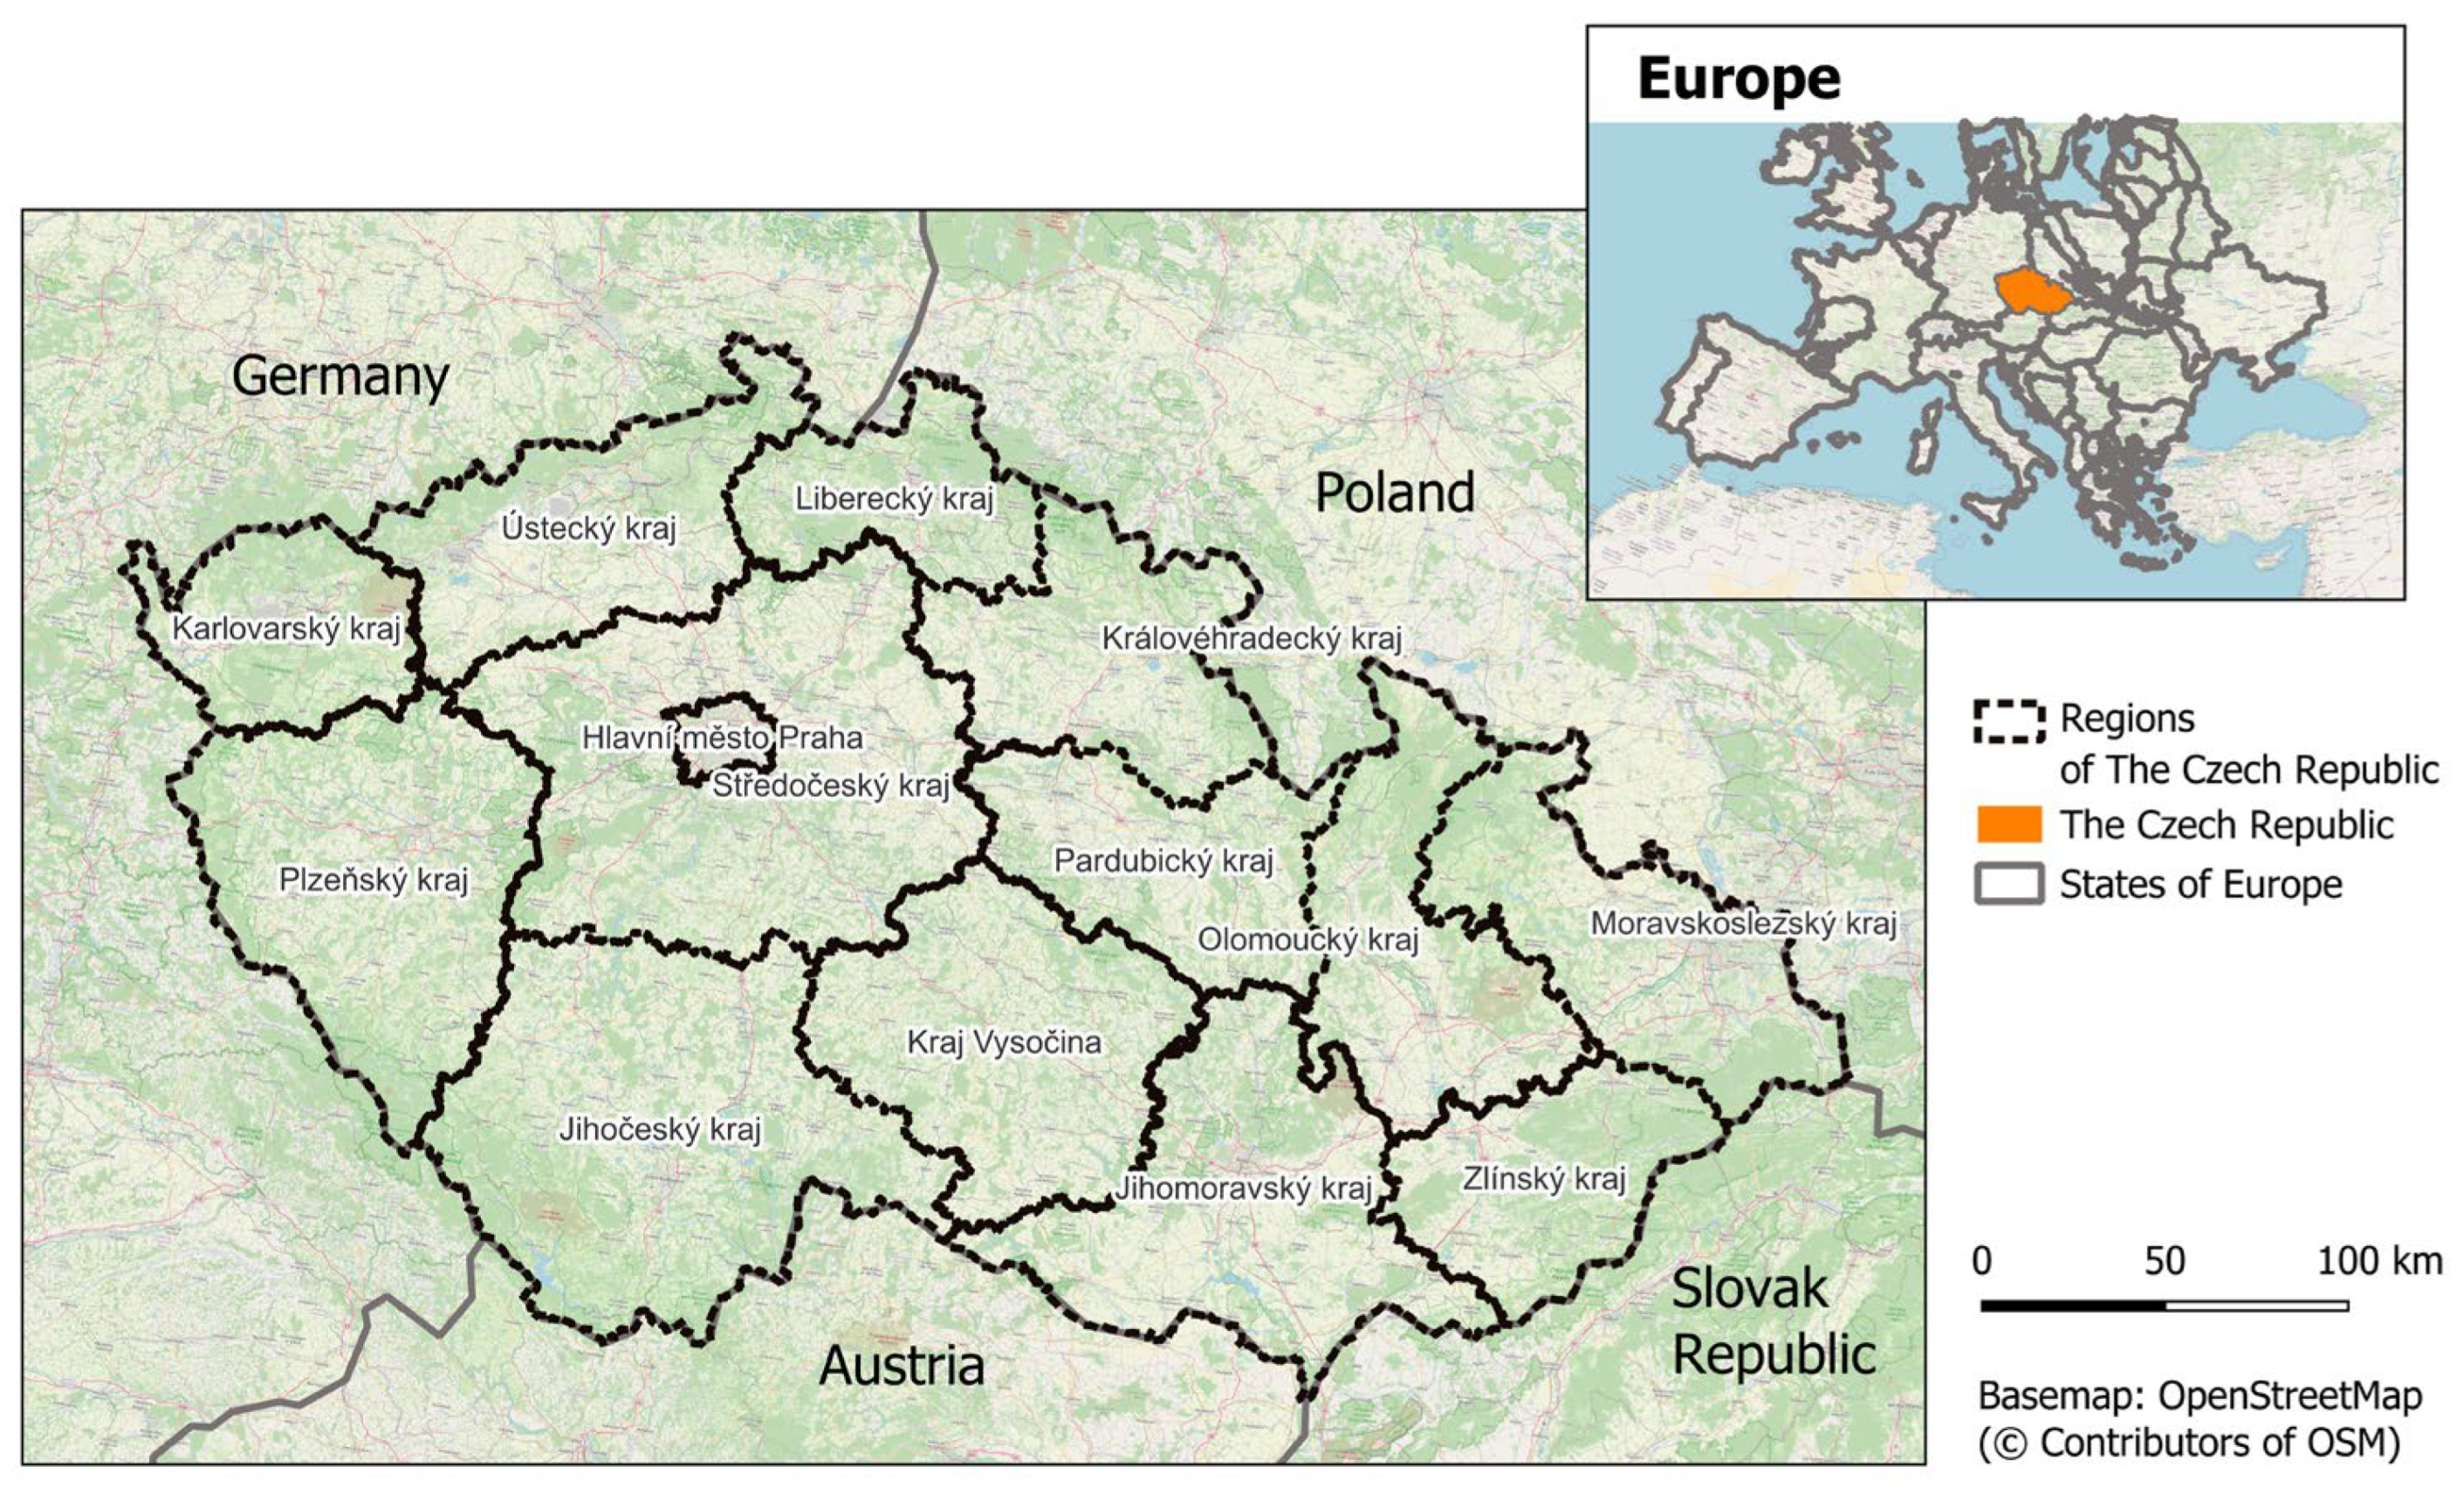
The entire territory of the Czech Republic (78,866 km
2) was divided into 14 administrative regions (
Figure 6).
Table 1 presents the distribution of land-use categories and their heterogeneity within these regions. To ensure continuity with adjacent territories and avoid edge effects, the assessment included a 15 km buffer zone extending beyond each regional boundary.
Land-use heterogeneity was calculated as the ratio between the number of polygons in the ZABAGED dataset within a region and the region’s area (in hectares). This indicator reflects the degree of internal subdivision of a region. Heterogeneity is primarily influenced by the level of urbanization, since the dataset represents development even at the level of individual buildings. Consequently, the highest heterogeneity was observed in the Prague region, which essentially corresponds to the national capital. Conversely, higher forest cover tends to decrease heterogeneity, as illustrated in the Karlovy Vary region. However, this effect is less pronounced compared to the influence of urbanization.
Within each region, the proposed methodology defined search sectors and analyzed them with respect to size distribution, with particular attention to the occurrence of over-sized polygons. The number of such polygons was evaluated both before and after the application of the advanced polygon division procedure (line extension). In addition, the spatial distribution of over-sized polygons across the Czech Republic and their frequency within individual land-use categories were assessed.
Since operationally suitable search sectors benefit from boundaries that are not overly fragmented, the compactness of polygons was also evaluated. Polygon compactness was quantified using Osserman’s formula [
23]: 4π × area/(perimeter
2).
Compactness values range from 0 to 1, where 0 indicates the least compact shape (highly irregular or jagged boundaries), and 1 indicates the most compact (circular) form.
During the development of this methodology, several field practice searches were carried out using the generated search sectors, particularly in operations involving search dogs. The positions of both handlers and dogs were recorded using GPS devices. Their search routes, combined with questionnaire surveys, were analyzed to determine whether the teams were able to correctly orient themselves in the terrain—specifically, whether they were able to reliably recognize sector boundaries and search each sector completely up to its edges.
3. Results
The segmentation of the Czech Republic was carried out in two stages:
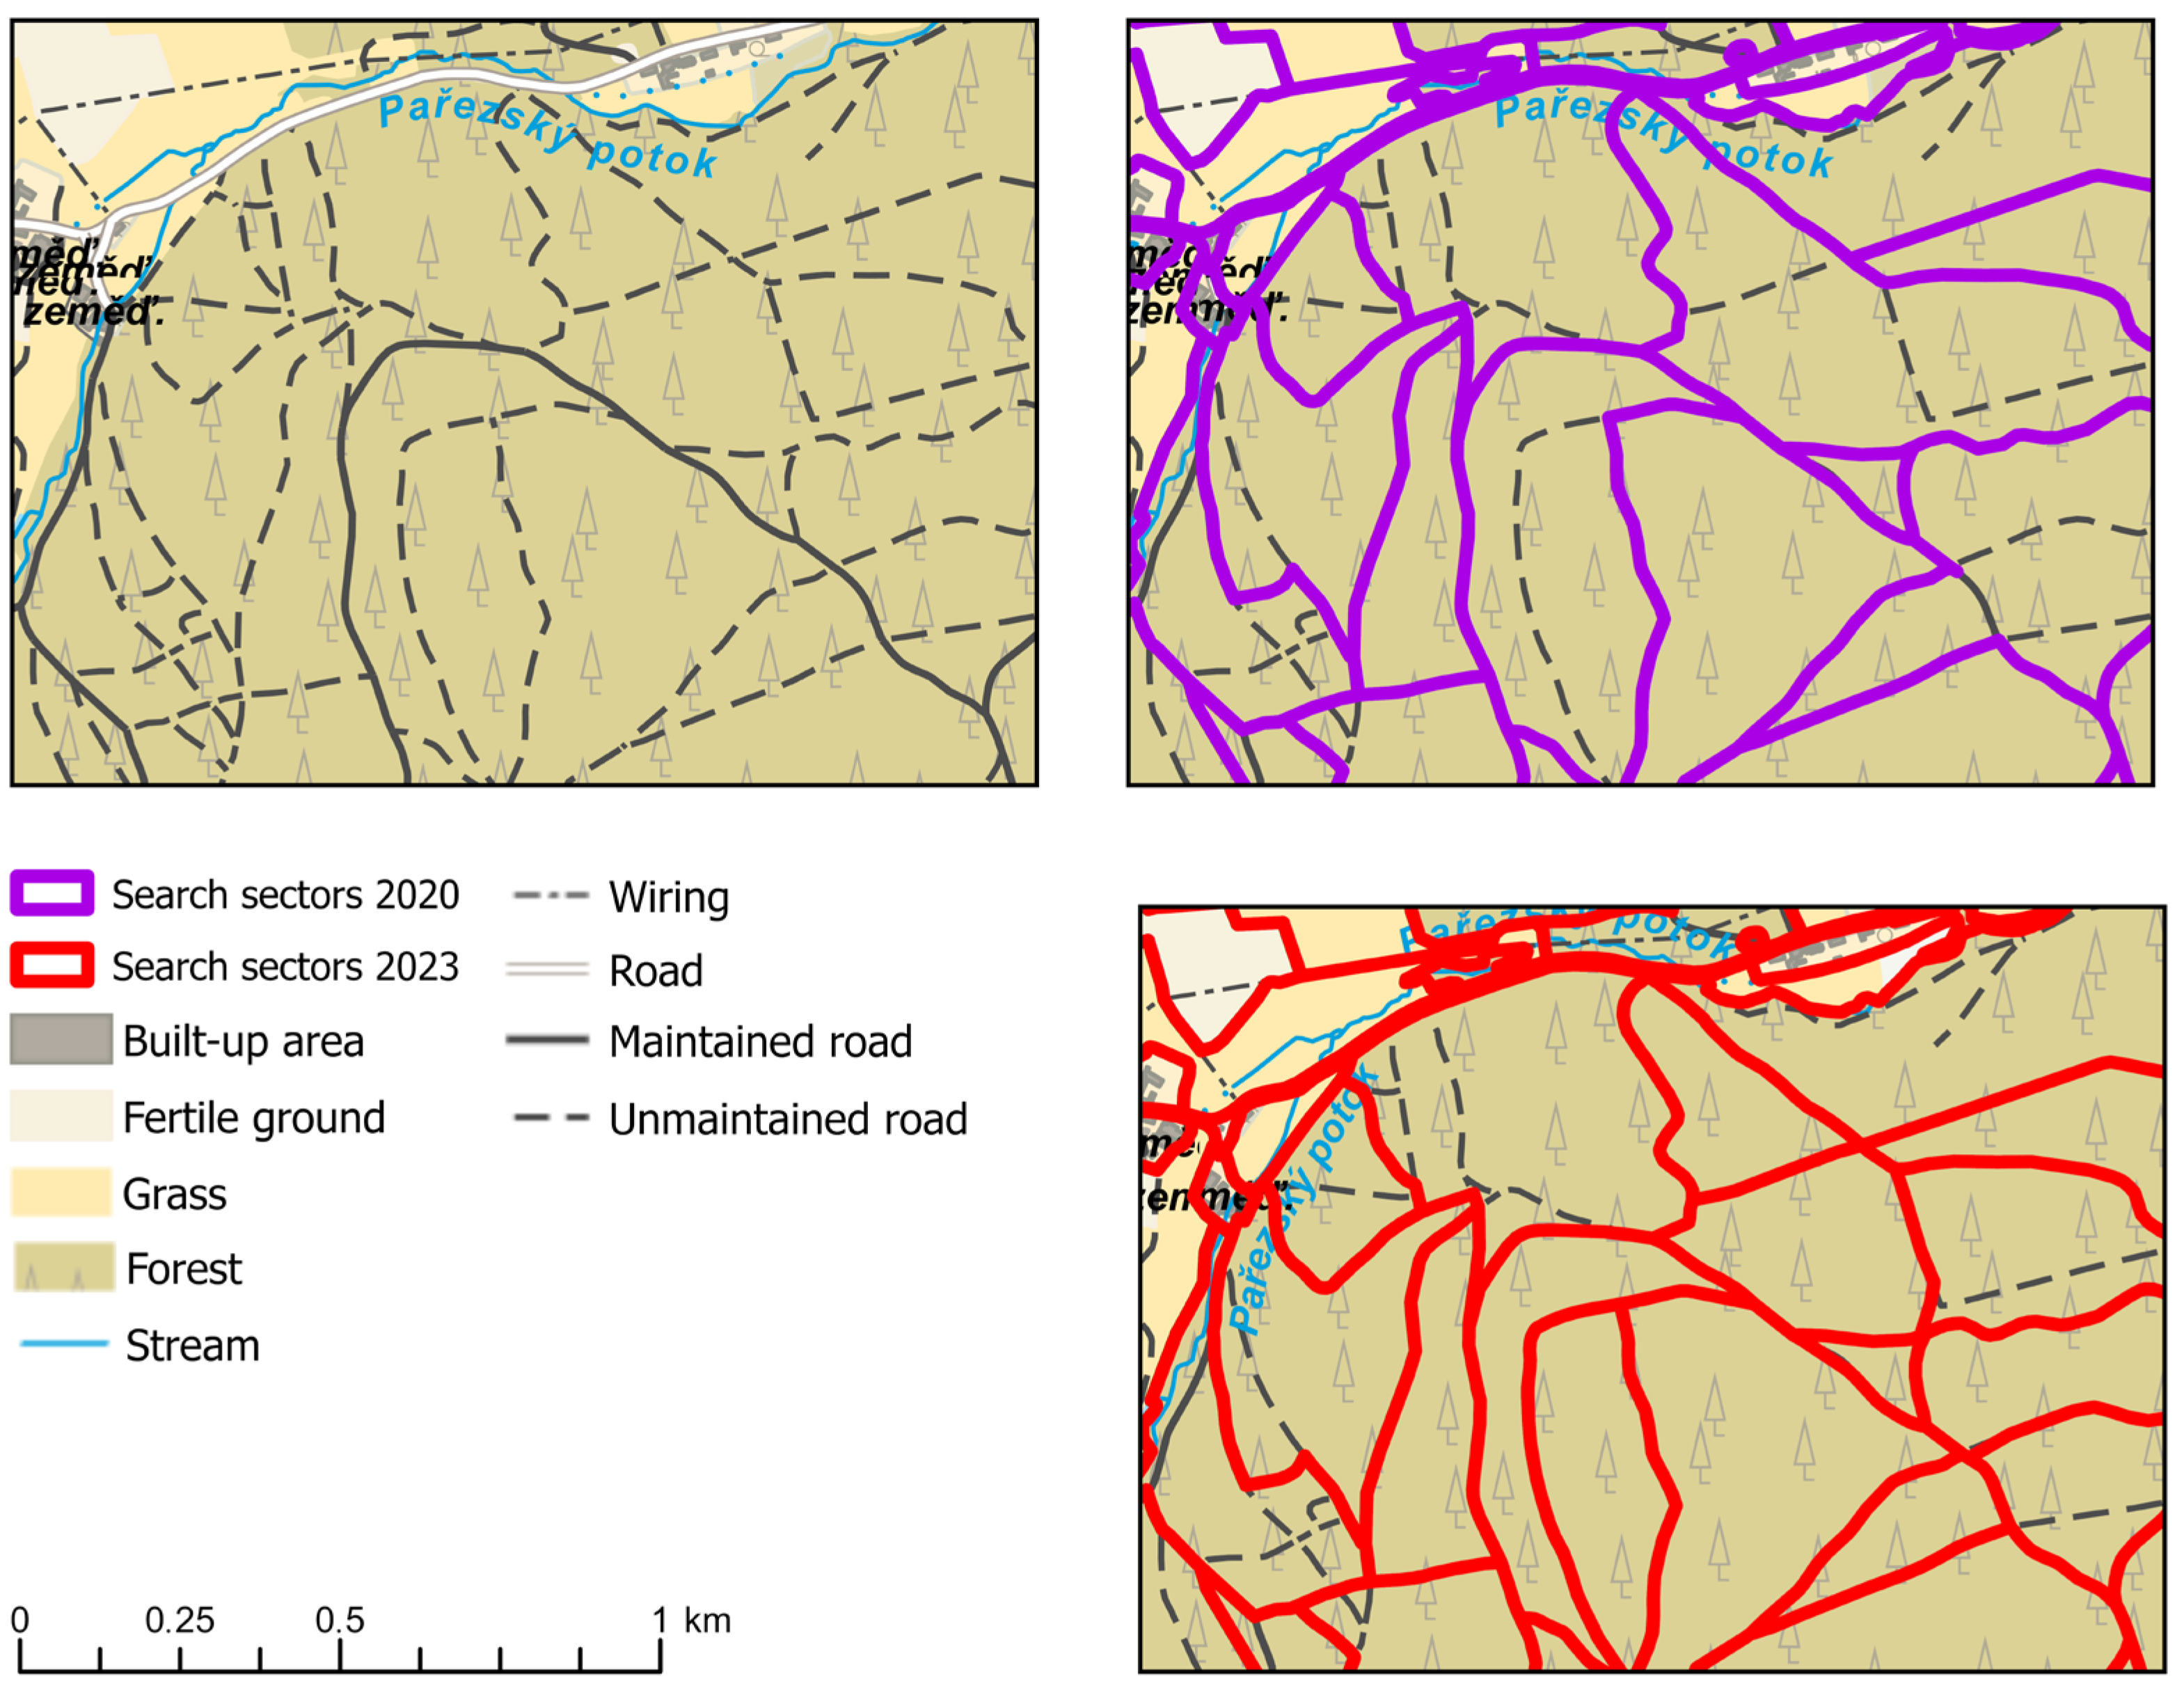
2020: without applying the final step of dividing large polygons using visually identifiable landscape elements.
2023: including the final step, which incorporated the division of large areas.
On average, the calculation requires approximately two days per region when using 8 CPU cores, or about four days if the division of search sectors is applied. Although the use of additional CPU cores can reduce processing time, some components of the workflow cannot be parallelized.
Figure 7 illustrates the creation of search sectors in a selected area. In the upper left corner, line objects recognizable in the field were used to delineate sector boundaries. In this case, the boundary follows both a power line and the edge between a grass-covered area and arable land. Within the larger forested area, roads were primarily used to define the search sectors. A greater number of polygons were generated in 2023, as the shortcomings in line representation of certain roads were automatically resolved.
Table 2 presents the resulting numbers of created search sectors, their average size, compactness, and the proportion of over-sized polygons in individual regions.
In 2020, a total of 773,194 polygons were generated for search operations. Their average size was 10.57 ha, with a mean compactness of 0.45. Of these, 65% were smaller than 10 ha, which prevented merging with adjacent polygons due to differences in land-use. For example, combining a pond with a meadow was not acceptable, as the search requirements differ substantially between these environments. At the same time, 14.27% of polygons exceeded the 20 ha threshold, and 0.73% were larger than 100 ha. Identifying polygons of this magnitude was crucial, since areas exceeding 100 ha would require more than five handlers with dogs—resources that are typically unavailable within a short timeframe in the Czech Republic.
In 2023, after introducing the division of large areas, the number of polygons increased, while the occurrence of excessively large polygons declined. To refine the methodology for the Police of the Czech Republic, criteria for merging areas into larger units were slightly adjusted in 2023, particularly in the case of urban polygons. Whereas in 2020 these were treated separately, in 2023 they were partially incorporated into the calculations. Although urban areas are not used in actual search operations, they were included in this evaluation to maintain comparability and mitigate the effects of methodological changes. Updates were also introduced to the ZABAGED dataset, particularly in the Unspecified category (formerly including ruins or abandoned areas). Consequently, the datasets from 2020 and 2023 are not fully comparable.
The application of extended visible line elements for dividing large areas significantly reduced the number of polygons requiring individual handling. Overall, polygon division successfully reduced the proportion of over-sized sectors by approximately 27.2% between 2020 and 2023. Despite these improvements, the 2023 version is still considered experimental, as the spatial arrangement of polygons is not always optimal. Therefore, the Police of the Czech Republic continue to rely primarily on the 2020 version in operational practice.
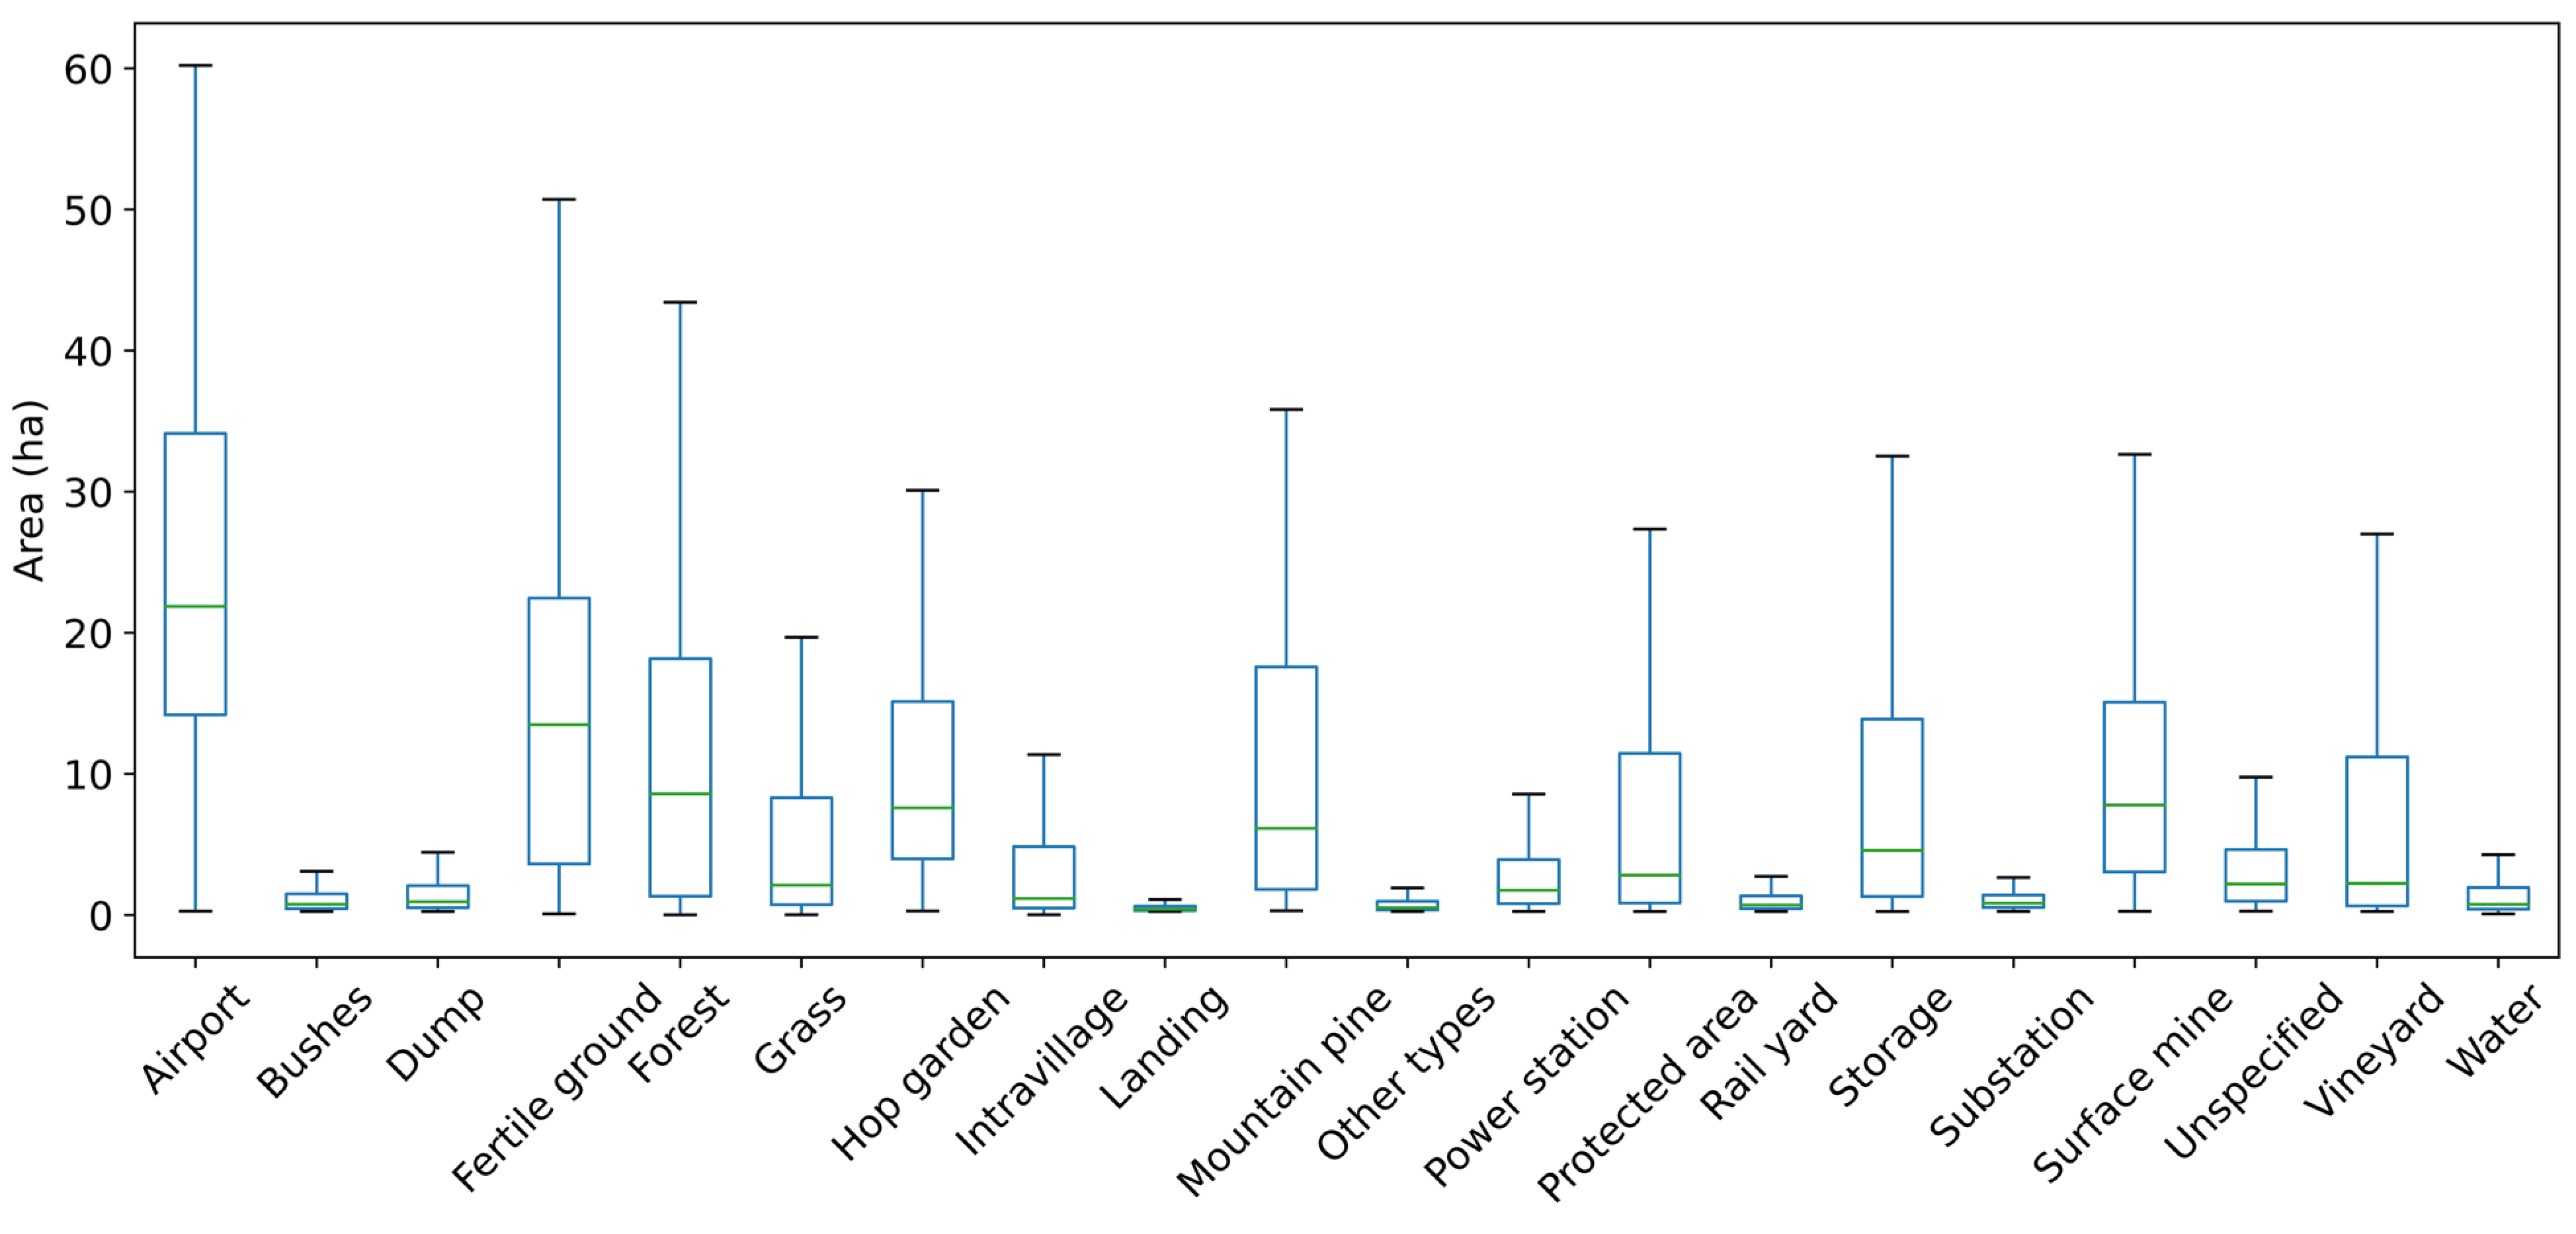
The presentation of search sector sizes using boxplots (
Figure 8) shows that most polygons were larger than the median area for their respective regions. The smallest polygons were created in the Prague region, reflecting its highest heterogeneity (
Table 1), driven by the largest share of urbanized areas and the strong representation of built-up areas in the ZABAGED dataset. By contrast, the Moravskoslezský region—although also characterized by relatively high heterogeneity and a smaller average polygon size (
Table 2)—shows a higher proportion of over-sized polygons. This can be attributed to the more homogeneous agricultural areas and continuous forest tracts of the Jeseníky Mountains located in this region.
The boxplots exclude outliers, which would otherwise reduce resolution at the lower end of the size scale. The maximum polygon size reached 831 ha (arable land). The parameters presented in
Table 1 were designed to examine relationships between various factors, such as the proportion of forested and urbanized areas (or overall land-use heterogeneity), and resulting indicators, such as the average size of generated polygons. However, these relationships do not follow a normal distribution, and the small sample size makes the dataset unsuitable for non-parametric testing. Although the regions appear broadly similar in their statistical indicators (
Figure 6), some variation in land-use distribution is still apparent across individual regions.
A more detailed analysis of polygon compactness (
Figure 9) did not reveal significant differences between regions.
An analysis of the spatial distribution of over-sized search sectors revealed several noteworthy patterns. Their representation in the form of a heatmap (
Figure 10) shows that these sectors are concentrated mainly along regional borders—particularly between the Ústecký and Středočeský regions, the Moravskoslezský and Olomoucký regions, and also within the Středočeský region itself.
When comparing the two stages of polygon creation (2020 and 2023), it can be observed that the concentration of excessively large sectors in 2023 decreased along the border of the Moravskoslezský and Olomoucký regions.
Previous analyses indicated that search sector size is more appropriately evaluated by land-use than by administrative regions. The heatmaps in
Figure 10 show higher concentrations of over-sized sectors in the Czech Central Highlands (northwest) and the Jeseníky Mountains (northeast). This evaluation is further illustrated in
Table 3 and in the boxplots (
Figure 11 and
Figure 12).
The largest polygons were generated in fertile lands, forests, and mountain pine areas, which represent expansive, continuous landscapes that are difficult to subdivide due to the absence of natural, visually identifiable boundaries. Large polygons also persisted within airports, mining sites, and storage areas, although their frequency was lower. Because movement patterns in these areas differ from standard terrain, airports were excluded from operational considerations. Practice searches confirmed that continuous forest cover presented the greatest challenges, especially where the number of paths exceeded those recorded in maps. On the other hand, rescue commanders appreciated the availability of pre-prepared digital maps of search sectors, which facilitated coordination.
In contrast, smaller land-use types, such as transfer stations, substations, and landing zones, produced smaller polygons, as these are artificially defined areas that do not require large coverage.
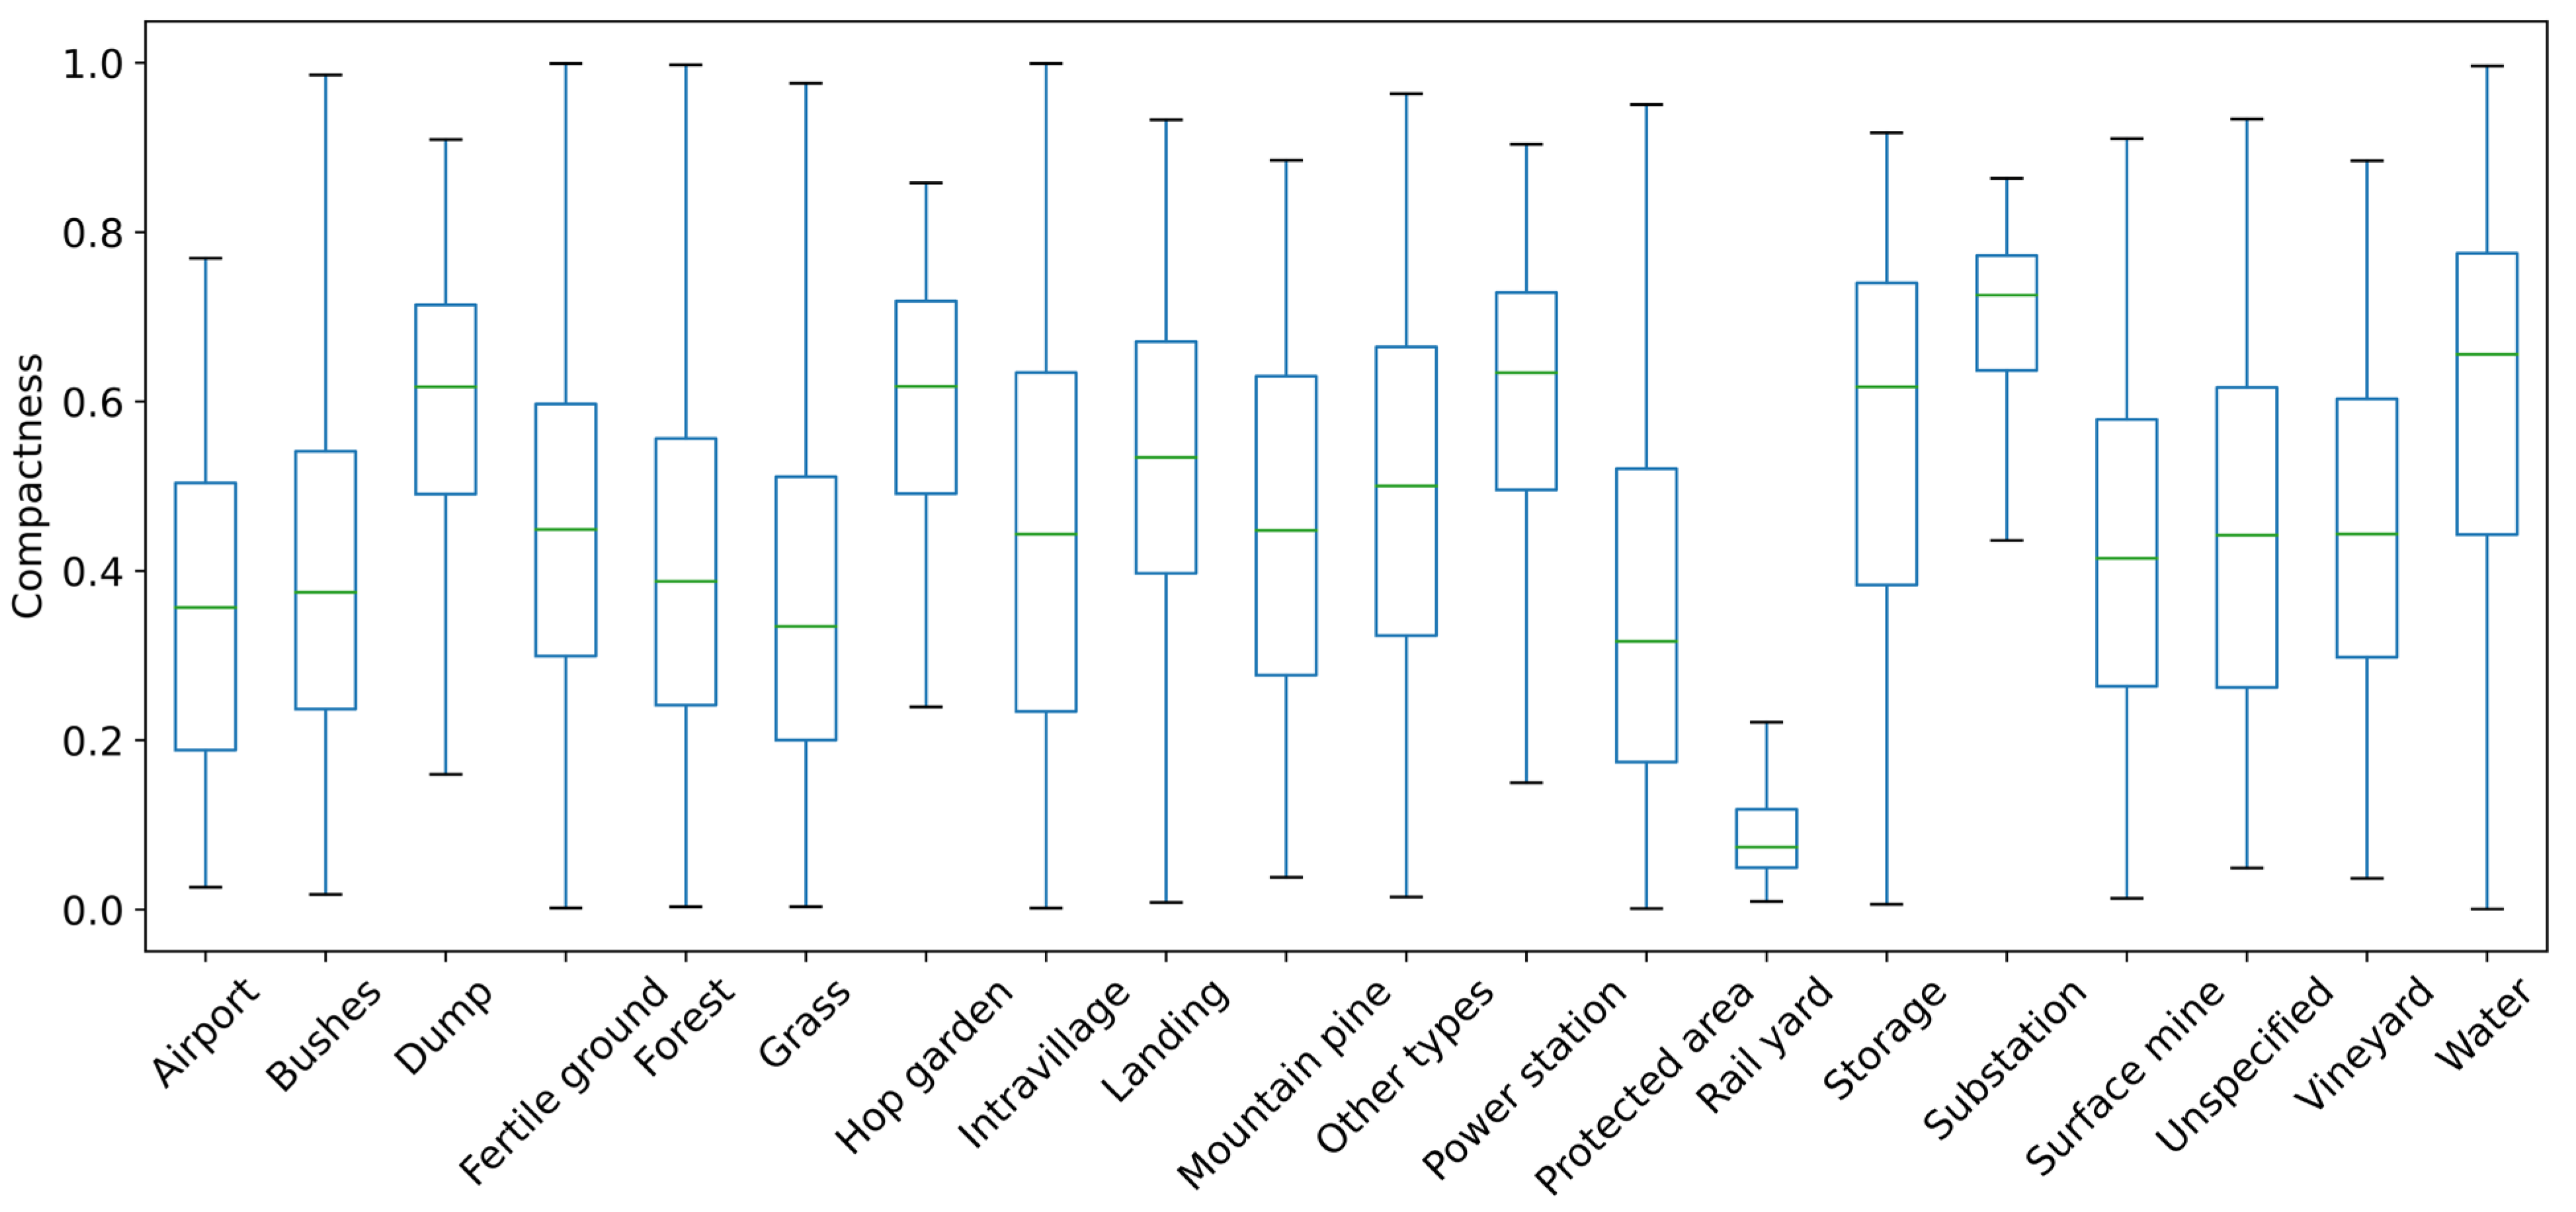
The statistical evaluation of search sectors by land-use revealed substantial differences in polygon compactness (
Figure 12). Rail yards exhibited very low compactness due to their inherently elongated shape. Other artificially created surfaces, such as power stations, substations, dumps, and intravillage areas, showed higher compactness. By contrast, naturally occurring areas such as protected sites, grasslands, and bushes generally had lower compactness, with the notable exception of water bodies.
The automated division of the Czech Republic into search sectors has proven highly valuable for the preparation and execution of missing-person search operations [
20,
24]. The Police of the Czech Republic are expected to update these sectors on an annual basis, with ongoing procedural adjustments and structural optimizations aimed at further refining the parameters of the methodology.
4. Discussion
From the perspective of searching for missing persons, it is essential to adjust the size of the search area according to the type of deployed team—whether it consists of searchers on foot, dog handlers, drivers on all-terrain vehicles, mounted police, or drones. Furthermore, the search area segment must be clearly identifiable in the field, particularly in situations where global navigation system signals may not be available in remote landscapes or forested environments.
Table 4 compares the proposed methodology with standard spatial division approaches. Regular grid-based divisions create artificial boundaries that are not recognizable in the field, making them unsuitable for search and rescue (SAR) operations. While alternative methods improve field identification, they lack sufficient flexibility to control the size of the generated areas, which limits their adaptability to specific operational requirements. By contrast, the proposed methodology combines both clear field identification and control over sector size, making it the most suitable approach for practical SAR applications.
The scale and detail of the topographical dataset are critical for ensuring accurate sector division. Cartographic generalization may omit smaller features, resulting in fewer recorded objects and the creation of larger consolidated areas. For example, footpaths in forested regions are often absent on lower-scale maps, which causes forest areas to appear more extensive than they are in reality. Thus, the more detailed the dataset, the more precise the resulting division. In this study, we used the ZABAGED dataset, whose accuracy and regular updates are guaranteed by the state, though it is limited to the Czech Republic. Alternatively, OpenStreetMap (OSM) could be employed, as it provides a similar classification of geographic features [
22,
25] and is available globally. OSM often offers higher resolution than ZABAGED [
25], but its completeness, accuracy, uniformity, and update frequency cannot be guaranteed.
Field orientation poses additional challenges, especially when global navigation and positioning systems are unavailable. Linear features such as watercourses, power lines, and roads can serve as useful orientation aids, as well as bio-corridors or geomorphological landmarks (e.g., ridges and ravines). However, their detection and precise localization can be difficult. In our case study, we chose not to rely on such features, as there was a risk that searchers could overlook boundaries, potentially with critical consequences. Moreover, incorporating these features would have significantly increased the computational demands.
Point features—such as lookout towers, hilltops, or transmitters—are also widely used for orientation and are typically represented on field maps. Nonetheless, they are unsuitable for delineating natural, linear boundaries of search areas.
The automated division process involves extending selected line features to break up large homogeneous areas. Yet, some sectors remain excessively large because they form continuous units that cannot be further subdivided. In such cases, an individualized approach is necessary, requiring adaptations during field operations. Nevertheless, the methodology is largely automated, which substantially facilitates the planning and management of search activities.
At the regional scale, our case study revealed no significant differences in the average size of search sectors or the proportion of oversized sectors across most regions of the Czech Republic. Forested, agricultural, and urban areas occur with varying frequency, but their averages are relatively balanced. The only clear exception is the Prague region, which, as the capital, is highly urbanized and lacks extensive agricultural or mountainous zones. This finding supports the conclusion that search sectors are better analyzed by land-use than by administrative region.
Despite advances in automation, some oversized sectors persist and require manual adjustment, with forests posing the greatest challenge. In contrast, fertile grounds are often surveyed by drones, which mitigates the operational impact of larger sector sizes.
Although parallel processing significantly reduces the computational burden, processing large regions may still take up to four days. A detailed assessment of the workflow identified repeated spatial intersections and polygon subdivisions—particularly in areas of high feature density—as the most time-consuming operations. File input/output tasks also contribute substantially to runtime. These findings highlight potential avenues for optimization, including the adoption of more efficient data structures, the use of spatial indexing, and the reduction in intermediate write operations. Such improvements could markedly shorten computation times while maintaining methodological robustness.
5. Conclusions
This study presents a methodology for dividing large areas into smaller, manageable sectors, specifically designed for field surveys and tested in real-world search-and-rescue operations. The approach, based on land-use data and the artificial extension of linear geo-features, ensures that search teams can orient themselves even without GNSS, which is critical in remote or forested areas. The inclusion of a procedure for subdividing large homogeneous polygons proved to be a key improvement, substantially increasing the proportion of suitable sectors and addressing a long-standing operational challenge.
The outcomes clearly demonstrate that spatial visualization is indispensable, both for communicating the scientific significance of the results and for enabling practitioners to understand and apply the method effectively. To deepen the interpretation of findings, further statistical analysis of sector parameters is required, especially to examine how geographical attributes influence compactness, navigability, and operational usability. While the method has been successfully implemented in the Pátrač application used by the Police of the Czech Republic and the Rescue Mountain Service, reliance on the national cartographic database ZABAGED remains a limitation, as some features critical for orientation are missing or insufficiently classified. Ongoing tests with OpenStreetMap and other crowdsourced data offer the potential to overcome these constraints, broaden the applicability of the methodology, and adapt it to diverse geographical regions.
This methodology was not only developed but also implemented for the Pátrač application [
19], which is currently in use by the Police of the Czech Republic [
20] and the Czech Republic Rescue Mountain Service. One of its first real-world applications occurred in the fall of 2021, when hundreds of police officers, firefighters, rescuers, and volunteers participated in the search for an eight-year-old girl from Germany. She had been missing for three days in a forested area near the Czech-German border [
24]. The efficient division of search areas played a crucial role in the success of the search operation.
User feedback indicated that the introduction of the new algorithm for subdividing large sectors was generally well received, as it addressed a previously unmet need in the planning process. Nevertheless, a considerable number of oversized sectors remain unresolved, which limits the full effectiveness of the approach. In most cases, the resulting sectors were considered well planned and operationally suitable. However, in certain instances, inappropriate boundaries were selected—for example, unpaved roads were preferred over paved ones when defining sector limits. Such issues highlight the importance of improving the classification of linear features and applying more appropriate weighting schemes during the merging process. By refining these components, it should be possible to reduce the occurrence of suboptimal boundaries and further enhance the usability of the method in practice.
The methodology was designed with field operatives in mind, ensuring they can navigate effectively even in areas without access to Global Navigation and Positioning Systems (GNSS). This is especially important in regions with limited signal availability, such as remote, mountainous, or forested areas.
The future scope of this work will involve testing data from OpenStreetMap (OSM) [
25] and further improving the method for partitioning large blocks. This will help refine the methodology and potentially increase its applicability across various geographical regions and types of field surveys.
The methodology was initially tested using data at a 1:10,000 scale from the national geodatabase of the Czech Republic. However, OpenStreetMap (OSM) offers global coverage, with more detailed data available in developed countries. The primary goal moving forward is to evaluate whether similar results can be achieved using OSM data and whether it can effectively replace national datasets for similar applications. This will help assess the broader applicability and potential advantages of OSM in field survey planning.
Beyond search-and-rescue operations, the methodology holds broader geospatial potential. Its adaptability makes it relevant for biodiversity monitoring, land management, and environmental planning, where the systematic subdivision of large areas into homogeneous, navigable sectors is equally valuable. By combining robust data sources, enhanced statistical analysis, and user-driven refinement, this approach can evolve into a versatile tool with long-term significance for both applied practice and scientific research.
