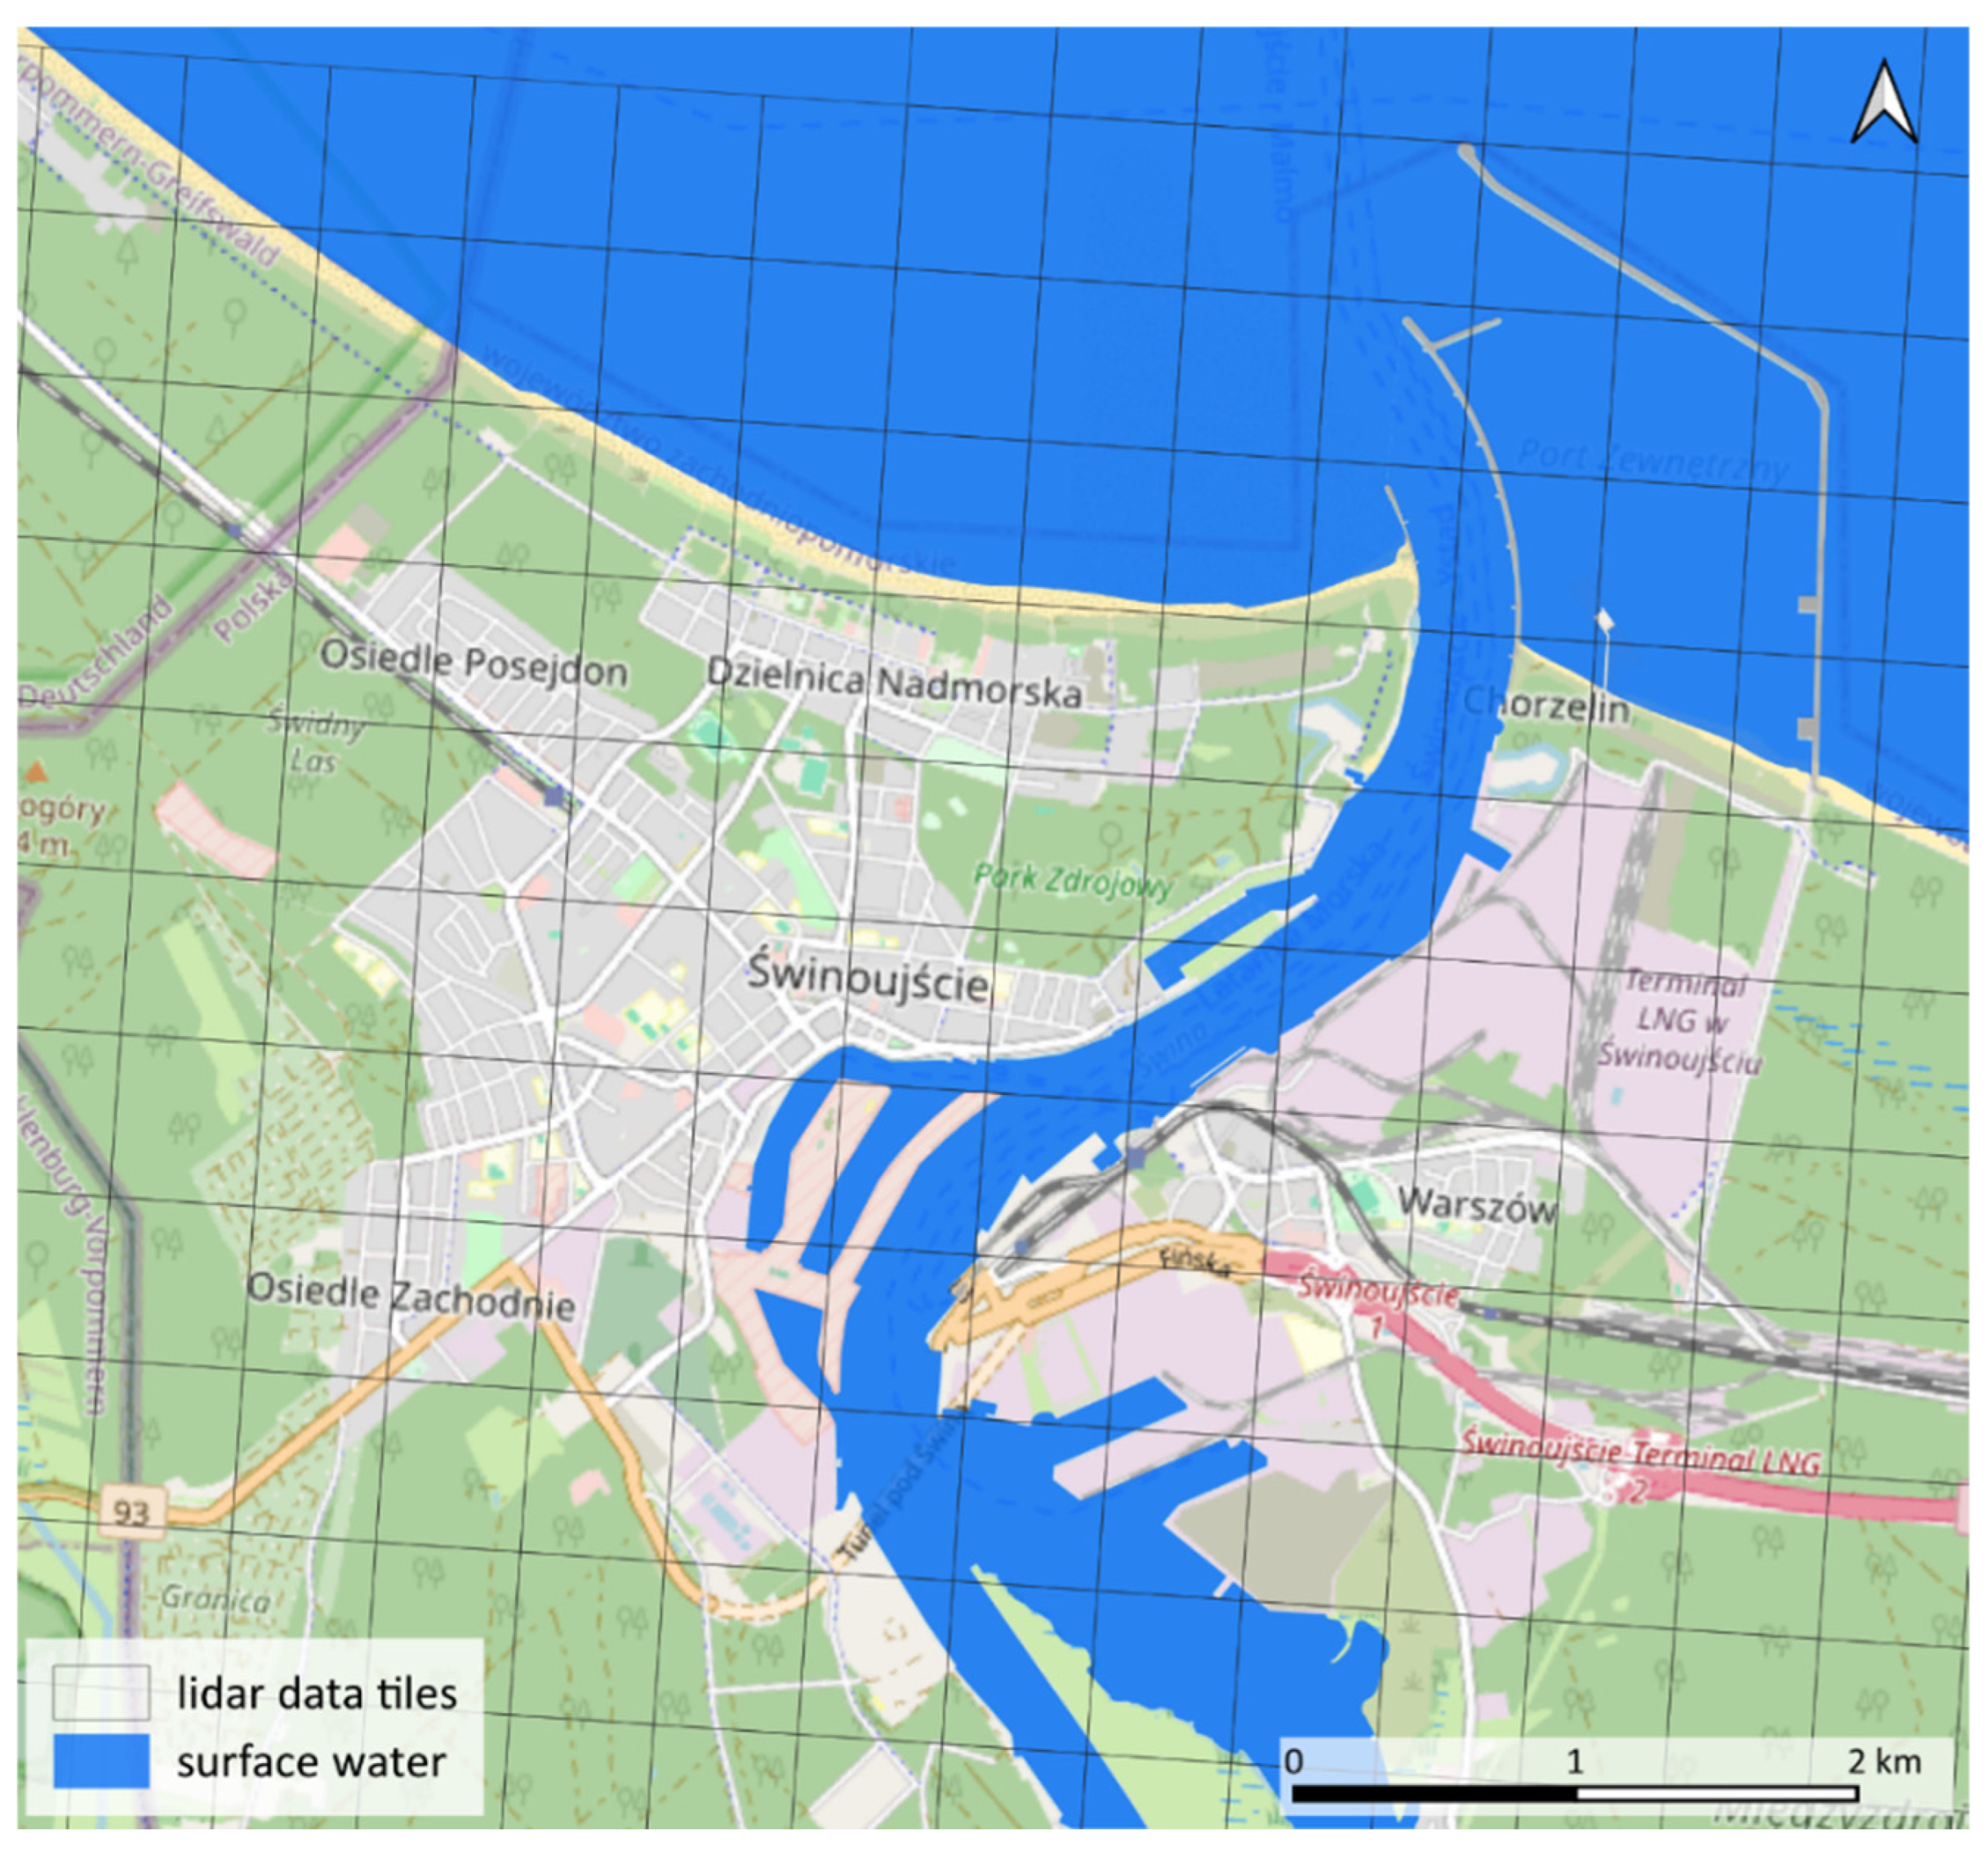
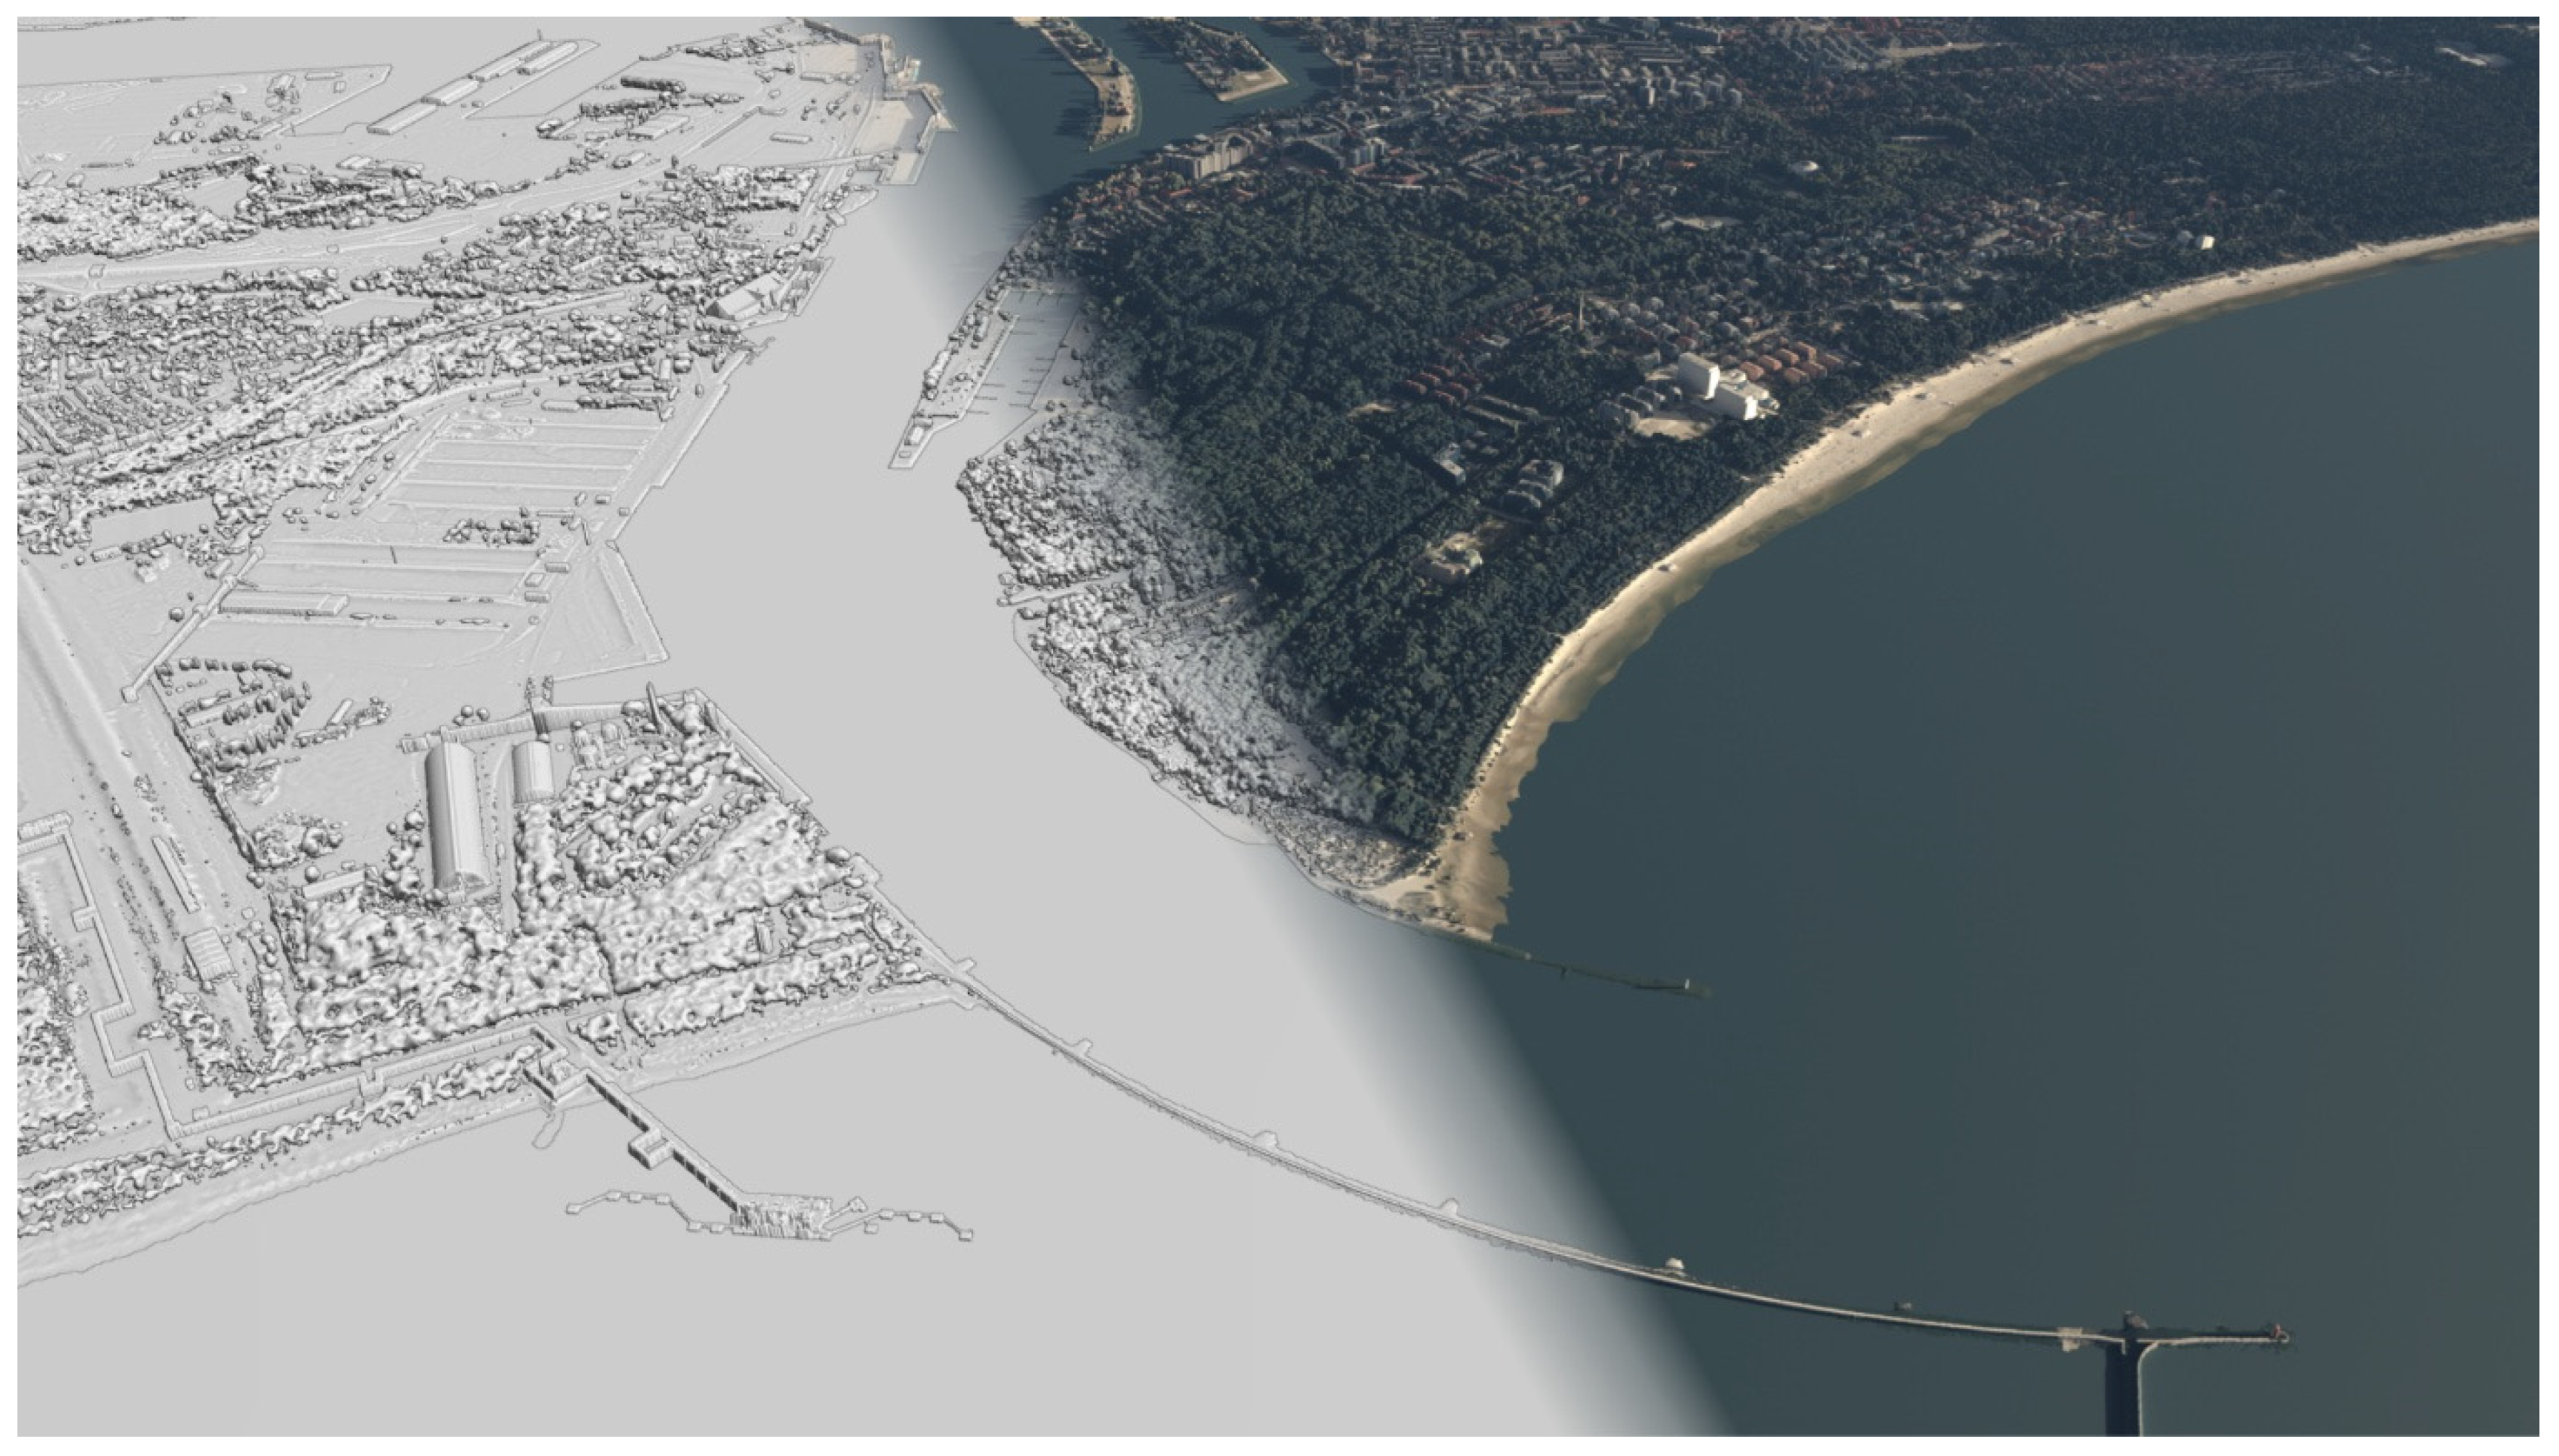
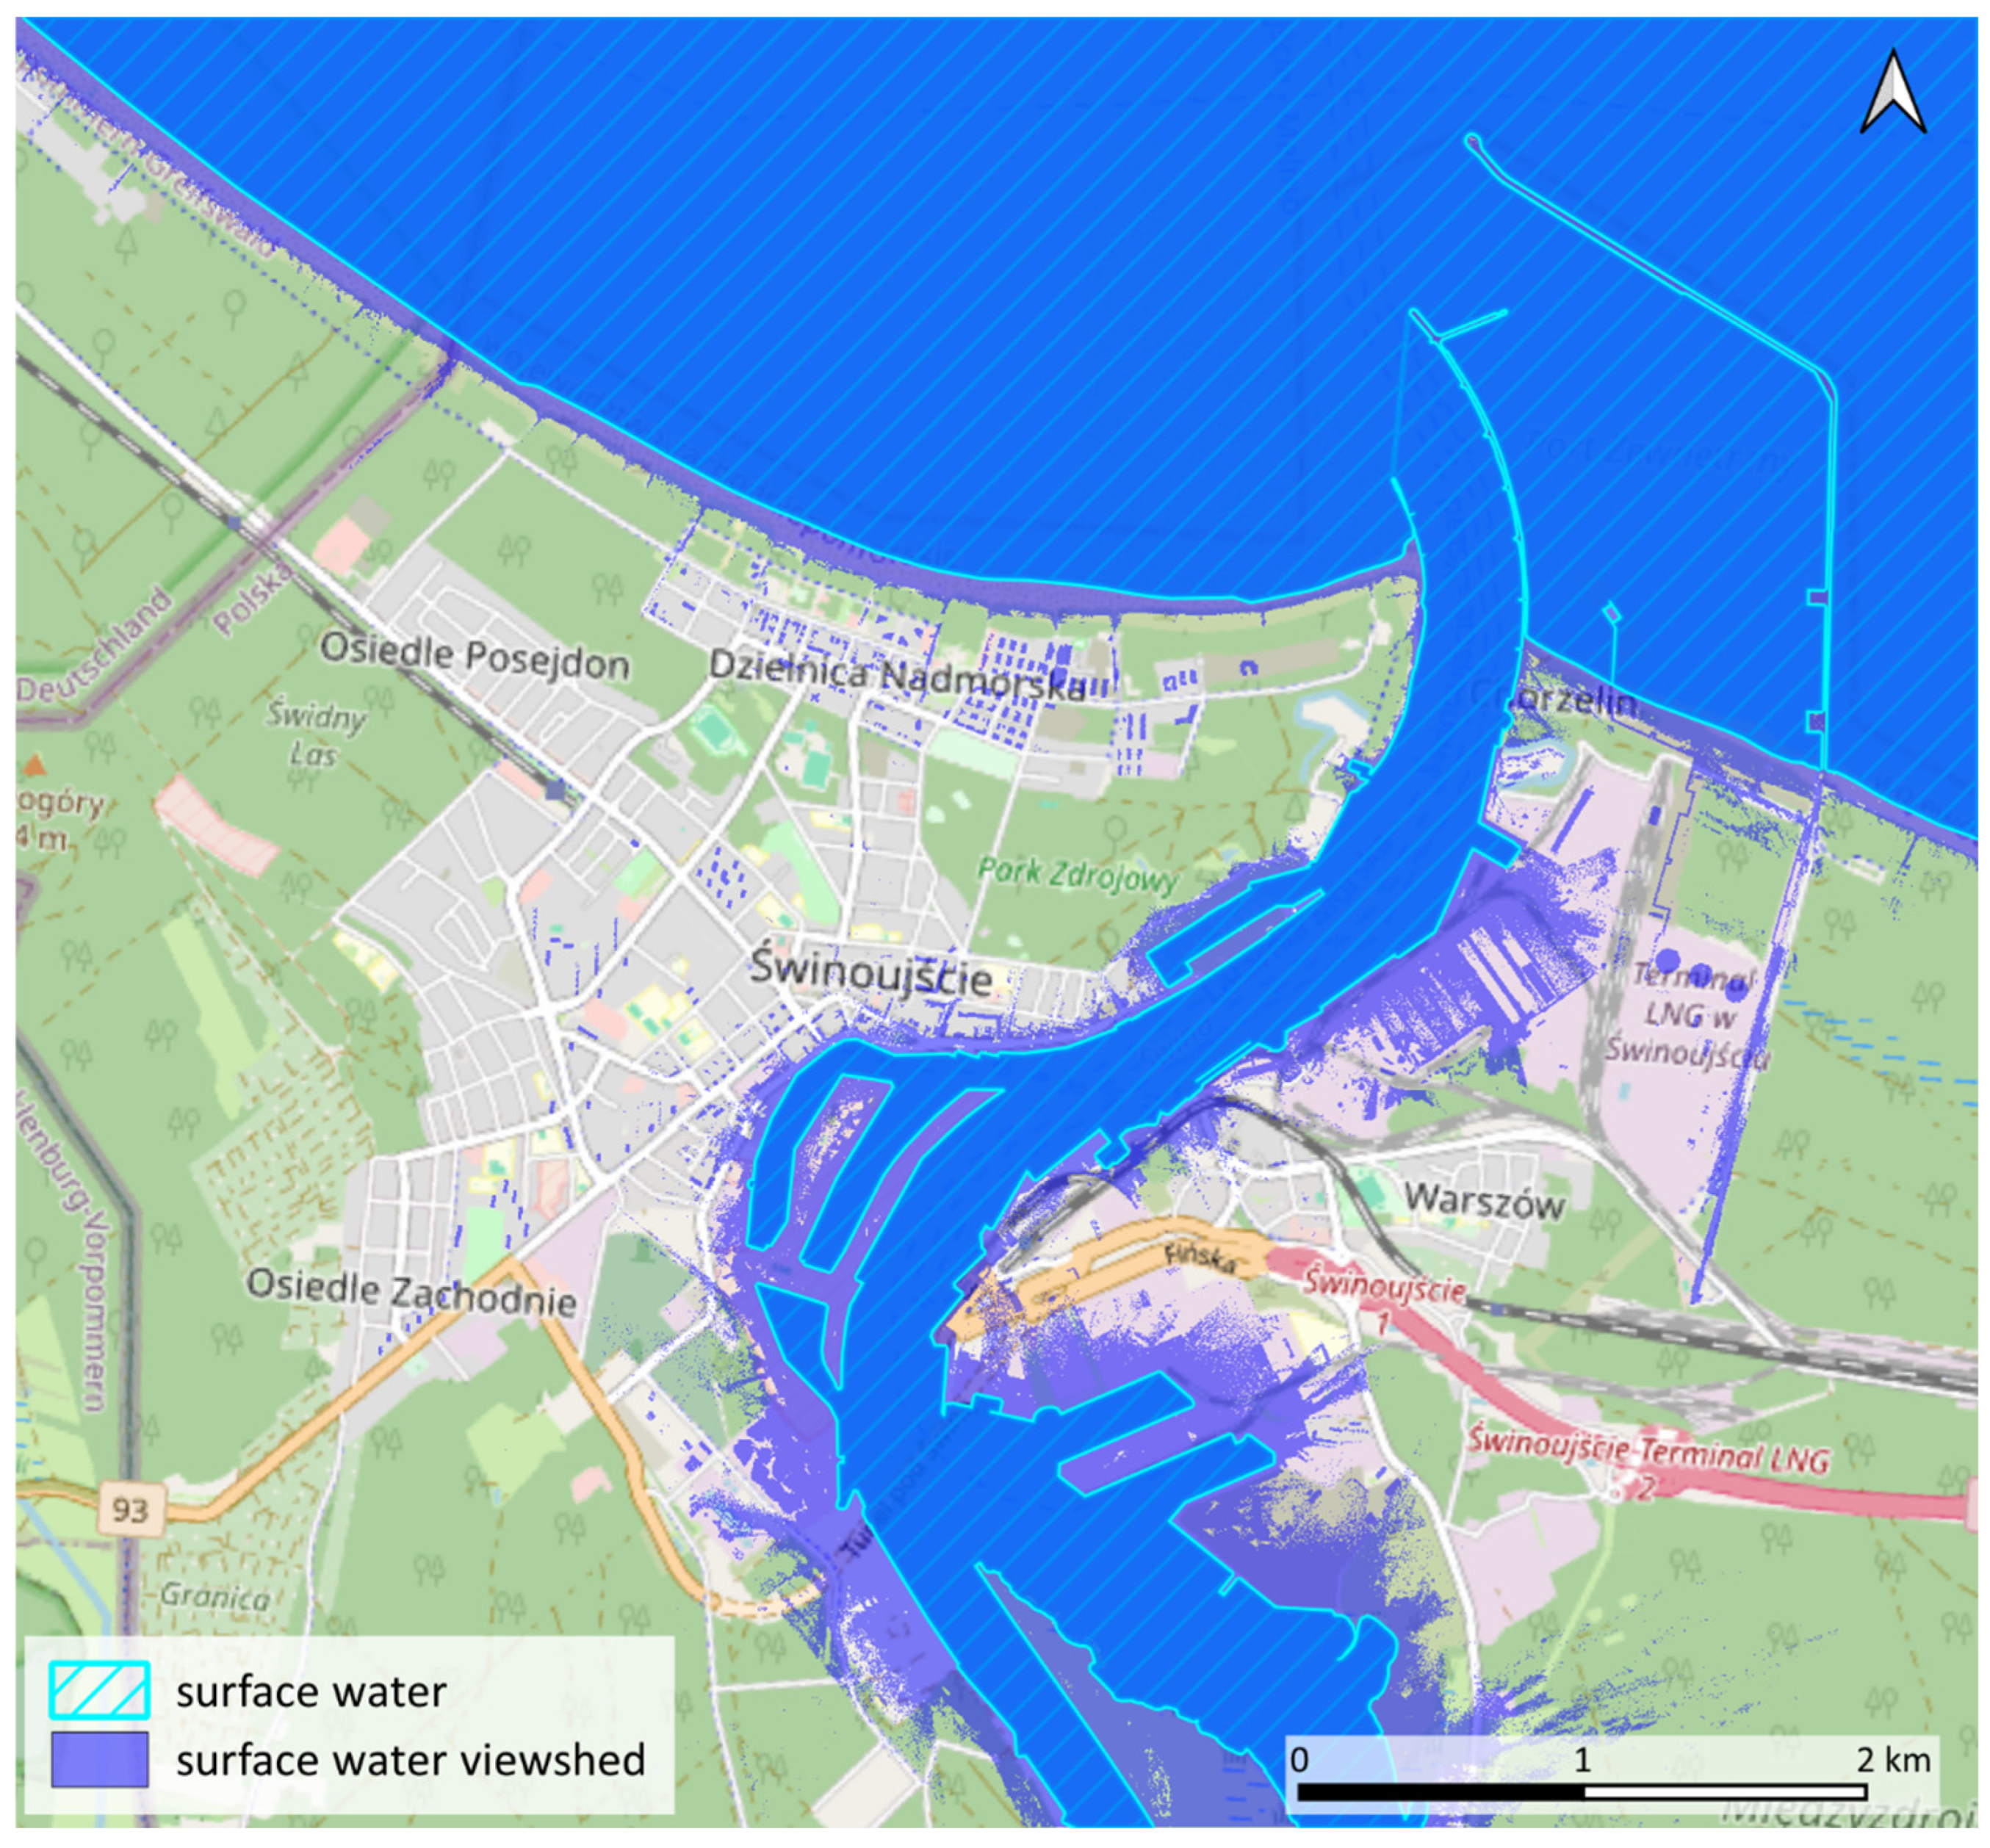
1. Introduction
The sea view has long played a special role in shaping the relationship between humans and space. As a powerful visual and symbolic element of the landscape, the sea serves not only as an aesthetic backdrop but also as a fundamental component of the spatial experience of place. Contemporary landscape and spatial planning analyses increasingly recognize that the ability to observe the maritime space from land carries not only perceptual importance but also measurable social, economic, and spatial implications. A sea view influences the perceived quality of the landscape, contributes to its identity, and enhances the attractiveness of a location for residents, tourists, and investors alike [
1,
2,
3]. Coastal areas offering sea vistas are typically valued more highly in terms of their aesthetic, recreational, and symbolic qualities. The presence of the sea within the visual field generates a sense of openness, harmony, and tranquility, evoking strong cultural associations with freedom, infinity, and a connection to nature. These spaces promote relaxation, restoration, and landscape contemplation, and their availability significantly affects locational decisions, whether related to housing, services, tourism, or investment. From this perspective, sea visibility becomes a spatial asset with potential to directly impact property value, planning decisions, and coastal development policy. Visibility is no longer merely a subjective experience—it is increasingly treated as a measurable parameter within the frameworks of landscape management and spatial planning. A key tool in this regard is viewshed analysis, carried out in geoinformatics environments [
4]. These analyses allow for the identification of locations from which the maritime space is visible and the factors that may limit such visibility.
Coastal landscape management increasingly relies on advanced GIS techniques and visibility modeling, utilizing digital elevation models (DEMs) and digital surface models (DSMs), line-of-sight analysis, and the identification of both natural and anthropogenic obstructions. With the use of dedicated algorithms, it is possible to generate viewshed maps, which visualize from which locations the sea is visible. The resolution of input data, land cover models, and observer parameters affect the level of detail—ranging from general exposure zones to fine-scale visibility maps. These outputs form the basis for further assessments, such as visual impact assessments (VIA) for planned developments, the delineation of view corridors, and the identification of key landscape vantage points.
The aesthetic and identity-related dimension of the landscape refers to the sea view as a contributor to the visual and symbolic value of space. From an aesthetic perspective, the sea is considered one of the most powerful visual components of coastal landscapes. In the literature on spatial perception, open maritime horizons are associated by observers with notions of infinity, openness, tranquility, and symbolic contact with nature [
5,
6]. The sea acts as a visual landmark that defines the rhythm and direction of spatial experience [
7]. As such, the presence of a sea view contributes not only to subjective visual pleasure but also to the broader landscape identity of a place. Perception studies consistently show that visual access to the sea is one of the most important factors in positive landscape evaluations [
6,
7,
8]. Empirical research—based on participant evaluations of photographs or direct observation—confirms that the presence of the sea in the visual field, especially when combined with natural elements such as beaches, dunes, cliffs, or coastal vegetation, significantly enhances perceived aesthetic value [
9]. Panoramic views with wide exposure and long-range visibility are rated the highest and have the greatest capacity to attract attention. For this reason, the sea view is increasingly recognized as an aesthetic public good that warrants protection and active management [
10]. The loss or fragmentation of such views—due to new buildings or vegetative screening—may lead to erosion of landscape identity and a weakening of local residents’ emotional connection to their environment [
8]. Consequently, spatial planning increasingly incorporates the protection of view corridors that preserve visual access to the sea [
7]. In practice, this translates into the identification and preservation of strategic view axes, aimed at ensuring uninterrupted observation of key maritime landscape elements.
Beyond its aesthetic value, the sea view has a strong socio-touristic dimension. It shapes how people—both permanent residents and visitors—experience and interpret the coastal environment. Visual contact with the sea acts as a spatial magnet as it draws people in and creates spaces for gathering and social integration. In tourism, the sea view is recognized as one of the most important factors influencing the attractiveness of a destination [
5,
7]. For tourists, it is often a primary motivator affecting destination choice, length of stay, visitor satisfaction, and likelihood of return. Studies on tourist preferences show that the opportunity to admire a seascape—especially from public spaces, walking trails, scenic viewpoints, or accommodation facilities—significantly enhances the quality of the overall experience [
5]. Seaside promenades, viewing terraces, cliffs, dunes, and waterfront boulevards not only provide visual access to the sea but also serve as social settings that host public life. Maintaining unobstructed sea views in these spaces is crucial to preserving their social function and strengthening the relationship between residents and the landscape. From the perspective of tourism and public space management, the sea view can also be seen as a strategic asset that influences the planning of tourism routes, the location of services, and the development of recreational zones [
11]. However, increasing land-use intensity in coastal areas often reduces visual access to the sea—whether through dense construction or natural overgrowth of once-open areas. Such changes can diminish a place’s identity and reduce its attractiveness.
The economic dimension of sea visibility is also well-documented. In the literature on spatial economics and real estate valuation, numerous studies confirm that the presence of a sea view—especially from within a residential unit or its associated space—significantly increases market value compared to properties without such exposure [
12,
13]. Hedonic pricing models show that this effect can reach up to the mid-teens in percentage terms, particularly in areas where sea views are scarce and in high demand [
14,
15]. The view thus becomes a competitive asset that influences investment strategies, buyer behavior, and local development policies [
16,
17]. Integrating view-related data into property information systems can improve market transparency and support evidence-based planning decisions. The visibility factor is quantifiable and can be captured through hedonic models that isolate the contribution of the view to total property value [
14]. The effect is especially pronounced in areas with limited supply of properties offering open sea views—such as steep coastlines, highly urbanized waterfront zones, or protected scenic areas. In this context, the sea view evolves from being merely a visual amenity into a financially valuable asset that can be capitalized on and included in investment strategies, housing policies, and local governance [
10,
18]. The availability—or lack—of sea views can influence the profitability of development projects, short-term rental returns, and transaction dynamics in real estate markets [
13]. Including visibility data in real estate information systems can significantly improve the accuracy of market forecasts and enable more transparent evaluation of the view’s impact on pricing. Such analyses can also support scenario-based planning—for example, by modeling how new buildings will affect sea views, taking into account location, building height, terrain topography, and existing view obstructions.
In the realm of spatial planning and landscape management, visibility is a key parameter that allows the sea view—as a valuable asset—to be measured, analyzed, and regulated within planning processes. Within the context of sustainable spatial development and proactive landscape governance, sea visibility functions as a measurable indicator of landscape quality and a tool in sustainability-oriented policy [
10,
17,
18]. Viewshed analyses conducted in GIS environments enable spatial modeling of sea view reach, assessment of development scenarios, identification of visual barriers, and the design of spatial interventions. In an era of rapid coastal urbanization, investment pressure, and increasing landscape fragmentation, maintaining visual access to open maritime space has become a strategic priority [
10]. The sea view is no longer treated as a passive backdrop—it actively shapes spatial quality and the structure of the landscape. One of the major challenges in contemporary planning is the identification and protection of key visual axes to the sea. In practice, this process requires locating vantage points with access to the sea and securing them through building restrictions, vegetation management, or terrain shaping [
19,
20,
21]. These efforts lead to the establishment of so-called view corridors, designed to ensure continuous visual contact with the seascape—both in the short term (e.g., for a promenade user or visitor at a viewpoint) and in the long term—for residents and future generations.
Despite the availability of advanced tools, visibility analysis remains a methodological challenge due to several technical limitations. The algorithms used to determine viewsheds have changed very little since the early stages of GIS development [
22,
23,
24]. In GIS-based visibility analysis, only point targets can be evaluated, making this approach most accurate for point features such as wind turbines [
7], electricity pylons [
25], or human observers [
26]. When analyzing surface features such as bodies of water, a common workaround is to place a grid of target points across the surface. In such cases, the accuracy of the visibility results depends directly on the number and spatial distribution of these points. Another limitation is the high computational demand of GIS-based viewshed analysis. This often forces users to work with lower-resolution digital surface models, significantly increasing the uncertainty of the output [
27]. However, the most fundamental limitation stems from the nature of GIS itself, which relies on 2.5-dimensional representation models, where each surface location is assigned a single elevation value. While these simplified models are widely used in geoinformatics due to their ease of processing, fast computation, and simple map visualization, they are unable to realistically represent human visual perception. This is especially problematic when modeling complex features such as vegetation, which in 2.5D models are typically represented as opaque vertical walls that fully block the view. Other challenges arise with bridges, overpasses, or buildings with complex geometry that cannot be properly captured in 2.5D space. These structural limitations prevent accurate visibility modeling in dense urban or natural environments and highlight the need for alternative methods based on 3D models.
In response to these limitations, this study proposes a methodology for determining water surface visibility using high-resolution LIDAR data and 3D ray tracing within a fully three-dimensional environment. The approach builds upon techniques previously applied in visibility analyses of photovoltaic farms [
23].
2. Materials and Methods
The visibility analysis of the water surface was conducted according to the methodology developed by [
23]. This approach integrates GIS tools (QGIS 3.4) with 3D graphics software (Blender 4.3). The foundation is a 3D scene of the study area developed from LIDAR point cloud data. The development of the 3D scene is based on LIDAR point cloud data and consists of terrain, vegetation, buildings models. The technical process of constructing the 3D scene is described in detail by [
23]. Working within a 3D environment allows for flexible scene modifications—such as adding or removing elements or altering terrain features. Enhancing the 3D scene with orthophoto textures results in a photorealistic and fully interactive model, enabling free exploration even from a human perspective.
To identify the visibility zones of the water surface, a ray-tracing-based method of 3D viewshed analysis was employed [
23]. The method utilizes Blender 4.3 software and its Cycles rendering engine, which simulates the physical behavior of light to generate realistic images. It operates on the principle of ray tracing—a technique that models how light interacts with objects in a 3D scene.
For the purpose of visibility determination, many features of the Cycles engine that contribute to photorealistic rendering—such as reflections, caustics, and volumetrics—were disabled. The number of ray bounces was set to zero. Renders were generated at a 1 m resolution using GPU rendering with 4096 samples per pixel.
In this study, the water surface was assigned an emissive material that emits light uniformly in all directions. Terrain, buildings, and vegetation were modeled with simplified light-interaction properties; terrain and buildings receive incoming rays but do not reflect them further, while vegetation blocks light without reflecting it or appearing in the final render. This configuration allows vegetation to function as an occluding element without being identified as a visible surface—a common limitation in the standard GIS-based approach. Furthermore, visibility is assessed under tree canopies, increasing the accuracy of the analysis—something that is not achievable with the 2.5D limitations of conventional GIS tools.
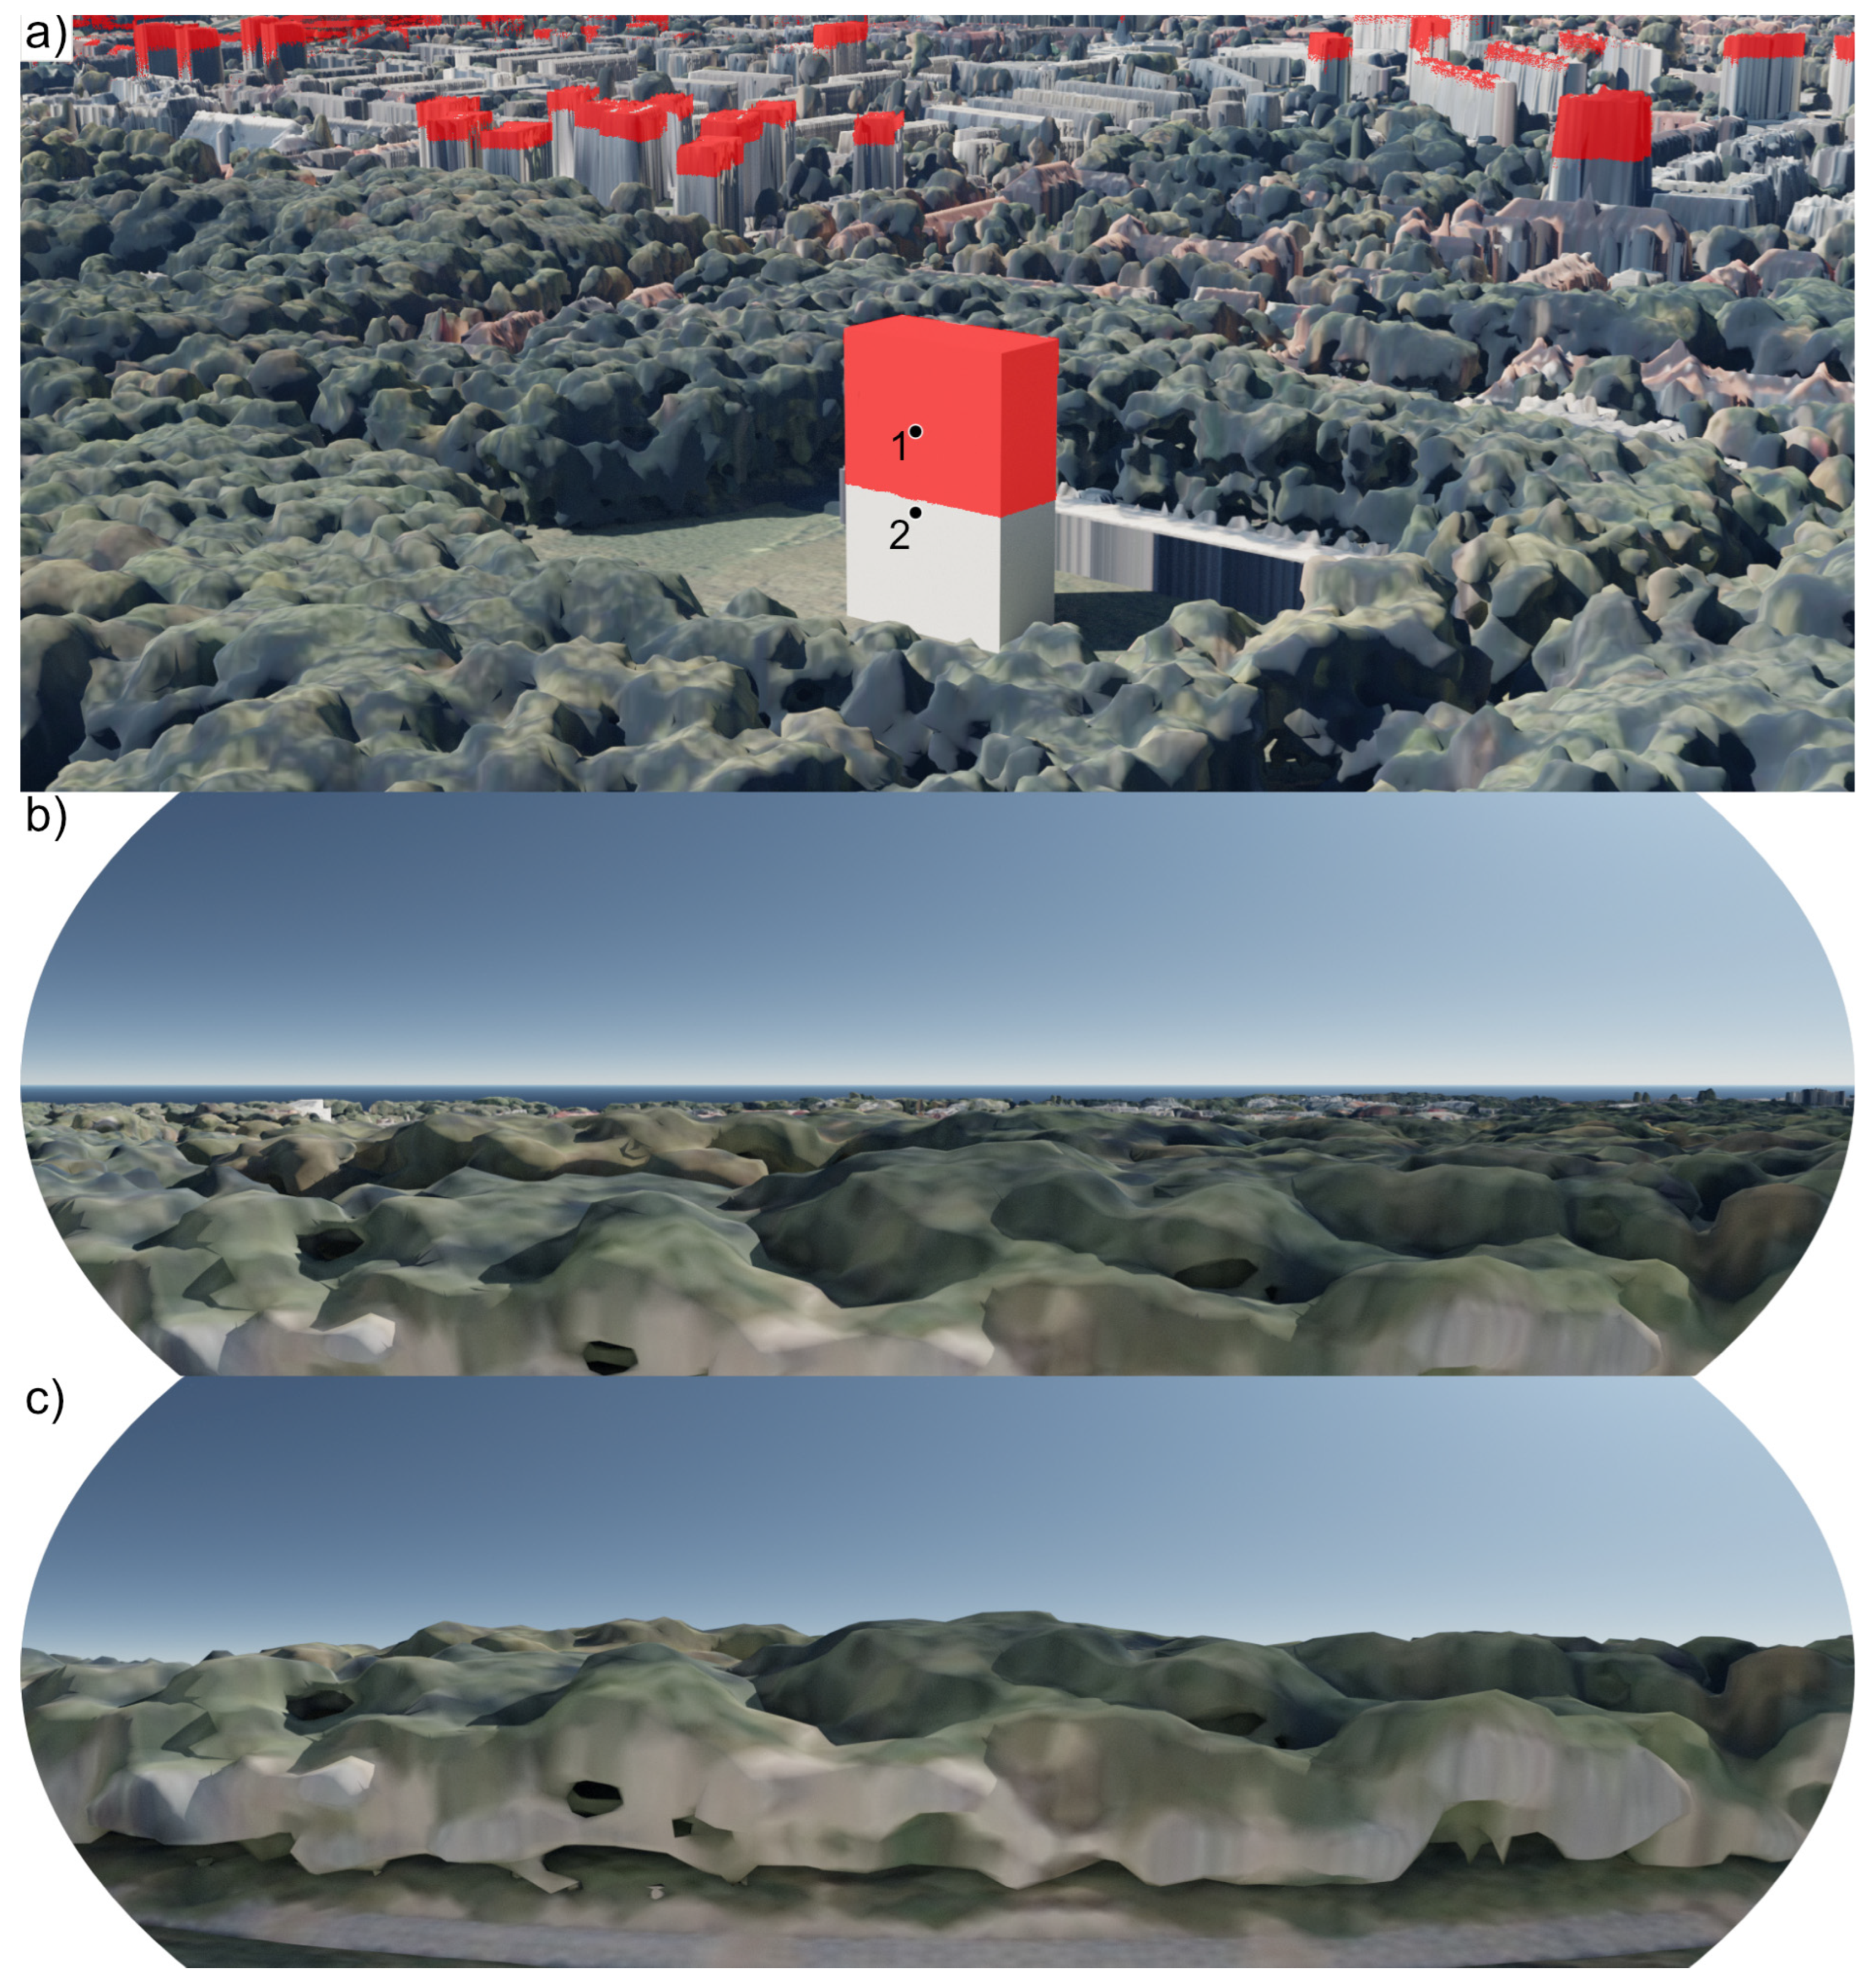
To account for the observer’s eye-level height, a two-step procedure was implemented. First, the visibility zone was computed using the base terrain model without considering observer height (
Figure 1–A). Next, the terrain model was duplicated and vertically offset by the average eye-level height (1.7 m) (
Figure 1–B). The area previously identified as visible was used as a mask to remove the corresponding geometry from the elevated model. The remaining surface was rendered using a semi-transparent material. This setup allowed the second rendering to detect rays striking both the upper and lower surfaces of the raised terrain. Combining both renders produced a final viewshed reflecting actual visibility from a standing observer’s perspective (
Figure 1–A+B).
In most cases, the mask can be generated through top-view rendering. However, for more complex 3D terrain forms—such as cliffs with overhangs—the mask should be created using texture baking, a rendering technique that can transfer lighting information from a 3D scene onto a 2D texture, allowing complex surface details to be captured independently of the camera angle.
This method enables precise modeling of visual exposure across diverse landscapes, including complex building geometries and vegetation cover. The viewshed is generated from an orthographic top-down render, resulting in a binary image delineating areas from which the water surface is visible. Due to the georeferencing of the 3D scene, the resulting visibility maps can be seamlessly integrated into GIS workflows for further spatial analysis. Additionally, the outcome can be analyzed directly in a full 3D environment, allowing the vertical nature of the viewshed to be examined, which is not possible with GIS. For comprehensive methodological details and validation, refer to [
23], “Reaching beyond GIS for comprehensive 3D visibility analysis”.
4. Discussion
The presented method enables accurate determination of the visibility of water surfaces in fully three-dimensional space. Unlike traditional GIS-based approaches based on 2.5D data models, this technique incorporates 3D vegetation and building geometries, allowing visibility to be assessed under tree canopies and within complex built environments. This substantially increases the realism and analytical precision of the viewshed. Moreover, the interactive 3D environment allows for rapid verification of results and the ability to explore views from specific locations or heights—such as the upper floors of buildings.
In the presented study, the water surface was modeled as a flat horizontal plane representing the average water level. This simplification does not account for the dynamic nature of coastal and riverine water bodies, such as tidal fluctuations, wave action, storm surges, or seasonal changes in river levels—all of which may influence the actual extent of visible water surfaces. While this limitation should be considered when interpreting the results, the flexibility of the proposed method allows for the analysis of different water levels by adjusting the geometry of the water surface accordingly. In more advanced scenarios, even temporally variable or three-dimensional water models (e.g., with wave geometry) could be incorporated to reflect more complex hydrological conditions.
With the growing interest in visibility analysis, the use of geoinformation tools has become increasingly important for objectively modeling visual perception [
4]. Traditional GIS-based viewshed tools allow users to model visibility from or toward specific points—such as public viewpoints, hiking trails, or proposed buildings [
11,
19]. Using digital elevation models (DEMs), land cover data, and vector layers of built features, it is possible to simulate current conditions as well as potential changes resulting from new development. These analyses are widely used in visual impact assessments (VIAs), where they inform planning decisions and often serve as a basis for dialog between planners, architects, developers, and the public.
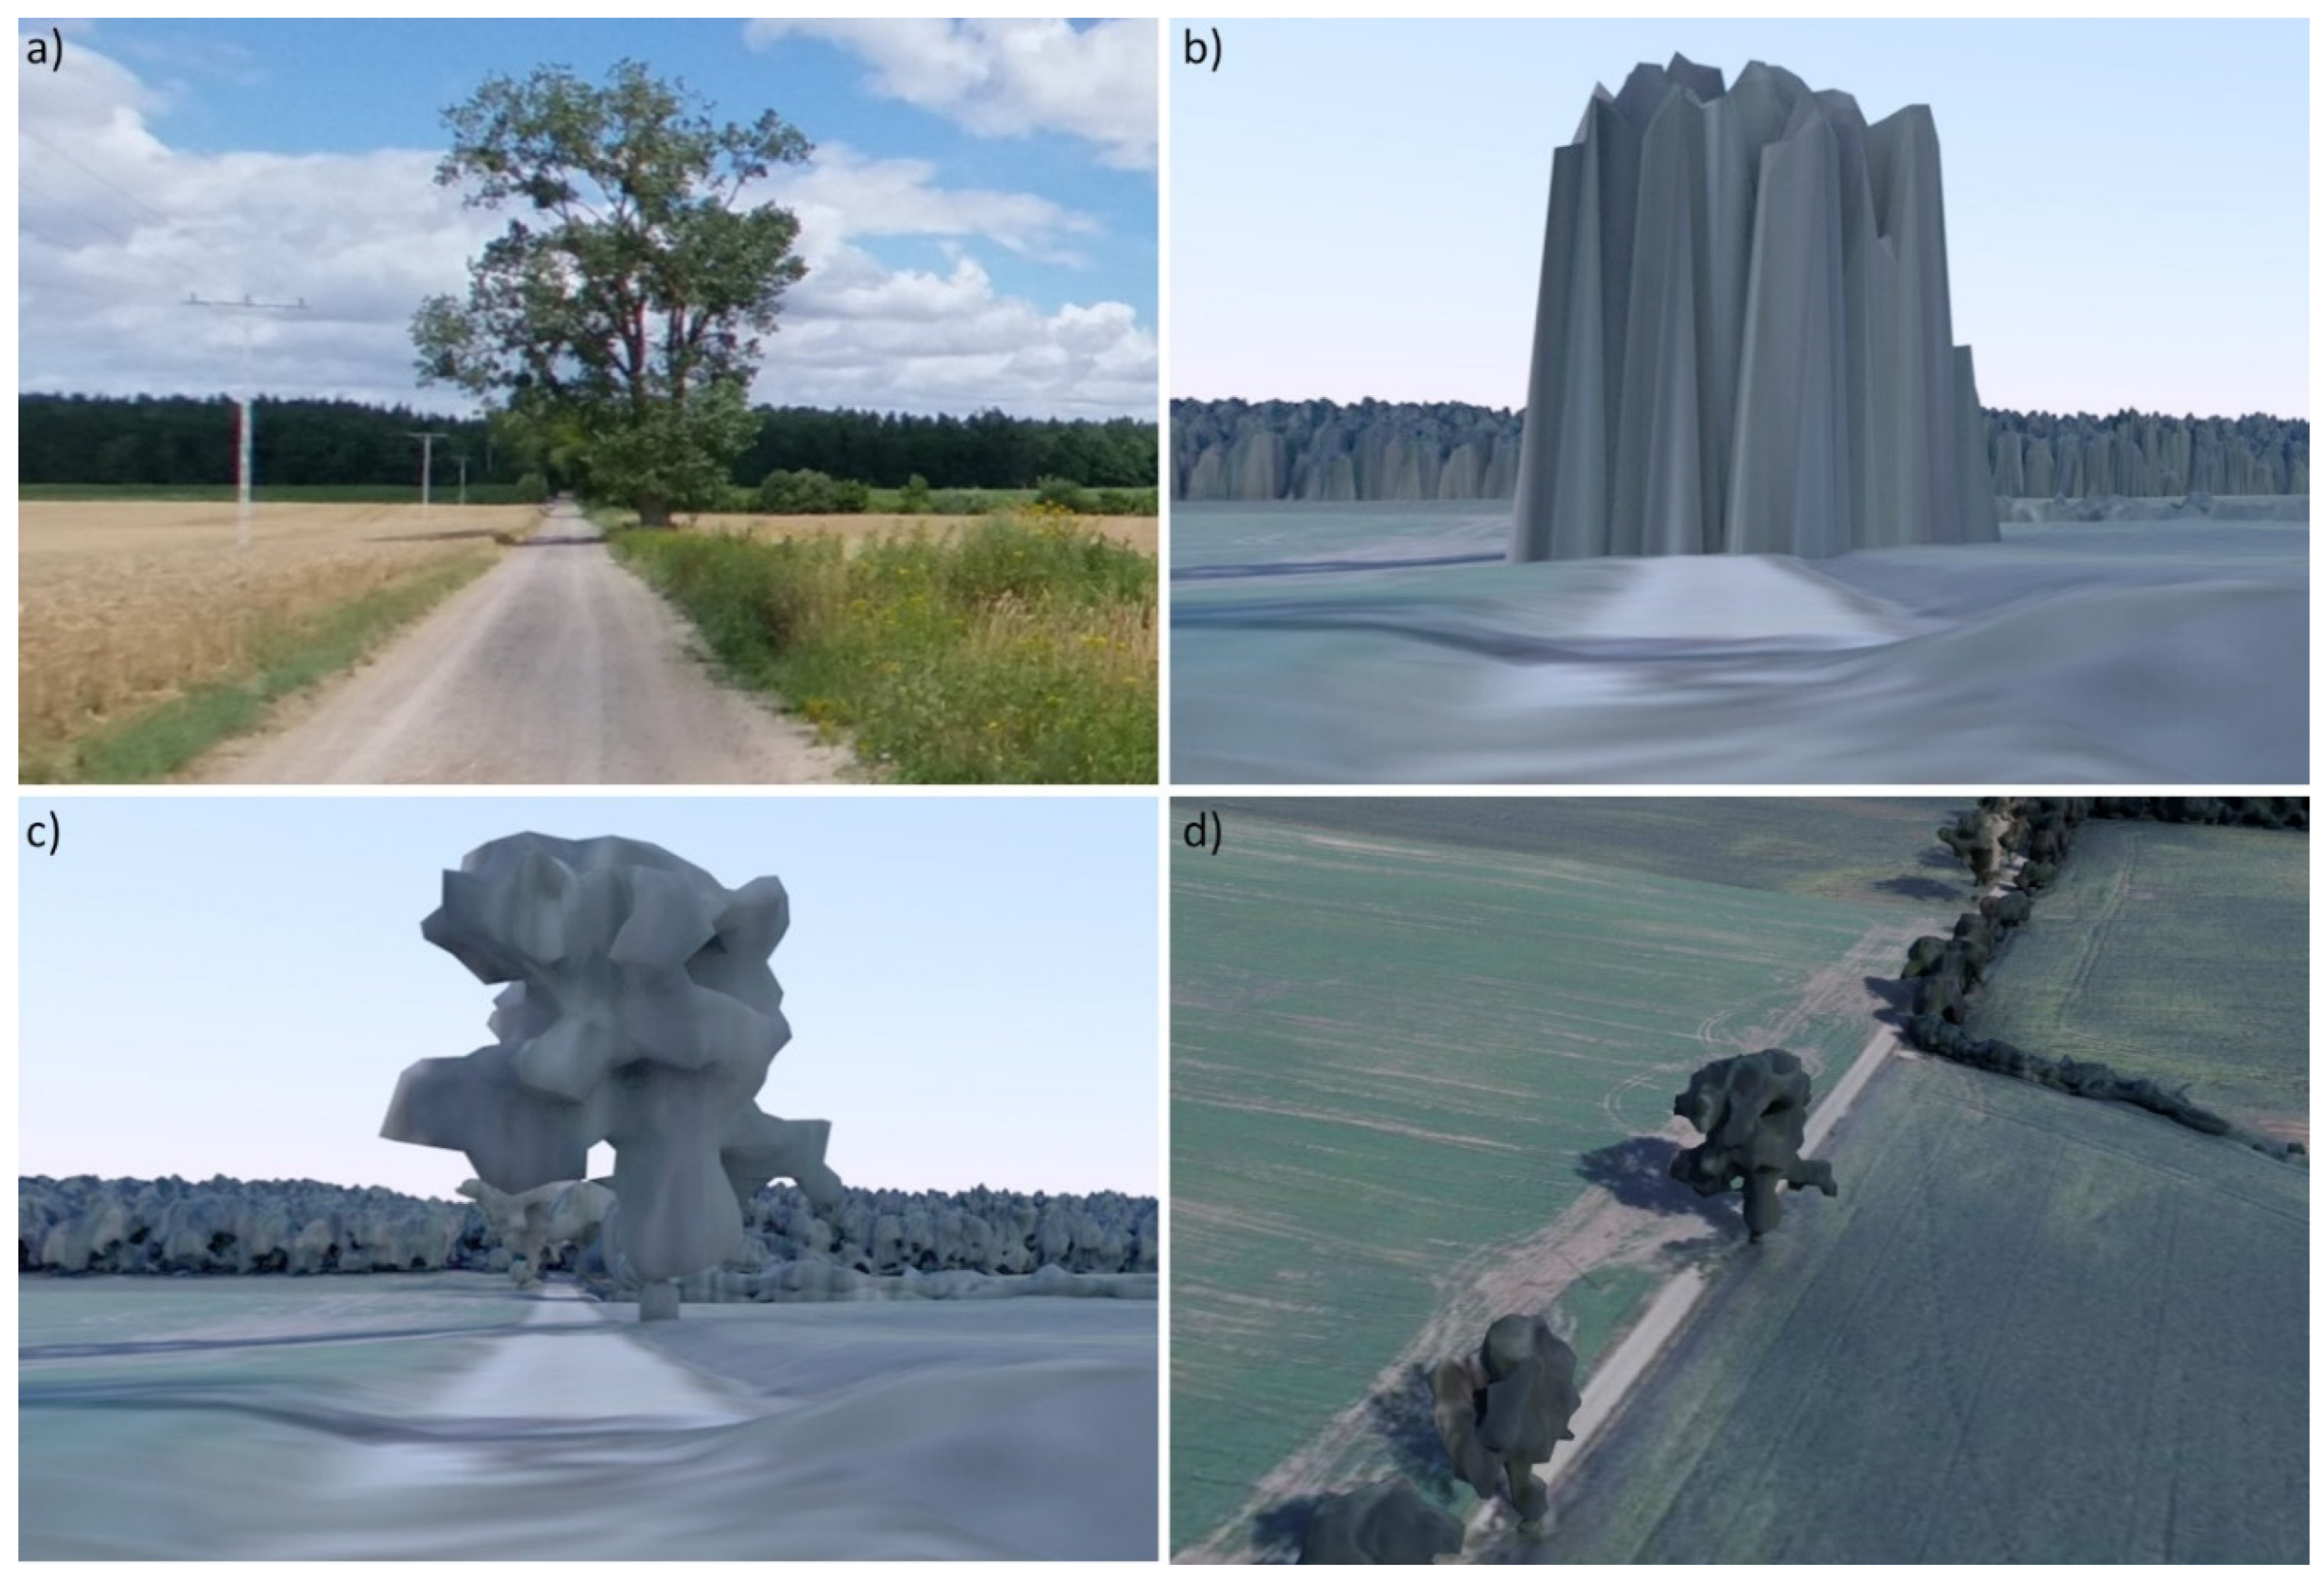
However, GIS-based methods have important limitations. Most notably, the 2.5D representation of space fails to account for complex visibility interactions under tree canopies or around elevated structures such as bridges, overpasses, or multilevel buildings. In vegetation modeling, trees are typically represented as opaque vertical blocks, completely obstructing views, regardless of their internal structure or height variability. These simplifications reduce the usefulness of viewshed results in environments where visibility is highly dependent on vertical relationships.
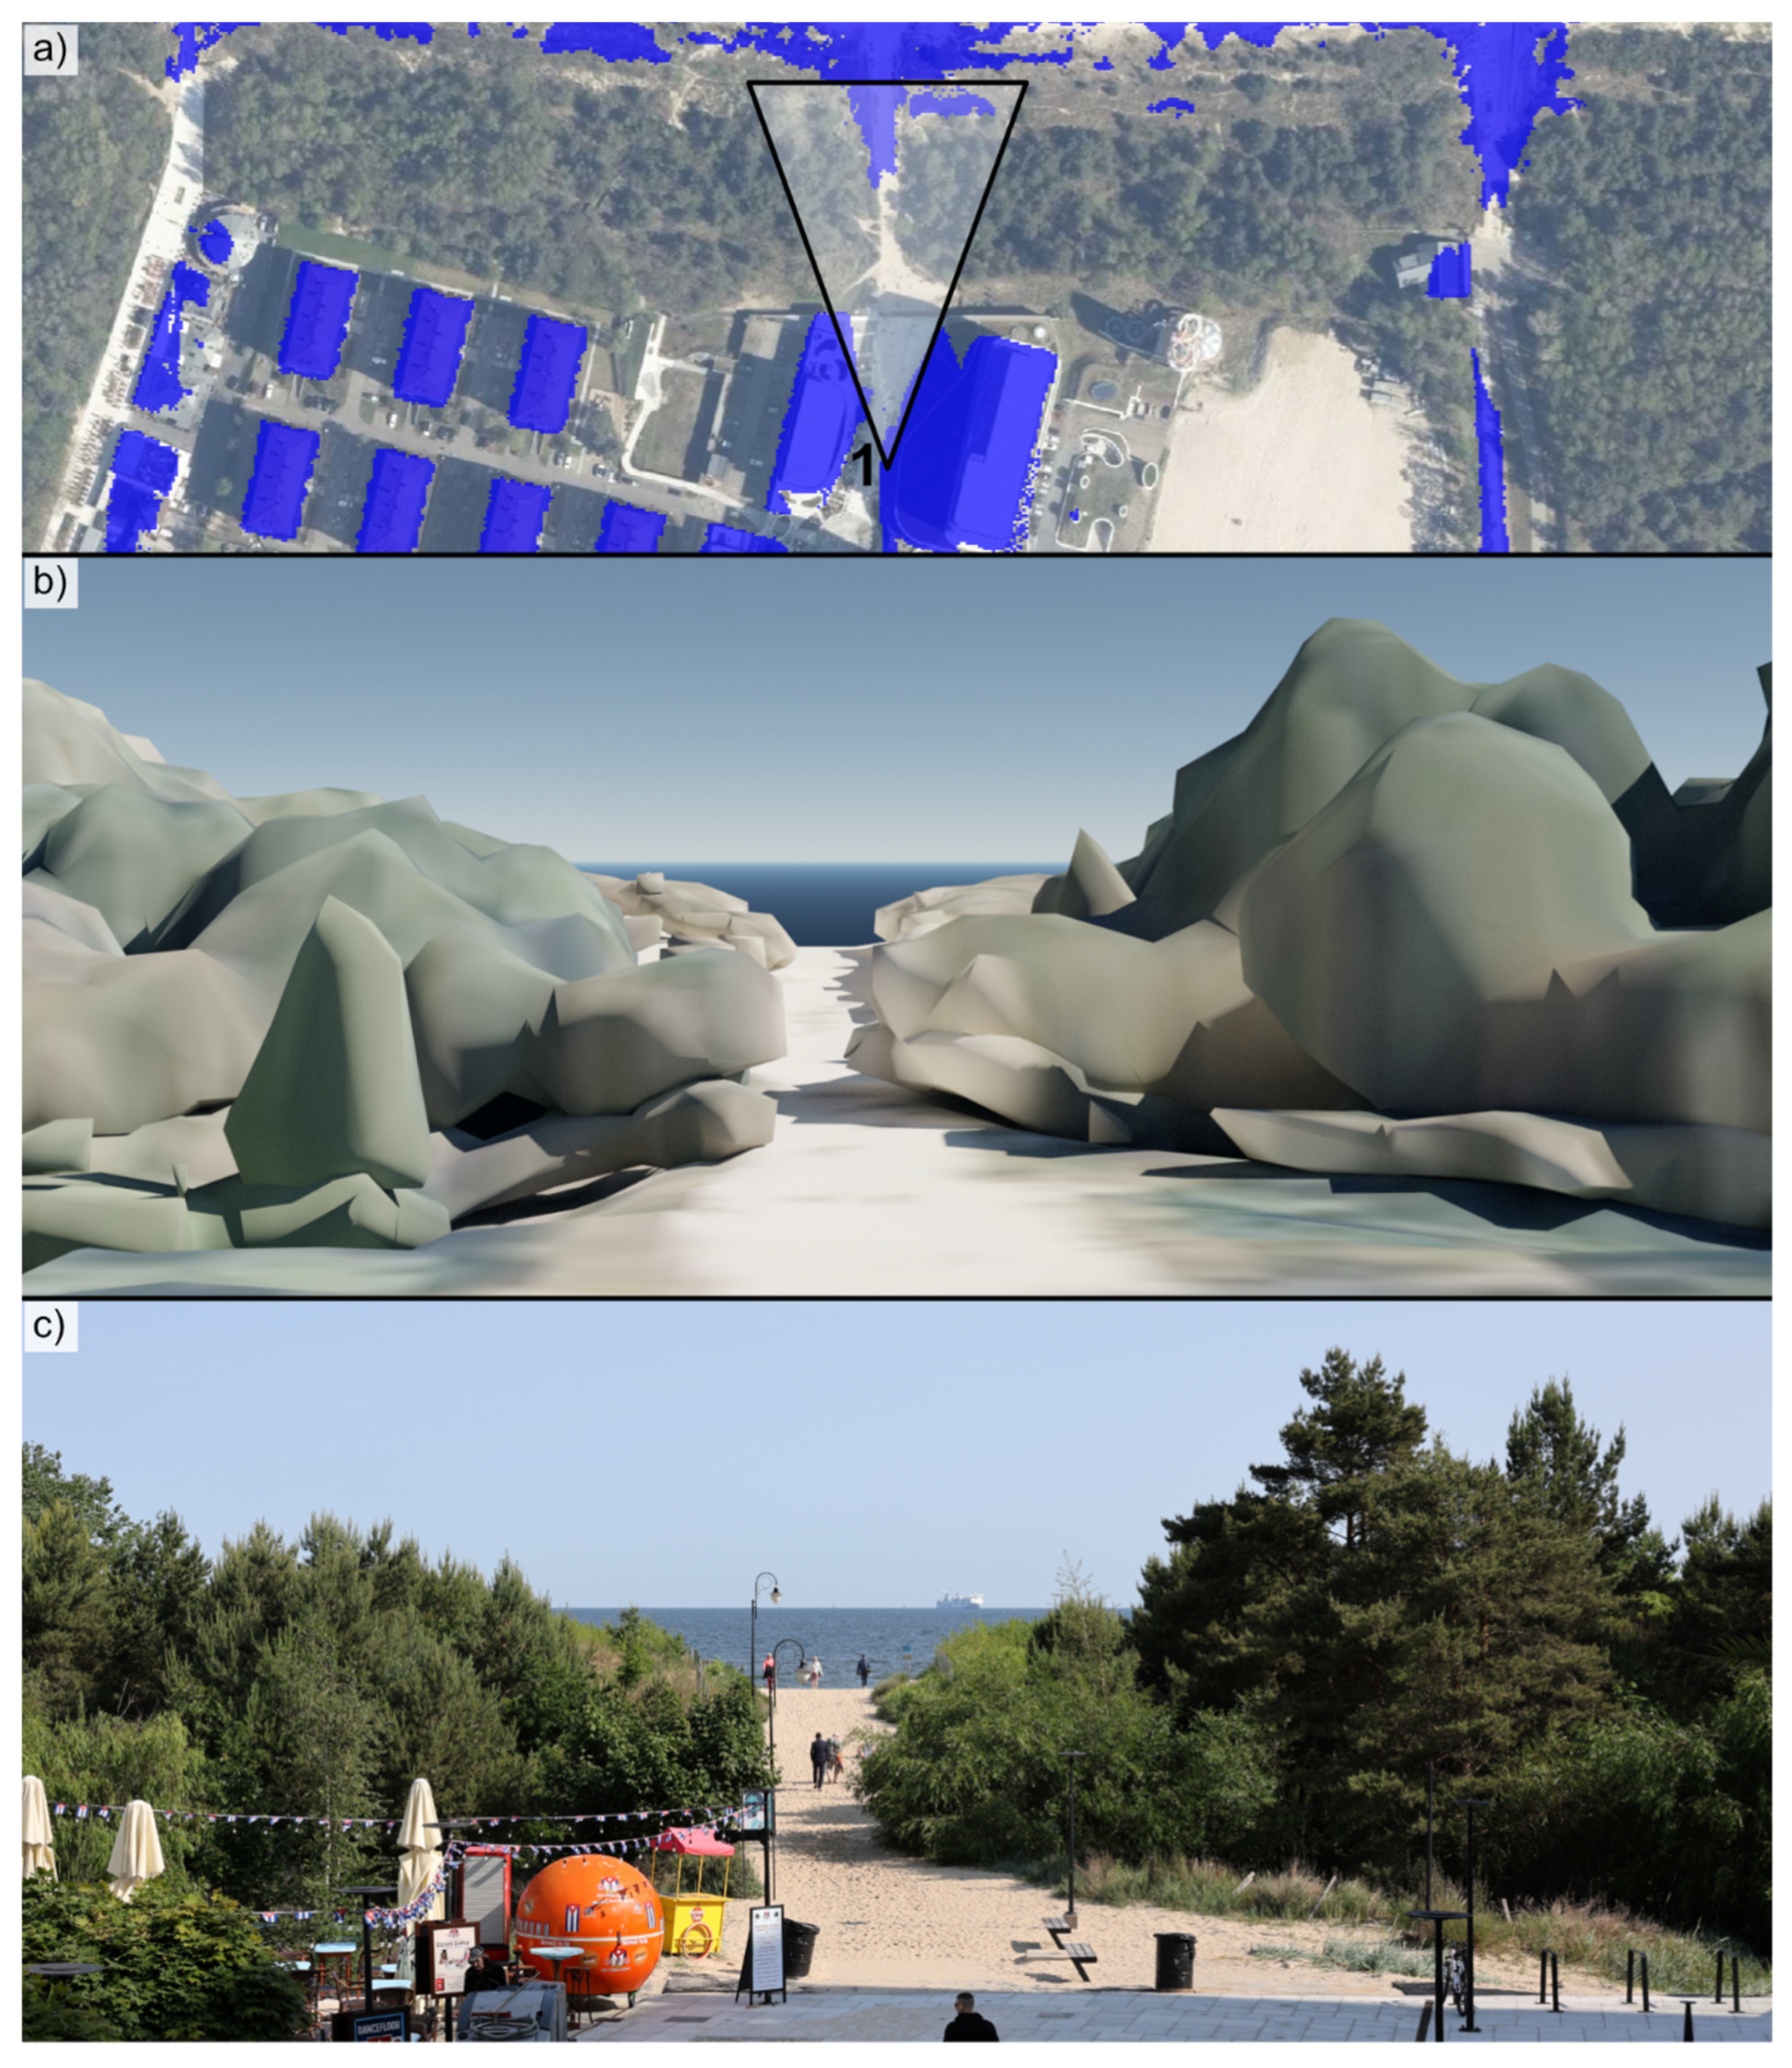
The presented methodology uses 3D models of vegetation, which allows for a more accurate determination of viewsheds. However, the vegetation 3D models are still fully opaque, so the method does not account for partial visibility through vegetation—for example, between branches during leafless seasons (
Figure 10).
A common workflow for assessing the visibility of the water surface is using 2.5D viewshed analysis. This method is efficient and easy to implement, relying on a single-surface digital elevation model (DEM or DSM) and a regular grid of target points placed on the water surface. It offers a practical solution for large-scale assessments using widely available GIS tools and data [
7,
8,
19,
29]. The approach presented in this study also supports large-area analysis but is based on full 3D geometry and physically based ray tracing. This allows for more precise modeling of visibility from a human perspective, including varying observer heights and occlusions by volumetric features such as vegetation or complex building structures. However, this higher level of detail comes at the cost of increased data requirements and modeling effort, as it relies on separate 3D representations of terrain, buildings, and vegetation, as well as custom rendering workflows outside traditional GIS environments. Both approaches are complementary; while the GIS-based method is well suited for rapid and large-scale assessments, the 3D ray-tracing workflow enables more detailed and perceptually realistic visibility modeling where precision is required.
The growing complexity of landscape management calls for visibility tools that integrate both objective spatial data and subjective user experience [
30]. Recent approaches have begun to combine GIS analysis with user-centered methods, such as surveys or preference mapping. A notable example is the study conducted in a protected dune forest, where visibility assessments were supplemented by perceptual evaluations of scenic beauty [
11]. Such hybrid methods enable a more comprehensive understanding of visibility as both a physical and experiential phenomenon [
8].
Importantly, the protection of sea views is not limited to tourist or densely urbanized zones. It also plays a critical role in protected landscapes, buffer zones of UNESCO World Heritage Sites, and areas with high cultural or symbolic value. In many countries, sea visibility is explicitly referenced in spatial development plans or environmental regulations [
17]. It can serve as a spatial parameter for assessing visual openness, cultural continuity, or landscape quality.
By offering a more precise and flexible tool for modeling water visibility, the method presented in this study contributes to this broader context. It enables planners and researchers to better evaluate how sea views are shaped and obstructed by landscape features, and to integrate these insights into policy-making, conservation strategies, and spatial design.
5. Conclusions
This study presents the application of a 3D ray-tracing method to the analysis of water surface visibility. While the technical foundations of the method have been previously published [
23], this research demonstrates its adaptation and effectiveness in modeling the visibility of water surfaces in complex urban and natural environments.
The method uses high-resolution LiDAR data and operates within a fully 3D environment, overcoming core limitations of traditional GIS-based viewshed analysis. It enables a realistic assessment of visibility by accounting for terrain, detailed building geometry, and volumetric vegetation structure. Unlike standard 2.5D approaches, it correctly identifies visibility beneath tree canopies and from within built-up areas, closely reflecting human perception.
Although the case study focuses on a flat, urban coastal area, the proposed method is adaptable to a wide range of geomorphological contexts, including cliffs, dunes, and heterogeneous terrains, due to its use of fully 3D geometry and ray-tracing-based visibility modeling. However, its application requires high-resolution LiDAR data, which may not be available in all regions.
Applied in a coastal urban setting, the method proved to be both accurate and flexible. Its integration with interactive 3D scenes supports advanced spatial analysis and offers practical value for urban planning, view protection, and coastal landscape management. The method could be further developed as a practical tool for spatial planners and landscape managers, especially in high-value coastal areas where sea view protection is a priority.
Future work will focus on quantifying the amount of visible water surface, allowing for more detailed and perceptually relevant analysis.

