Abstract
Governments often plan multiple fire stations simultaneously to improve firefighting capabilities, but constructing them within limited resources and time remains a challenge. A spatial decision support model is proposed in this study to determine the prioritized construction sequence of urban fire stations. Two simulation environments were established: one with only existing fire stations and another with both existing and proposed stations as fire service supply points (FSSPs). Response times were simulated using real-time traffic data. The construction urgency of the proposed fire stations was assessed using the construction sequence scoring equation. To validate the model, a case study of Shaoyang City, China, was conducted. A total of 30,968 fire service demand points were gathered, with 20 existing fire stations and 13 proposed fire stations designated as FSSPs. Twenty-five evaluation scenarios were established, resulting in 1,297,025 valid simulation results. The scoring results revealed a maximum score of 119,320, a minimum of 23,420, and an average of 61,412. Based on these results, recommendations for the construction sequence of proposed fire stations in Shaoyang City were made, and the improvements in fire protection levels were calculated. By prioritizing the construction of higher-performance fire stations, this model maximizes resource efficiency and enhances public safety.
1. Introduction
Fire safety is recognized as a fundamental safeguard for disaster prevention and mitigation within urban public safety systems, being critically linked to the preservation of residents’ lives, property security, and societal stability [1,2,3,4]. It has been demonstrated by previous studies that insufficient coverage of fire stations and prolonged fire service response times will directly lead to increased economic losses and heightened risks of casualties [5,6]. This challenge is currently being faced by numerous Chinese cities. To mitigate the negative impacts caused by inadequate service coverage and delayed responses, fire station construction plans have been formulated and implemented across multiple cities [7,8,9,10]. For instance, Guangzhou and Jiujiang in China have been mandated to complete 384 and 55 new fire station construction projects, respectively, by 2035 [11,12]. However, during implementation phases, it has been identified that the simultaneous construction of all facilities cannot be financially sustained by local governments. Moreover, errors in fire station deployment decisions may lead to slow improvements in fire safety levels, causing significant economic losses [13]. Therefore, the optimization of multi-station deployment strategies is recognized as an urgent requirement for strengthening urban fire resilience [14].
Various location optimization models have been proposed to site fire stations and deploy fire service resources in order to improve urban fire services [15,16,17]. A firefighting pressure-based layout optimization method was proposed to address the issue of overlooked response loads in traditional coverage models [18]. Considering real-time traffic conditions and the actual fire service demands of the city, a multi-objective spatial optimization model is proposed [19]. A bi-objective model is proposed to account for demand satisfaction differences based on fire risk levels, optimizing fire station locations to improve efficiency, coverage, and service satisfaction [20]. A fire station layout planning method based on a combination model approach is proposed and applied in practice, providing guidance for fire decision-making and fire resource allocation [21]. An integrated fire station location model based on fire risk assessment was proposed, which was used to evaluate the siting of fire stations [22]. The methods proposed in these studies have effectively enhanced urban fire service capabilities. However, the issue of deploying multiple fire stations simultaneously cannot be addressed by these methods.
The actual construction of fire stations is often constrained by various resources, particularly funding. In response to this problem, some scholars have adjusted resource allocation through scientific and rational methods, reducing construction costs. This has alleviated funding constraints and improved the efficiency and quality of fire services. A model for determining the optimal location of fire stations and fleet allocation is proposed, reducing unnecessary expenditure on fire resources and equipment [23]. A building cost optimization and retrofit investment evaluation method based on building energy performance is proposed for local fire stations [24]. The importance of collaboration and resource sharing between neighboring fire stations to further improve efficiency and cost-effectiveness is highlighted [25]. The proposal to use rainwater for firefighting equipment and to reduce the cost of water used for supplying and cleaning fire trucks is put forward [26]. A risk value calculation model for the operation and maintenance phase is established to scientifically quantify the potential losses from building fires [27]. These studies have improved the resource allocation and cost issues of fire stations from multiple perspectives, enhancing the utilization of fire station resources. However, the issue of how to construct multiple fire stations under limited funding has not been addressed.
Relevant standards in China stipulate that the estimated investment in fire vehicles and equipment within a fire station ranges from RMB 6.7 million to 43 million, with the specific amount depending on the level of the fire station. The construction planning of fire stations often involves the deployment of many stations at once, requiring substantial funding. As the necessary funds cannot be fully allocated by the government at once, the construction of fire stations cannot be carried out simultaneously. Previous studies on fire station construction primarily focused on site selection and resource allocation optimization. When resources and construction time are limited, there is no specific solution to the deployment problem of constructing multiple fire stations. Under the constraint of limited funding, in order to maximize efficiency and improve urban fire service levels, a model for determining the prioritized construction sequence of urban fire stations is proposed.
The model is based on real-time traffic condition simulations provided by online maps to calculate the response times of fire service demand points (FSDPs), and a construction sequence scoring equation is established to determine the optimal construction sequence based on the scores. Using Shaoyang City, China, as a case study, fire stations are treated as fire service supply points (FSSPs), and several points of interest are collected as FSDPs. The fire service response times are simulated, followed by the application of a scoring model, through which the optimal construction sequence for Shaoyang City’s fire stations is systematically determined.
2. Determination Methods
2.1. Coverage Evaluation Indicators
The first 3–5 min after a fire occurs are considered the golden service time, and after 10 min, the full combustion stage is reached, significantly increasing the difficulty of extinguishing the fire. Whether the fire can be serviced in time directly affects the severity of the consequences [28]. The current fire safety standards in China require the urban fire service response time to be within 5 min, which includes 1 min for preparation and 4 min for travel time [29,30]. The U.S. Fire Association specifies that the response time for urban fire departments should be kept within 4 min, with a maximum of 8 min allowed for remote areas [31]. In Germany, major cities such as Berlin require a response time within 5 min, while in remote areas, the response time is extended to 10–15 min [32].
Rapid response is crucial once a fire occurs, but response time cannot be guaranteed due to the influence of travel distance and traffic conditions [33,34]. The longer the response time, the greater the risk of significant property damage and casualties. In light of this, three fire service response time levels (5 min, 15 min, and 25 min, including 1 min for action preparation) are proposed in this study. Based on vehicle travel times, different fire service accessibility intervals (0–240 s, 240–840 s, 840–1440 s, and >1440 s) are defined, which in turn provide a scoring criterion for determining the prioritized construction sequence of fire stations.
2.2. Data Collection
This model involves representing fire stations as FSSPs, with the inclusion of POI data and key fire safety units to represent FSDPs [35,36]. Relevant data within the study area is obtained using open big data, and the filtered POI data is required to cover building types such as residential areas, hotels, hospitals, government agencies, schools, shopping malls, and villages. At the same time, publicly available government data on key fire safety units is also included, thereby enhancing the FSDP dataset.
For simulation calculations, an online map capable of updating road conditions in real-time and supporting Application Programming Interface (API) calls is used [37]. This helps simulate real-time travel times and distances to FSDPs. In this study, the online map Web API service is utilized to obtain the real-time travel data by combining the longitude and latitude of each fire station and the corresponding FSDP. The travel time from each fire station to each demand point is simulated using batch route calculation services, with periodic updates to account for traffic changes throughout a full cycle. Online maps, including Google Maps, Baidu Maps, and Amap, all provide this type of service and are applicable to this model. For this study, Baidu Maps has been selected.
2.3. Spatial Decision Support Model
Previous studies focused on fire site selection and resource allocation, while the model in this study is applied after confirming fire station locations. Figure 1 illustrates the sequence of site selection and construction, along with the determining factors. During the planning stage, the number and location of fire stations are determined based on factors such as population, fire risk, and financial resources. The construction sequence for the selected sites is then prioritized. By constructing fire stations in this prioritized order, those that significantly enhance fire rescue capabilities are built first, while also reducing the financial burden on funders by spreading out the costs.
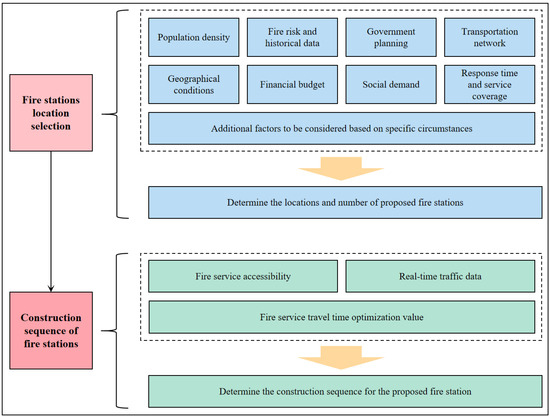
Figure 1.
The relationship between fire station site selection and construction sequencing.
The problem of determining the construction sequence of multiple fire stations is addressed in this study by proposing a spatial decision support model based on service capacity. The model flowchart is shown in Figure 2.
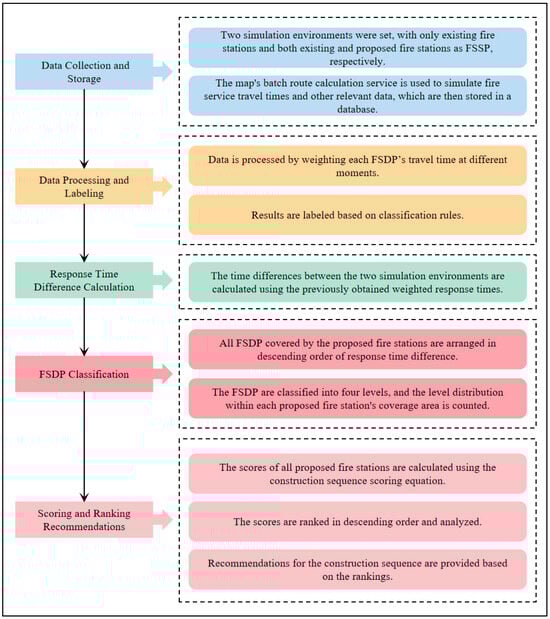
Figure 2.
Spatial decision support model flowchart.
It is assumed that there are d FSDPs, p existing fire stations, and q proposed fire stations in a certain area, with k consecutive evaluation scenarios set for a period. In the defined evaluation scenarios, the existing fire stations and the combination of existing and proposed fire stations are used as FSSPs, and travel time simulations are conducted for all FSDPs.
When existing fire stations serve as FSSPs, the time Tj for the j-th evaluation scenario is defined, and the travel time Ti,tj from the i-th FSDP to the nearest FSSP is calculated. For each FSDP, its weighted travel time (ETi) is calculated as Equation (1).
When both existing and proposed fire stations are used as FSSPs, the time Tm for the m-th evaluation scenario is defined, and the travel time Ti,tm from the i-th FSDP to the FSSP with the shortest arrival time is computed. Similarly, for each FSDP, its weighted travel time (EPTi) is calculated as Equation (2).
The algorithmic implementation of Equations (1) and (2) are the same, where the pseudo-code for the implementation of Equation (1) is shown in Figure 3.
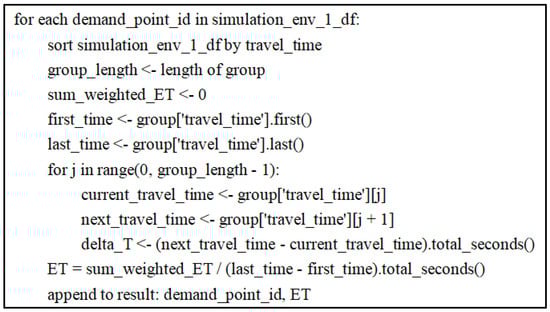
Figure 3.
Algorithm pseudo-code implementation.
Based on the weighted travel time results from the two simulation calculations and with reference to relevant standards [29,30,31], FSDPs are classified into four grades: “Excellent”, “Good”, “Medium”, and “Poor”, as shown in Table 1. The “Excellent” grade indicates that the FSDP can be promptly serviced within the specified 5 min response time, and is considered effectively covered. The “Good” grade indicates that the FSDP can receive relatively effective fire service within a 5–10 min response time, and is considered coverable. The “Medium” grade indicates that the FSDP can only receive limited fire service within a 10–15 min response time, and is considered inadequately covered. The “Poor” grade indicates that the FSDP will receive almost no service or none at all after 15 min, and is considered completely uncovered.

Table 1.
FSDP rescue classification.
To better visualize the improvement in service capabilities of the proposed fire stations, the service travel time optimization values for the FSDP covered by the proposed stations will be calculated separately. The optimization value of the service travel time for the i-th FSDP, denoted as ΔTi, can be determined by using Equation (3).
The FSDPs served by the proposed fire stations are ranked in descending order of ΔTi. A higher rank indicates that the corresponding proposed fire station significantly reduces the fire service response time in that area. This indirectly suggests that the proposed fire station makes a significant contribution to the improvement of fire service capabilities. Based on this, a construction sequence evaluation equation is proposed.
The FSDPs are categorized into four levels based on their rankings: 0–25%, 25–50%, 50–75%, and 75–100%. For the i-th proposed fire station, the quantities of demand points falling within these respective ranges are denoted as ai, bi, ci and di, corresponding to the 0–25%, 25–50%, 50–75%, and 75–100%. To capture the distinct advantages of the four levels, relative weights were assigned in the evaluation equation. FSDPs with significant improvements in fire rescue times after the construction of new fire stations should be given higher weights, reflecting their greater need for prioritized construction. Conversely, FSDPs with smaller improvements should receive lower weights, indicating a reduced need for priority construction. This study employs a 100-point scale, with weights assigned as follows: 100 for 0–25%, 80 for 25–50%, 60 for 50–75%, and 40 for 75–100%. While the weight values can be adjusted in practical applications, it is essential to maintain a clear hierarchical structure, ensuring that regions with greater construction needs are prioritized accordingly.
The Sequential Confirmation Scoring (SCS) for the i-th fire station is calculated as Equation (4).
The q proposed fire stations are ranked based on their SCS. It is determined that the higher the SCS, the greater the improvement in service capacity that the proposed fire station can achieve, and the higher the urgency for its construction. Therefore, it is recommended that fire stations with higher SCS be prioritized for construction.
2.4. Additional Analysis
The construction sequence of the proposed fire stations can be determined through travel time analysis. Furthermore, this sequence may also be examined in simulation studies incorporating variations in travel distance and speed parameters. Such multidimensional analysis enables comprehensive evaluation of fire service capacities, particularly regarding infrastructure capabilities prior to and following station deployment.
In simulations with existing fire stations as FSSPs, the time for the j-th evaluation scenario is denoted as Tj. The travel distance and speed between the i-th FSDP and the closest FSSP are represented by Di,tj and Vi,tj, respectively. For each FSDP, its weighted travel distance (EDi) and weighted travel speed (EVi) are calculated as Equations (5) and (6).
The overall average time AET, average distance AED, and average speed AEV for all FSDPs are calculated as Equations (7)–(9). By obtaining the overall average data of all FSDPs, a more accurate reflection of the city’s fire service level during the entire evaluation period is achieved.
When both existing and proposed fire stations are used as FSSPs, the time for the m-th evaluation scenario is denoted as Tm. The travel distance Di,tm and travel speed Vi,tm from the i-th FSDP to the closest FSSP being computed. Similarly, for each FSDP, its weighted travel distance (EPDi) and weighted travel speed (EPVi) are calculated as Equations (10) and (11).
In the same way, the overall average time AEPT, average distance AEPD, and average speed AEPV for the FSDPs in the simulation environments are calculated as Equations (12)–(14).
3. Case Study
3.1. Study Area Overview
Shaoyang City, China, is located in the southwestern part of Hunan Province, between latitudes 25°58′ and 27°40′ N and longitudes 109°49′ and 112°57′ E, covering an area of 20,824 km2. The city consists of three urban districts, seven counties, including one autonomous county and two county-level cities. The terrain is diverse, predominantly consisting of hills and mountains, which make up about two-thirds of the total area. By the end of 2024, the total population was 8.10 million, with 6.36 million residing in urban areas. In 2024, a total of 3444 fires were reported in the city, accounting for 10.2% of the total fires in Hunan Province, ranking second in fire incidents among provincial cities. As a result, fire safety management in Shaoyang City is given significant attention. Through on-site investigations, the precise locations of 20 existing fire stations and 13 proposed fire stations have been provided by the Shaoyang City Fire Department (Figure 4).
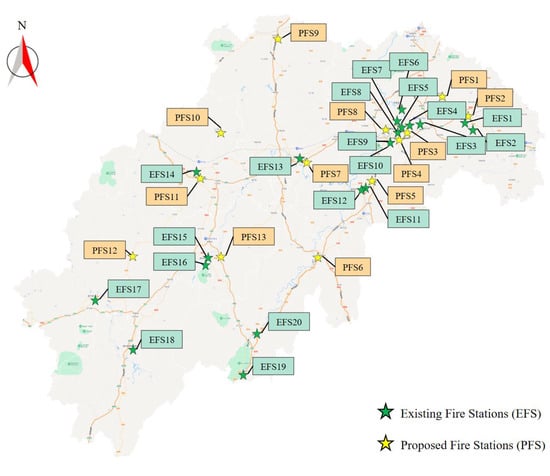
Figure 4.
Arming map of existing and proposed fire stations.
3.2. Fire Stations and FSDP Data
Shaoyang City currently has 20 existing fire stations, with plans to complete the construction of 13 proposed fire stations in the coming years. These 33 fire stations are used as FSSPs in this study. The precise locations of the fire stations were obtained through on-site investigations and online maps, and their structured addresses were recorded. Subsequently, the structured addresses were converted into latitude and longitude information using the online map geocoding service, which was then used for the calculation of fire driving times.
FSDPs are characterized based on POI data and key fire safety units. In this study, 30,968 FSDPs were selected in Shaoyang City using the POI search API provided by the online map and the publicly available list of key fire safety units in the city. The types of buildings at these FSDPs include residential communities, hotels, hospitals, government buildings, schools, shopping malls, villages, and others. The higher the density of FSDPs, the greater the fire risk. The FSDPs were visualized using a transformation-based Sigmoid risk model, and the distribution map was generated [38]. Different colors are used to represent varying levels of fire risk. Red, green, and blue represent high, medium, and low risks, respectively (Figure 5).
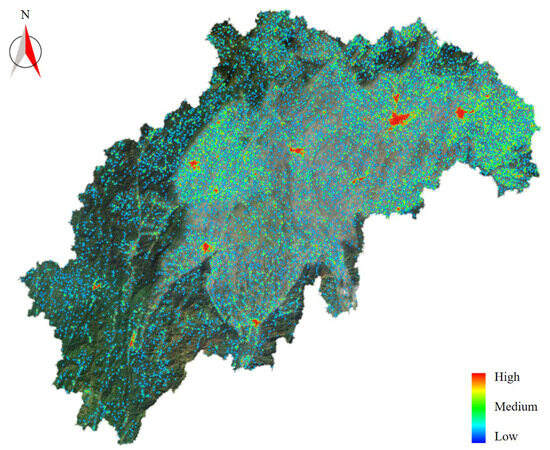
Figure 5.
FSDP distribution map.
3.3. Evaluation Scenarios
To accurately evaluate the priority of the proposed fire stations in Shaoyang City, the evaluation period was set from 12:00 on 19 September 2024, to 12:00 on 20 September 2024. An evaluation scenario was set every hour during the assessment period, covering different traffic conditions (e.g., congestion, smooth, and free-flowing). Two simulation environments were set up: one with only existing fire stations as FSSPs and the other with both existing and proposed fire stations as FSSPs. A total of 25 evaluation scenarios were established, each containing 51,881 simulation results, amounting to 1,297,025 results in total. The simulation data was obtained in real-time by programming the Baidu Map Web Service API, ensuring data timeliness and accuracy.
The obtained simulation data was then processed through programming to calculate the weighted travel time for each FSDP. Finally, the results are obtained using the construction sequence scoring equation.
4. Results
4.1. Sequence Confirmation Results
The coverage of FSDPs under varying optimization levels are presented in Table 2 for the 13 proposed fire stations. Analysis of the table data reveals differentiated service capacities among stations. PFS9 demonstrates exceptional coverage capability at the 0–25% level, encompassing 1004 FSDPs—a magnitude significantly exceeding other stations (705 for PFS6 and 477 for PFS10). This disparity suggests pre-existing service inadequacies in PFS9’s target region that would be substantially mitigated through proposed fire stations. At medium levels (25–75%), spatial equilibrium emerges as a key feature. PFS2 and PFS1 exhibit balanced coverage patterns with 482 and 441 demand points, respectively, indicative of optimized station placement strategies. Such spatial distributions enable effective coverage of intermediate-distance emergencies, demonstrating dual operational benefits: reduction potential in disaster-induced losses and projected improvement in emergency response efficiency post-optimization.
Table 2.
Number of FSDPs for each level by the proposed fire station.
Notwithstanding the notable efficacy in 0–25% level coverage, critical service gaps persist at medium-to-high level (50–100%). As evidenced by the data, selected stations are observed to have reduced coverage capacities for demand points beyond proximal ranges. PFS11 exemplifies this spatial limitation, registering only 132 covered FSDPs at the 50–75% level. This operational deficiency highlights the necessity for enhanced radial coverage strategies targeting mid-to-long distance emergencies.
Significant variations in coverage capabilities are observed among fire stations, particularly across multi-tiered fire service demand levels. Three primary factors are identified as contributing to these disparities: First, the operational efficacy of stations is constrained by their geographical positioning and pre-existing service capacities. For instance, the region serviced by PFS9 initially demonstrated relatively weak firefighting capabilities, with coverage rates substantially enhanced through the new station’s deployment. Second, diminished coverage efficiency for distant demand points is attributed to extended response radii and elevated resource demands in peripheral zones. Third, spatial planning imbalances are found to create under-served areas within the service network. To enhance systemic performance, future station construction requires optimization of spatial allocation patterns to ensure equitable resource distribution and improved operational efficiency.
The SCS for the 13 proposed fire stations are presented in Figure 6. Analysis reveals PFS9 with SCS of 119,320 is ranked first. This prioritization is justified by the station’s dominant coverage of 0–25% level FSDPs, directly addressing pre-existing service deficiencies in its operational radius. Consequently, PFS9 is prioritized as the first fire station to be constructed due to its potential to rapidly enhance service. PFS10 with SCS of 102,840 occupies the secondary position, exhibiting multi-tier coverage proficiency that parallels PFS9. The station’s particularly strong 0–25% level service capacity substantiates its equivalent strategic importance in regional service optimization.
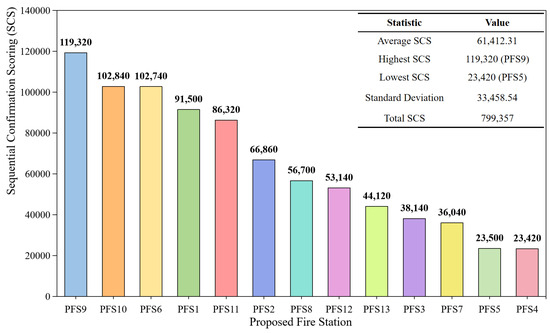
Figure 6.
SCS for proposed fire stations.
The intermediate-priority fire stations comprise PFS1 with SCS of 91,500 and PFS11 with SCS of 86,320. PFS1 demonstrates robust coverage of 50–75% level FSDPs, securing its operational value despite score deficit compared to top-level stations. This mid-range coverage capacity proves critical for bridging service gaps in median-distance zones. Although PFS11 aggregate score reflects a 24.5% reduction relative to PFS1, the station remains essential for enhancing intermediate-distance emergency response capabilities.
The lowest-priority level includes PFS5 with SCS of 23,420 and PFS4 with SCS of 23,400, both demonstrating constrained operational impact. These stations predominantly service low-demand sectors, contributing minimally to overall service capacity enhancement. While providing baseline coverage in localized areas, their construction urgency is deprioritized due to marginal systemic benefits.
By prioritizing the construction of fire stations with higher scores, the overall service level can be more effectively enhanced, ensuring timely response in critical areas and better addressing service gaps in other regions, thereby minimizing disaster losses.
4.2. Additional Analysis Results
Based on travel time from fire stations to FSDPs, the FSDPs are categorized into four grades: Excellent, Good, Medium, and Poor. These grades are represented by green, yellow, orange, and red, respectively. Figure 7 presents comparative coverage analyses from the September 20th 10:00 simulation, contrasting two operational scenarios: (a) using existing fire stations as FSSPs and (b) using both existing and proposed fire stations as FSSP.
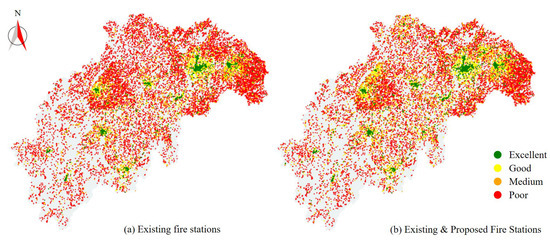
Figure 7.
Visualization of FSDP evaluation level.
By comparing (a) and (b), significant expansion is observed in the Excellent and Good coverage levels following the deployment of the 13 proposed fire stations. The visualization demonstrates concentrated improvements within Shaoyang’s central urban core and adjacent zones, where service demand points previously classified as Medium or Poor show measurable elevation in coverage levels. Concurrently, a marked elevation in coverage levels is recorded in the northern peripheral regions, with numerous FSDPs transitioning from Poor to Medium/Good levels through the strategic supplementation of proposed stations. These changes collectively confirm enhanced fire service capabilities in both urban and remote areas through optimized fire station allocation. Despite these improvements, it remains evident that fire coverage in Shaoyang City is still inadequate. Future fire-related policy planning for the city should continue to prioritize fire station deployment.
AT, AD, and AV under two simulation environments calculation results are presented in Table 3. One with existing fire stations as FSSPs and the other with both existing and proposed fire stations as FSSPs. It can be observed that the construction of the proposed fire stations has led to a significant improvement in overall service efficiency.
Table 3.
AT, AD, and AV from simulation results.
Specifically, AT was reduced by 361.08 s, a decrease of 18.43%. This indicates that the new fire stations significantly shortened the travel time from fire stations to FSDP. This reduction is particularly beneficial for remote areas, where fire trucks can reach the site more quickly, improving emergency response efficiency. AD was reduced by 4248.52 m, accounting for 20.09% of the original value. This reflects that the new fire stations have concentrated the coverage of the service network. FSDPs previously covered at longer distances are now more effectively served by the newly added stations, optimizing resource allocation and enhancing overall service efficiency. In high-demand areas, the new fire stations can better concentrate resources, reducing unnecessary long-distance travel. AV increased by 0.22 m/s, a 2.03% increase from the original value. This means that the optimization of the fire station layout not only improved the average travel speed of fire trucks but also reduced the impact of factors such as traffic congestion, further boosting overall service efficiency.
On the whole, the construction of proposed fire stations has optimized the existing resource allocation. This has significantly improved travel time and coverage distance, particularly in terms of emergency response capabilities and service efficiency. This optimization has laid a solid foundation for enhancing the overall fire service level in the city. It is especially beneficial in high-risk areas, where it can effectively reduce service delays and improve disaster response capabilities.
Figure 8 shows the average fire service response time differences before and after the construction of the proposed fire stations. The values are calculated for the FSDPs covered by the 13 proposed stations. The figure indicates that the average fire service response time for all stations decreased after the addition of the new fire stations. This demonstrates that the construction of the stations has a significant impact on improving service efficiency. The fire service response time for PFS9 decreased by 2982.5 s, highlighting its prominent role in improving service efficiency, particularly in optimizing emergency response times. The optimization effects for PFS6 and PFS12 are also notable, with reductions of 1878.41 s and 1657.03 s, respectively. These improvements are significant, effectively reducing fire service response times for more distant FSDPs and substantially increasing overall service speed.
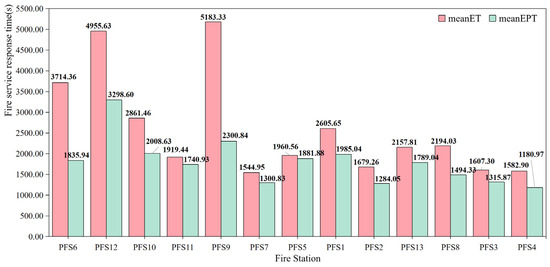
Figure 8.
Average fire service response time difference for covered points.
However, the optimization effects of certain fire stations are relatively limited, particularly for PFS4, PFS5, PFS8, and PFS3. The average fire service response time differences for these stations are small, with values of 401.93 s, 244.12 s, 368.77 s, and 291.44 s, respectively. This suggests that while the construction of these stations has contributed to some improvement in service efficiency, the effect is less significant compared to other stations. Further optimization of their layout or resource allocation may be necessary to enhance efficiency.
Overall, prioritizing the construction of fire stations with significant optimization effects, such as PFS9, PFS6, and PFS12, will greatly enhance overall service efficiency, particularly in terms of rapid response and broad coverage. For stations with smaller effects, their construction still provides some improvement, but their priority may be relatively lower. In the future, the construction sequence can be adjusted to achieve more efficient resource distribution and more noticeable reductions in fire service response time.
5. Conclusions
A spatial decision support model for determining the prioritized construction sequence of urban fire stations is proposed in this study. Two simulation environments were established: one with only existing fire stations and another with both existing and proposed fire stations as FSSPs. Response times were simulated using real-time traffic data. The construction urgency of the proposed fire stations was assessed using the construction sequence scoring equation. This equation considers the number of FSDPs in different ranking levels based on response time differences. To validate the model, Shaoyang City, China, was used as a case study. A total of 30,968 FSDPs were collected, with 20 existing fire stations and 13 proposed fire stations designated as FSSPs. Twenty-five evaluation scenarios were set, yielding 1,297,025 simulation results.
The results indicate that the prioritized construction sequence for the 13 proposed fire stations in Shaoyang City is as follows: PFS9, PFS10, PFS6, PFS1, PFS11, PFS2, PFS8, PFS12, PFS13, PFS3, PFS7, PFS5, and PFS4. The SCS values range from 23,420 (minimum) to 119,320 (maximum), with a mean value of 61,412.31. Fire stations ranked higher in the scoring system demonstrate more significant optimization effects, particularly in enhancing emergency response capabilities and covering high-demand areas. The construction of PFS9 has reduced the average service time for its covered FSDPs by 2882.5 s, significantly enhancing service capacity in surrounding areas. Therefore, it is recommended that PFS9 be prioritized for construction to maximize overall service efficiency. For fire stations like PFS4 and PFS5, which have a limited impact on the overall improvement of rescue capabilities, it is advised to construct them last.
Prioritizing the construction of fire stations that most effectively enhance urban fire service capabilities can maximize resource utilization efficiency, thereby improving public safety. The model developed in this study can also provide recommendations for determining the optimal construction sequence of proposed fire stations in other cities, offering valuable support for fire station planning and construction. Future iterations of the model can incorporate detailed population distribution and resource constraints, thereby enhancing the scientific rigor of the rankings.
Author Contributions
Conceptualization, Dingli Liu and Yuan Zeng; methodology, Yuan Zeng, Dingli Liu and Diping Yuan; software, Yuan Zeng; validation, Weijun Liu and Guohua Wu; formal analysis, Yuan Zeng and Dingli Liu; investigation, Weijun Liu; resources, Dingli Liu and Diping Yuan; data curation, Yuan Zeng and Xiao Lei; writing—original draft preparation, Yuan Zeng; writing—review and editing, Dingli Liu and Diping Yuan; visualization, Xiao Lei; supervision, Guohua Wu; project administration, Weijun Liu; funding acquisition, Dingli Liu and Diping Yuan. All authors have read and agreed to the published version of the manuscript.
Funding
This paper was funded by the Shenzhen Science and Technology Program (No. KCXFZ20230731093902005), the National Natural Science Foundation of China (No. 52204202), the Hunan Provincial Natural Science Foundation of China (No. 2023JJ40058), and the Graduate Research Innovation Project of Hunan Province in 2024 (No. LXBZZ2024203).
Data Availability Statement
The data presented in this study are available upon request from the corresponding author.
Conflicts of Interest
The authors declare no conflicts of interest.
References
- Sha, Y.; Li, M.; Xu, H.; Zhang, S.; Feng, T. Smart city public safety intelligent early warning and detection. Sci. Program. 2022, 2022, 7552601. [Google Scholar] [CrossRef]
- Xiong, Y.; Li, G. Correlation Characteristics Between Urban Fires and Urban Functional Spaces: A Study Based on Point of Interest Data and Ripley’s K-Function. ISPRS Int. J. Geo-Inf. 2025, 14, 45. [Google Scholar] [CrossRef]
- Abrar, A.; Kamal, A.M.; Fahim, A.K.F. Fire risk vulnerability and safety assessment of Farmgate area using fire risk index, Dhaka City and optimization of fire hydrant placement. Prog. Disaster Sci. 2024, 24, 100384. [Google Scholar] [CrossRef]
- Hao, Y.; Li, M.; Wang, J.; Li, X.; Chen, J. A High-Resolution Spatial Distribution-Based Integration Machine Learning Algorithm for Urban Fire Risk Assessment: A Case Study in Chengdu, China. ISPRS Int. J. Geo-Inf. 2023, 12, 404. [Google Scholar] [CrossRef]
- Kiran, K.; Corcoran, J.; Chhetri, P. Measuring the spatial accessibility to fire stations using enhanced floating catchment method. Socio.-Econ. Plan. Sci. 2020, 69, 100673. [Google Scholar] [CrossRef]
- Granberg, T.A.; Pilemalm, S. Evaluation of new first response initiatives in emergency services. Socio.-Econ. Plan. Sci. 2020, 71, 100829. [Google Scholar] [CrossRef]
- Uddin, M.S.; Warnitchai, P. Decision support for infrastructure planning: A comprehensive location–allocation model for fire station in complex urban system. Nat. Hazards 2020, 102, 1475–1496. [Google Scholar] [CrossRef]
- Wang, W. Site Selection of Fire Stations in Cities Based on Geographic Information System and Fuzzy Analytic Hierarchy Process. Ing. Syst. Inf. 2019, 24, 619. [Google Scholar] [CrossRef]
- Li, L.; Li, N.; Wu, X.; Liu, B. A Method for Evaluating the Spatial Layout of Fire Stations in Chemical Industrial Parks. Appl. Sci. 2024, 14, 2918. [Google Scholar] [CrossRef]
- Yu, W.; Huang, Y.; Chen, Y.; Xia, Z. Accessibility analysis of urban fire stations within communities: A fine-scale perspective. J. Geograph. Syst. 2022, 24, 611–640. [Google Scholar] [CrossRef]
- Guangzhou Urban Firefighting Planning (2021–2035); The Guangzhou Municipal People’s Government: Guangzhou, China, 2013. Available online: https://www.gz.gov.cn/zwgk/ghjh/zxgh/content/post_9365073.html (accessed on 11 February 2025).
- Jiujiang Central Urban Area Firefighting Special Planning (2021–2035). Available online: https://bnr.jiujiang.gov.cn/zwgk_255/zdly/ghsj/ghbzpqgs/202412/t20241209_6791160.html (accessed on 11 February 2025).
- Yang, J.; Guo, K.; Dai, Y.; Tian, S.; Wang, W.; Jiang, Z.; Dai, Z. Spatial layout siting method for fire stations based on comprehensive forest fire risk distribution. Case Stud. Therm. Eng. 2023, 49, 103243. [Google Scholar] [CrossRef]
- Dong, D.; Yu, Z.; Xu, J. A Study on the Characteristics and System Construction of Urban Disaster Resilience in Shanghai: A Metropolis Perspective. Sustainability 2025, 17, 248. [Google Scholar] [CrossRef]
- Zhu, S.; Liu, W.; Liu, D.; Li, Y. The impact of dynamic traffic conditions on the sustainability of urban fire service. Sustain. Cities Soc. 2023, 96, 104667. [Google Scholar] [CrossRef]
- Yu, W.; Chen, Y.; Guan, M. Hierarchical siting of macro fire station and micro fire station. Environ. Plan. B Urban Anal. City Sci. 2021, 48, 1972–1988. [Google Scholar] [CrossRef]
- Han, B.; Hu, M.; Zheng, J.; Tang, T. Site selection of fire stations in large cities based on actual spatiotemporal demands: A case study of Nanjing City. ISPRS Int. J. Geo-Inf. 2021, 10, 542. [Google Scholar] [CrossRef]
- Li, J.; Hu, M. Mapping Spatial Inequity in Urban Fire Service Provision: A Moran’s I Analysis of Station Pressure Distribution. ISPRS Int. J. Geo-Inf. 2025, 14, 164. [Google Scholar] [CrossRef]
- Chen, M.; Wang, K.; Yuan, Y.; Yang, C. A POIs based method for location optimization of urban fire station: A case study in Zhengzhou City. Fire 2023, 6, 58. [Google Scholar] [CrossRef]
- Chen, Y.; Yao, J.; Wang, S.; Lai, Z.; Wu, L.; Dong, G. Location optimization of urban fire stations considering the variations in fire service demands: A bi-objective coverage model. Int. J. Digital Earth. 2025, 18, 2454386. [Google Scholar] [CrossRef]
- Yu, Z.; Xu, L.; Chen, S.; Jin, C. Research on Urban Fire Station Layout Planning Based on a Combined Model Method. ISPRS Int. J. Geo-Inf. 2023, 12, 135. [Google Scholar] [CrossRef]
- He, Q.; Xue, L.; Yang, Y.; Ding, P.; Liu, M. Research on Chinese Fire Station Optimal Location Model Based on Fire Risk Statistics: Case Study in Shanghai. Appl. Sci. 2024, 14, 2052. [Google Scholar] [CrossRef]
- Pérez, J.; Maldonado, S.; Marianov, V. A reconfiguration of fire station and fleet locations for the Santiago Fire Department. Int. J. Prod. Res. 2016, 54, 3170–3186. [Google Scholar] [CrossRef]
- Cova, S.; Andrade, C.; Soares, O.; Lopes, J. Evaluation of cost-optimal retrofit investment in buildings: The case of Bragança fire station, Portugal. Int. J. Strateg. Prop. Manag. 2021, 25, 369–381. [Google Scholar] [CrossRef]
- Abatcha, B.A.; Barde, U.; Iliyasu, I. Geospatial Mapping and Evaluation of Fire Service Station for Optimum Operation and Response in Damaturu Metropolis Damaturu Yobe State, Nigeria. Fane-Fane Int. Multidiscip. J. 2023, 7, 164–172. [Google Scholar]
- Vaz, I.C.M.; Ghisi, E.; Souza, J.C. Potential use of rainwater as a tool for fire stations and firefighting: Literature review, environmental and cost assessments. Sci. Total Environ. 2023, 898, 165510. [Google Scholar] [CrossRef]
- Wang, L.; Li, W.; Feng, W.; Yang, R. Fire risk assessment for building operation and maintenance based on BIM technology. Build. Environ. 2021, 205, 108188. [Google Scholar] [CrossRef]
- Yu, W.; Chen, Y.; Chen, Z.; Xia, Z.; Zhou, Q. Service area delimitation of fire stations with fire risk analysis: Implementation and case study. Int. J. Environ. Res. Public Health 2020, 17, 2030. [Google Scholar] [CrossRef]
- GB51080-2015; Urban Fire Protection Planning Code. China Architecture & Building Press: Beijing, China, 2015. Available online: http://www.jianbiaoku.com/webarbs/book/73741/1635907.shtml (accessed on 11 February 2025).
- Jian Biao 152-2017; Urban Fire Station Construction Standards. The Ministry of Housing and Urban-Rural Development: Beijing, China, 2017. Available online: http://ebook.chinabuilding.com.cn/zbooklib/bookpdf/probation?SiteID=1&bookID=98220 (accessed on 11 February 2025).
- NFPA 1710; Standard for the Organization and Deployment of Fire Suppression Operations, Emergency Medical Operations, and Special Operations to the Public by Career Fire Departments. The National Fire Protection Association: Quincy, MA, USA, 2020. Available online: https://www.nfpa.org/codes-and-standards/nfpa-1710-standard-development/1710 (accessed on 11 February 2025).
- Bayerisches Feuerwehrgesetz (BayFwG). Available online: https://www.gesetze-bayern.de/Content/Document/BayFwG (accessed on 11 February 2025).
- Sayarshad, R.H. Designing an intelligent emergency response system to minimize the impacts of traffic incidents: A new approximation queuing model. Int. J. Urban Sci. 2022, 26, 691–709. [Google Scholar] [CrossRef]
- Chen, Y.; Li, Y.; Wu, G.; Zhang, F.; Zhu, K.; Xia, Z.; Chen, Y. Exploring spatiotemporal accessibility of urban fire services using real-time travel time. Int. J. Environ. Res. Public Health 2021, 18, 4200. [Google Scholar] [CrossRef]
- Guan, J.; Zhang, K.; Shen, Q.; He, Y. Dynamic modal accessibility gap: Measurement and application using travel routes data. Transp. Res. D Transp. Environ. 2020, 81, 102272. [Google Scholar] [CrossRef]
- Zhou, T.; Liu, D.; Liu, W.; Li, Y.; Zhu, S.; Wang, J.; Shi, L. Hierarchical dynamic estimation of fire service accessibility based on POI big data. Case Stud. Therm. Eng. 2024, 59, 104503. [Google Scholar] [CrossRef]
- Lovelace, R. Open source tools for geographic analysis in transport planning. J. Geograph. Syst. 2021, 23, 547–578. [Google Scholar] [CrossRef]
- Huang, Y.; Liu, D.; Tang, J.; Niu, S.; Bell, F.M.; Pena-Mora, F. Dynamic estimation of the fire service spatial accessibility for EV charging stations: Towards preventing severe fires and explosions. Process Saf. Environ. Prot. 2025, 195, 106734. [Google Scholar] [CrossRef]
Disclaimer/Publisher’s Note: The statements, opinions and data contained in all publications are solely those of the individual author(s) and contributor(s) and not of MDPI and/or the editor(s). MDPI and/or the editor(s) disclaim responsibility for any injury to people or property resulting from any ideas, methods, instructions or products referred to in the content. |
© 2025 by the authors. Published by MDPI on behalf of the International Society for Photogrammetry and Remote Sensing. Licensee MDPI, Basel, Switzerland. This article is an open access article distributed under the terms and conditions of the Creative Commons Attribution (CC BY) license (https://creativecommons.org/licenses/by/4.0/).