Article

Spatiotemporal Patterns of Greening and Their Correlation with Surface Radiative Forcing on the Tibetan Plateau from 1982 to 2021

School of Ecology, Hainan University, Haikou 570228, China
*
Author to whom correspondence should be addressed.
ISPRS Int. J. Geo-Inf. 2025, 14(6), 228; https://doi.org/10.3390/ijgi14060228
Submission received: 30 April 2025 / Revised: 4 June 2025 / Accepted: 6 June 2025 / Published: 10 June 2025

Abstract

Vegetation change profoundly influences ecosystem sustainability and human activities, with solar radiation serving as a primary driver. However, the effects of surface radiative forcing (SRF) and related factors on vegetation dynamics remain poorly understood. The Tibetan Plateau, a climate-sensitive region, offers a unique context to investigate these relationships. This study analyzes the association between vegetation greening and SRF on the Tibetan Plateau from 1982 to 2021. Using forecast albedo (FAL) and surface solar radiation downwards (SSRD), we calculated SRF and explored its correlation with the Normalized Difference Vegetation Index (NDVI) and land cover data. The results indicate a gradual increase in growing-season NDVI, suggesting vegetation greening. Both FAL and SSRD exhibit decreasing trends, yet neither shows a statistically significant correlation with NDVI. The correlations between FAL/SSRD and NDVI weaken with increasing altitude, declining by 0.035 × 10⁻¹ per 500 m and 0.021 × 10⁻¹ per 500 m, respectively. Among vegetation types, FAL correlates most strongly with shrubland NDVI and weakest with forest NDVI, while SSRD demonstrates the highest correlation with grassland NDVI and lowest with forest NDVI. The impact of SRF on NDVI changes is evident in 52.881% of the plateau, showing a positive correlation between SRF and ΔNDVI, compared to 39.589% for SSRD and ΔNDVI. This research enhances the understanding of vegetation responses to FAL, SSRD, and SRF, providing a scientific basis for ecological conservation and climate adaptation strategies, and also emphasizes radiation–vegetation feedback, providing guidance for conservation strategies in other alpine ecosystems globally, such as the Andes and Alps, where elevation gradients and vegetation-type-specific responses to radiative forcing may similarly govern ecological outcomes.

1. Introduction

Vegetation, a fundamental component of Earth’s ecosystems, plays an indispensable role in the global carbon cycle and climate regulation [1,2,3]. It provides essential resources for humans and wildlife while maintaining ecological balance through photosynthesis, which involves absorbing carbon dioxide and releasing oxygen [4,5]. Solar radiation, the primary energy source for photosynthesis, significantly influences plant growth and development [6]. Therefore, investigating how vegetation responds to solar radiation is critical for understanding ecosystem functions and the implications of climate change.
The Tibetan Plateau, characterized by its high elevation and complex terrain, is dominated by an alpine ecosystem and exhibits a unique plateau climate. As one of the regions most vulnerable to climate change, it is highly susceptible to the impacts of global climatic shifts due to its sensitive ecological and topographical conditions [7,8]. Its vegetation communities transition from forests in the southeast to deserts in the northwest, making their distribution a key indicator of global climate responses [9]. Studying the relationships between vegetation, FAL, and SSRD on the Tibetan Plateau enhances our understanding of vegetation adaptation to climate change and informs ecological protection and adaptation strategies [10]. Moreover, vegetation changes on the plateau are intricately linked to regional water and carbon cycles, with implications for global ecological security [11].
The Normalized Difference Vegetation Index (NDVI) is widely used to quantify vegetation changes and assess ecosystem health. Recent studies have reported a notable greening trend in the Tibetan Plateau NDVI over recent decades [12], reflecting improved vegetation growth despite localized degradation [13,14]. Spatially, vegetation conditions are superior in the southeastern plateau compared to the northwest [15]. From 1982 to 2021, the average growing-season NDVI increased at a rate of 0.006 per decade, with accelerated growth post-2000 (0.011 per decade) [16]. This trend exhibits spatial heterogeneity, with significant increases in the north, west, and south, while the human-dominated southeastern region shows declines [16]. Drivers of these changes include temperature [17], cryospheric melting-induced soil moisture [18], hydrological alterations from glacier melt and permafrost thaw [19,20,21,22,23,24], and anthropogenic factors like grazing and land-use change [25,26,27].
FAL and vegetation changes are closely intertwined [28,29,30]. Zheng et al. observed a shift from negative to positive correlation between FAL and Tibetan grassland vegetation during the growing season [31], while Tu et al. reported negative correlations between seasonal NDVI and solar radiation across the plateau [32]. Hao et al. found negative spring, summer, and autumn correlations between alpine meadow NDVI and solar radiation, with summer-only effects in alpine steppes [33]. Radiative forcing, which influences both warming and cooling, also impacts vegetation dynamics [34]. Feng et al. noted that global vegetation increases reduce FAL, enhancing radiative forcing [35], while Tang et al. highlighted human-induced albedo changes affecting radiative forcing in Beijing [36]. Despite these insights, the direct effects of radiative forcing on vegetation remain understudied.
This study investigates the Tibetan Plateau’s vegetation greening trend and its relationship with FAL, SSRD, and SRF. Using AVHRR GIMMS NDVI and ERA5-Land data, we aim to characterize spatiotemporal vegetation patterns and the mechanisms through which FAL, SSRD, and SRF influence these changes. We hypothesized that SRF exerts a strong inhibitory effect on NDVI, particularly in forests. By advancing the understanding of vegetation-climate interactions, this research supports the development of effective ecological and climate strategies. This study focuses on the vegetation greening trend over the Tibetan Plateau and its relationship with FAL, SSRD, and SRF calculated previously.

2. Materials and Methods

2.1. Study Area

The Tibetan Plateau, the world’s highest and largest plateau (average elevation > 4000 m), is termed the “Third Pole”, with an elevation distribution as shown in Figure 1a [37]. As the source of major Asian rivers (e.g., Yangtze, Yellow, and Mekong), it is critical for regional hydrology and is known as the “Water Tower of Asia” [38,39]. This study focuses on the region spanning 26.5° to 39.5° N latitude and 78.3° to 103° E longitude (2.57 × 10⁶ km2). The northern and western areas are dominated by deserts/semi-deserts, southeastern regions by forests, and central areas by grasslands with shrublands as the secondary vegetation type, as shown in Figure 1b [40,41].

2.2. Datasets

This study utilizes various remote sensing datasets to analyze vegetation and radiation dynamics. Vegetation data were obtained from the 15-day AVHRR GIMMS NDVI dataset (0.08° resolution, 1982–2021), which is widely used for long-term vegetation monitoring. Data on radiation-related variables, including the monthly ERA5-Land FAL and SSRD, were derived from model-based reanalysis data produced by ECMWF (0.09° resolution, 1982–2021). Elevation data were derived from the GMTED2010 DEM (30 arc-seconds resolution, 2010), providing high-precision topographic information. Vegetation type data were obtained from MODIS land cover products (0.1° resolution, 2021), which classify vegetation into forests (types 1–5), shrublands (6–7), and grasslands (10) for ecosystem-specific analysis. Detailed dataset attributes are summarized in Table 1.

2.3. Analysis

2.3.1. Data Preprocessing

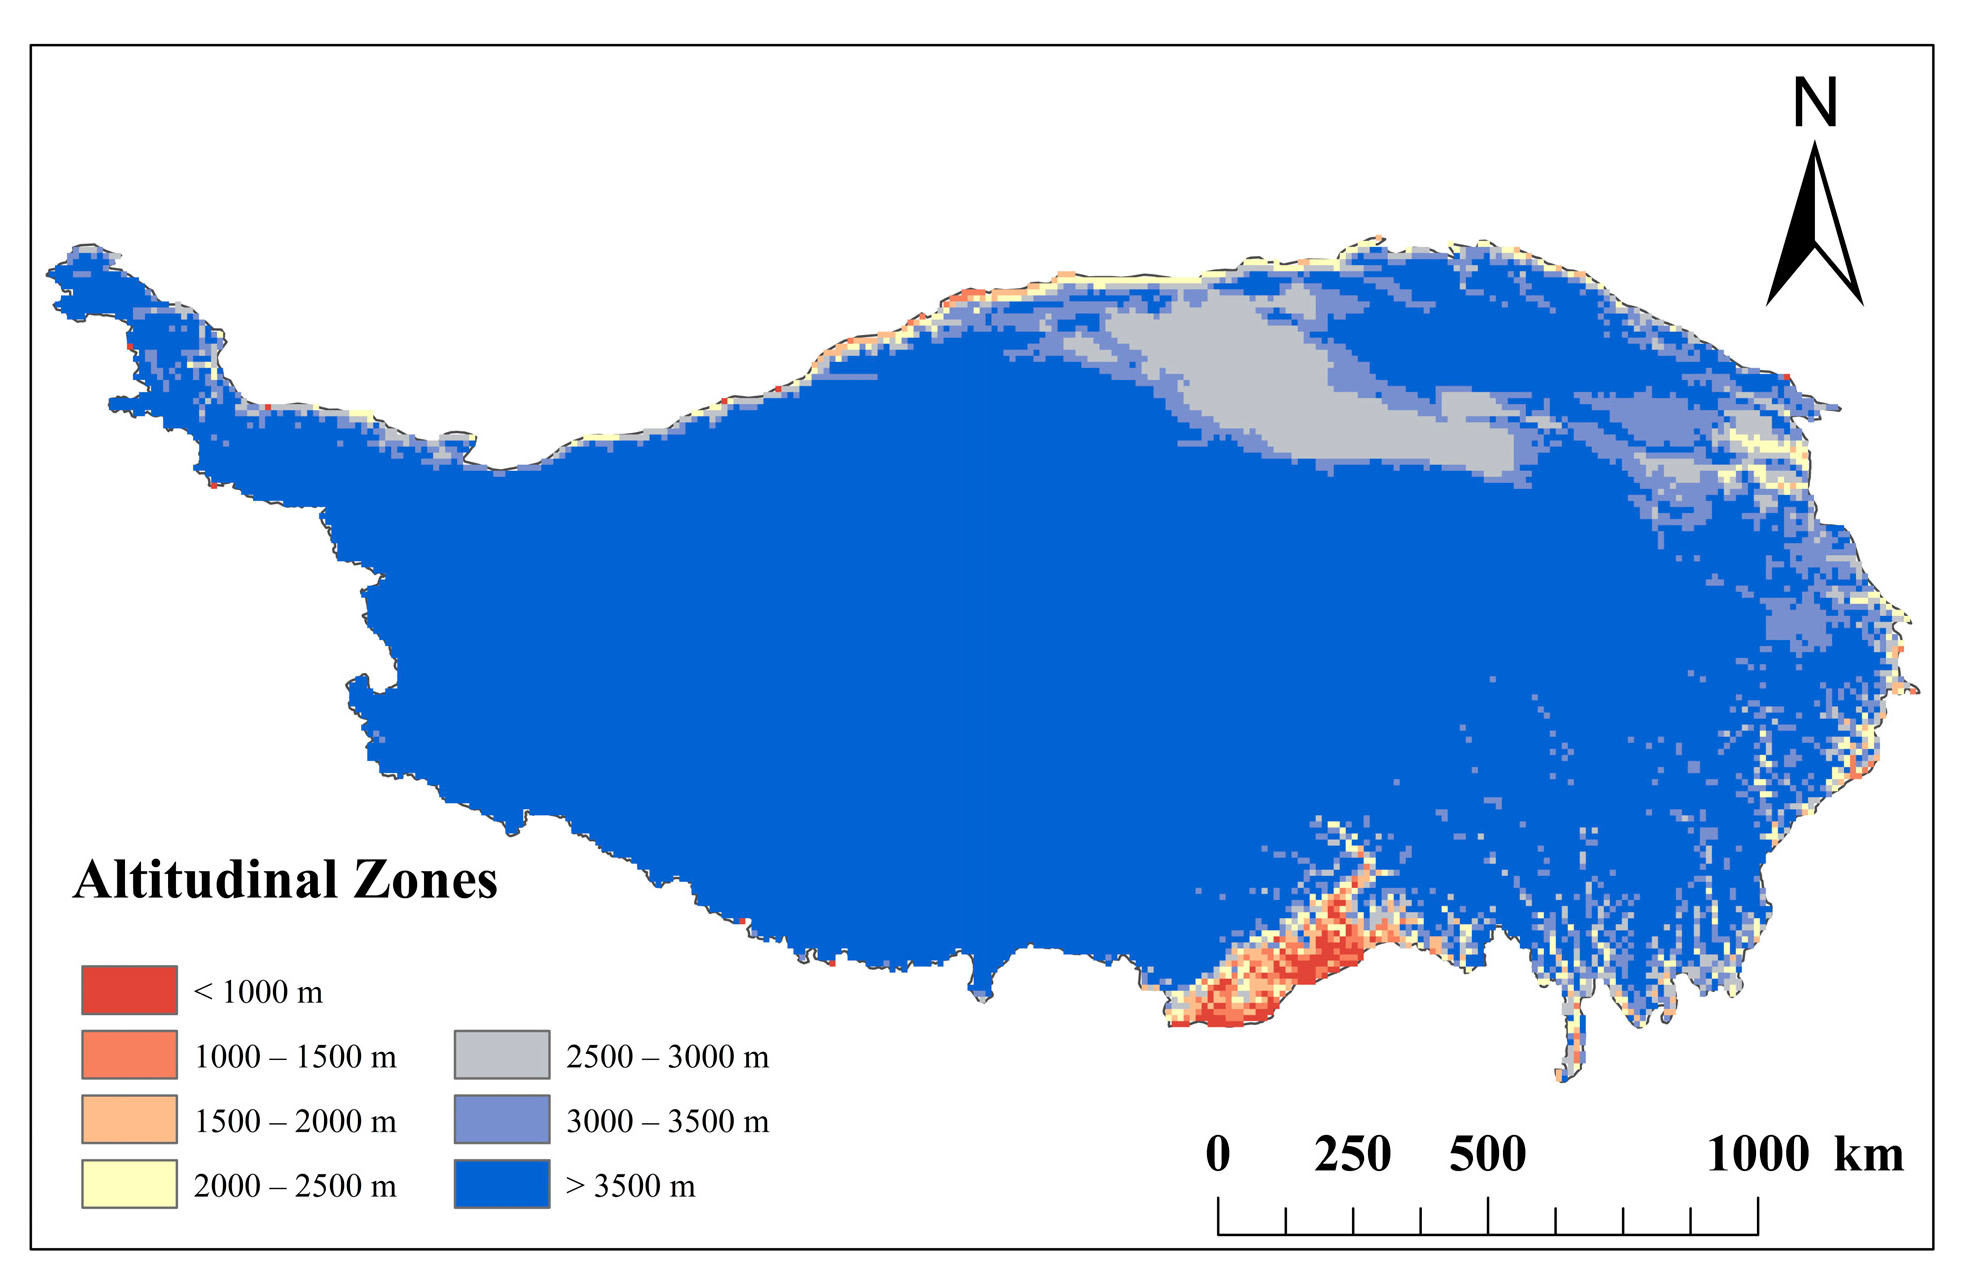
The growing season (June–September) was defined for NDVI, FAL, and SSRD. NDVI was processed using maximum value compositing to reduce cloud effects, and annual growing-season averages were calculated. FAL and SSRD were averaged for June–September. Elevation zones (1000–3500 m in 500 m intervals) were defined to analyze elevation-dependent vegetation responses, as Figure 2 shows [42,43,44]. MODIS land cover data classified vegetation types, and all the datasets were resampled to 0.1° using bicubic interpolation in ENVI 5.3 for spatial consistency.

2.3.2. Calculation of Regional Average Surface Radiative Forcing

In the ERA5-Land dataset, the FAL data ranges from 0 to 1 and can be utilized without calculation. The SSRD data is accumulated over a 24 h period in J/m2 and subsequently divided by 86400 to convert to the unit W/m2.
Based on the study by Tang et al. [45], SRF is calculated as the product of the multi-year average of SSRD and the change in FAL. The formula is reflected below:
Δ A = A t + 1 A t
where t denotes the starting year (t = 1982, 1983, 1984, …, 2020) and t + 1 represents the subsequent year (e.g., t = 1982 corresponds to t + 1 = 1983). The maximum t is 2020, as the study period spans 1982–2021.
R s ¯ = 1 86400 1 40 i = 1982 2021 R s
F R = Δ A · R s ¯
where A is FAL, R S is SSRD, and F R is SRF. A positive value of F R indicates that the forcing factor enhances energy absorption, leading to a warming effect, while a negative F R value signifies that the forcing factor results in energy release, causing a cooling effect. Since SRF is calculated from the first two, FAL, SSRD, and the SRF calculated from them are studied in the paper.

2.3.3. Slope Trend Analysis

Slope trend analysis, a linear regression method, is used to assess trend changes in time-series data [46]. In this study, we applied slope trend analysis to identify the temporal trends of NDVI, FAL, and SSRD during the growing season on the Tibetan Plateau. By calculating the slope of the time series, we quantified the rate of change in NDVI, FAL, and SSRD intensity, while also assessing the statistical significance of these trends. The formula is reflected below:
S l o p e = n E i · N D V I i E i N D V I i n E i 2 E i 2
where n is the length of the time series, E i is the time variable at the i -th observation, and N D V I i is the NDVI value at the i -th time point. When the slope analysis of FAL or SSRD is performed later, the NDVI value can be replaced by the FAL value or SSRD value.

2.3.4. Mann–Kendall Test

The Mann–Kendall (MK) test is a non-parametric statistical method commonly used to detect monotonic trends in time-series data [47,48]. Unlike slope trend analysis, the MK test does not require the data to follow a normal distribution, making it applicable to a wide range of datasets [49,50]. In this study, the MK test was employed to determine whether significant upward or downward trends exist in NDVI and FAL as well as SSRD on the Tibetan Plateau. The results of the MK test will provide insights into the statistical significance, direction, and strength of these trends. The formula is reflected below:
S = i = 1 n 1 j = i + 1 n s g n x j x i
where n is the length of the time series, x i and x j are the observed values at times i and j , and sgn(⋅) is a sign function, defined as follows:
s g n x j x i = + 1   if   x j > x i 0   if   x j = x i 1   if   x j < x i
When n 10 , S approximately follows a normal distribution with variance:
V a r S = n n 1 2 n + 5 k = 1 m t k t k 1 2 t k + 5 18
where m is the number of tied groups, and t k is the size of the k -th tied group.
Standardized test statistic Z is reflected below:
Z = S 1 V a r S   if   S > 0 , 0   if   S = 0 , S + 1 V a r S   if   S < 0
If Z > Z 1 a / 2 , the initial null hypothesis (no trend) is rejected and a significant trend is assumed ( a is the significance level, usually taken as 0.05). Z > 0 indicates an upward trend and Z < 0 indicates a downward trend.
In this study, the Mann–Kendall test was used to identify significant upward or downward trends in NDVI, FAL, and SSRD on the Tibetan Plateau from 1982 to 2021. After detecting a mutation time point, we delineated the trends—whether upward or downward—before and after this point.

2.3.5. Partial Correlation Analysis

Partial correlation analysis is a statistical method used to assess the relationship between two variables while controlling for the influence of one or more additional variables [51]. In this study, partial correlation analysis was employed to examine the direct relationship between NDVI during the growing season and FAL and SSRD on the Tibetan Plateau, excluding potential confounding variables. By using partial correlation analysis, we can more accurately evaluate the independent effects of FAL and SSRD on NDVI. The formula is reflected below:
r F A L , N D V I | | S S R D = r F A L , N D V I r S S R D , N D V I · r F A L , S S R D 1 r S S R D , N D V I 2 1 r F A L , S S R D 2
r S S R D , N D V I | | F A L = r S S R D , N D V I r F A L , N D V I · r S S R D , F A L 1 r F A L , N D V I 2 1 r S S R D , F A L 2
where r F A L , N D V I is the raw correlation between FAL and NDVI, r S S R D , N D V I   is the raw correlation between SSRD and NDVI, r F A L , S S R D is the raw correlation between FAL and SSRD, r S S R D , F A L is the raw correlation between SSRD and FAL, and r F A L , S S R D = r S S R D , F A L due to the symmetry of the Pearson correlation.

2.3.6. Factor Dominance and Contribution

In this study, factor dominance is defined as the difference between the absolute values of the partial correlation coefficients of two factors on the same raster. If the difference is positive, it indicates that the dominant factor affecting NDVI on this raster is FAL, which is labeled in red. Conversely, if the difference is negative, it indicates that the dominant factor affecting NDVI is SSRD, labeled in blue. The formula is reflected below:
Dominance   = R e d   if   r F A L , N D V I | | S S R D r S S R D , N D V I | | F A L > 0 , F A L d o m i n a t e d B l u e   if   r F A L , N D V I | | S S R D r S S R D , N D V I | | F A L < 0 ,   S S R D d o m i n a t e d
The factor contribution is defined as the positive or negative partial correlation coefficient of two factors on the same grid. If the partial correlation coefficients of the two factors are both positive, it means that both factors contribute to the NDVI, which is shown in red. If the partial correlation coefficients of the two factors are both negative, it means that both factors have an inhibitory effect on NDVI, which is colored blue. If the partial correlation coefficients of the two factors have a positive value for one and a negative value for the other, it means that one of the factors contributes to NDVI and the other inhibits NDVI. Specifically, FAL promotes and SSRD inhibits, shown in orange; SSRD inhibits and FAL promotes, shown in purple. The formula is as follows:
C o n t r i b u t i o n =   Red     if   r F A L S S R D > 0   and   r S S R D F A L > 0 , b o t h F A L a n d S S R D p r o m o t e   Blue     if   r F A L S S R D < 0   and   r S S R D F A L < 0 , b o t h F A L a n d S S R D i n h i b i t s   Orange     if   r F A L S S R D > 0   and   r S S R D F A L < 0 , F A L p r o m o t e s , S S R D i n h i b i t s   Purple     if   r F A L S S R D < 0   and   r S S R D F A L > 0 , S S R D p r o m o t e s , F A L i n h i b i t s #
After clarifying the dominance or contribution of each factor, its percentage within the Tibetan Plateau region is counted, and the resulting percentage is the dominance or contribution percentage.

2.3.7. Experimental Procedures

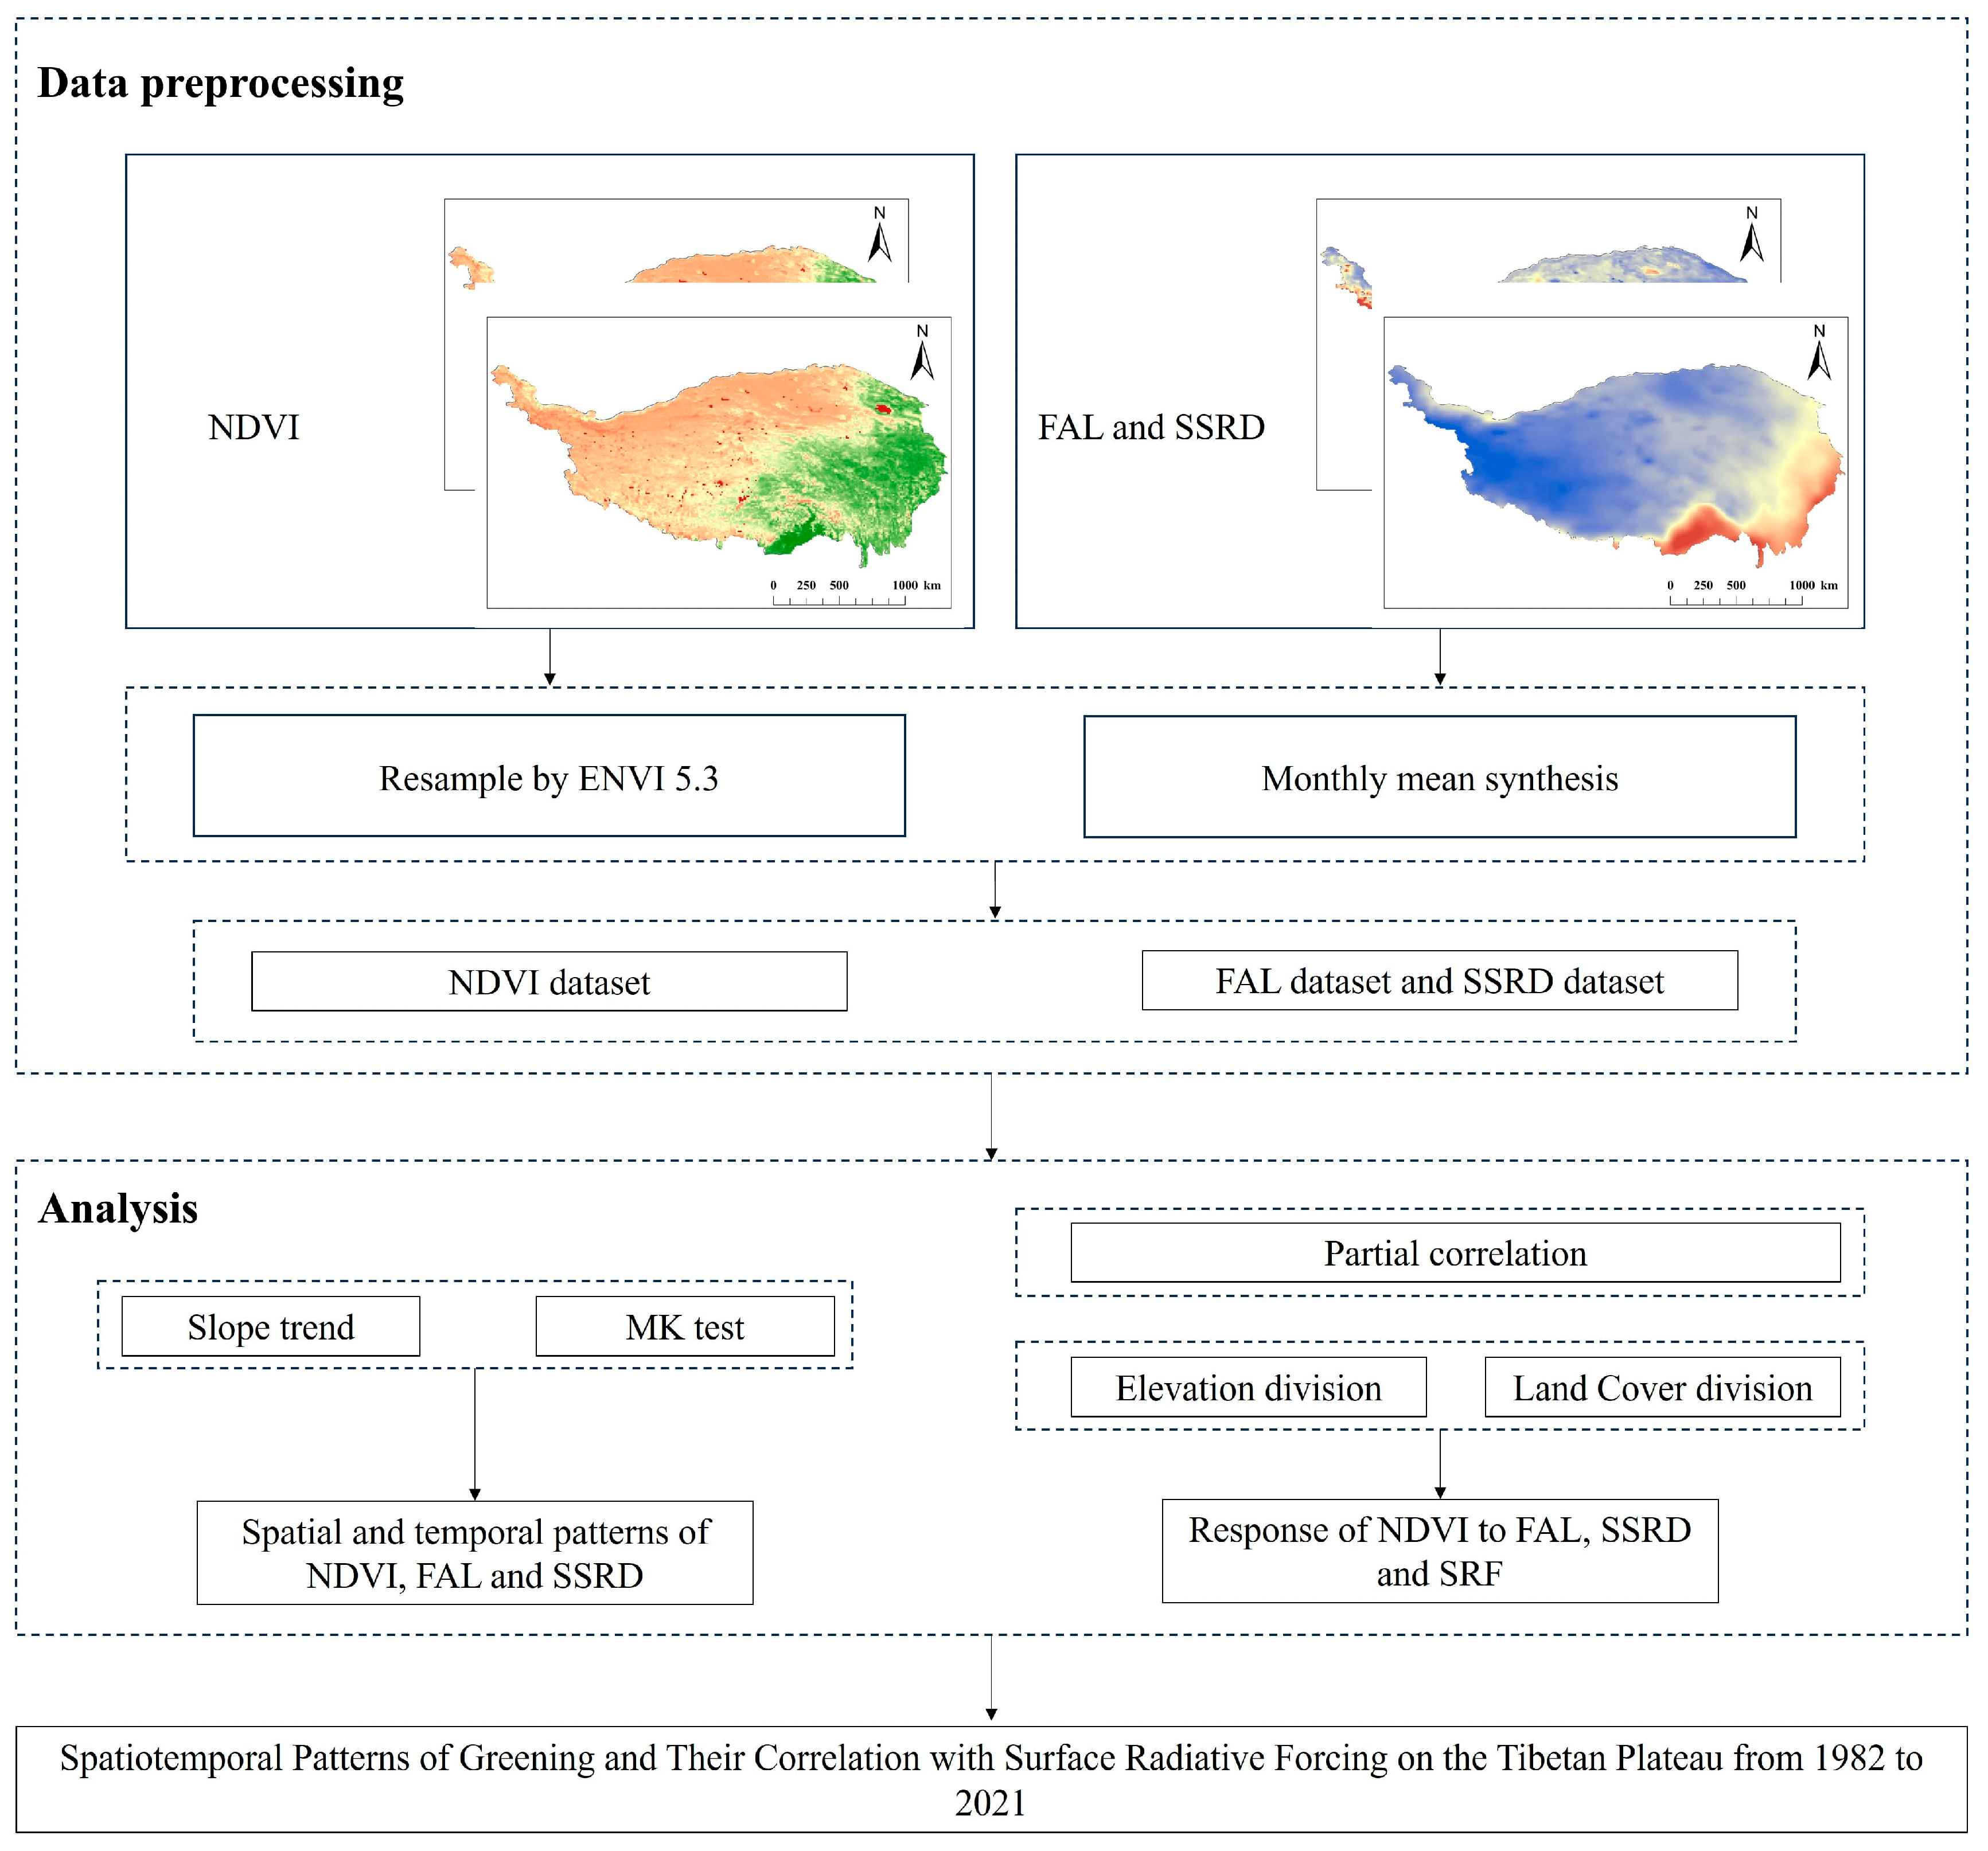
Figure 3 illustrates the experimental procedures of this study. The work begins with data preprocessing, where NDVI, FAL and SSRD datasets are processed in ENVI 5.3 through resampling, monthly mean synthesis, and integration with vegetation datasets. Then, the analysis phase applies slope trend and MK tests to determine spatial and temporal variations of NDVI, FAL, and SSRD across different regions. Finally, partial correlation analysis is conducted to assess NDVI responses to FAL, SSRD, and SRF, with elevation and land cover classifications refining the interpretation of their interactions.

3. Results

3.1. Spatial and Temporal Variation in NDVI on the Tibetan Plateau

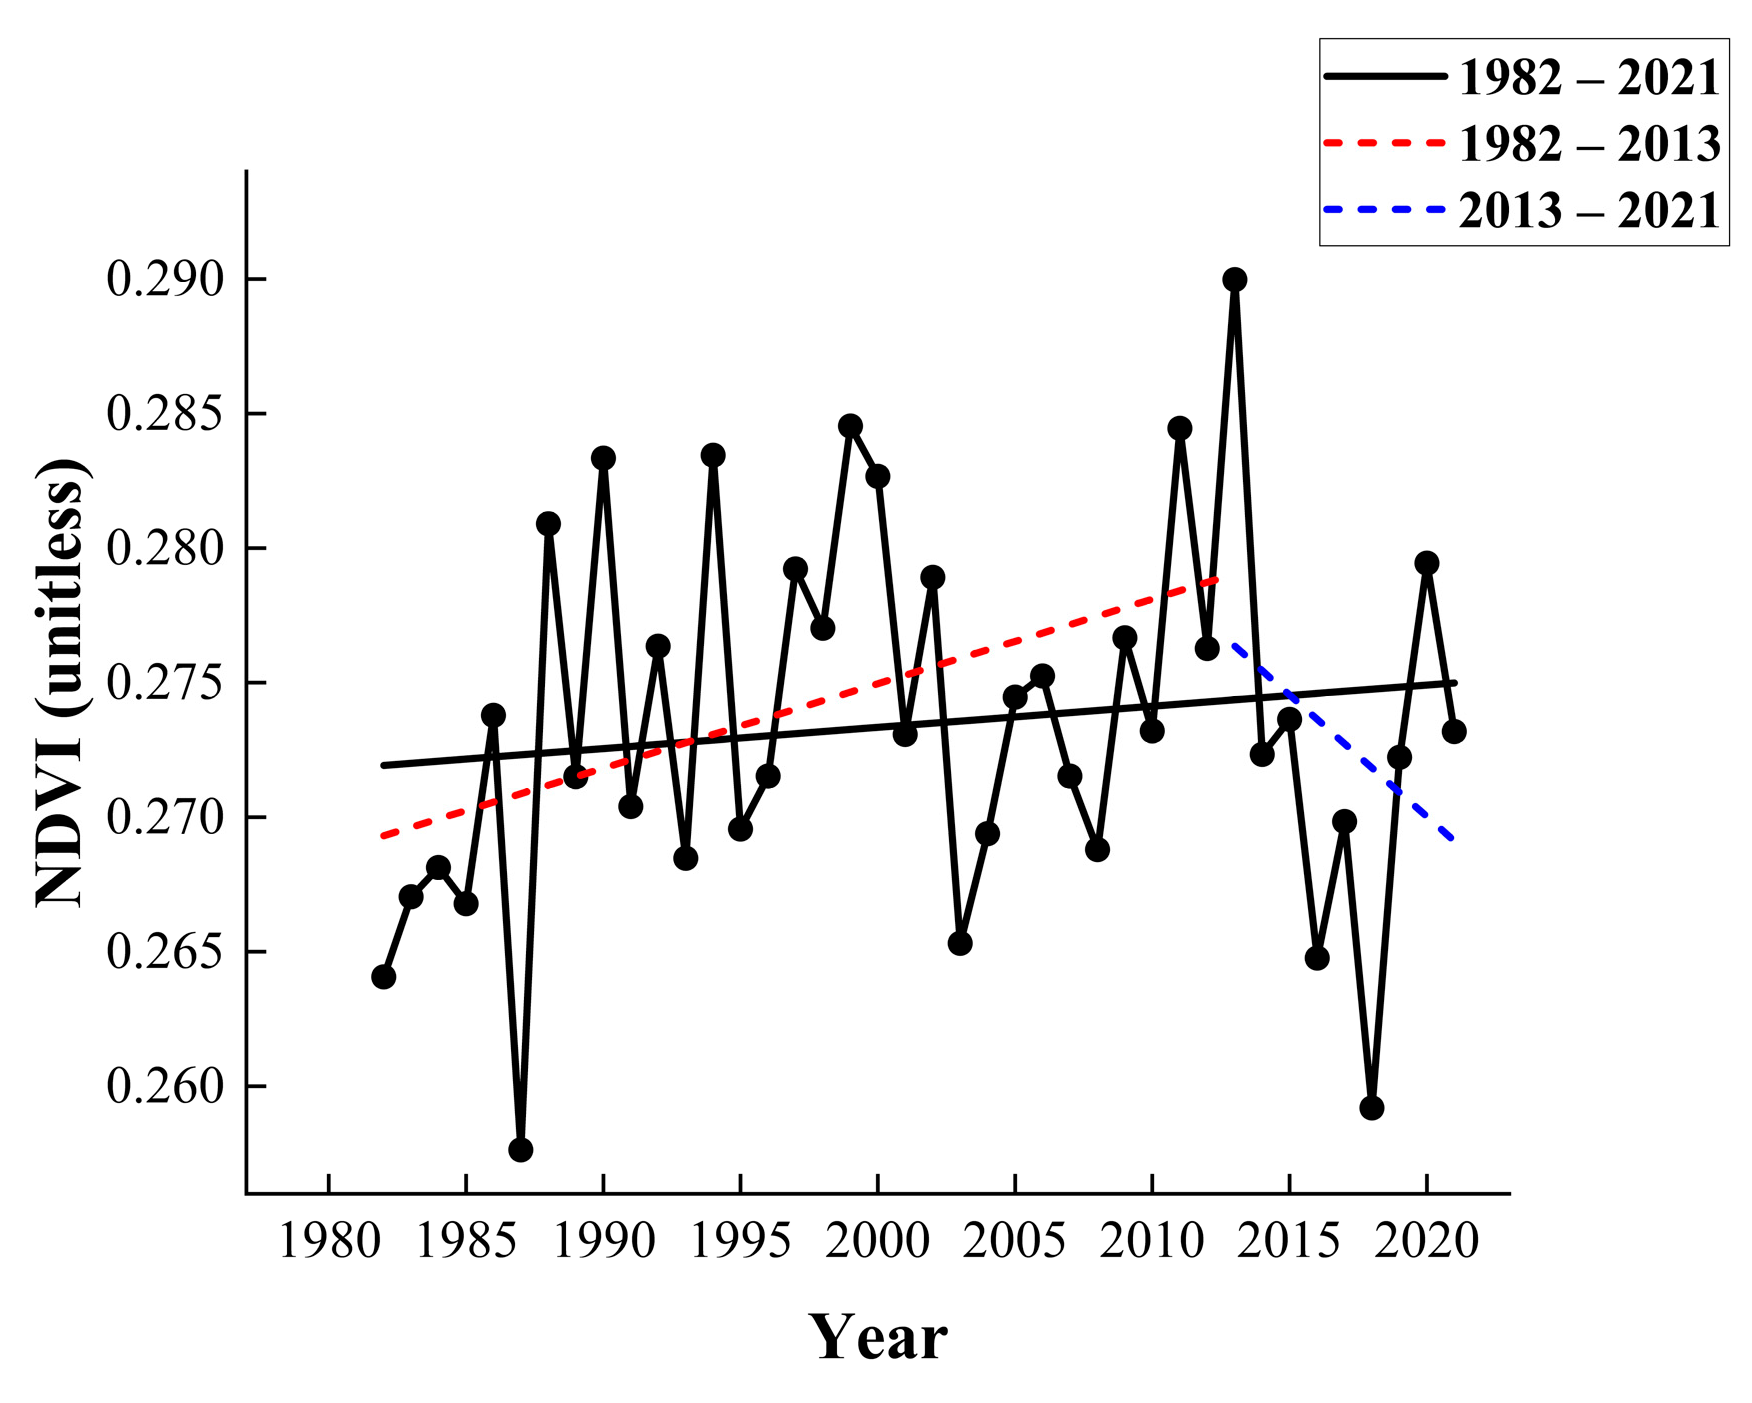
Figure 4 illustrates the temporal characteristics of the NDVI during the growing season on the Tibetan Plateau from 1982 to 2021. Over the past 40 years, the spatially averaged NDVI during the growing season has demonstrated a fluctuating upward trend, increasing at a rate of 7.864 × 10⁻⁵ per year, with a trough value of 0.258 in 1987 and a peak value of 0.289 in 2013. Using 2013 as a reference point, the upward trend in mean NDVI was significant (p = 0.018), increased at a rate of 3.141 × 10⁻⁴ per year from 1982 to 2013, but subsequently decreased at a rate of −9.045 × 10⁻⁴ per year from 2013 to 2021, with a less significant trend (p = 0.455), as shown in Table 2.
Figure 5 shows that there are significant differences in the normalization of the growing season on the Tibetan Plateau. From southeast to northwest, the NDVI values showed a clear stepwise decreasing trend, with the highest NDVI values occurring in the Nyingchi region in the south and the lowest NDVI values in the Nagqu region in the west.
Overall, as shown in Figure 6a, areas with higher NDVI growth rates during the growing season are concentrated in the northern and northeastern parts of the Tibetan Plateau, particularly to the east of the Qaidam Basin. In contrast, regions with lower growth rates are mainly located in the southern areas, such as Nyingchi and Chamdo. Figure 6b shows that the patterns of significant increases and decreases in NDVI correspond to the spatial distribution shown in the slope trend map.

3.2. Temporal Variation in FAL and SSRD on the Tibetan Plateau

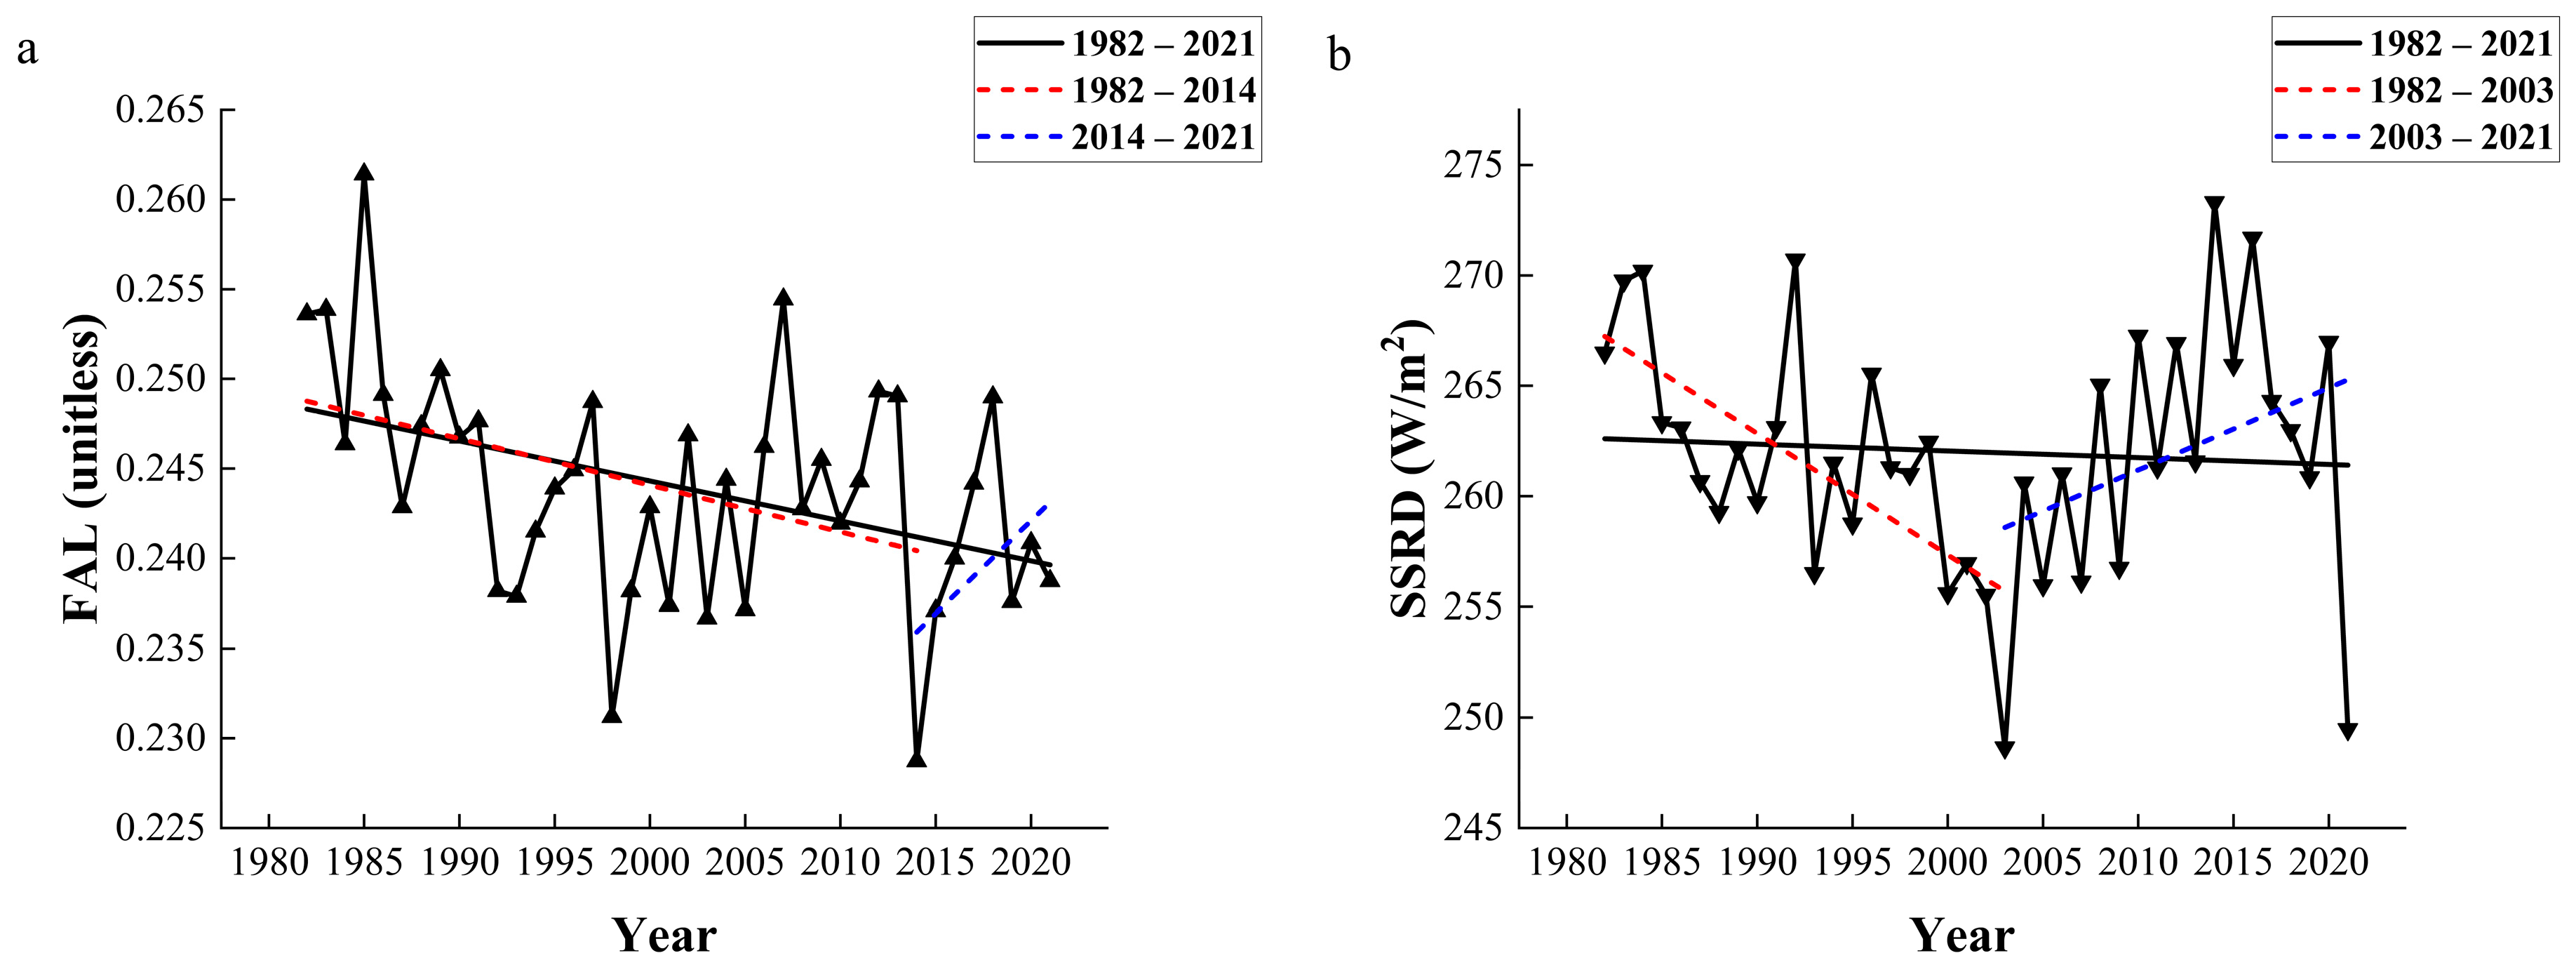
Figure 7 illustrates the changes in FAL and SSRD during the growing season on the Tibetan Plateau from 1982 to 2021. The results show a significant decreasing trend in FAL over the past four decades, with a rate of −2.226 × 10⁻⁴ per year, reaching its lowest value of 0.229 in 2014. When the data was divided at 2014, FAL decreased at a rate of −2.603 × 10⁻⁴ per year from 1982 to 2014, and then increased slightly at a rate of 2.007 × 10⁻⁴ per year from 2015 to 2021. The minor peak during 1982–2014 occurred in 1985, with a value of 0.261, while during 2015–2021, it occurred in 2018, with a value of 0.248, as shown in Table 3.
SSRD during the growing season displayed a slight decreasing trend at a rate of −0.031 per year, reaching its lowest value of 248.644 W/m2 in 2003. When the data was divided at 2003, SSRD decreased significantly at a rate of −0.549 per year from 1982 to 2003, followed by a slower increase at a rate of 0.177 per year from 2004 to 2021. The minor peak during 1982–2003 occurred in 1992, with a value of 270.699 W/m2, while during 2004–2021, the peak appeared in 2014, with a value of 273.303 W/m2, as shown in Table 4.
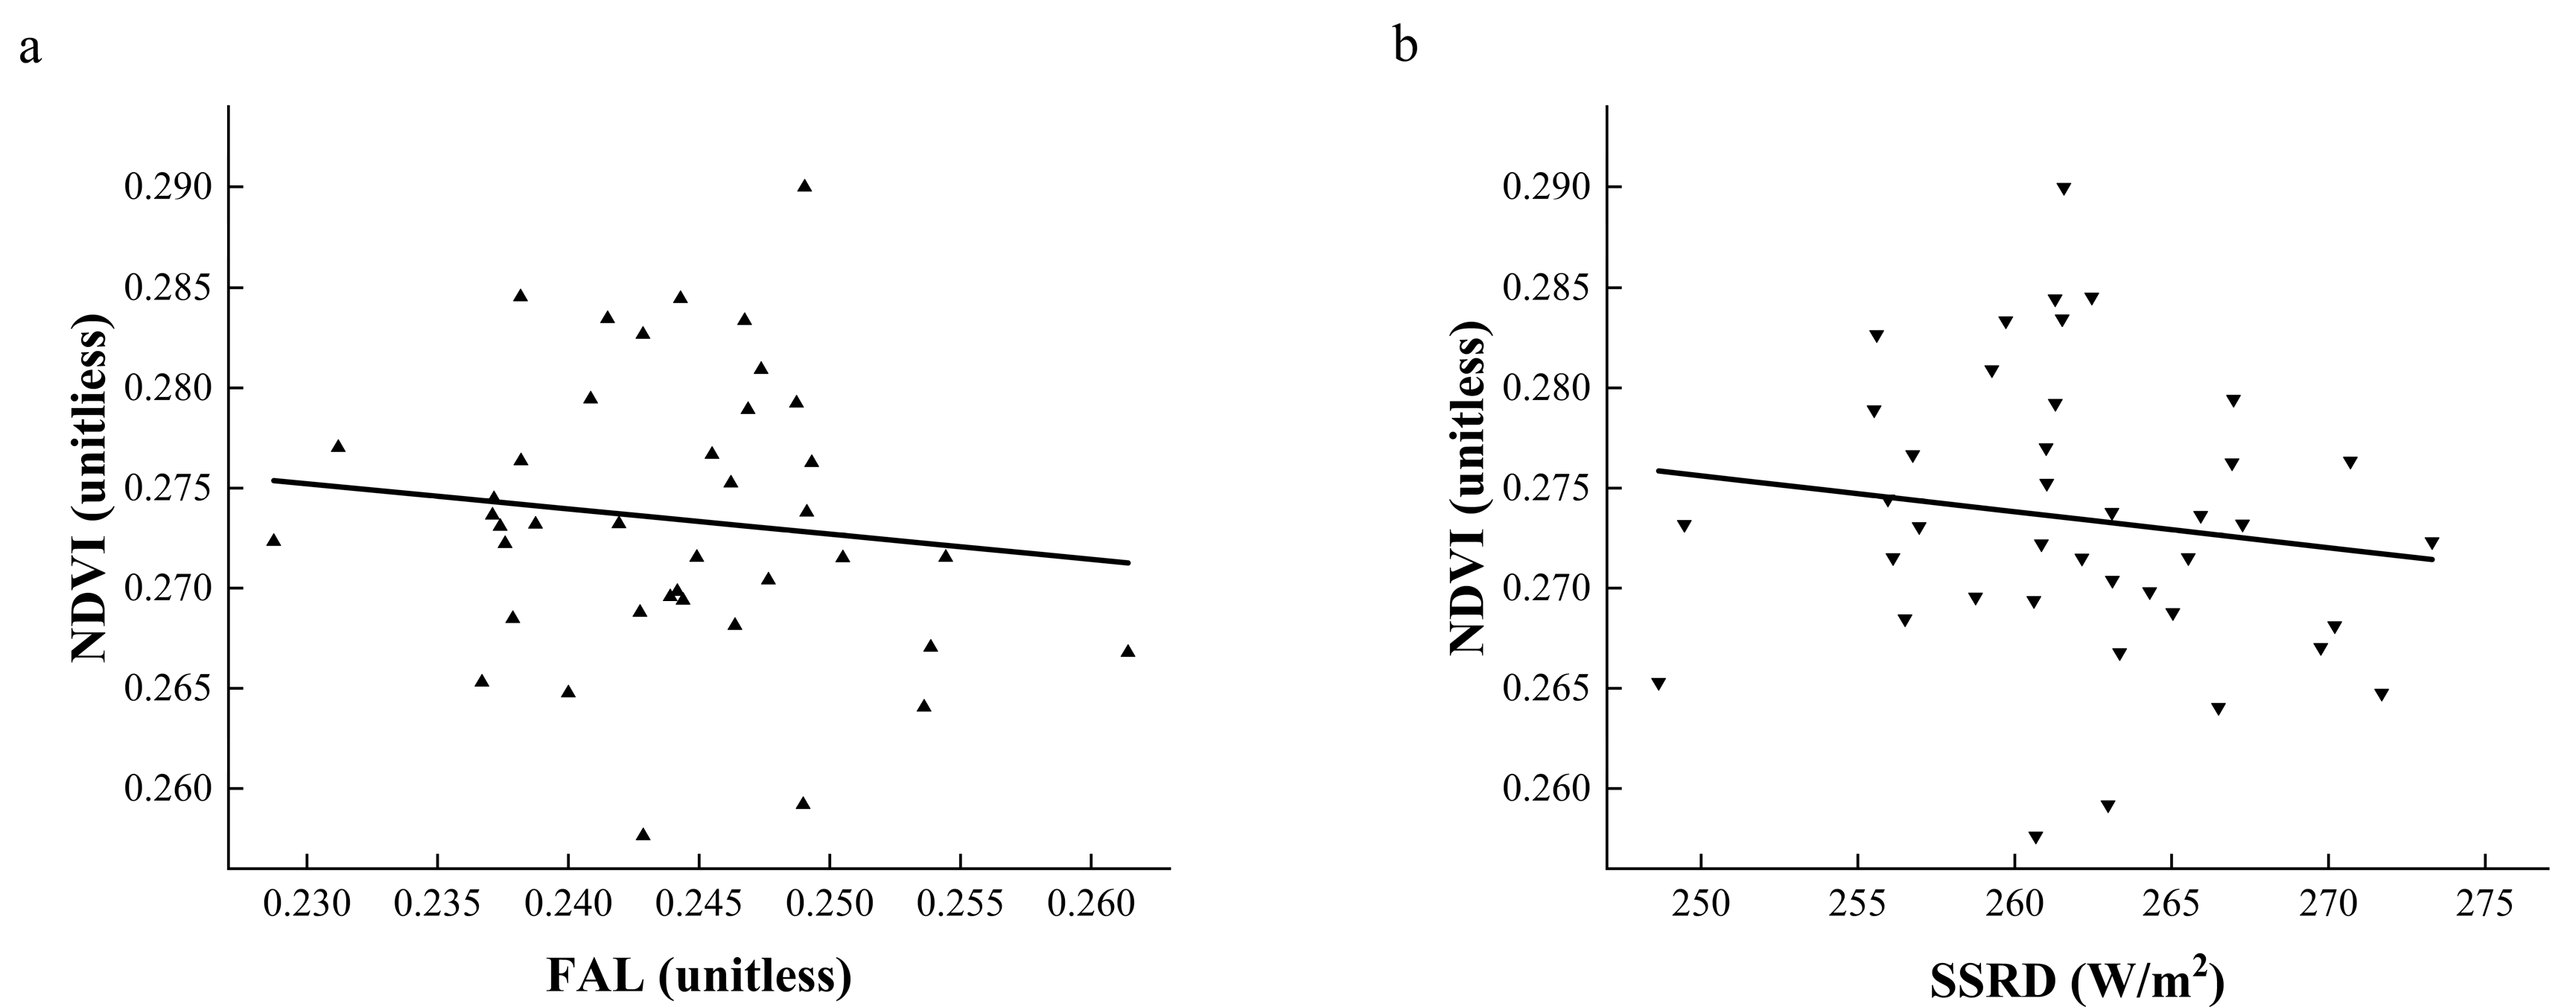
From 1982 to 2021, both FAL and SSRD during the growing season on the Tibetan Plateau showed negative correlations with NDVI. For every unit increase in FAL, NDVI decreased by 0.126, while for every unit increase in SSRD, NDVI decreased by −1.795 × 10⁻⁴, as shown in Table 5.
Figure 8 illustrates that when controlling for SSRD, the regions where FAL and NDVI are negatively correlated accounted for 57.92% of the total area, predominantly in the northwest, north, and northeast of the Tibetan Plateau. In contrast, the regions where FAL and NDVI are positively correlated comprised 42.08% of the total area, more scattered across the central and southern parts of the plateau.
When controlling for FAL, the regions where SSRD and NDVI are negatively correlated covered 59.71% of the total area, mainly concentrated in the central and southwestern parts of the Tibetan Plateau. Conversely, the regions where SSRD and NDVI are positively correlated made up 40.29%, distributed in the northwest, north, and northeast.
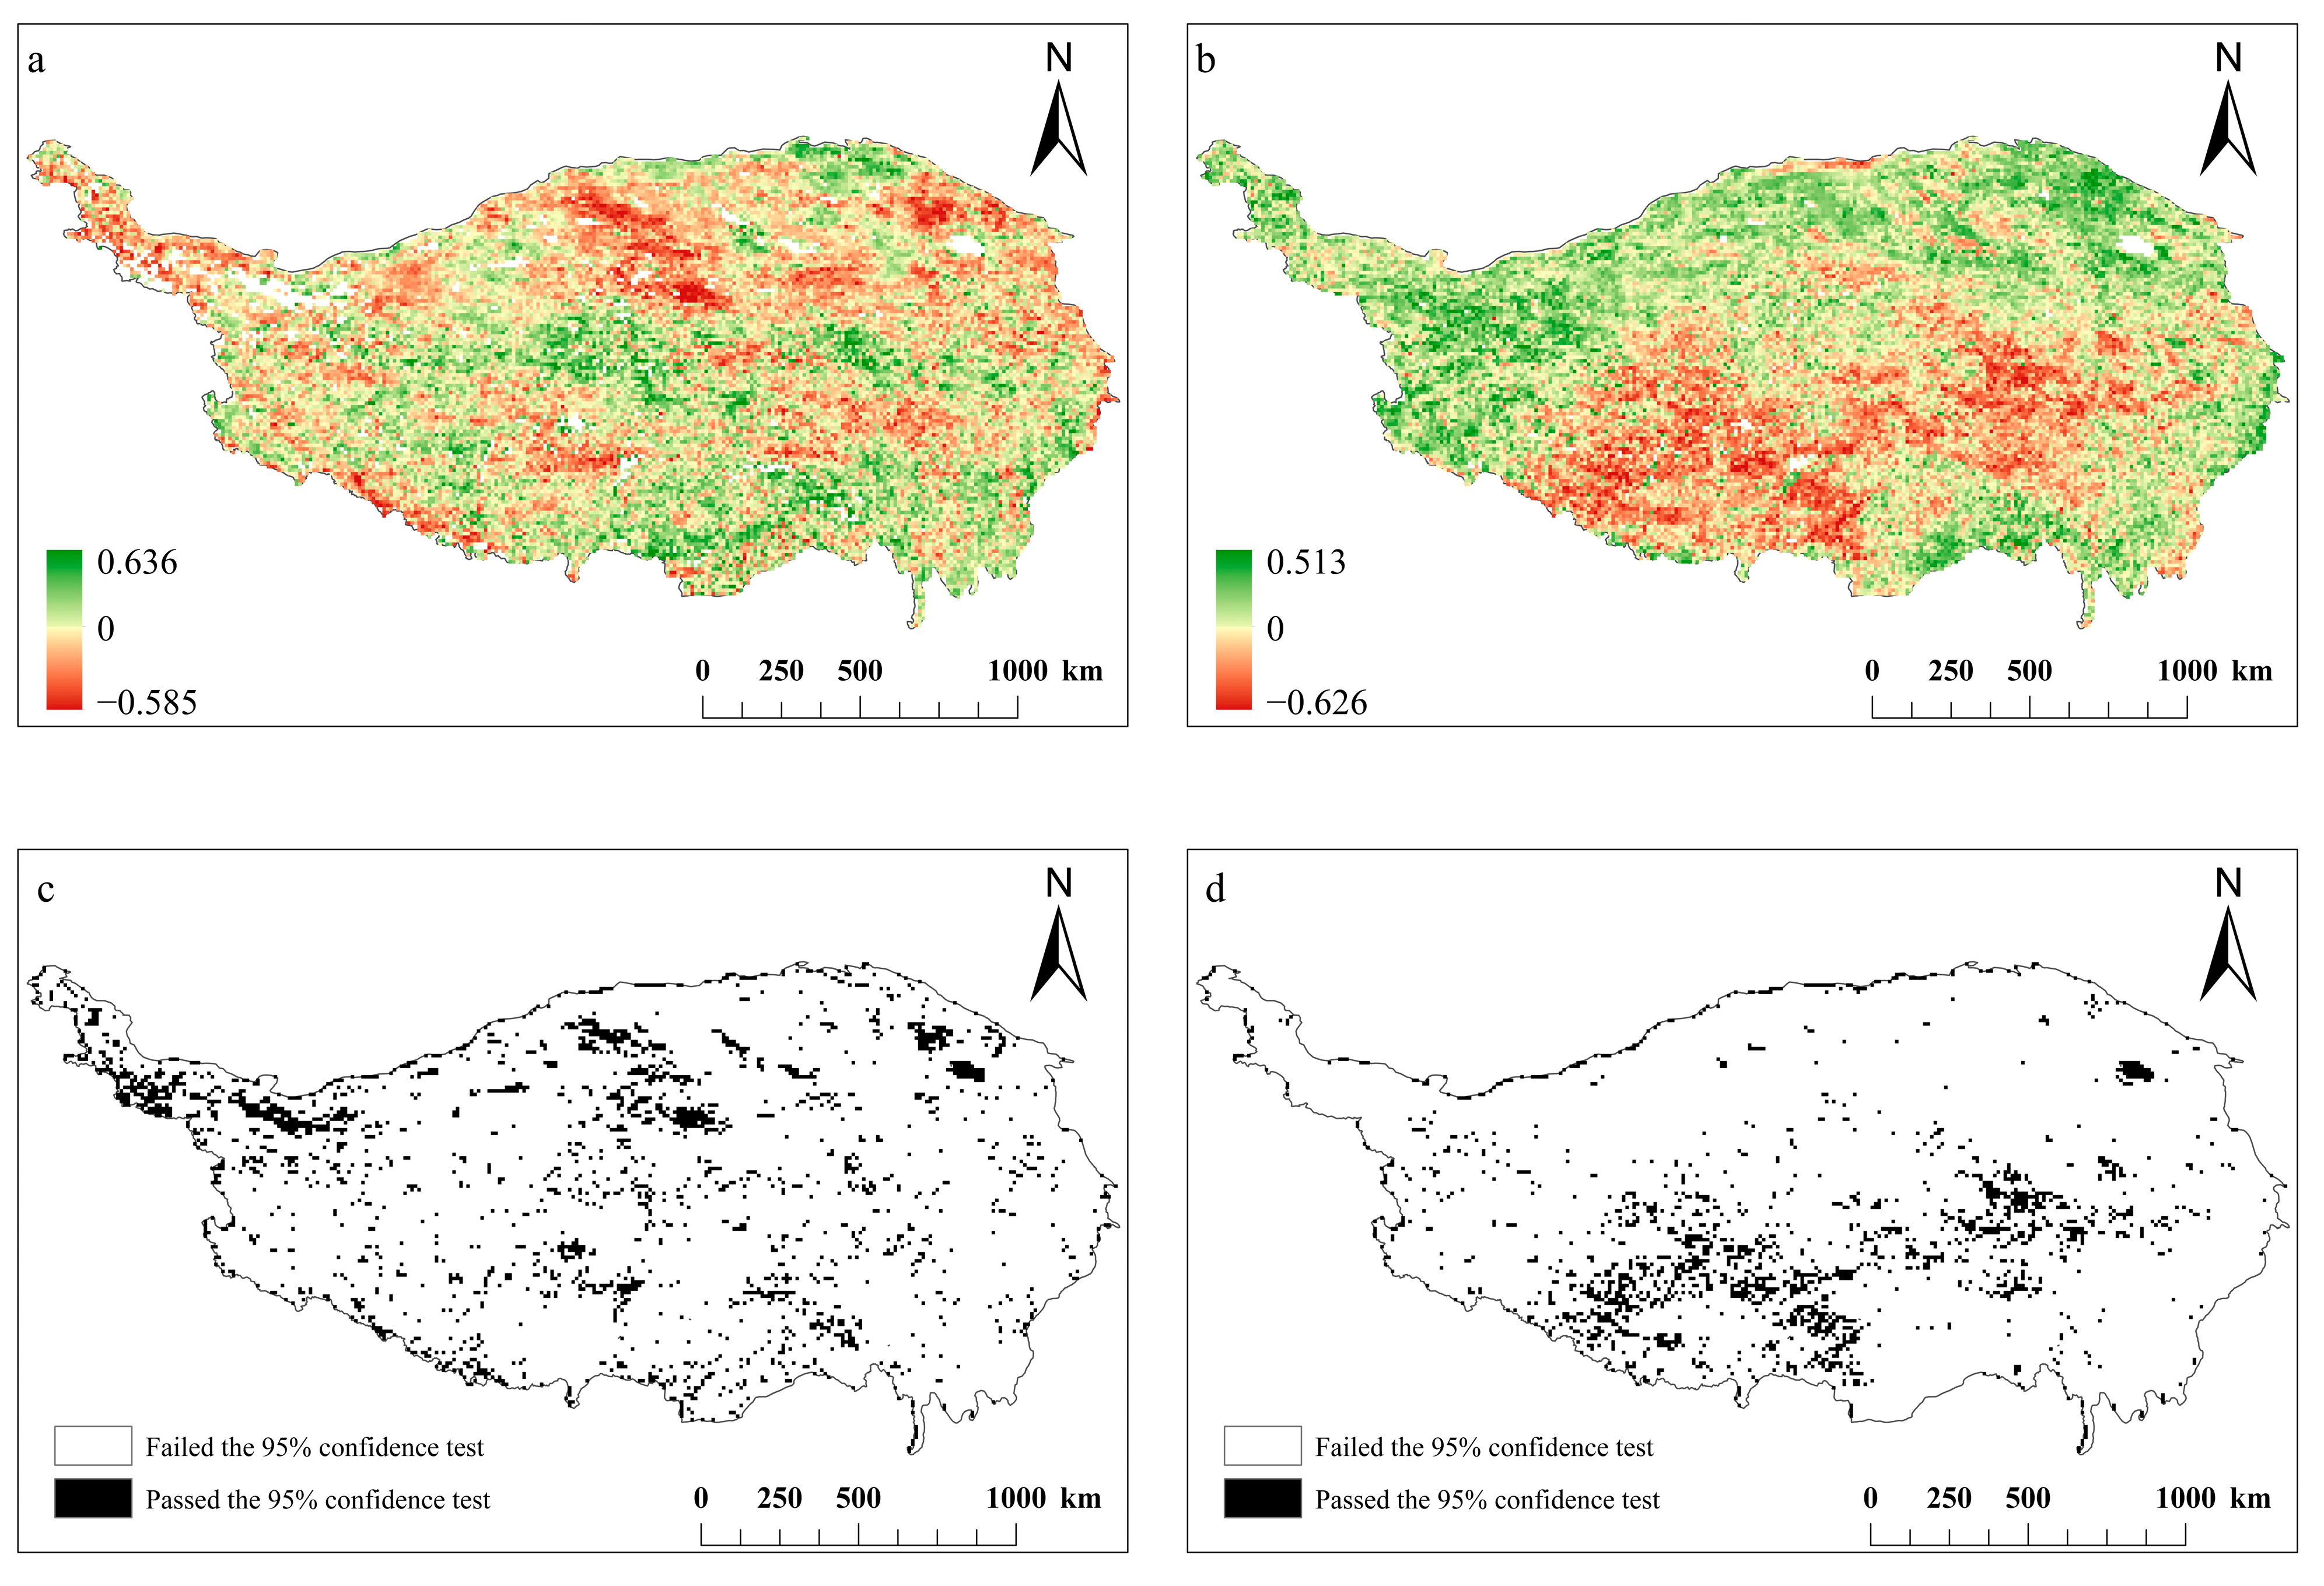
By analyzing the annual mean values of FAL, SSRD, and NDVI across the entire Tibetan Plateau, we observe that their correlation in the time series is not statistically significant. However, when examining the correlation map in conjunction with the spatial distribution patterns, it becomes evident that the correlation between FAL and NDVI, as well as SSRD and NDVI, is statistically significant across most regions of the Tibetan Plateau. This discrepancy highlights the distinction between global and local-scale analyses, emphasizing that measurement scale can substantially influence the interpretation of correlation patterns in data analysis, as demonstrated in Figure 9.
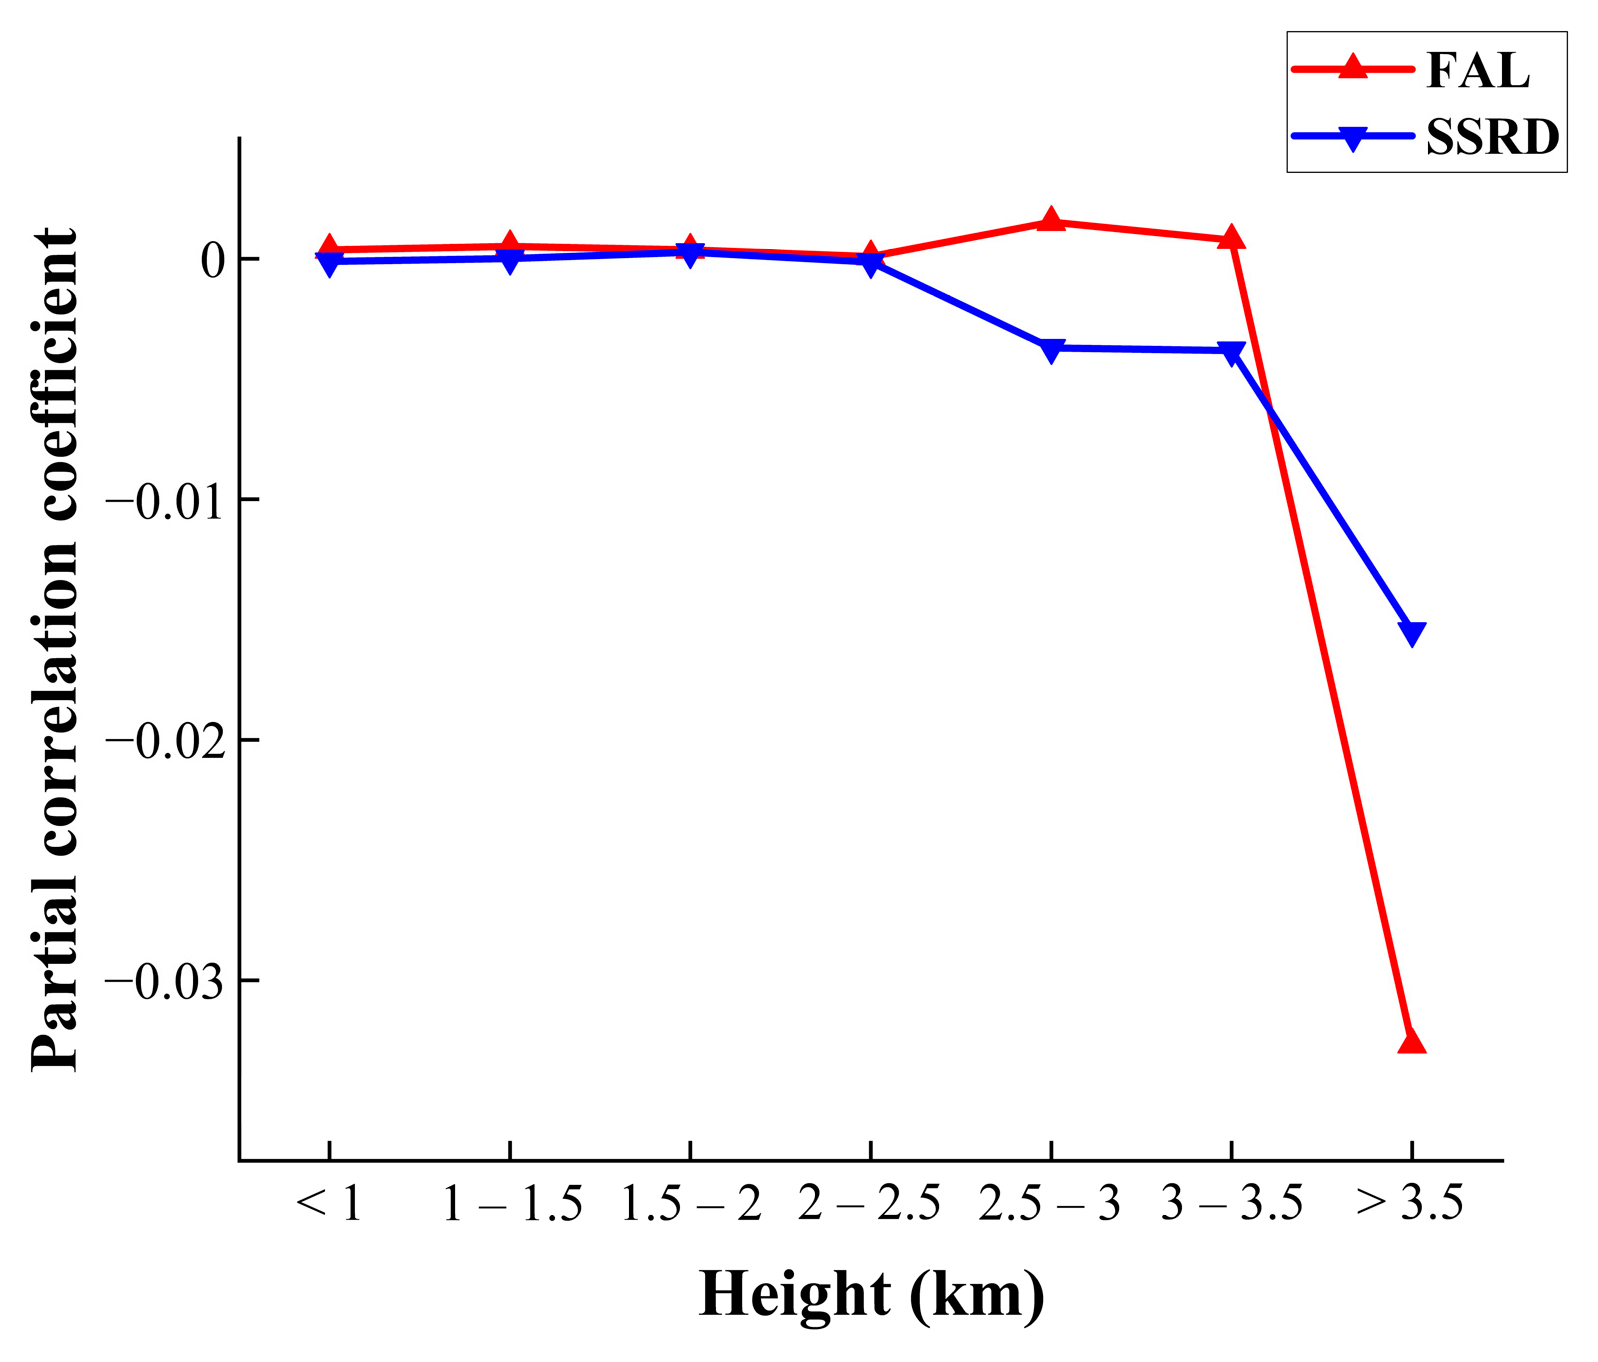
According to the study, the altitudinal range of the Tibetan Plateau from 1000 m to 3500 m was divided into 500 m intervals to form seven altitudinal zones. The local correlation coefficients of these zones were then calculated. The results showed that the correlation coefficients of FAL and SSRD with NDVI gradually decreased with increasing altitude, and the partial correlation coefficients of FAL with NDVI decreased by 0.035 × 10⁻¹, and that of SSRD with NDVI decreased by 0.021 × 10⁻¹ for every 500 m increase in altitude, changing from a weak positive correlation to a more obvious negative correlation. This decreasing trend is particularly evident above 3500 m, as demonstrated in Figure 10.
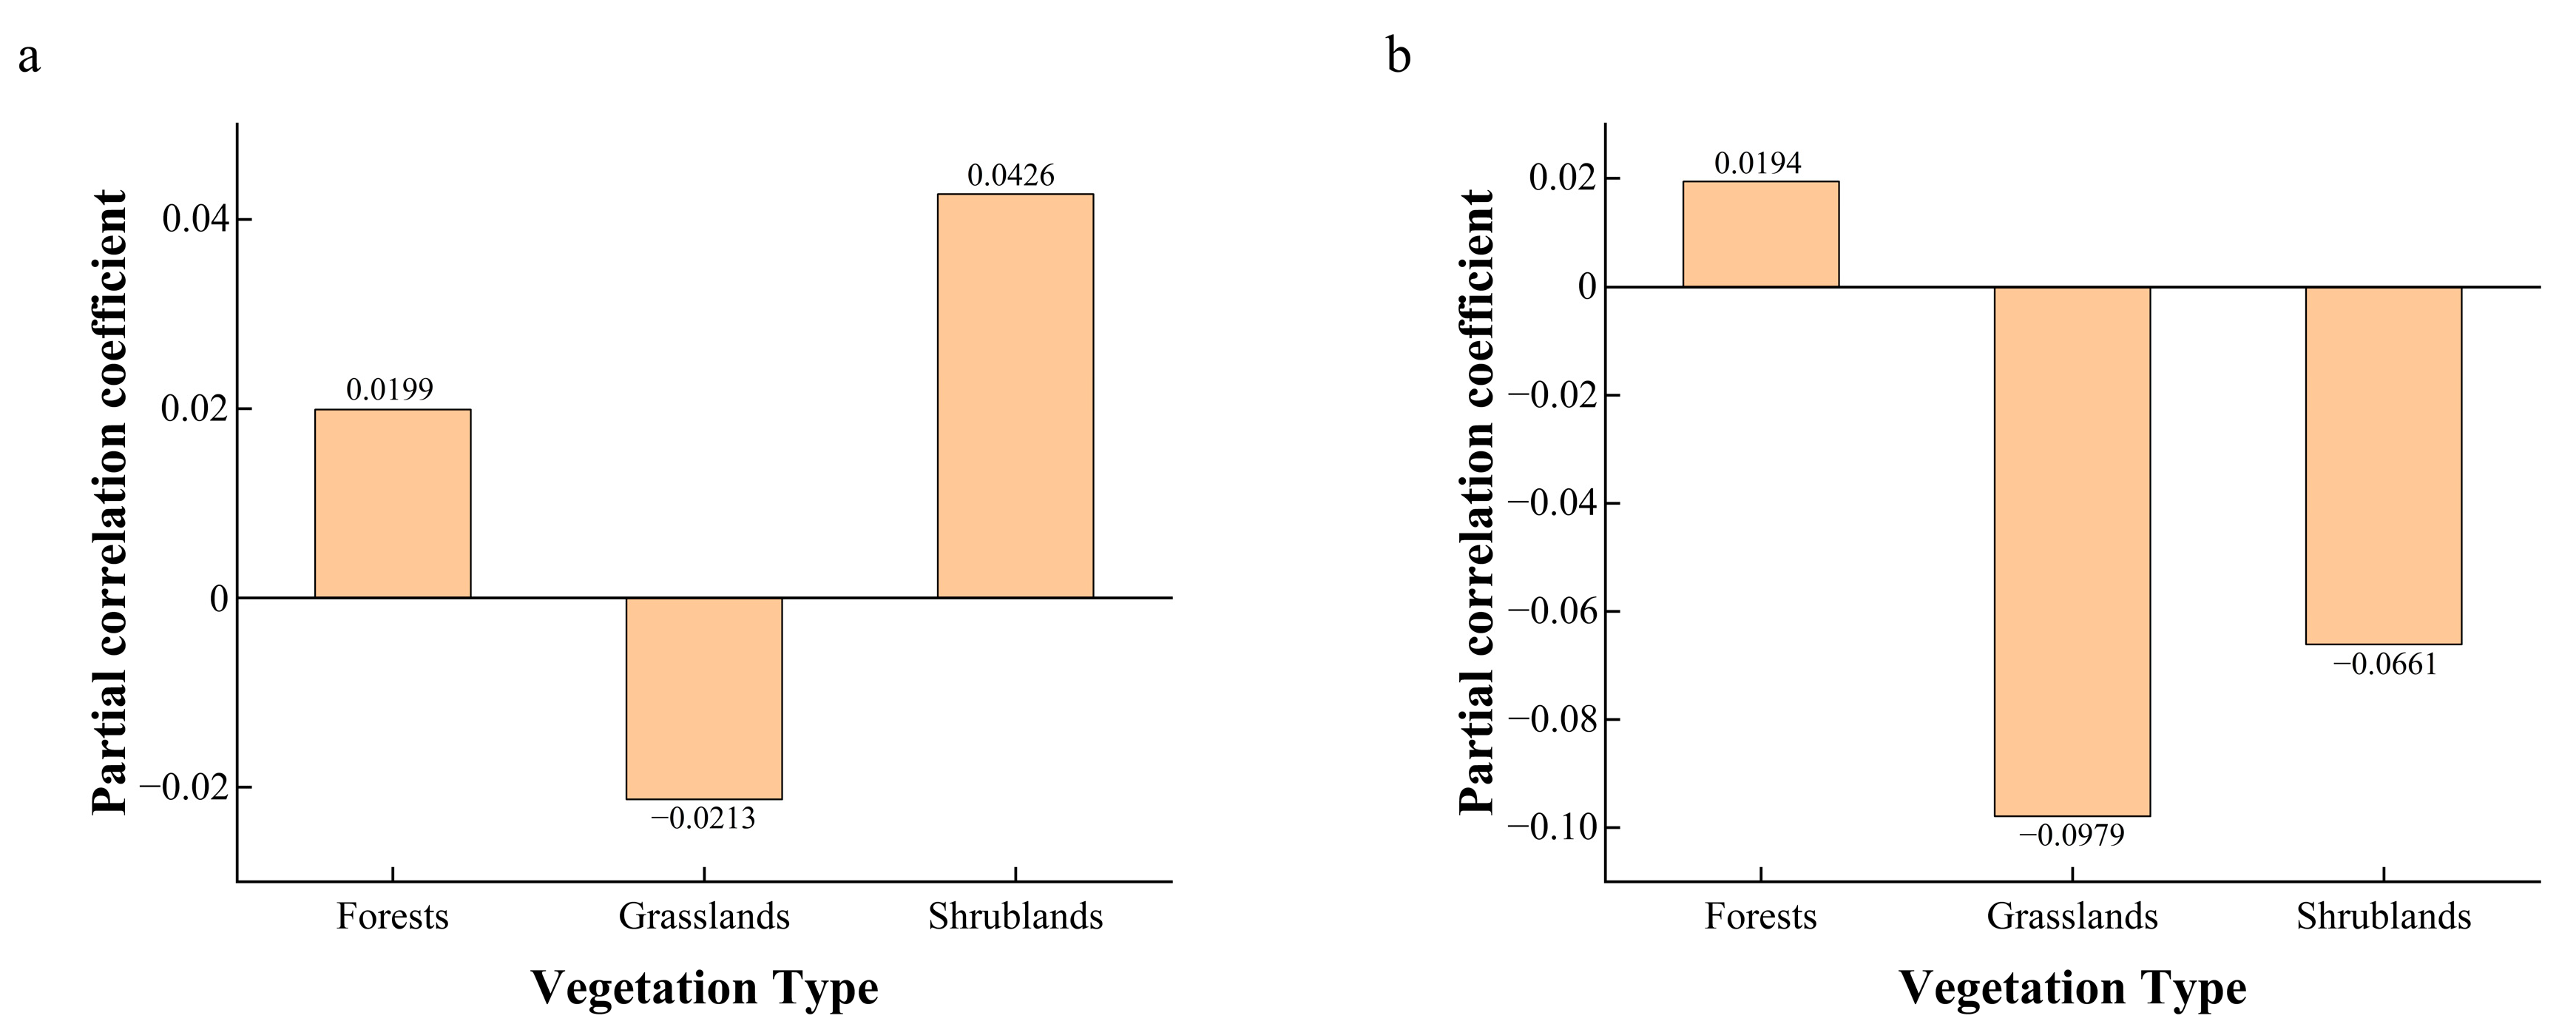
In this study, the vegetation of the Tibetan Plateau was categorized into three distinct types: forests, grasslands, and shrublands. The findings indicated that in the forest biome, both FAL and SSRD exhibited a modest positive correlation with NDVI. In grassland areas, FAL exhibited a weak negative correlation with NDVI, while SSRD demonstrated a more pronounced negative association with NDVI. In scrub areas, FAL exhibited a more significant positive correlation with NDVI, while SSRD demonstrated a more significant negative correlation with NDVI, as shown in Figure 11.
Overall, both FAL and SSRD exhibited a modest contribution to the fluctuations in NDVI within forested regions and a slight suppression in NDVI changes within grassland areas. However, in the context of scrub regions, FAL demonstrated a contributing effect, while SSRD exhibited a suppressive effect on NDVI.
After classifying the vegetation on the Tibetan Plateau into three types—forests, grasslands, and shrublands—the results revealed that forest areas accounted for 4.856%, grasslands for 54.938%, and shrublands areas for 0.148%. Overall, forests are primarily concentrated in the southeastern part of the Tibetan Plateau, grasslands cover most of the plateau, and shrublands are mostly concentrated in the western regions, with minimal coverage elsewhere.
Regarding the growing season NDVI-FAL partial correlation results, as shown in Figure 12, 56.224% of the forest areas showed a positive correlation between NDVI and FAL, while 43.776% exhibited a negative correlation. In grassland areas, 44.757% showed a positive correlation, and 55.243% showed a negative correlation. For shrubland areas, 67.568% demonstrated a positive correlation, and 32.432% showed a negative correlation.
In terms of the growing season NDVI-SSRD partial correlation results, 56.636% of the forest areas exhibited a positive correlation between NDVI and SSRD, while 43.364% displayed a negative correlation. In grassland areas, 27.735% showed a positive correlation, and 72.265% showed a negative correlation. For shrubland areas, 32.432% showed a positive correlation, and 67.568% exhibited a negative correlation, as shown in Figure 13.
Further analysis of the partial correlation results reveals that FAL dominates NDVI changes in 50.675% of the Tibetan Plateau, primarily concentrated in the central, southern, and southwestern regions. SSRD dominates NDVI changes in 49.325% of the region, with these areas scattered across the plateau, particularly concentrated in the northern regions, as demonstrated in Figure 14a.
The results indicate that the areas where both factors jointly promote NDVI changes account for 15.645% of the Tibetan Plateau. The areas where both factors jointly inhibit NDVI changes account for 33.271%, primarily concentrated in the central region. The areas where FAL promotes and SSRD inhibits NDVI changes account for 26.438%, adjacent to the regions where both factors jointly inhibit NDVI changes, mostly in the central area. Finally, the areas where FAL inhibits and SSRD promotes NDVI changes account for 24.645%, scattered across the plateau, mainly in the northwest, north, and northeast regions, as demonstrated in Figure 14b.

3.3. Change in NDVI and SRF on the Tibetan Plateau

To further investigate the influence of radiative factors on NDVI changes, an attribution analysis was conducted on the changes in NDVI and the radiative factors. SRF was calculated using the two radiative factors, and its correlation with NDVI changes was analyzed, along with the changes in SSRD, as shown in Table 6. The results showed a negative correlation between SRF and NDVI changes, as well as between SSRD changes and NDVI changes, in terms of temporal characteristics, as shown in Figure 15.
In terms of spatial patterns, as shown in Figure 16a, the areas where SRF and NDVI changes were positively correlated accounted for 52.881% of the Tibetan Plateau. These areas were mostly scattered, with some concentration in the central region of the plateau. The areas where SRF and NDVI changes were negatively correlated accounted for 47.119%, primarily concentrated in the northwest. For SSRD changes, as shown in Figure 16b, the areas where SSRD and NDVI changes were positively correlated accounted for 39.589% of the total area, dispersed across most parts of the plateau. Negative correlation areas accounted for 60.411%, with these regions highly concentrated in the southeastern part of the Tibetan Plateau.

4. Discussions

This study examines the trend changes in NDVI during the growing season on the Tibetan Plateau from 1982 to 2021, as well as the complex correlations between NDVI, FAL, and SSRD. In terms of temporal characteristics, NDVI exhibits a negative correlation with FAL. This could be due to the fact that as FAL increases, more SSRD is reflected off the surface, reducing the amount of photosynthetically active radiation absorbed by vegetation, thus limiting vegetation growth. On the other hand, the negative correlation between SSRD and NDVI suggests that a reduction in SSRD limits photosynthesis in vegetation, thereby inhibiting increases in NDVI.
The Tibetan Plateau’s weaker radiative effects on vegetation productivity compared to other regions in China stem from its high elevation leading to intense solar radiation, which, when combined with low temperatures, reduces photosystem efficiency and increases photoinhibition risks [52,53,54]; additionally, decreasing snowmelt negatively impacts light use efficiency by lowering air temperatures and solar radiation, while alpine plants have evolved photoprotective adaptations that, although protective, may limit maximum photosynthetic rates, collectively modulating the region’s photosynthetic response to radiative forcing [55,56].
The study by Tu et al. highlighted that changes in vegetation across China are influenced by precipitation, temperature, and radiation factors, and the Tibetan Plateau NDVI were negatively correlated with the radiation factor, while the Yunnan–Guizhou Plateau NDVI and the Loess Plateau NDVI were positively correlated with the radiation factor. Our study also shows the specific areas where FAL, SSRD, and SRF are negatively correlated with NDVI on the Tibetan Plateau [32]. This aligns with the findings of Chen et al. [57], which showed a positive correlation between vegetation NPP (Net Primary Productivity) and LST (Land Surface Temperature) on the Tibetan Plateau, suggesting that climate warming enhances vegetation growth. Our study builds on this by distinguishing between FAL and SSRD, thereby providing a more nuanced understanding of how radiation impacts vegetation dynamics.
The study by Zhang et al. explored the relationship between NDVI during the growing season and climate factors in northern China and surrounding areas, finding that increases in NDVI were associated with rising temperatures and higher precipitation. In contrast, our study shows that the correlation between NDVI, FAL, and SSRD on the Tibetan Plateau is not significant. This may be due to the unique climatic conditions and vegetation types in the region. The high altitude and cold climate of the Tibetan Plateau likely cause the influence of FAL and SSRD on NDVI to differ from that observed in northern China [58].
The interaction between human activities and radiative factors, such as solar radiation, plays a pivotal role in vegetation dynamics. In recent decades, the southeastern part of the Tibetan Plateau, including Lhasa, has undergone a substantial decrease in NDVI. This decline is attributed to human activities that have resulted in land degradation and the browning of vegetation. Research has demonstrated that the impact of road construction and maintenance on vegetation browning is more significant than that of urbanization itself [59].
In summary, the results of our study align with the existing literature to some extent, and also reveal the specific relationships between FAL as well as SSRD and NDVI on the Tibetan Plateau. These findings are critical for understanding how vegetation on the Tibetan Plateau responds to climate change and provide a scientific basis for future ecological protection and climate change adaptation strategies. Future research should explore the impacts of other climatic factors, such as temperature and precipitation, on NDVI, as well as the interactions between these factors and FAL as well as SSRD.

5. Conclusions

This study comprehensively analyzed the NDVI data during the growing season on the Tibetan Plateau from 1982 to 2021, alongside ERA5-Land reanalysis data, to explore the greening trend of NDVI and its relationship with FAL, SSRD, and SRF. The results show that NDVI during the growing season on the Tibetan Plateau exhibits a gradual increase, though this trend is not statistically significant. This suggests that vegetation cover may be increasing, but the change is relatively small. The spatial distribution of NDVI shows significant heterogeneity, decreasing from southeast to northwest.
Both FAL and SSRD exhibit declining trends during the growing season, and their correlation with NDVI is not significant. As elevation increases, the correlation coefficients between FAL, SSRD, and NDVI gradually decrease, revealing that radiation–vegetation feedbacks weaken with altitude elevation (−0.035 × 10⁻¹ per 500 m for FAL-NDVI and 0.021 × 10⁻¹ per 500 m for SSRD-NDVI). This suggests that vegetation responses to radiative changes become more complex at higher elevations. Different vegetation types, including forests, grasslands, and shrublands, exhibit distinct responses to FAL and SSRD. Specifically, shrublands are most affected by FAL, whereas forests show the weakest response to FAL. In contrast, grasslands are most influenced by SSRD, while forests exhibit the lowest sensitivity to SSRD. This understanding is crucial for prioritizing vegetation conservation efforts in alpine ecosystems worldwide. The correlation between SRF and NDVI changes was not significant, suggesting that SRF cannot explain the major changes in NDVI on the Tibetan Plateau. The lack of a significant correlation between SRF and NDVI (p > 0.05) implies that radiative forcing alone is not a dominant driver of vegetation greening. Instead, the synergistic effects of temperature rise and cryospheric melting may overshadow SRF’s role.
Overall, the response of NDVI to FAL, SSRD, and SRF on the Tibetan Plateau is complex and influenced by multiple environmental factors. This study provides valuable insights into how alpine vegetation responds to climate change, offering a scientific foundation for developing appropriate ecological conservation strategies. Additionally, it contributes to radiation–vegetation feedback modeling in other mountainous regions, such as the Alps, the Andes, and the Rockies. Future research should further investigate the effects of other climatic factors, such as temperature and precipitation, and explore their interactions with FAL and SSRD to gain a more comprehensive understanding of the mechanisms driving vegetation changes on the Tibetan Plateau.

Author Contributions

Conceptualization, Junshan Guo and Yao Shen; data curation, Junshan Guo, Han Yang, and Yao Shen; formal analysis, Junshan Guo and Yao Shen; funding acquisition, Yao Shen; investigation, Junshan Guo and Yao Shen; methodology, Junshan Guo, Kai Wu, and Yao Shen; project administration, Yao Shen; resources, Junshan Guo and Yao Shen; supervision, Yao Shen; validation, Junshan Guo and Yao Shen; visualization, Junshan Guo and Yao Shen; Writing—original draft, Junshan Guo and Yao Shen; writing—review and editing, Junshan Guo and Yao Shen. All authors have read and agreed to the published version of the manuscript.

Funding

This research was jointly funded by the National Natural Science Foundation of China, grant number 42361053; the Hainan Provincial Natural Science Foundation of China, grant number 422RC598; and start-up fund of Hainan University, grant number KYQD(ZR)22081.

Data Availability Statement

Data is contained within the article.

Conflicts of Interest

The authors declare no conflicts of interest.

References

  1. Fang, J.; Yu, G.; Liu, L.; Hu, S.; Chapin, F.S. Climate Change, Human Impacts, and Carbon Sequestration in China. Proc. Natl. Acad. Sci. USA 2018, 115, 4015–4020. [Google Scholar] [CrossRef] [PubMed]
  2. Ferrini, F.; Fini, A.; Mori, J.; Gori, A. Role of Vegetation as a Mitigating Factor in the Urban Context. Sustainability 2020, 12, 4247. [Google Scholar] [CrossRef]
  3. Chaudhry, S.; Sidhu, G.P.S. Climate Change Regulated Abiotic Stress Mechanisms in Plants: A Comprehensive Review. Plant Cell Rep. 2022, 41, 1–31. [Google Scholar] [CrossRef] [PubMed]
  4. Zhou, Z.; Ding, Y.; Shi, H.; Cai, H.; Fu, Q.; Liu, S.; Li, T. Analysis and Prediction of Vegetation Dynamic Changes in China: Past, Present and Future. Ecol. Indic. 2020, 117, 106642. [Google Scholar] [CrossRef]
  5. Lindén, J.; Gustafsson, M.; Uddling, J.; Watne, Å.; Pleijel, H. Air Pollution Removal through Deposition on Urban Vegetation: The Importance of Vegetation Characteristics. Urban For. Urban Green. 2023, 81, 127843. [Google Scholar] [CrossRef]
  6. Kambezidis, H.D.; Kaskaoutis, D.G.; Kalliampakos, G.K.; Rashki, A.; Wild, M. The Solar Dimming/Brightening Effect over the Mediterranean Basin in the Period 1979–2012. J. Atmos. Sol.-Terr. Phys. 2016, 150–151, 31–46. [Google Scholar] [CrossRef]
  7. Kang, S.; Xu, Y.; You, Q.; Flügel, W.-A.; Pepin, N.; Yao, T. Review of Climate and Cryospheric Change in the Tibetan Plateau. Environ. Res. Lett. 2010, 5, 015101. [Google Scholar] [CrossRef]
  8. Yao, T.; Xue, Y.; Chen, D.; Chen, F.; Thompson, L.; Cui, P.; Koike, T.; Lau, W.K.-M.; Lettenmaier, D.; Mosbrugger, V.; et al. Recent Third Pole’s Rapid Warming Accompanies Cryospheric Melt and Water Cycle Intensification and Interactions between Monsoon and Environment: Multidisciplinary Approach with Observations, Modeling, and Analysis. Bull. Am. Meteorol. Soc. 2019, 100, 423–444. [Google Scholar] [CrossRef]
  9. Wang, Z.; Li, Z.; Dong, S.; Fu, M.; Li, Y.; Li, S.; Wu, S.; Ma, C.; Ma, T.; Cao, Y. Evolution of ecological patterns and its driving factors on Qinghai-Tibet Plateau over the past 40 years. Acta Ecol. Sin. 2022, 42, 8941–8952. (In Chinese) [Google Scholar] [CrossRef]
  10. Wang, Z.; Wu, J.; Niu, B.; He, Y.; Zu, J.; Li, M.; Zhang, X. Vegetation Expansion on the Tibetan Plateau and Its Relationship with Climate Change. Remote Sens. 2020, 12, 4150. [Google Scholar] [CrossRef]
  11. Liu, Z.; Zhang, J.; Chen, L. Effects of vegetation degradation on atmospheric circulation over the Tibetan Plateau and its surrounding areas. Acta Ecol. Sin. 2018, 38, 132–142. (In Chinese) [Google Scholar] [CrossRef]
  12. Wang, T.; Zhao, Y.; Wang, H. Spatial and temporal changes of vegetation index and their response to temperature and precipitation in the Tibetan Plateau based on GIMMS NDVI. J. Glaciol. Geocryol. 2020, 42, 641–652. (In Chinese) [Google Scholar] [CrossRef]
  13. Zhong, L.; Ma, Y.; Xue, Y.; Piao, S. Climate Change Trends and Impacts on Vegetation Greening Over the Tibetan Plateau. J. Geophys. Res. Atmos. 2019, 124, 7540–7552. [Google Scholar] [CrossRef]
  14. Wang, C.; Wang, J.; Cui, X.; Wei, Y.; Sun, J.; Naudiyal, N.; Du, W.; Chen, Q. Spatio-temporal change in vegetation patterns and its climatic drivers in the core region of Three Parallel Rivers in southeast Tibet. Geogr. Res. 2021, 40, 3191–3207. (In Chinese) [Google Scholar] [CrossRef]
  15. Zhuo, G.; Chen, S.; Zhou, B. Spatio-Temporal Variation of Vegetation Coverage over the Tibetan Plateau and Its Responses to Climatic Factors. Acta Ecol. Sin. 2018, 38, 3208–3218. [Google Scholar] [CrossRef]
  16. Li, H.; Zhang, C.; Wang, S.; Ma, W.; Liu, F.; Chen, Q.; Zhou, Q.; Xia, X.; Niu, B. Response of vegetation dynamics to hydrothermal conditions on the Qinghai-Tibet Plateau in the last 40 years. Acta Ecol. Sin. 2022, 42, 4770–4783. (In Chinese) [Google Scholar] [CrossRef]
  17. Yang, D.; Yi, G.; Zhang, Y.; Li, J.; Qin, Y.; Wen, B.; Liu, Z. Spatiotemporal variation and driving factors of growing season NDVI in the Tibetan Plateau, China. Chin. J. Appl. Ecol. 2021, 32, 1361–1372. (In Chinese) [Google Scholar] [CrossRef]
  18. Yang, L.; Liu, L.; Sun, S. The Dominated Environmental Factors of Vegetation Change on the Qinghai-Tibet Plateau from 1982 to 2015. Acta Ecol. Sin. 2023, 43, 744–755. [Google Scholar] [CrossRef]
  19. Yao, T.; Wu, G.; Xu, B.; Wang, W.; Gao, J.; An, B. Asian Water Tower Change and Its Impacts. Bull. Chin. Acad. Sci. 2019, 34, 1203–1209. (In Chinese) [Google Scholar] [CrossRef]
  20. Wang, N.; Yao, T.; Xu, B.; Chen, A.; Wang, W. Spatiotemporal Pattern, Trend, and Influence of Glacier Change in Tibetan Plateau and Surroundings under Global Warming. Bull. Chin. Acad. Sci. 2019, 34, 1220–1232. [Google Scholar] [CrossRef]
  21. Losapio, G.; Cerabolini, B.E.L.; Maffioletti, C.; Tampucci, D.; Gobbi, M.; Caccianiga, M. The Consequences of Glacier Retreat Are Uneven Between Plant Species. Front. Ecol. Evol. 2021, 8, 616562. [Google Scholar] [CrossRef]
  22. Charles, C.; Khelidj, N.; Mottet, L.; Tu, B.N.; Adatte, T.; Bomou, B.; Faria, M.; Monbaron, L.; Reubi, O.; de Vere, N.; et al. Plant–Soil Interactions Underline the Development of Novel Ecosystems after Glacier Retreat. EGUsphere 2024, 2024, 1–24. [Google Scholar] [CrossRef]
  23. Tu, B.N.; Khelidj, N.; Cerretti, P.; De Vere, N.; Ferrari, A.; Paone, F.; Polidori, C.; Schmid, J.; Sommaggio, D.; Losapio, G. Glacier Retreat Triggers Changes in Biodiversity and Plant–Pollinator Interaction Diversity. Alp. Bot. 2024, 134, 171–182. [Google Scholar] [CrossRef] [PubMed]
  24. Zhao, F.; Gong, W.; Bianchini, S.; Yang, Z. Linking Glacier Retreat with Climate Change on the Tibetan Plateau through Satellite Remote Sensing. EGUsphere 2024, 2024, 1–26. [Google Scholar] [CrossRef]
  25. Liu, J.; Xu, X.; Shao, Q. Grassland Degradation in the “Three-River Headwaters” Region, Qinghai Province. J. Geogr. Sci. 2008, 18, 259–273. [Google Scholar] [CrossRef]
  26. Zhang, Y.; Liu, L.; Wang, Z.; Bai, W.; Ding, M.; Wang, X.; Yan, J.; Xu, E.; Wu, X.; Zhang, B.; et al. Spatial and Temporal Characteristics of Land Use and Cover Changes in the Tibetan Plateau. Chin. Sci. Bull. 2019, 64, 2865–2875. [Google Scholar] [CrossRef]
  27. Yang, Z.; Jiang, L.; Xu, Y.; Zhan, W.; Zhu, E.; Chen, H. Responses of vegetation and soil of alpine meadows on the Qinghai-Tibet Plateau to short-term grazing prohibition. Acta Ecol. Sin. 2017, 37, 7903–7911. (In Chinese) [Google Scholar] [CrossRef]
  28. Planque, C.; Carrer, D.; Roujean, J.-L. Analysis of MODIS Albedo Changes over Steady Woody Covers in France during the Period of 2001–2013. Remote Sens. Environ. 2017, 191, 13–29. [Google Scholar] [CrossRef]
  29. Zheng, L.; Qi, Y.; Qin, Z.; Xu, X.; Dong, J. Assessing Albedo Dynamics and Its Environmental Controls of Grasslands over the Tibetan Plateau. Agric. For. Meteorol. 2021, 307, 108479. [Google Scholar] [CrossRef]
  30. Hasler, N.; Williams, C.A.; Denney, V.C.; Ellis, P.W.; Shrestha, S.; Terasaki Hart, D.E.; Wolff, N.H.; Yeo, S.; Crowther, T.W.; Werden, L.K.; et al. Accounting for Albedo Change to Identify Climate-Positive Tree Cover Restoration. Nat. Commun. 2024, 15, 2275. [Google Scholar] [CrossRef]
  31. Zheng, L.; Zhao, G.; Dong, J.; Ge, Q.; Tao, J.; Zhang, X.; Qi, Y.; Doughty, R.B.; Xiao, X. Spatial, Temporal, and Spectral Variations in Albedo Due to Vegetation Changes in China’s Grasslands. ISPRS J. Photogramm. Remote Sens. 2019, 152, 1–12. [Google Scholar] [CrossRef]
  32. Tu, Y.; Jiang, L.; Liu, R.; Xiao, Z.; Min, J. Spatiotemporal changes of vegetation NDVI and its driving forces in China during 1982-2015. Trans. Chin. Soc. Agric. Eng. 2021, 37, 75–84. (In Chinese) [Google Scholar] [CrossRef]
  33. Hao, A.; Xue, X.; Duan, H.; Peng, F.; You, Q. Different Spatiotemporal Variations in Seasonal NDVI and Their Climatic Driving Forces of a Typical Grassland on the Qinghai-Tibetan Plateau. Acta Ecol. Sin. 2023, 43, 352–363. [Google Scholar] [CrossRef]
  34. Zhu, Q.; Chen, J.; Wu, L.; Huang, Y.; Shao, C.; Dong, G.; Xu, Z.; Li, X. Changes in Albedo and Its Radiative Forcing of Grasslands in East Asia Drylands. Ecol. Process. 2024, 13, 17. [Google Scholar] [CrossRef]
  35. Feng, H.; Ye, S.; Zou, B. Contribution of Vegetation Change to the Surface Radiation Budget: A Satellite Perspective. Glob. Planet. Chang. 2020, 192, 103225. [Google Scholar] [CrossRef]
  36. Tang, X.; Cui, Y.; Li, N.; Fu, Y.; Liu, X.; Run, Y.; Li, M.; Zhao, G.; Dong, J. Human Activities Enhance Radiation Forcing through Surface Albedo Associated with Vegetation in Beijing. Remote Sens. 2020, 12, 837. [Google Scholar] [CrossRef]
  37. Yang, K.; Wu, H.; Qin, J.; Lin, C.; Tang, W.; Chen, Y. Recent Climate Changes over the Tibetan Plateau and Their Impacts on Energy and Water Cycle: A Review. Glob. Planet. Chang. 2014, 112, 79–91. [Google Scholar] [CrossRef]
  38. Immerzeel, W.W.; van Beek, L.P.H.; Bierkens, M.F.P. Climate Change Will Affect the Asian Water Towers. Science 2010, 328, 1382–1385. [Google Scholar] [CrossRef]
  39. Yao, T.; Wang, W.; Yang, W.; Zhang, G.; Shi, J.; Wu, G.; Gao, J.; Che, T.; Liu, S.; Walter, I.; et al. Imbalance of the Asian Water Tower characterized by glacier and snow melt. Clim. Chang. Res. 2024, 20, 689–698. (In Chinese) [Google Scholar] [CrossRef]
  40. Duan, H.; Xue, X.; Wang, T.; Kang, W.; Liao, J.; Liu, S. Spatial and Temporal Differences in Alpine Meadow, Alpine Steppe and All Vegetation of the Qinghai-Tibetan Plateau and Their Responses to Climate Change. Remote Sens. 2021, 13, 669. [Google Scholar] [CrossRef]
  41. Zhang, H.; Zhu, W.; Shi, P.; Zhao, C.; Liu, R.; Tang, H.; Wang, J.; He, B. The differences of vegetation characteristics and environmental conditions among main vegetation types on the Qinghai-Tibet Plateau. Acta Ecol. Sin. 2024, 44, 2955–2970. (In Chinese) [Google Scholar] [CrossRef]
  42. Cheng, W.; Zhou, C.; Chai, H.; Zhao, S.; LI, B. Quantitative Extraction and Analysis of Basic Morphological Types of Land Geomorphology in China: Quantitative Extraction and Analysis of Basic Morphological Types of Land Geomorphology in China. Geo-Inf. Sci. 2010, 11, 725–736. [Google Scholar] [CrossRef]
  43. Guo, D.; Yu, E.; Wang, H. Will the Tibetan Plateau Warming Depend on Elevation in the Future? J. Geophys. Res. Atmos. 2016, 121, 3969–3978. [Google Scholar] [CrossRef]
  44. Hu, W.; Yao, J.; He, Q.; Chen, J. Elevation-Dependent Trends in Precipitation Observed over and around the Tibetan Plateau from 1971 to 2017. Water 2021, 13, 2848. [Google Scholar] [CrossRef]
  45. Tang, R.; Zhao, X.; Tang, B.; Wei, H.; Chen, J.; Peng, Y. Influence of urbanization on radiative forcing in Beijing. J. Beijing Norm. Univ. Sci. 2017, 53, 443–450+376. (In Chinese) [Google Scholar] [CrossRef]
  46. Sen, P.K. Estimates of the Regression Coefficient Based on Kendall’s Tau. J. Am. Stat. Assoc. 1968, 63, 1379–1389. [Google Scholar] [CrossRef]
  47. Mann, H.B. Nonparametric Tests Against Trend. Econometrica 1945, 13, 245–259. [Google Scholar] [CrossRef]
  48. Kendall, M.G. Rank Correlation Methods; Griffin: Oxford, UK, 1948. [Google Scholar]
  49. Hamed, K.H.; Ramachandra Rao, A. A Modified Mann-Kendall Trend Test for Autocorrelated Data. J. Hydrol. 1998, 204, 182–196. [Google Scholar] [CrossRef]
  50. Ronald Eastman, J.; Sangermano, F.; Ghimire, B.; Zhu, H.; Chen, H.; Neeti, N.; Cai, Y.; Machado, E.A.; Crema, S.C. Seasonal Trend Analysis of Image Time Series. Int. J. Remote Sens. 2009, 30, 2721–2726. [Google Scholar] [CrossRef]
  51. Yang, H.; Wu, K.; Chen, J.; Zhong, C.; Hu, Z. Spatiotemporal Variability and Climatic Drivers of Net Primary Productivity on Hainan Island during 2000–2018. Remote Sens. Inf. 2024, 39, 164–172. (In Chinese) [Google Scholar] [CrossRef]
  52. Li, J.; Sun, Z.; Liu, Y.; You, Q.; Chen, G.; Bao, Q. Top-of-Atmosphere Radiation Budget and Cloud Radiative Effects Over the Tibetan Plateau and Adjacent Monsoon Regions from CMIP6 Simulations. J. Geophys. Res. Atmos. 2021, 126, e2020JD034345. [Google Scholar] [CrossRef]
  53. Wei, J.; Li, X.; Liu, L.; Christensen, T.R.; Jiang, Z.; Ma, Y.; Wu, X.; Yao, H.; López-Blanco, E. Radiation, Soil Water Content, and Temperature Effects on Carbon Cycling in an Alpine Swamp Meadow of the Northeastern Qinghai–Tibetan Plateau. Biogeosciences 2022, 19, 861–875. [Google Scholar] [CrossRef]
  54. Shi, S.; Shi, R.; Zhou, D.; Li, T.; De, K.; Gao, X.; Ma, J.; Wang, F. Reduction of PSII Photosynthetic Performance by Low Temperature Is the Reason for the Growing Inhibition of Kobresia Pygmaea Clarke. Braz. J. Bot. 2023, 46, 527–539. [Google Scholar] [CrossRef]
  55. Gong, J.; Zhang, Z.; Zhang, C.; Zhang, J.; Ran, A. Ecophysiological Responses of Three Tree Species to a High-Altitude Environment in the Southeastern Tibetan Plateau. Forests 2018, 9, 48. (In Chinese) [Google Scholar] [CrossRef]
  56. Wang, X.; Wang, G.; Song, C.; Sun, J.; Lin, S.; Wang, Y.; Sun, X. Snowmelt Decreases Light Use Efficiency in Qinghai-Tibetan Plateau between 2000 and 2017. J. Environ. Manag. 2025, 373, 123469. [Google Scholar] [CrossRef]
  57. Chen, S.; Guo, B.; Yang, F.; Han, B.; Fan, Y.; Yang, X.; He, T.; Liu, Y.; Yang, W. Spatial and Temporal Patterns of NPP and Its Response to Climate Change in the Qinghai-Tibet Plateau from 2000 to 2015. J. Nat. Resour. 2020, 35, 2511–2527. [Google Scholar] [CrossRef]
  58. Zhang, X.; Feng, Y.; Zeng, H.; Tang, Z. Change of NDVI during Growing Season and Its Relationship with Climate in North China and the Adjacent Areas from 1982 to 2014. Acta Sci. Nat. Univ. Pekin. 2021, 57, 153. (In Chinese) [Google Scholar] [CrossRef]
  59. Li, H.; Li, Y.; Gao, Y.; Zou, C.; Yan, S.; Gao, J. Human Impact on Vegetation Dynamics around Lhasa, Southern Tibetan Plateau, China. Sustainability 2016, 8, 1146. [Google Scholar] [CrossRef]
Figure 1. (a) The elevation of the Tibetan Plateau (from GMTED2010). (b) Land cover types of the Tibetan Plateau (from MODIS).
Ijgi 14 00228 g001
Figure 2. The altitude zones of the Tibetan Plateau.
Ijgi 14 00228 g002
Figure 3. Experimental procedures.
Ijgi 14 00228 g003
Figure 4. Interannual variations in NDVI during the growing season on the Tibetan Plateau from 1982 to 2021.
Ijgi 14 00228 g004
Figure 5. Spatial distribution of NDVI during the growing season on the Tibetan Plateau from 1982 to 2021.
Ijgi 14 00228 g005
Figure 6. (a). NDVI trend during the growing season on the Tibetan Plateau from 1982 to 2021. (b). Statistical significance of NDVI trends during the growing season on the Tibetan Plateau from 1982 to 2021.
Ijgi 14 00228 g006
Figure 7. (a). Interannual variations in FAL during the growing season on the Tibetan Plateau from 1982 to 2021. (b). Interannual variations in SSRD during the growing season on the Tibetan Plateau from 1982 to 2021.
Ijgi 14 00228 g007
Figure 8. (a). Correlation coefficient between FAL and NDVI temporal trends during the growing season on the Tibetan Plateau. (b). Correlation coefficient between SSRD and NDVI temporal trends during the growing season on the Tibetan Plateau.
Ijgi 14 00228 g008
Figure 9. (a). Correlation coefficient between FAL and NDVI temporal trends during the growing season on the Tibetan Plateau. (b). Correlation coefficient between SSRD and NDVI temporal trends during the growing season on the Tibetan Plateau. (c). Correlation coefficient between FAL and NDVI that passed the 90% confidence test. (d). Correlation coefficient between SSRD and NDVI that passed the 90% confidence test.
Ijgi 14 00228 g009
Figure 10. Partial correlation coefficients of FAL-NDVI and SSRD-NDVI by elevation.
Ijgi 14 00228 g010
Figure 11. (a). Partial correlation coefficients of FAL-NDVI by vegetation type. (b). Partial correlation coefficients of SSRD-NDVI by vegetation type.
Ijgi 14 00228 g011
Figure 12. (a). Spatial pattern of partial correlation between FAL and NDVI in forests. (b). Spatial pattern of partial correlation between FAL and NDVI in grasslands. (c). Spatial pattern of partial correlation between FAL and NDVI in shrublands.
Ijgi 14 00228 g012
Figure 13. (a). Spatial pattern of partial correlation between SSRD and NDVI in forests. (b). Spatial pattern of partial correlation between SSRD and NDVI in grasslands. (c). Spatial pattern of partial correlation between SSRD and NDVI in shrublands.
Ijgi 14 00228 g013
Figure 14. (a). Dominant influence of FAL and SSRD on NDVI. (b). Detailed analysis of the effects of FAL and SSRD on NDVI.
Ijgi 14 00228 g014
Figure 15. (a). Correlation coefficient of SRF-ΔNDVI temporal characteristics during the growing season on the Tibetan Plateau. (b). Correlation coefficient of ΔSSRD-ΔNDVI temporal characteristics during the growing season on the Tibetan Plateau.
Ijgi 14 00228 g015
Figure 16. (a). Spatial partial correlation coefficient between SRF and ΔNDVI during the growing season on the Tibetan Plateau. (b). Spatial partial correlation coefficient between ΔSSRD and ΔNDVI during the growing season on the Tibetan Plateau.
Ijgi 14 00228 g016
Table 1. Research dataset.
NameData SourcesWeb AddressSpatial ResolutionTime Resolution
Normalized Difference Vegetation Index (NDVI)AVHRR GIMMS-3G+https://daac.ornl.gov/ (accessed on 12 October 2024)0.08° × 0.08°15 d
Forecast Albedo (FAL)ERA5-Landhttps://cds.climate.copernicus.eu/ (accessed on 12 October 2024)0.09° × 0.09°monthly
Surface Solar Radiation Downwards (SSRD)ERA5-Landhttps://cds.climate.copernicus.eu/ (accessed on 12 October 2024)0.09° × 0.09°monthly
Elevation (DEM)GMTED2010https://www.usgs.gov/ (accessed on 12 October 2024)30 arc-secondsyearly
Land CoverMODIShttps://svs.gsfc.nasa.gov/ (accessed on 12 October 2024)500 myearly
Table 2. Linear fitting of NDVI (unitless).
TimeLinear Regression EquationR2PCCp-Value
1982–2021 y = 7.864   ×   10 5 x + 0.272 0.0170.1310.420
1982–2013 y = 3.141   ×   10 4 x + 0.269 0.1720.4150.018
2013–2021 y = 9.045   ×   10 4 x + 0.277 0.081−0.2860.455
Table 3. Linear fitting of FAL (unitless).
TimeLinear Regression EquationR2PCCp-Value
1982–2021 y =   2.226   ×   10 4 x + 0.249 0.162−0.4020.010
1982–2014 y =   2.603   ×   10 4 x + 0.249 0.139−0.3740.032
2014–2021 y = 10.300   ×   10 4 x + 0.235 0.185−0.4310.287
Table 4. Linear fitting of SSRD (W/m2).
TimeLinear Regression EquationR2PCCp-Value
1982–2021 y =   0.031 x + 262.634 0.004−0.0650.689
1982–2003 y =   0.549 x + 267.785 0.643−0.6800.001
2003–2021 y = 0.372 x + 258.212 0.1020.3200.182
Table 5. Linear fitting of FAL and SSRD with NDVI.
Linear Regression EquationR2PCCp-Value
FAL-NDVI y = 0.126 x + 0.304 0.014−0.1160.475
SSRD-NDVI y = 1.795   ×   10 4 x + 0.321 0.019−0.1410.386
Table 6. Linear fitting of SRF and ΔSSRD with ΔNDVI.
Linear Regression EquationR2PCCp-Value
SRF-ΔNDVI y = 9.023 × 10 4 x + 3.239 × 10 4 0.037−0.1940.238
ΔSSRD-ΔNDVI y = 8.896 × 10 5 x + 1.950 × 10 4 0.004−0.0630.705
Disclaimer/Publisher’s Note: The statements, opinions and data contained in all publications are solely those of the individual author(s) and contributor(s) and not of MDPI and/or the editor(s). MDPI and/or the editor(s) disclaim responsibility for any injury to people or property resulting from any ideas, methods, instructions or products referred to in the content.