Article

Analysis of Spatial and Driving Factors of National Sanitary Resources in China Using GIS

1
College of Landscape Architecture, Sichuan Agricultural University, Chengdu 611130, China
2
School of Emergency Science, Xihua University, Chengdu 610039, China
3
Faculty of Architecture and Urban Planning, University of Mons, 7000 Mons, Belgium
4
Wales College, Lanzhou University, Lanzhou 730000, China
*
Authors to whom correspondence should be addressed.
ISPRS Int. J. Geo-Inf. 2025, 14(5), 186; https://doi.org/10.3390/ijgi14050186
Submission received: 23 January 2025 / Revised: 23 March 2025 / Accepted: 16 April 2025 / Published: 30 April 2025
(This article belongs to the Special Issue HealthScape: Intersections of Health, Environment, and GIS&T)

Abstract

:
Promoting health equity is key to achieving sustainable urban development. The National Sanitary Cities in China (NSCC) policy is a critical development model aimed at improving urban environments and enhancing public health. This study evaluates the selection criteria and policy impact of NSCCs, using the nearest neighbour index, geographic concentration index, imbalance index, and kernel density estimation to analyze their distribution characteristics. Additionally, it explores influencing factors using a geodetector model and spatial overlay analysis. The findings indicate a shift in NSCC selection criteria from urban sanitation to urban health, reflecting China’s strategic focus on achieving health equity. The spatial distribution analysis indicates that NSCCs exhibit a clustered pattern, characterized by dual cores, dual centres, multiple scattered points, and regional extensions. NSCCs are influenced by both natural and socioeconomic factors, with economy and population, technological innovation, and informatization exerting greater influences. This study is valuable for understanding the spatial patterns of NSCCs, providing a scientific basis for promoting equitable and sustainable health resource allocation and policymaking.

1. Introduction

The rapid urbanization of the global population has underscored pressing urban health challenges, necessitating effective policy interventions to promote urban health development. Currently, more than half of the world’s population lives in urban areas, and this proportion is expected to reach 68% by 2050 [1]. The increasing complexity of urban public health issues stems from the interplay of factors such as urban development, rising population density, environmental pollution, and climate change, all of which have profound impacts on public health [2,3]. Furthermore, urban planning and policy interventions play a crucial role in shaping residents’ quality of life and overall health outcomes [4,5]. China, one of the world’s most populous and urbanized nations, has faced significant public health challenges associated with its rapid urban growth [6]. Starting in 1989, the Chinese central government began to advocate for the National Sanitary Cities in China (NSCC) policy, based on the country’s Patriotic Health Campaign, to improve urban sanitary conditions and enhance public health. NSCCs are nationally recognized cities that represent an exemplary level of regional health and sanitation [7]. In July 2017, the World Health Organization (WHO) presented the Chinese government with the “Award for Excellence in Social Health Governance” for the Patriotic Health Campaign’s significant achievements [7].
Currently, research on the NSCC policy focuses primarily on its evaluation and impact. Related studies have revealed the importance of establishing NSCCs in improving ecological welfare performance and the multiple effects it generates [8]. Studies have focused on the core elements of urban health, such as green buildings, natural infrastructure, and community participation, exploring their roles in enhancing urban residents’ quality of life [9,10]. Others have focused on healthy city planning in specific regions or countries, analyzing the socioeconomic factors influencing urban health development and policy design and implementation effectiveness [11,12]. Additionally, a few studies have taken a more macroscopic perspective, examining the relationship between healthy cities and global issues such as urban safety, ageing, and climate change [13,14]. In public health and urban planning, the effective utilization of spatial information technology (e.g., geographic information systems and remote sensing) is crucial for uncovering spatial patterns, identifying influencing factors, and promoting urban health equity and sustainable development. For example, Xie et al. used geospatial indices and ArcGIS spatial analysis to reveal the clustered distribution of leisure villages in China, highlighting the impact of natural and socioeconomic factors [15]. Similarly, Zhang et al. employed quantitative indices and the geodetector model to examine the distribution of National Forest Cities in China, linking social environmental factors to green space inequality [16]. These methods provide valuable references for analyzing the spatial patterns of NSCCs. However, existing studies on urban health often focus on singular aspects, overlooking the interplay between policies, social determinants, natural factors, and geographical disparities. This is particularly evident in the lack of research exploring how national policies can be integrated with local initiatives to tackle health inequities. Given China’s vast territory and uneven distribution of cities, population, and economy, disparities in public health resources and health equity are inevitable [17,18]. Therefore, it is necessary to investigate the spatial distribution of NSCCs and the factors driving their development. Furthermore, for China, there is an urgent need to investigate how to leverage the national government’s administrative mechanisms and resource advantages to create environments that meet the standards of sanitary cities and provide feasible strategies for achieving health equity. Such research is essential for clarifying the spatial dimensions of health equity, promoting health equity within the NSCC policy framework, and, on a broader scale, guiding governments at all levels to jointly create urban spaces conducive to the health of all Chinese residents, even worldwide.
This research utilized Geographic Information System software (ArcGIS 10.8), online mapping services (Google Earth), and R’s GD statistical package to examine the evolution and current execution of the NSCC policy. It analyzed the spatial distribution patterns and development drivers of all cities that have appeared on the NSCC list, providing a scientific basis for developing the NSCC policy and offering new perspectives on urban health strategies. By examining national-level policies and practices, this study aimed to offer insights and solutions for the sustainable development of cities worldwide, and the research findings are expected to serve as a valuable reference for enhancing the overall resilience of cities and public health.
The paper is structured as follows: In Section 2, we present an analysis of the NSCC policy, including its origin, evolution, selection criteria, evaluation mechanisms, significance, and benefits. We describe the data sources and methodology in Section 3. In Section 4 and Section 5, we provide and analyze the findings. Finally, in Section 6 and Section 7, we discuss and summarize our findings and perspectives for future research.

2. Theoretical Derivation and Significance of NSCC Policy

2.1. Original NSCC Policy

In 1986, the WHO launched the “Healthy Cities” movement, which has since inspired various regions worldwide to implement healthy city construction practices tailored to their local conditions [19]. In response to this global initiative, China, through the National Patriotic Health Campaign Committee (NPHCC), began the NSCC creation campaign in 1989. The NSCC creation campaign is a government-led social health movement with extensive participation from all levels of society, based on the actual situations of Chinese cities and relying on patriotic health work with distinct Chinese characteristics. Relevant research shows that the construction of NSCCs has been a precursor to the development of healthy cities in China, and there are extensive commonalities between the two [20,21]. This suggests that the NSCC creation campaign is a positive response and localized adaptation of the global Healthy Cities movement within China’s context.

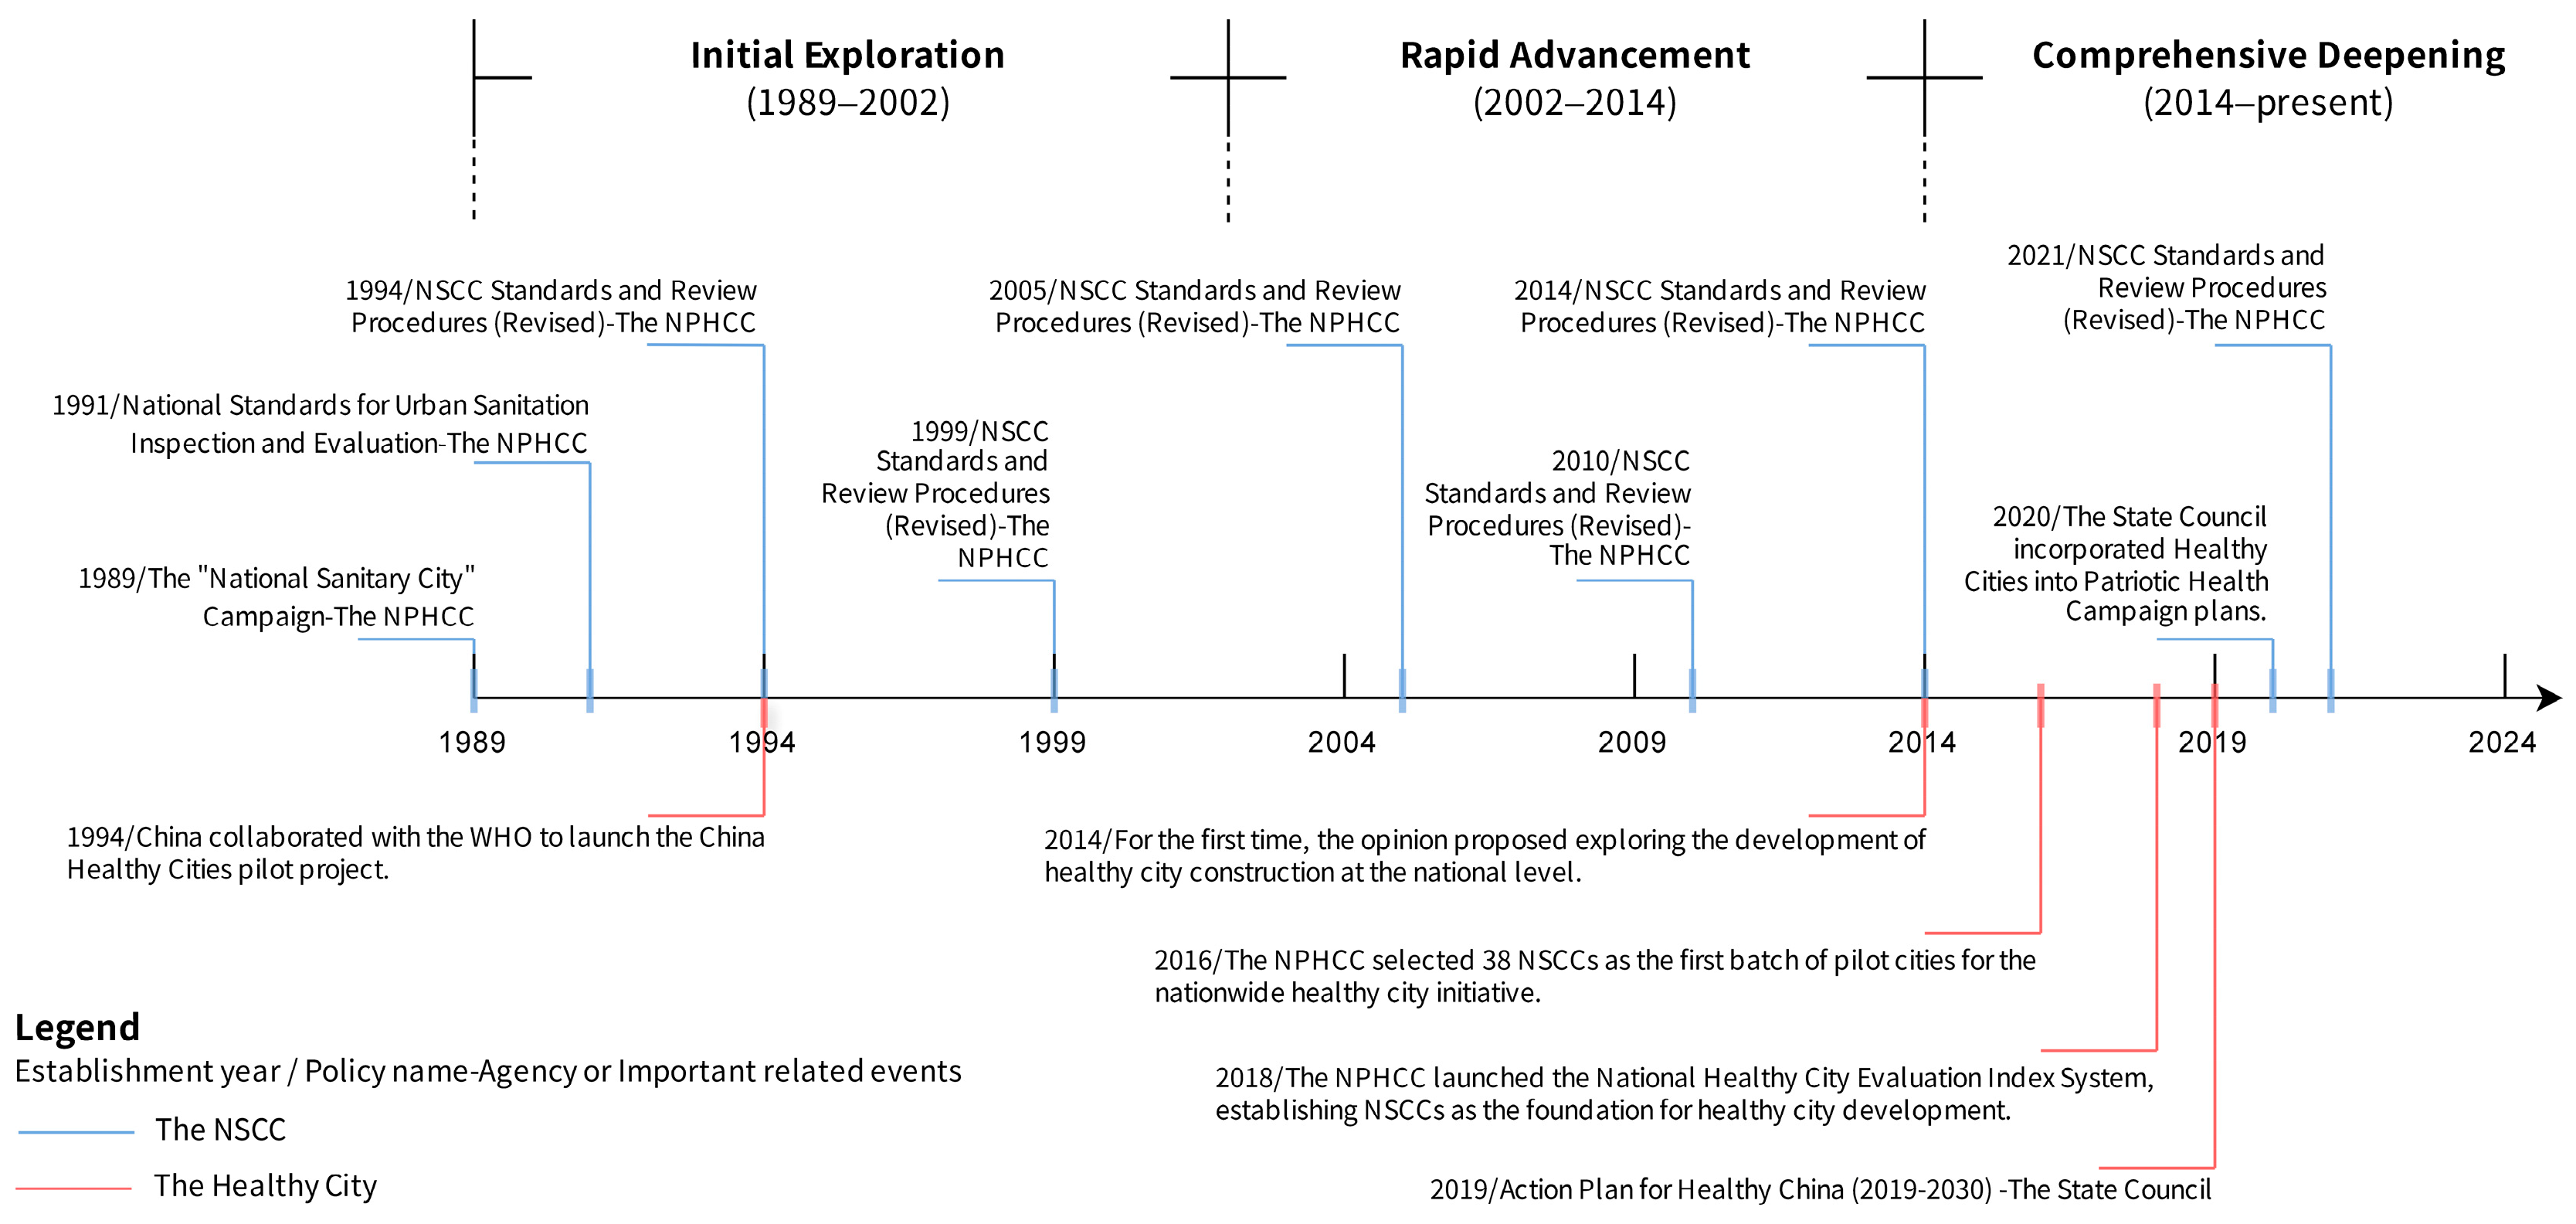
2.2. Evolution Process of NSCC Policy

Since the NPHCC’s initiative to establish NSCCs in 1989, the NPHCC has continuously improved the standards and evaluation management methods for NSCCs. These revisions, implemented at different stages, have been crucial in adapting to the evolving requirements of urban development and ensuring a standardized assessment and management process. The evolution of relevant policies can be divided into three distinct stages. Figure 1 illustrates the gradual shift from the creation of NSCCs to the development of a more comprehensive model of sanitary and healthy cities. From 1990 to 2020, the NPHCC cumulatively named 391 NSCCs and 71 National Sanitary Districts, accounting for more than half of China’s total cities (districts).

2.3. Evolution of Selection Criteria and Mechanisms of NSCCs

In 1989, China officially released the initial standards for creating NSCCs and established an evaluation mechanism. The aim was to ensure that improvements in sanitary conditions and the enhancement of sanitation levels progressed in tandem with Chinese urban development, marking the establishment of the NSCC policy. The revisions to the standards from 1994 to 2021 were largely consistent in content framework, with the main changes being adjustments and revisions to specific work indicators. The 2021 version of the standards includes seven aspects: patriotic health organization and management, health education and promotion, urban environmental sanitation, ecological environment, key site sanitation, food and drinking water safety, disease prevention and control, and medical services. The 2021 version of standards, revised to support the nationwide Healthy Cities initiative and integrate lessons from the COVID-19 pandemic, introduces the following changes. First, the standards strengthened the requirements for infectious disease prevention and control to actively prevent and control potential public hazards that may arise from major infectious diseases. Second, to support the implementation of the Healthy China action, the new standards added indicators for the 15 special actions of the Healthy China action. Finally, some indicators and standard content expressions were optimized, considering practical situations, economic and social development, and operability.
Regarding the evaluation mechanism, the creation of NSCCs adopts a voluntary application and level-by-level assessment. The evaluation cycle is once every three years. Successfully named cities need to pass a re-evaluation every three years to maintain their status; otherwise, they lose their designation. For example, in 2021, nine cities, including Hanzhong City in Shaanxi Province, demonstrated a decline in their work to consolidate their sanitary city status and were criticized [22]. The latest revised “NSCC Evaluation and Management Measures” simplify the evaluation procedures, reducing the original five procedures to three. The new measures replaced the previously required conditions with a scoring system and eliminated the one-vote veto. The long-term supervision mechanism has been improved, adjusting the review of NSCCs from a fixed three-year review to random inspections within three years after the designation, ensuring more dynamic and stringent supervision.

2.4. Significance and Benefits

The NSCC policy has improved urban environments and governance performance. Residents’ overall score of access to an NSCC is relatively high, indicating that the policy has gained widespread recognition among the public [23]. The policy’s standards and commendation mechanisms have prompted local governments to optimize their governance models and enhance overall performance. Studies have shown that the policy has increased green space, reduced industrial sulphur dioxide and wastewater emissions [24,25], and raised the proportion of urban domestic sewage treatment, waste disposal, and qualified farmers’ markets [26]. The policy has also significantly improved the efficiency of environmental governance and has played a substantial role in promoting urban public services [25]. It has effectively mobilized local governments to participate actively in environmental protection, fostered learning and competition among them, and notably improved the environmental quality of cities that have successfully obtained the NSCC title. Moreover, compared to cities that have not received this title, key officials in these cities are more likely to be promoted, suggesting that the policy has had a positive impact on urban environments, public health, and officials’ enthusiasm for governance, ultimately strengthening the overall performance of urban administration [20].
Relevant research indicates that establishing NSCCs effectively mitigates the impact of COVID-19, demonstrating the potential of these cities in controlling infectious diseases [27]. The creation of NSCCs has effectively promoted the development of China’s health field and improved public health levels. Since the initiation of NSCC certification in 1989, relevant studies analyzing health patterns in 34 provincial-level administrative units in China from 1990 to 2017 have shown that China has made substantial progress in reducing the burden of many diseases and disabilities [28]. From 1990 to 2015, a span of 25 years, China was one of the countries with the most significant improvement in the quality and accessibility of healthcare services, among 195 countries and regions worldwide [29]. The policy has implemented a series of measures to enhance health and well-being, for instance, improving urban environmental sanitation, requiring an immunization rate exceeding 90% for age-appropriate children, promoting the standardized development of primary healthcare institutions, and implementing chronic disease prevention and control measures, among others. Since 1990, China’s life expectancy has increased from 68.55 to 78.6 years (2023) [30], demonstrating the profound impact of systematic public health interventions and improved healthcare accessibility on population health.

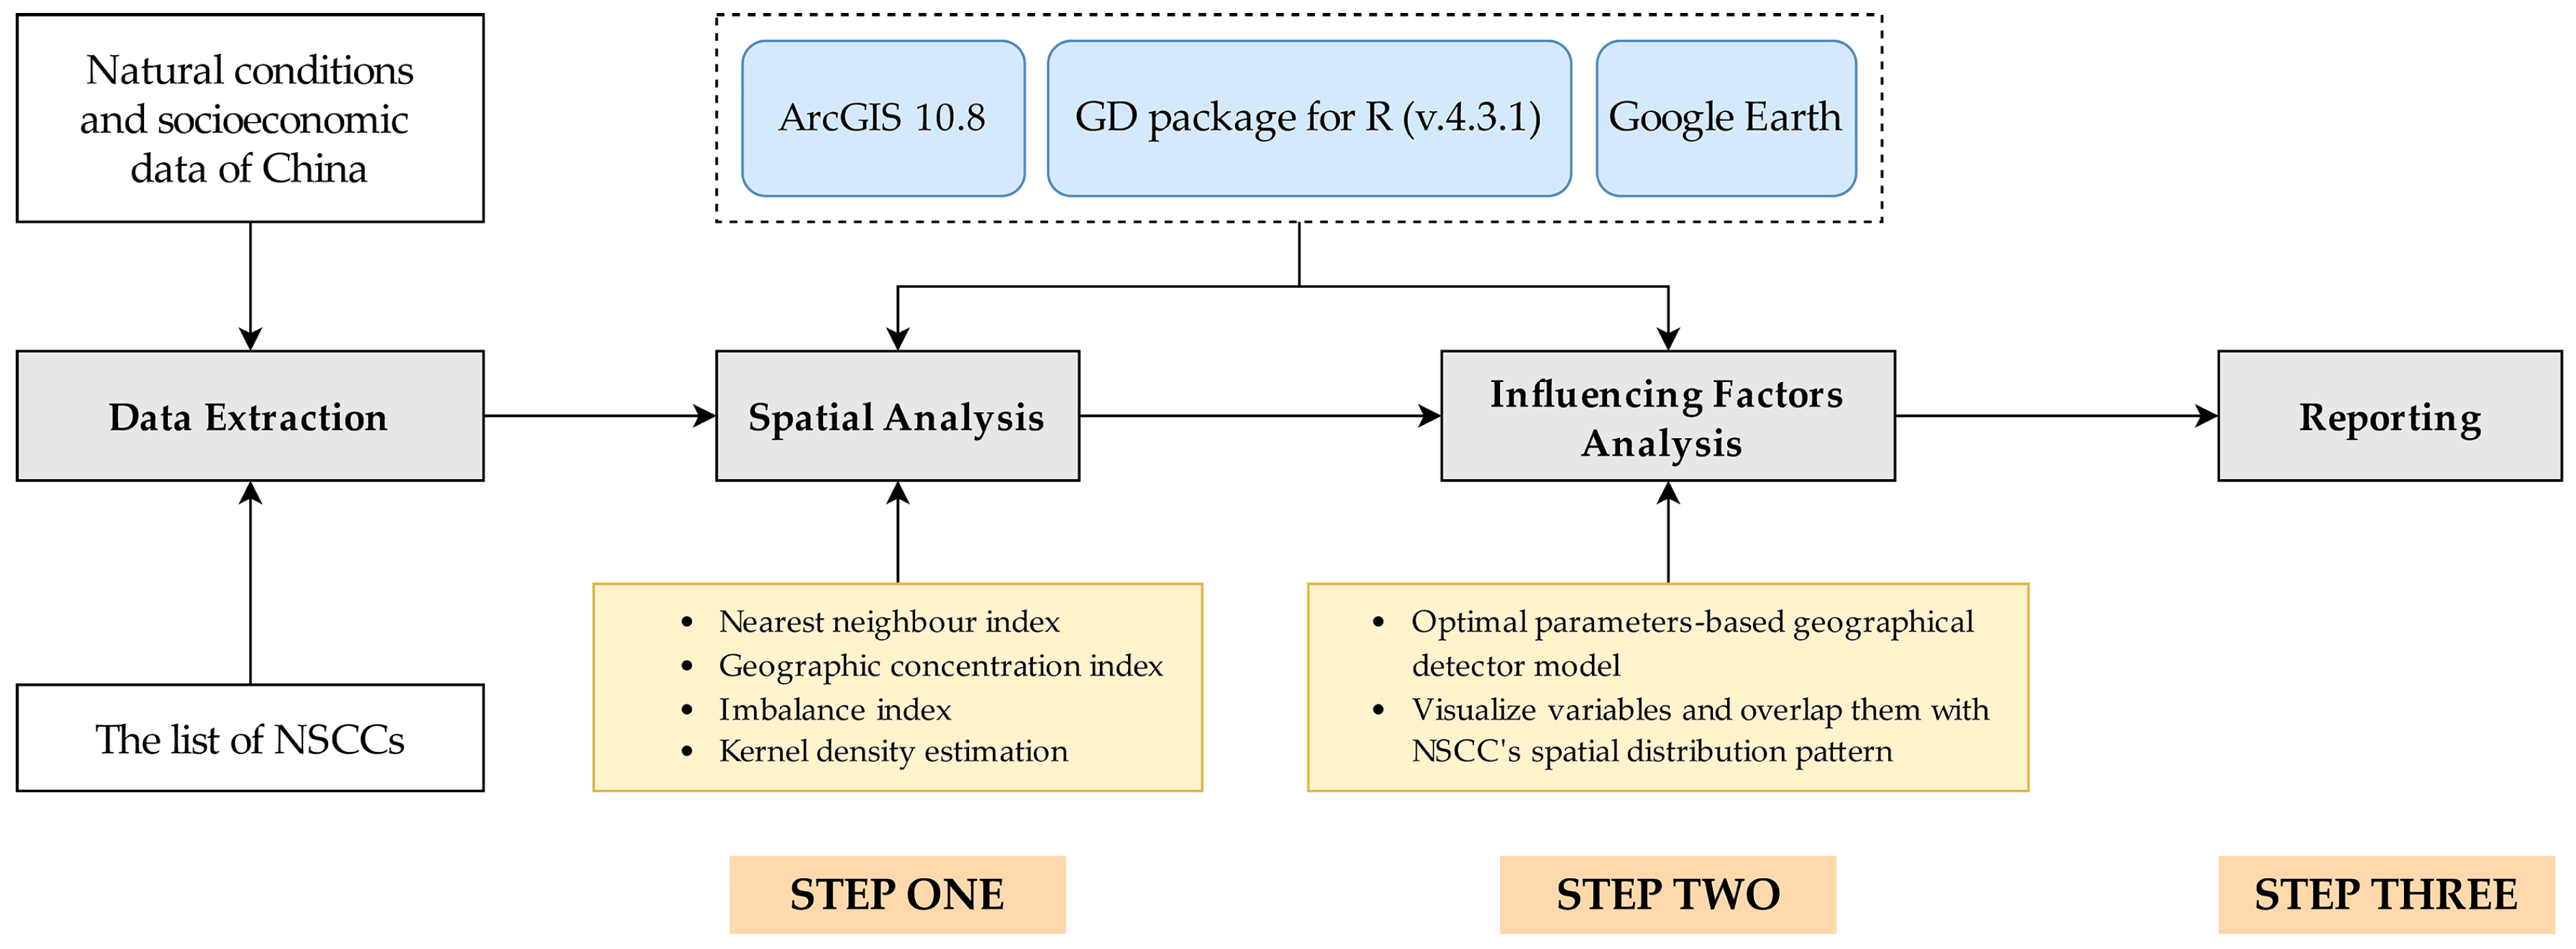
3. Data Sources and Research Methodology

3.1. Data Sources

The NSCC list, issued by China’s National Health Commission (https://en.nhc.gov.cn/), now encompasses 462 cities (excluding Hong Kong, Macao, and Taiwan). This research calibrated geographical coordinates using Google Earth and ArcGIS 10.8 to build the database, integrating data from diverse authoritative sources, such as the Chinese Academy of Sciences and national yearbooks, to analyze the influencing and driving factors. This approach allowed us to create a spatial database and visualize the effective implementation of the NSCC policy across China.
This analysis is based on the NSCC list published in December 2020. The 462 cities across 31 provinces, municipalities, and autonomous regions were included. While social organizations or institutions have released similar lists, the list issued by the central government of China is considered the most authoritative, due to the country’s particular political system [31,32]. The data used in this study were sourced from the Resource and Environment Sciences and Data Platform at the Institute of Geographic Sciences and Natural Resources Research, Chinese Academy of Sciences (http://www.resdc.cn/), the China Statistical Yearbook, and the China Health Statistical Yearbook. Information on China’s National Smart Cities Pilot Project was taken from the Ministry of Housing and Urban-Rural Development website (https://www.mohurd.gov.cn/), data on 3A hospitals were retrieved from the website of the National Healthcare Security Administration (https://www.nhsa.gov.cn/), and a map of China was provided by the Natural Resources Ministry’s Map Technology Review Center (https://www.zrzyst.cn/). All data were accessed on 1 August 2024.
To ensure the accuracy of the evaluations for the NSCC policy, we precisely calibrated the geographical coordinates for all cities on the list. With the use of Google Earth Coordinate Picker, the central point of the city government buildings was used as the coordinate base for existing cities. For cities merged due to administrative reorganization, the newly established service management centre or government building was the central point for coordinating calibration and ensuring comprehensive and precise assessments. In total, 462 valid data points were obtained, covering all cities in the list. Subsequently, the data were imported into ArcGIS 10.8, a software tool developed by the Environmental Systems Research Institute in the USA, for data analysis and map creation. In ArcGIS 10.8, spatial coordinates were matched and projected, and data were integrated into 462 location coordinates, thus creating a spatial database for the NSCCs and visualizing their spatial distribution on a map.

3.2. Research Methodology

This study adopted well-established indices and models widely accepted in geospatial research to investigate the NSCCs. Figure 2 presents a flowchart of the research methodology. The nearest neighbour index was used to analyze the spatial distribution patterns. In contrast, the geographic concentration and imbalance indices were employed to differentiate the spatial distribution disparities. Kernel density analysis was applied to examine the spatial distribution density. The geodetector and spatial superposition models were utilized to measure the influence of natural and socioeconomic factors on the distribution.

3.2.1. Nearest Neighbour Index

Based on the nearest neighbour index, the spatial distribution patterns of the NSCCs were evaluated [16,33]. The principle involves measuring the average distance between these cities and then comparing this measured nearest neighbour distance to the expected average nearest neighbour distance. The ratio of these distances is the nearest neighbour index, which determines the cities’ spatial distribution characteristics (whether clustered, random, or dispersed). The calculation formula is as follows:
R = D O ¯ D E ¯ ; D O ¯ = i = 1 n d i n ; D E ¯ = 0.5 n A
where R stands for the nearest neighbour index, D O ¯ is the average of the distance between the nearest points in reality, D E ¯ is the average between the nearest points in theory, and A is the study area. R < 1 indicates a clustering trend among the points: if R = 1, the spatial distribution of the points is random; if R > 1, the points tend to be dispersed.

3.2.2. Geographic Concentration Index

The geographic concentration index measures the degree of concentration in the spatial distribution of the NSCCs [34]. The G value ranges from 0 to 100, with higher G values indicating more concentrated distributions and lower G values indicating more dispersed distributions. The calculation formula is as follows:
G = 100 × i = 1 n X i T 2
where G is the geographical concentration index, Xi represents the number of NSCCs in each administrative region, T is the total number of NSCCs across all regions, and n is the number of administration regions.

3.2.3. Imbalance Index

The imbalance index is used to reflect the balance of the distribution of NSCCs across different regional areas [35]. The calculation formula is as follows:
S = = 1 n Y i 50 n + 1 100 n 50 n + 1
where n represents the number of regions, totalling 31, and Yi represents the cumulative percentage of NSCC in the i-th region relative to the total number. The value of S ranges from 0 to 1: S = 0 indicates that the NSCCs are evenly distributed across all regions; S = 1 means that all NSCCs are concentrated in a single region. The closer the value of S is to 1, the more uneven the distribution of NSCCs.

3.2.4. Kernel Density Estimation

The kernel density estimation method can be used to determine the clustering status of NSCCs [36]. The calculation formula is as follows:
f n x = 1 n h i = 1 n k x X i h
where fn represents the kernel density estimate, n is the number of NSCCs, k represents the kernel function, xXi is the distance from the estimation point x to the sample Xi, and h is the search radius.

3.2.5. Optimal Parameter-Based Geographical Detector Model

The geographical detector is a statistical method widely used to explore the spatial differentiation of geographic phenomena and to identify the driving forces behind this spatial differentiation [37]. In this study, we used the “GD” package in R to implement and execute the optimal discretization method for independent variables. Using a factor detection module, we explored and identified the dominant factors influencing the distribution of NSCCs. The formula for the factor detection module is as follows:
q = 1 j = 1 M N j σ j 2 N σ 2
where q represents the degree to which the influencing factor explains the spatial distribution of NSCCs, with q values in the range of [0, 1]. A higher q value indicates a greater influence of the factor on the spatial distribution of NSCCs. N and σ 2 represent the study unit’s total sample size and variance, respectively, and N j and σ j 2 denote the sample size and variance of the jth layer (j = 1, 2, 3, …, M).

4. Results

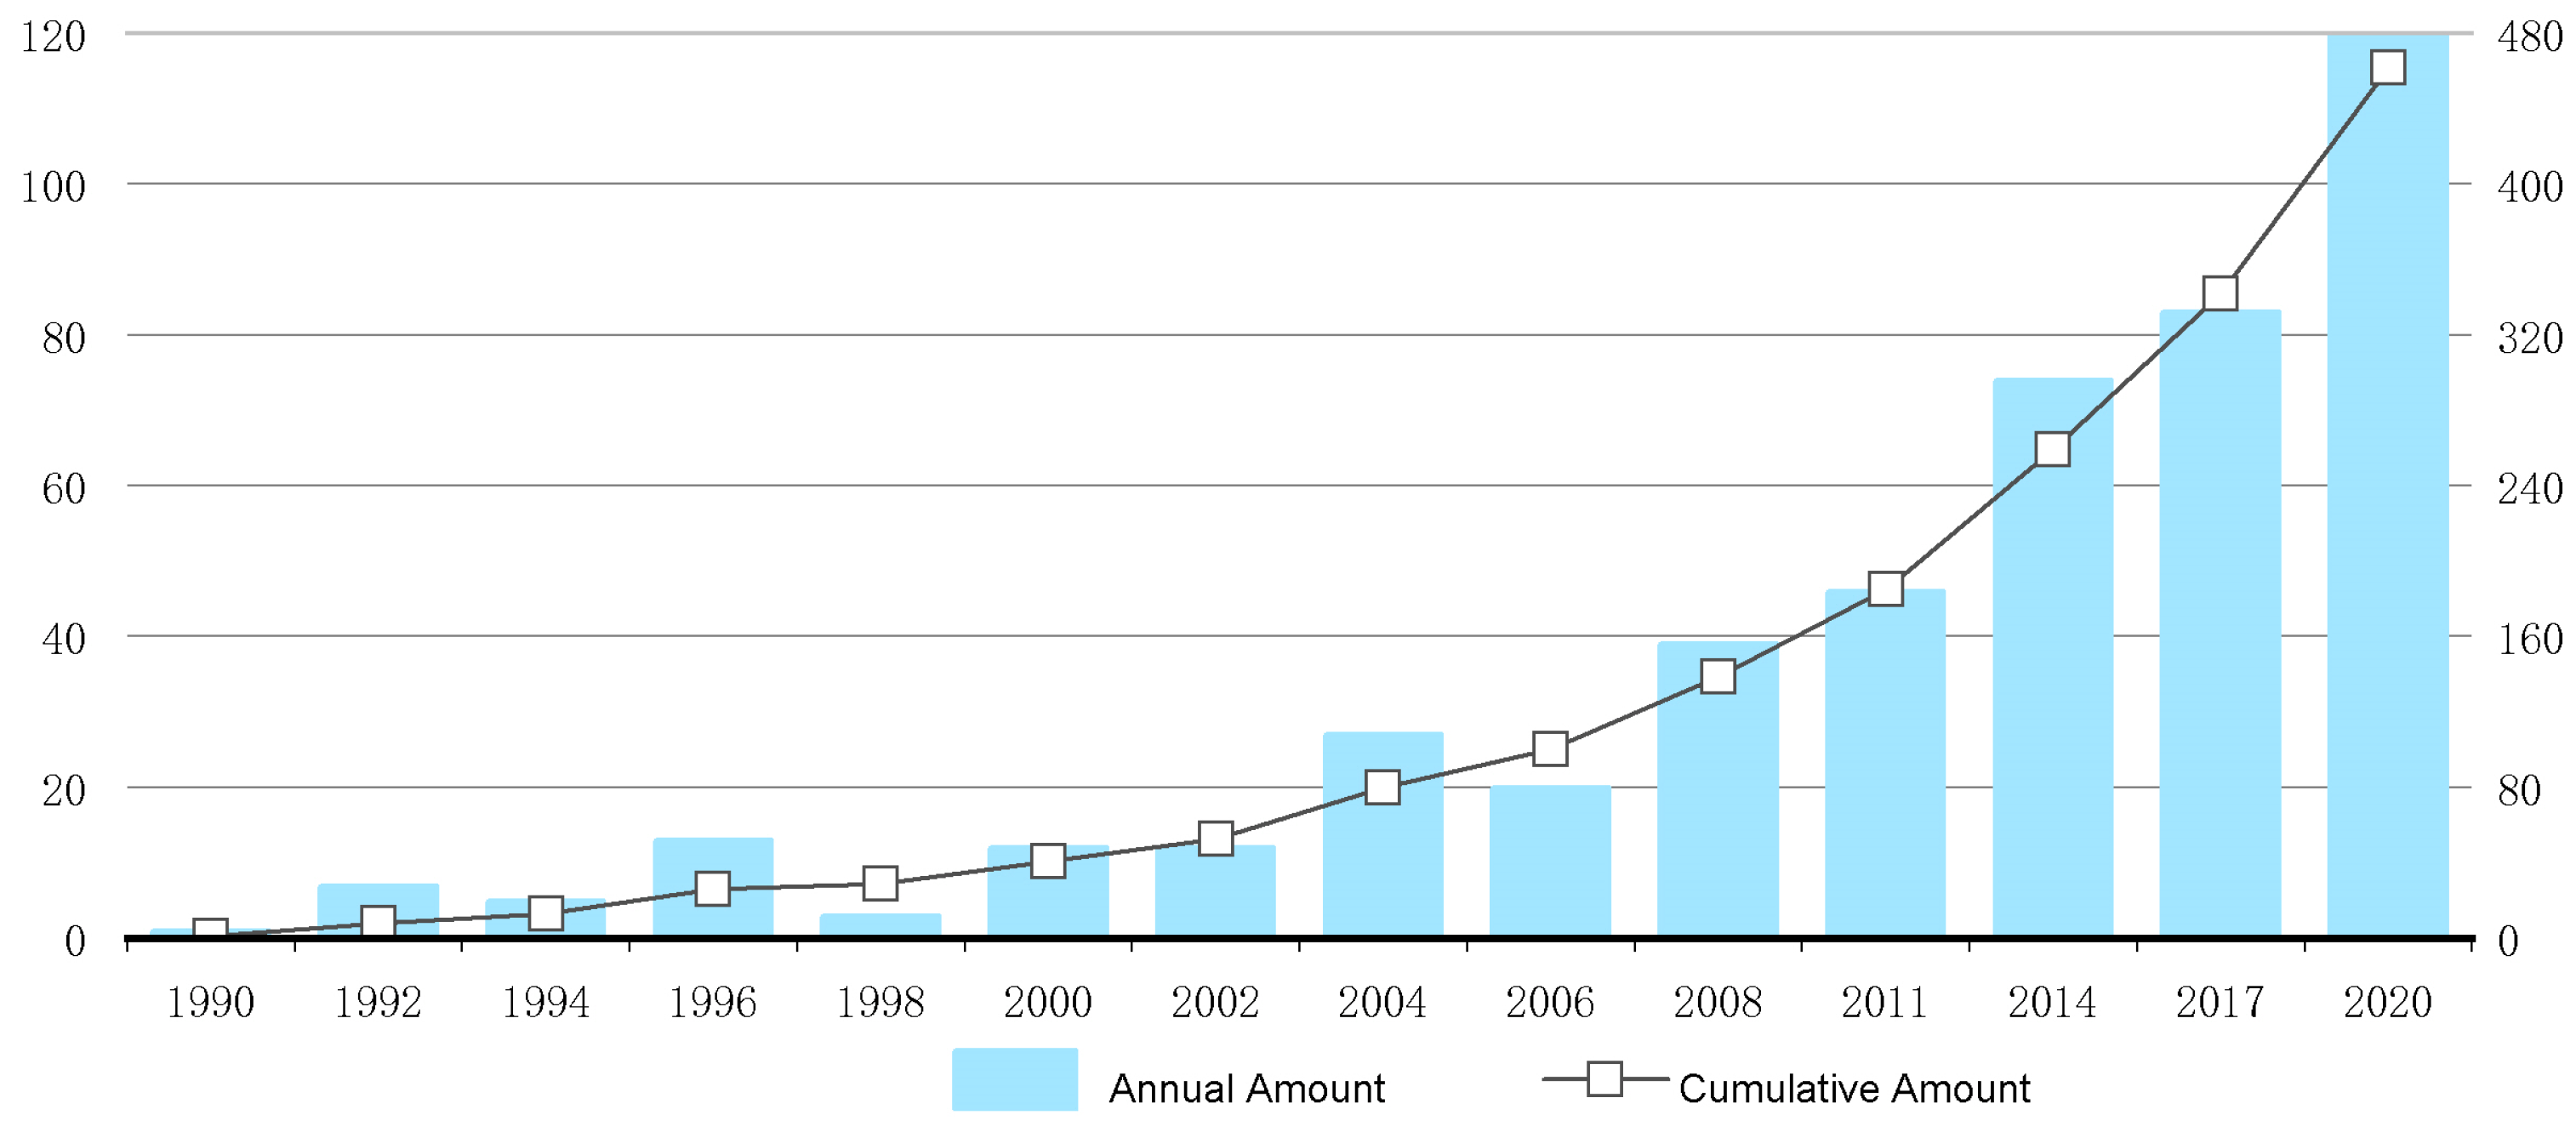
4.1. Overview of the Study Subject

Since 1990, the NPHCC has been conducting evaluations to designate NSCCs. To date, 462 cities have been awarded the title, representing nearly 60% of all urban areas (districts) nationwide; as shown in Figure 3, the number of NSCCs generally exhibits an upward trend.
This study extracted spatial distribution data for the NSCCs and created a geographic spatial database, abstracting their distribution from a macroscopic perspective into point elements. Figure 4 illustrates the distribution of NSCCs across 31 administrative regions.

4.2. Spatial Characteristics and Structural Analysis

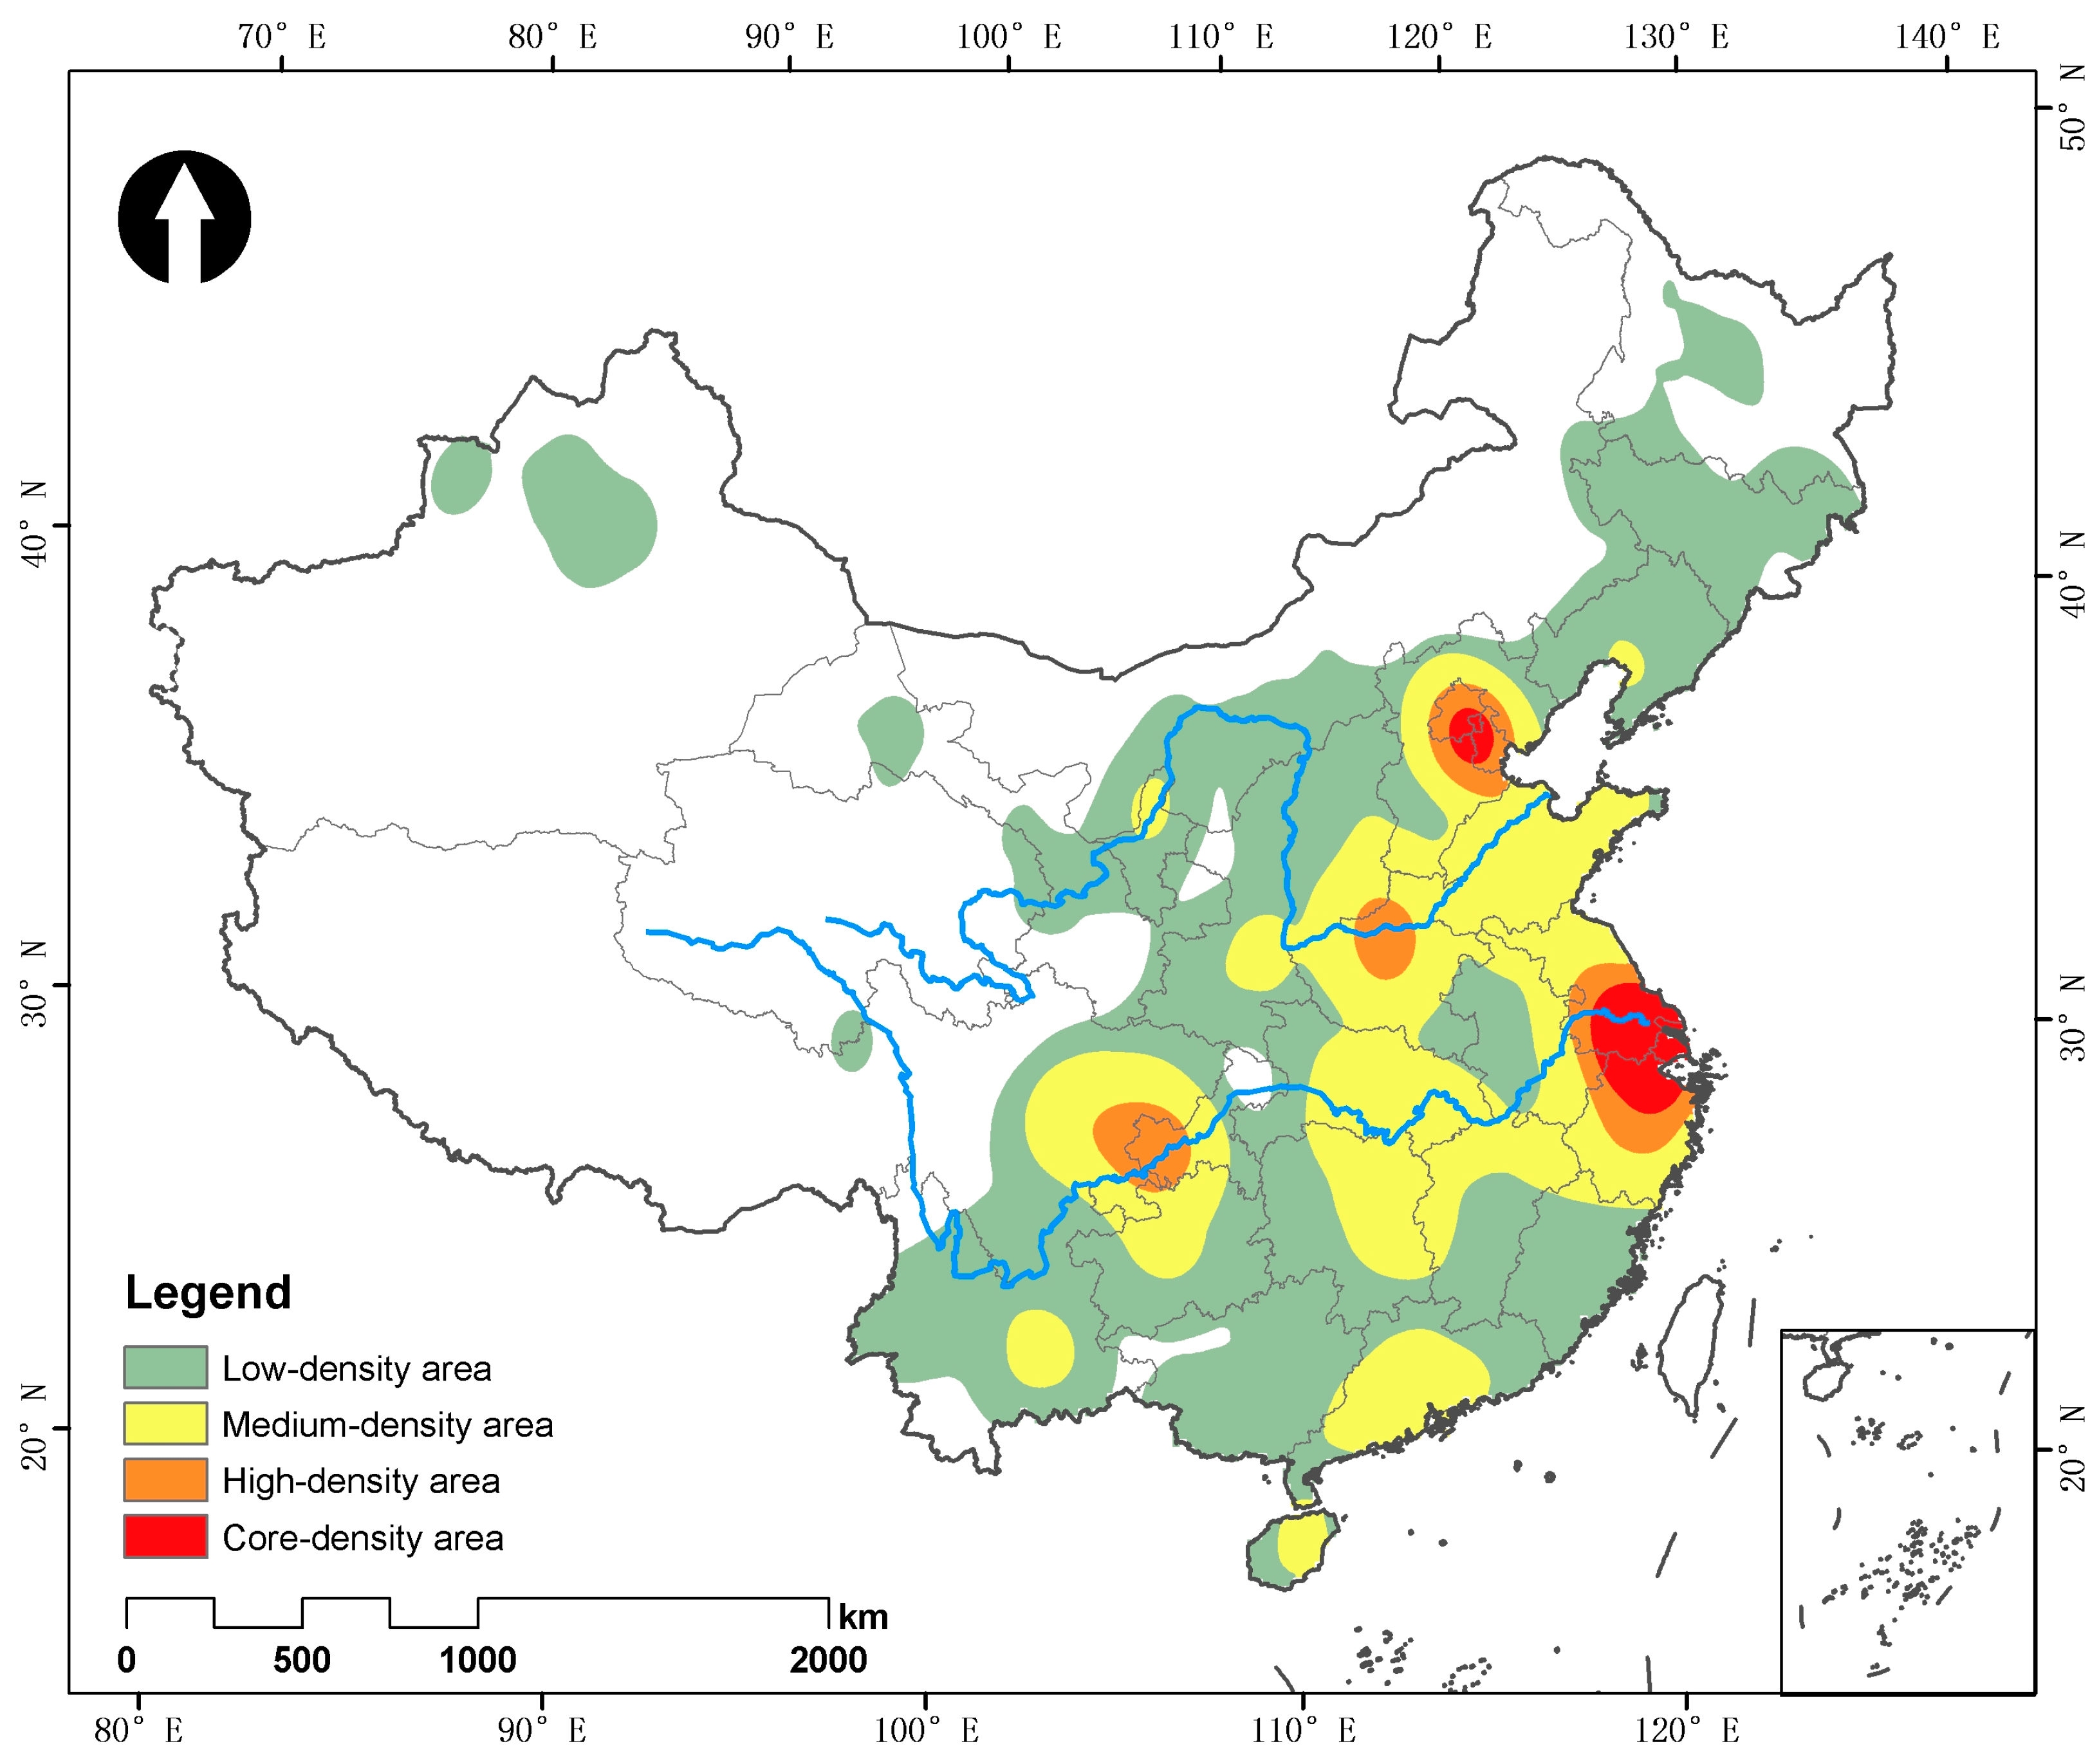
4.2.1. Spatial Distribution Pattern

As shown in Figure 4, the distribution of NSCCs is characterized by large clusters and small dispersions. The nearest neighbour index was used to determine the spatial distribution pattern of these point elements. With the spatial analysis tools in ArcGIS 10.8 software, the average nearest neighbour index for the NSCCs was calculated to be R = 0.85 < 1, and it passed the 1% significance test (p-value = 0.0000). The results reveal that the spatial distribution of NSCCs prominently features clustering within specific regional spaces.

4.2.2. Balanced Spatial Distribution

1.
Concentration analysis of spatial distribution
The concentration of the NSCC distribution was calculated using Formula (2) and the data from Table 1. The resulting geographic concentration index, G, was 21.35. If the NSCCs were evenly distributed across all administrative regions, index G′ would be 17.96. Since G > G′, the distribution of the NSCCs is concentrated in certain administrative regions.
2.
Equilibrium analysis of spatial distribution
Based on the economic development levels and geographical locations, China is generally divided into three regions: eastern, central, and western [38,39]. From 2000 to 2020, the number and regional distribution of NSCCs underwent significant changes (Table 2), with the total number increasing more than 11-fold. In 2000, NSCCs were primarily concentrated in the eastern region. By 2020, the proportion in the eastern region had decreased, while the central and western regions had increased.
To quantify the degree of uneven distribution, the imbalance index (Formula (3)) was applied. The resulting imbalance index for the NSCCs was S = 0.3525 with 0 < S < 1, indicating an uneven distribution across the administrative regions. This demonstrates that the distribution of NSCCs across the administration regions is not uniform. The Lorenz curve, used to chart the variation in the number of NSCCs by the administration regions in Figure 5, shows an upward convex trend. Notably, the combined total of NSCCs in Jiangsu, Shandong, Zhejiang, Henan, Sichuan, Guangdong, Hubei, Chongqing, and Shanghai accounts for 53.46% of the national figure, further highlighting the uneven distribution of NSCCs.

4.2.3. Spatial Distribution Density Characteristics

We used the kernel density tool in ArcGIS 10.8 to reveal the clustering of NSCCs. Its spatial distribution characteristics were as follows: “Dual cores, dual centres, multiple scattered points, and regional extensions”, as shown in Figure 6.
Dual cores and dual centres, identified using kernel density analysis, represent different levels of spatial density: dual cores are the highest-density zones, and dual centres are secondary high-density zones. Dual cores refer to two core density areas: the Beijing–Tianjin–Hebei region (Beijing, Tianjin, and nearby Hebei), and the Yangtze River Delta region (Jiangsu, Shanghai, Anhui, and Zhejiang). Dual centres refer to two high-density central areas: one centred around Henan, comprising the provinces of Shanxi, Shaanxi, and Hubei, and the other centred around Sichuan and Chongqing, comprising the Guizhou and Hunan Provinces.
Multiple scattered points and regional expansions have formed several mid- to low-density zones. Notably, the mid- to low-density area in the southeast is a continuous high-value zone, displaying a layered distribution. In contrast, the northeast and northwest regions are primarily characterized by dispersed distributions.
Overall, the spatial distribution of NSCCs is generally higher in the east and lower in the west, denser in the south and sparser in the north, and mainly concentrated in the economically prosperous eastern regions.

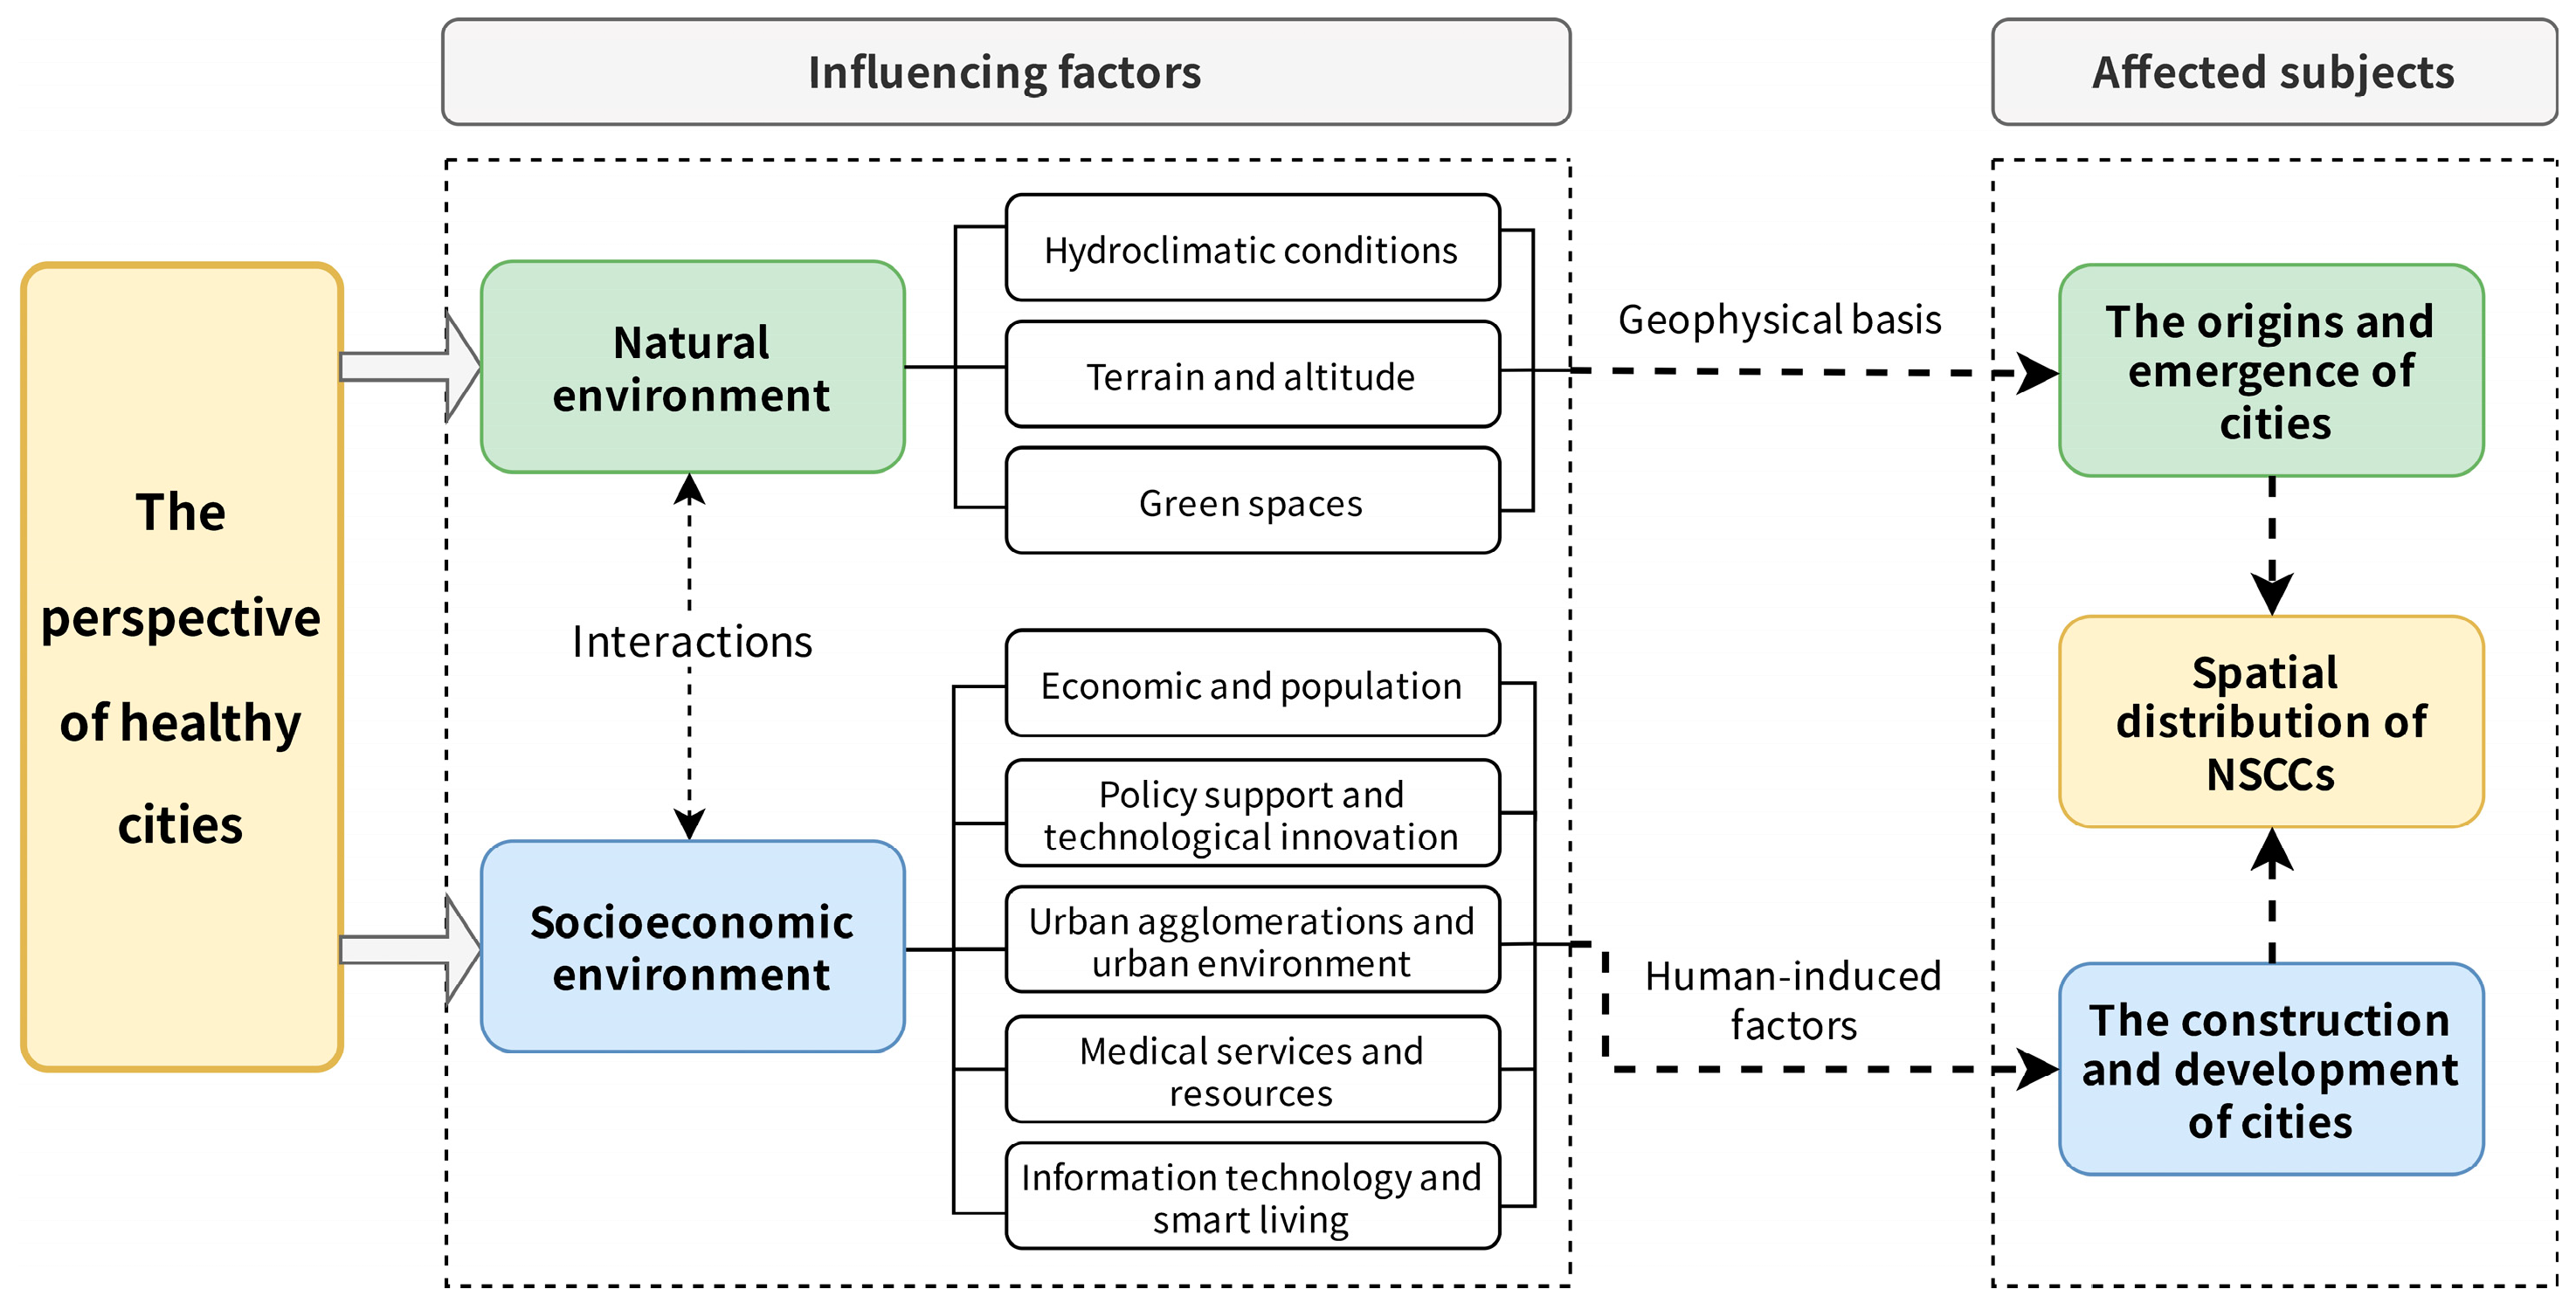
5. Driving and Influencing Factors of the Spatial Distribution of NSCCs

From the perspective of healthy cities, two main factors are crucial for understanding the spatial distribution of NSCCs: the natural environment and the socioeconomic environment [14,40], as illustrated in Figure 7.

5.1. Natural Environmental Factors

Cities, as densely populated settlements, exhibit intrinsic connections between their sanitary environmental and regional environmental conditions. China’s diverse topography, from the 4000 m Tibetan Plateau to the varied eastern coastal landscapes [41], exerts both direct and indirect influences on human settlement patterns, economic development, and environmental protection [42,43]. Epidemiological evidence demonstrates strong associations between ambient temperature and disease incidence rates [44], while green spaces emerge as crucial determinants of urban health outcomes. These varying geographical conditions, temperature patterns, and green space distributions significantly shape the sustainable development of NSCCs.

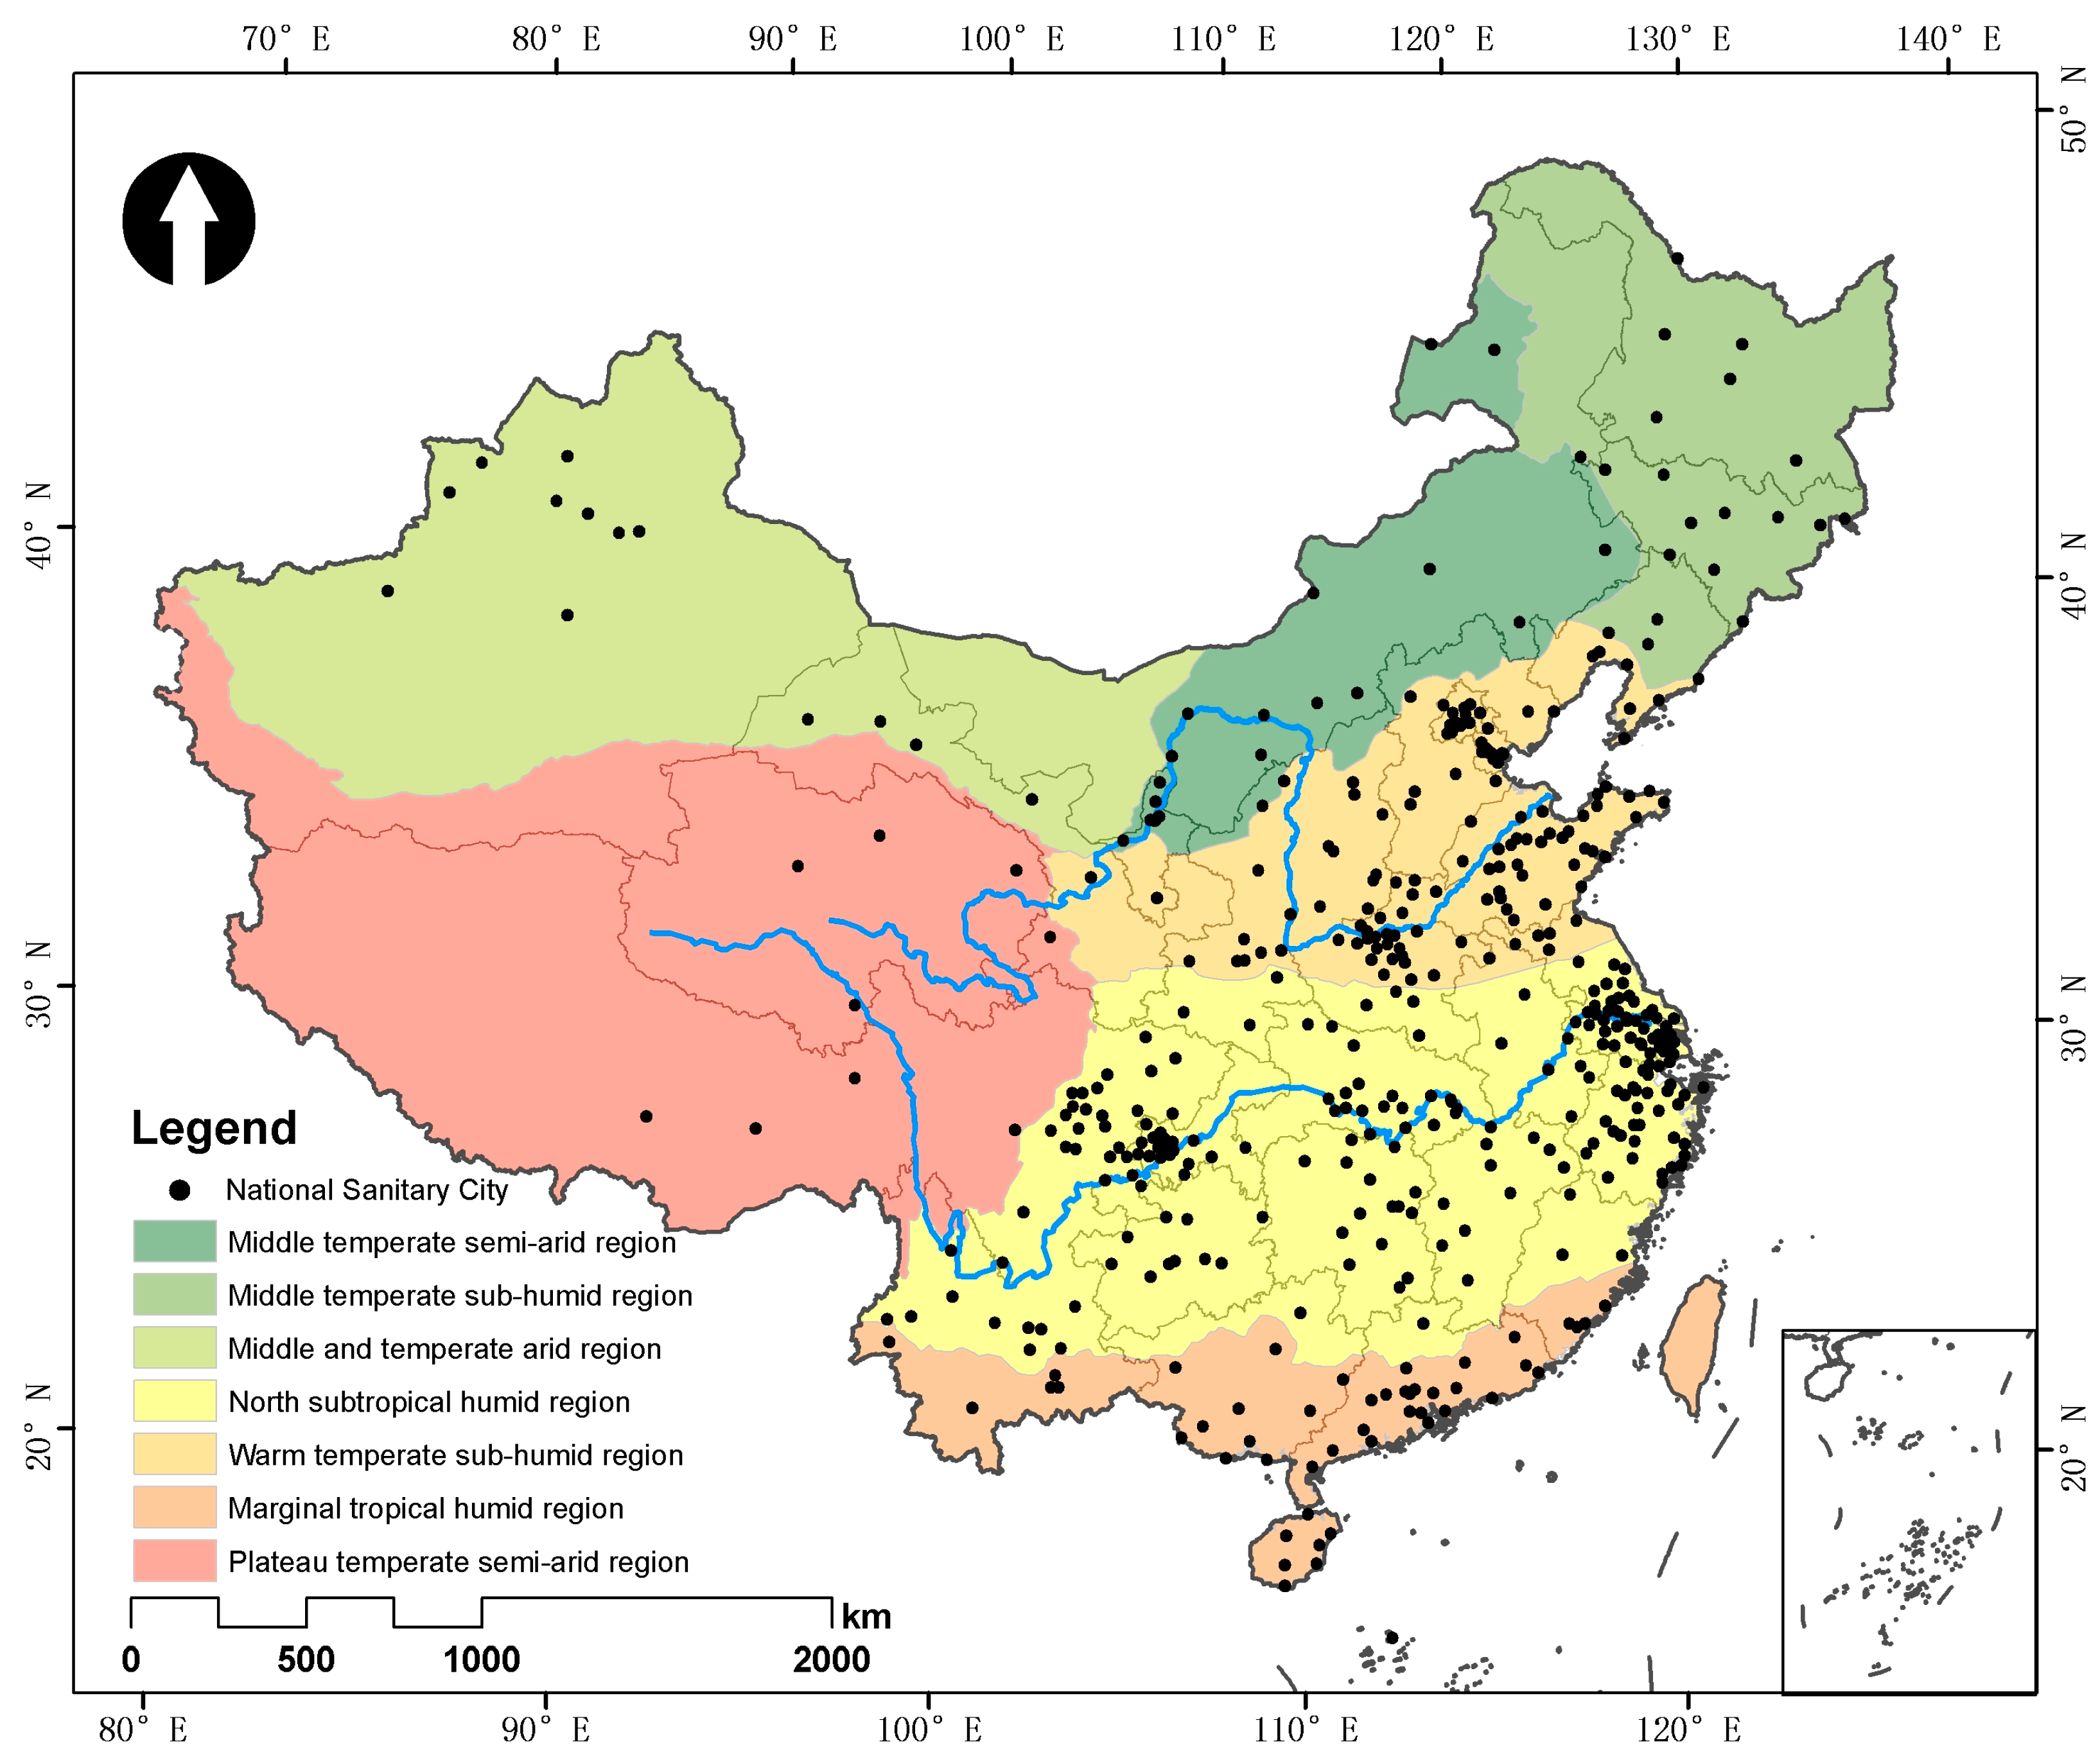
5.1.1. Hydroclimatic Conditions

We conducted spatial overlay analysis between the NSCC distribution and China’s seven climate zones [16,45]. As shown in Figure 8, nearly 87% of NSCCs are located in areas with an annual accumulated temperature over 3400 °C and annual precipitation exceeding 400 mm, indicating that environments with favourable hydrothermal conditions are conducive to establishing and developing sanitary cities. In contrast, only 2% of NSCCs are situated in the highland climate regions of the West. Recent epidemiological evidence indicates significant spatial heterogeneity in China’s mortality rates under both high and low temperatures, with cold effects dominating the overall mortality burden [46]. The current pattern indicates that geographic differences in hydrothermal conditions are a major factor influencing the distribution of NSCCs, constraining the direction of their spatial spread and potential expansion areas.

5.1.2. Terrain and Altitude

Figure 9a shows that NSCCs in China are distributed across various elevations. Nearly 97% of NSCCs are located in areas below 2000 m in elevation, with the majority situated below 200 m. Only 3% of the cities are in areas where the terrain rises above 2000 m. Lower-elevation regions, which are flatter and more accessible, facilitate the aggregation and transportation of resources, making it easier to build and expand urban infrastructure and public health facilities. Additionally, these lower-altitude areas typically have denser populations, which increases the urgency and complexity of public health service needs, prompting governments and organizations to promote the development of sanitary cities more actively.

5.1.3. Urban Green Spaces

As shown in Figure 9b, nearly 80% of NSCCs are located in areas where the annual average NDVI (normalized difference vegetation index) ranges from 0.3 to 0.6. This indicates that most NSCCs are situated in regions with moderate vegetation cover. Such levels of vegetation cover are beneficial for improving urban environmental quality, mitigating urban heat island effects, and providing recreational green spaces for residents. In contrast, only 2.4% of NSCCs are found in areas with an annual average NDVI of 0.2 or below. Lower vegetation cover is typically associated with negative environmental factors, such as higher temperatures, poorer air quality, and limited natural habitats [47,48]. These conditions not only affect residents’ daily lives but also pose challenges for these cities in meeting the environmental standards required by the NSCC policy.

5.2. Socioeconomic Factors

Based on the existing literature related to healthy cities and NSCCs [14,20,49], and referencing the standards for NSCCs, this study aggregated and examined the impact of socioeconomic factors on NSCCs from five dimensions, guided by principles of scientific rigour and data availability. Each dimension encompasses and influences multiple elements. For instance, economy and population serve as the foundation for resource allocation and health equity, shaping the capacity to implement various aspects of urban health development [50,51]. Similarly, information technology and smart living influence multiple facets of urban health—such as policy implementation, public health education, and healthcare accessibility—through digital innovation [52]. Influencing factors are shown in Table 3.

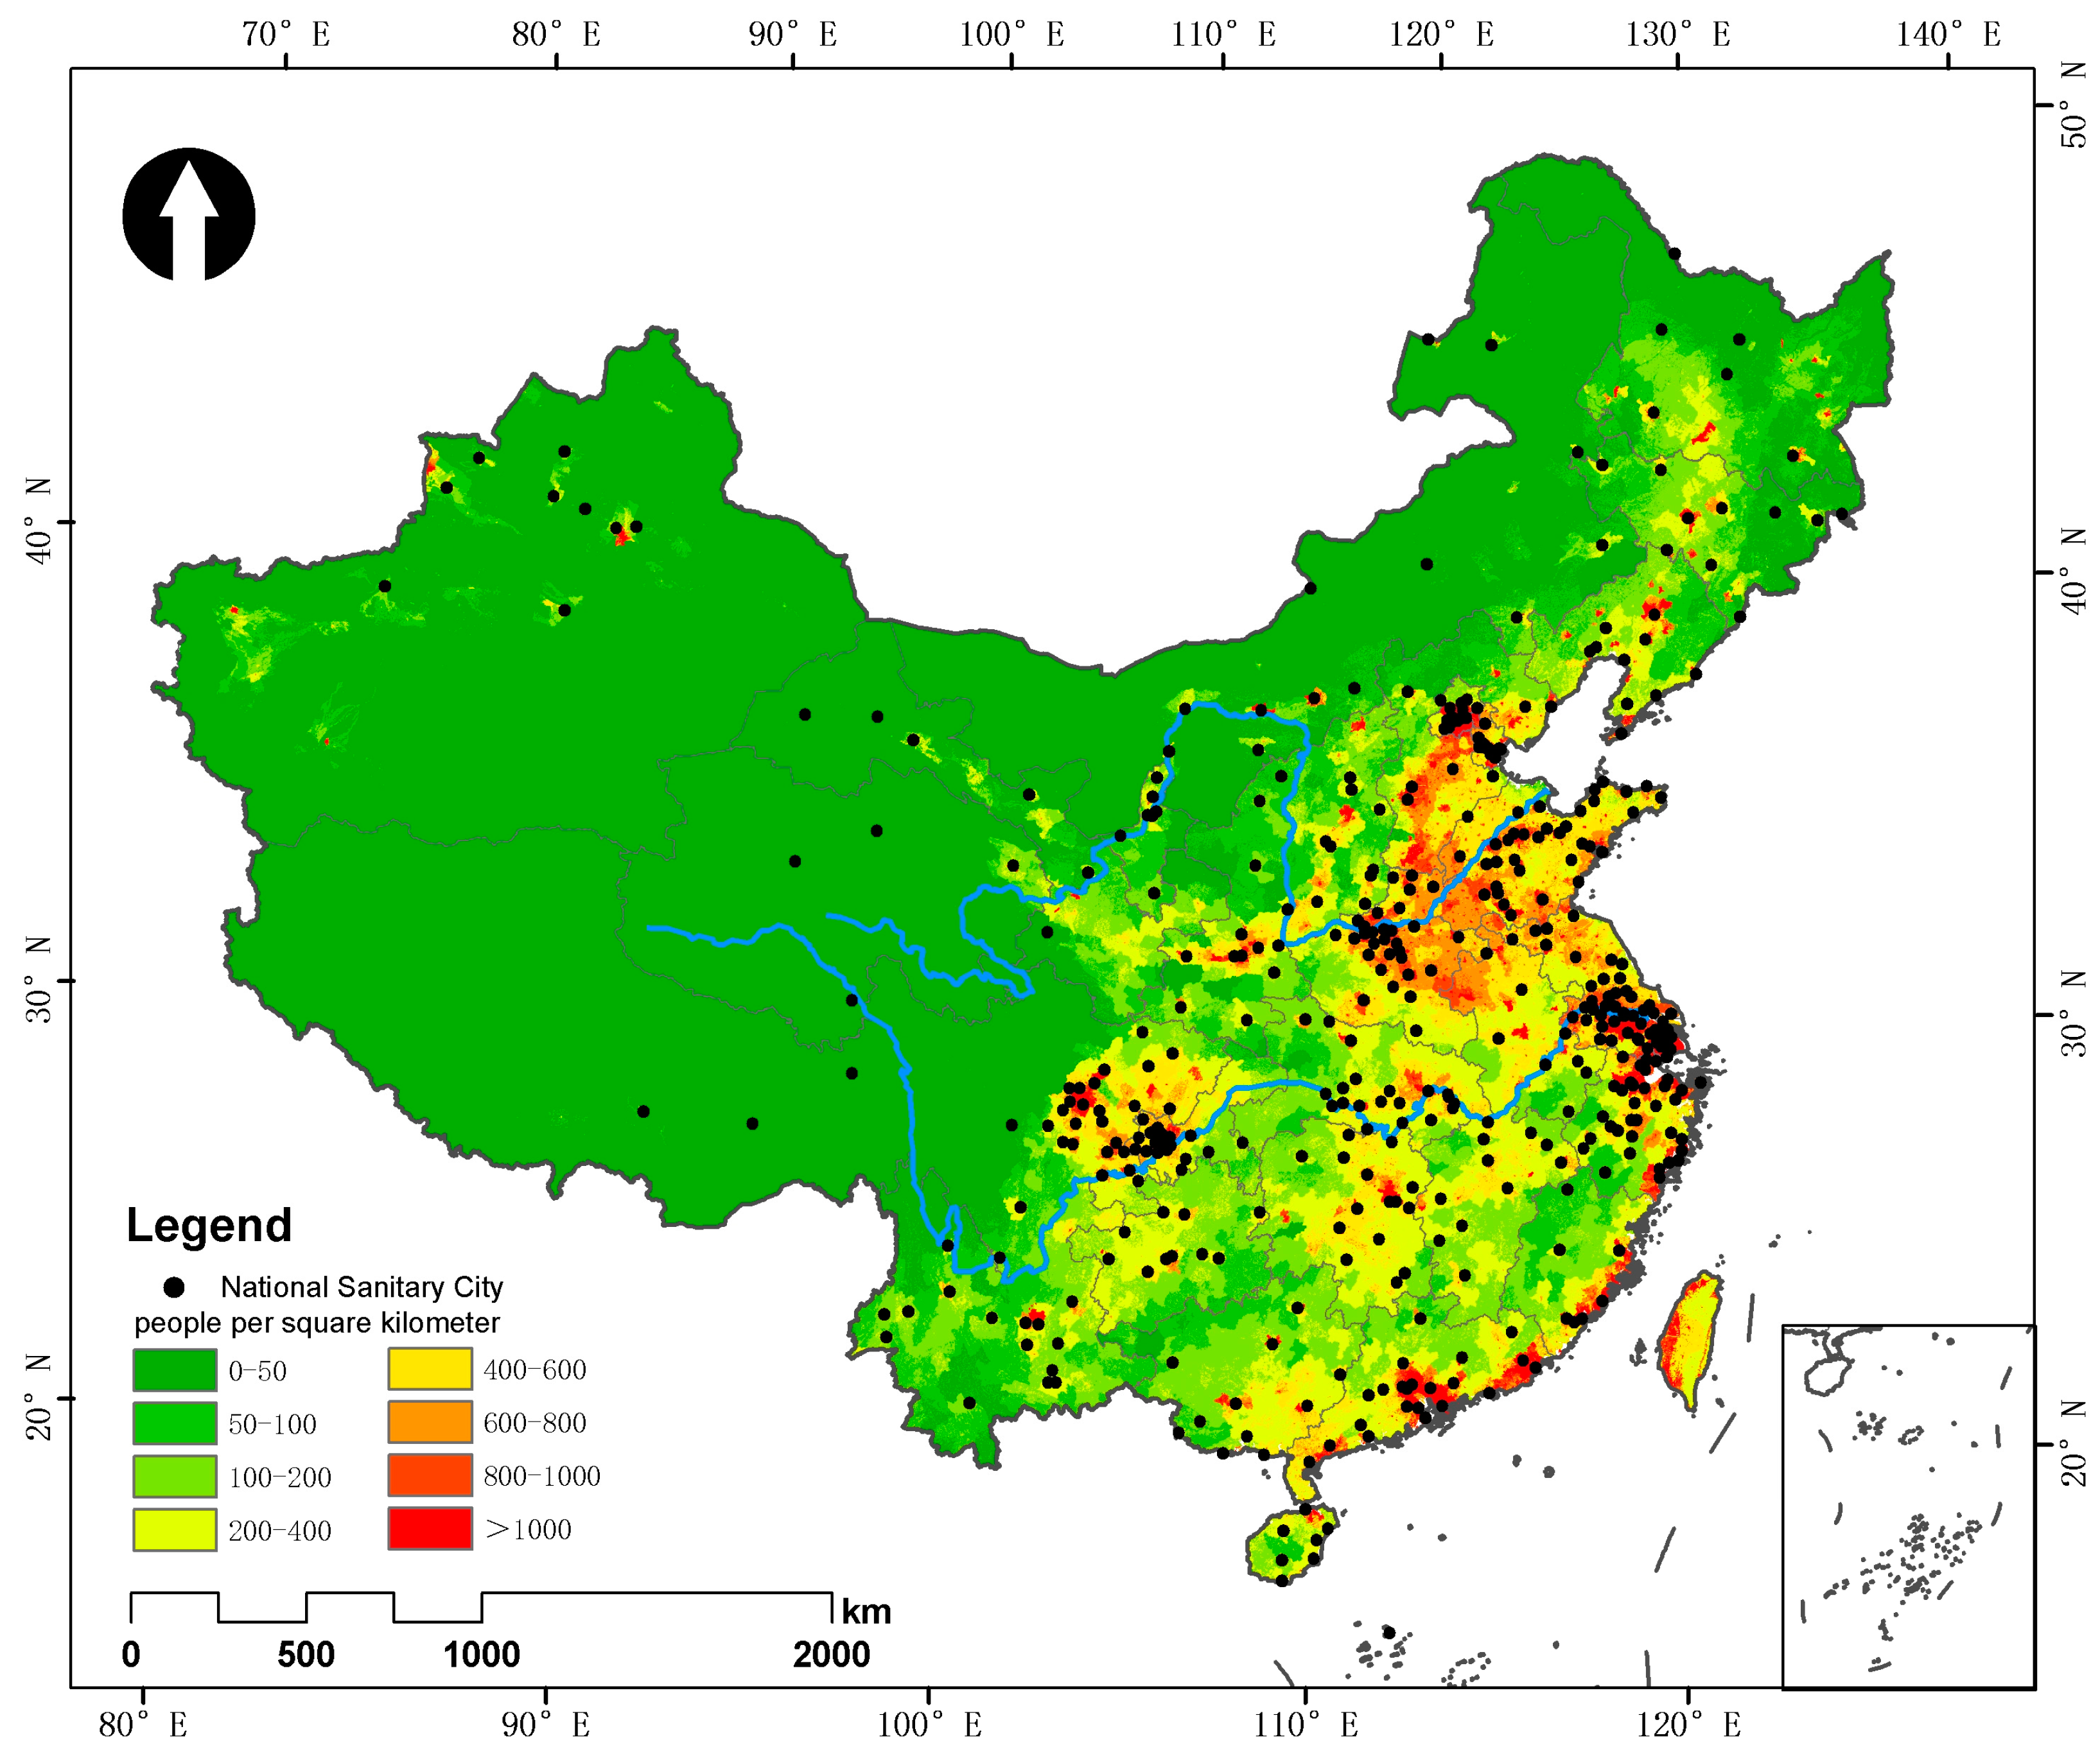
5.2.1. Economic and Population

As shown in Figure 10, the output of the secondary and tertiary industries has the strongest explanatory power (0.80) for the spatial distribution of NSCCs, and this significance is statistically notable. This reflects that the level of economic development is an important foundation for the construction of NSCCs. Economically developed regions such as the Beijing–Tianjin–Hebei area and the Yangtze River Delta are two core areas in the kernel density analysis, where NSCCs are densely distributed. This indicates that higher regional economic development levels help cities meet the standards of the NSCC policy and improve the quality of their public health services and environment. Research analyzing medical geographic big data from 369 cities in China found that GDP growth is highly correlated with optimizing medical resource allocation, highlighting the key role of regional economic strength in medical resource distribution [53]. Additionally, this study found a positive correlation between economic development and a decrease in COVID-19 incidence rates, further underscoring the importance of the economy in improving public health [54]. In a sense, economic development largely determines the construction of NSCCs and the improvement of public health standards.
As indicated in Figure 10, urban population size has explanatory power (0.78) and a statistically significant impact on the spatial distribution of NSCCs. Figure 11 reveals that more than half of NSCCs are located in areas with population densities exceeding 800 people/km2, while only 3% are found in regions with population densities below 100 people/km2. Research shows that a 1% increase in population growth leads to a significant 1.71% increase in public health delivery system density [55]. As the population increases, the growing demand for public health services prompts establishing and expanding more public health facilities. A case study in Lanzhou, Gansu Province, found that health resources are often concentrated in densely populated areas as the urban population increases, forming a “bidirectional proximity” pattern that aligns with residents’ needs [56]. This clustering effect emphasizes the role of the population as a key factor influencing the distribution of urban health resources.

5.2.2. Policy Support and Technological Innovation

The proportion of government spending in total health expenditures reflects the orientation of policy systems and directly affects the quality, accessibility, and efficiency of public health services. Figure 10 indicates that the percentage of total health expenditure from the government has an explanatory power of 0.486 and significantly impacts the spatial distribution of NSCCs. Tan (2017) indicated that increased provincial government health expenditures positively impact public health services [57]. Additionally, Zhang and Rahman (2020) conducted a cross-national analysis of public health spending in China, and the Organization for Economic Cooperation and Development Countries further confirmed the significant role of government financial contributions in enhancing public health standards and reducing the medical burden on citizens [58].
Technological innovation is crucial for advancing public health and the development of NSCCs. Zhang et al. (2018), conducting spatial econometric analysis on 105 Chinese cities, confirmed technological innovation’s positive contribution to urban green development [59]. In this context, the volume of patent applications is particularly important, as it reflects current trends and directions in technological innovation more promptly than the number of patent grants, directly demonstrating technological innovation’s vitality. The spatial distribution of NSCCs is significantly influenced by the number of patent applications, as demonstrated in Figure 10, which shows an explanatory power of 0.697. This finding is further supported by the fact that nearly 50% of NSCCs are located in the eastern region of China. Hu et al. (2023) demonstrated that an increase in low-carbon patent applications in China’s eastern coastal provinces indicates active technological innovation and highlights the emphasis on improving the public health environment [60]. Their study suggested that low-carbon technology innovations play a vital role in mitigating the negative impacts of climate change on public health by reducing carbon emissions and promoting environmentally friendly technologies.

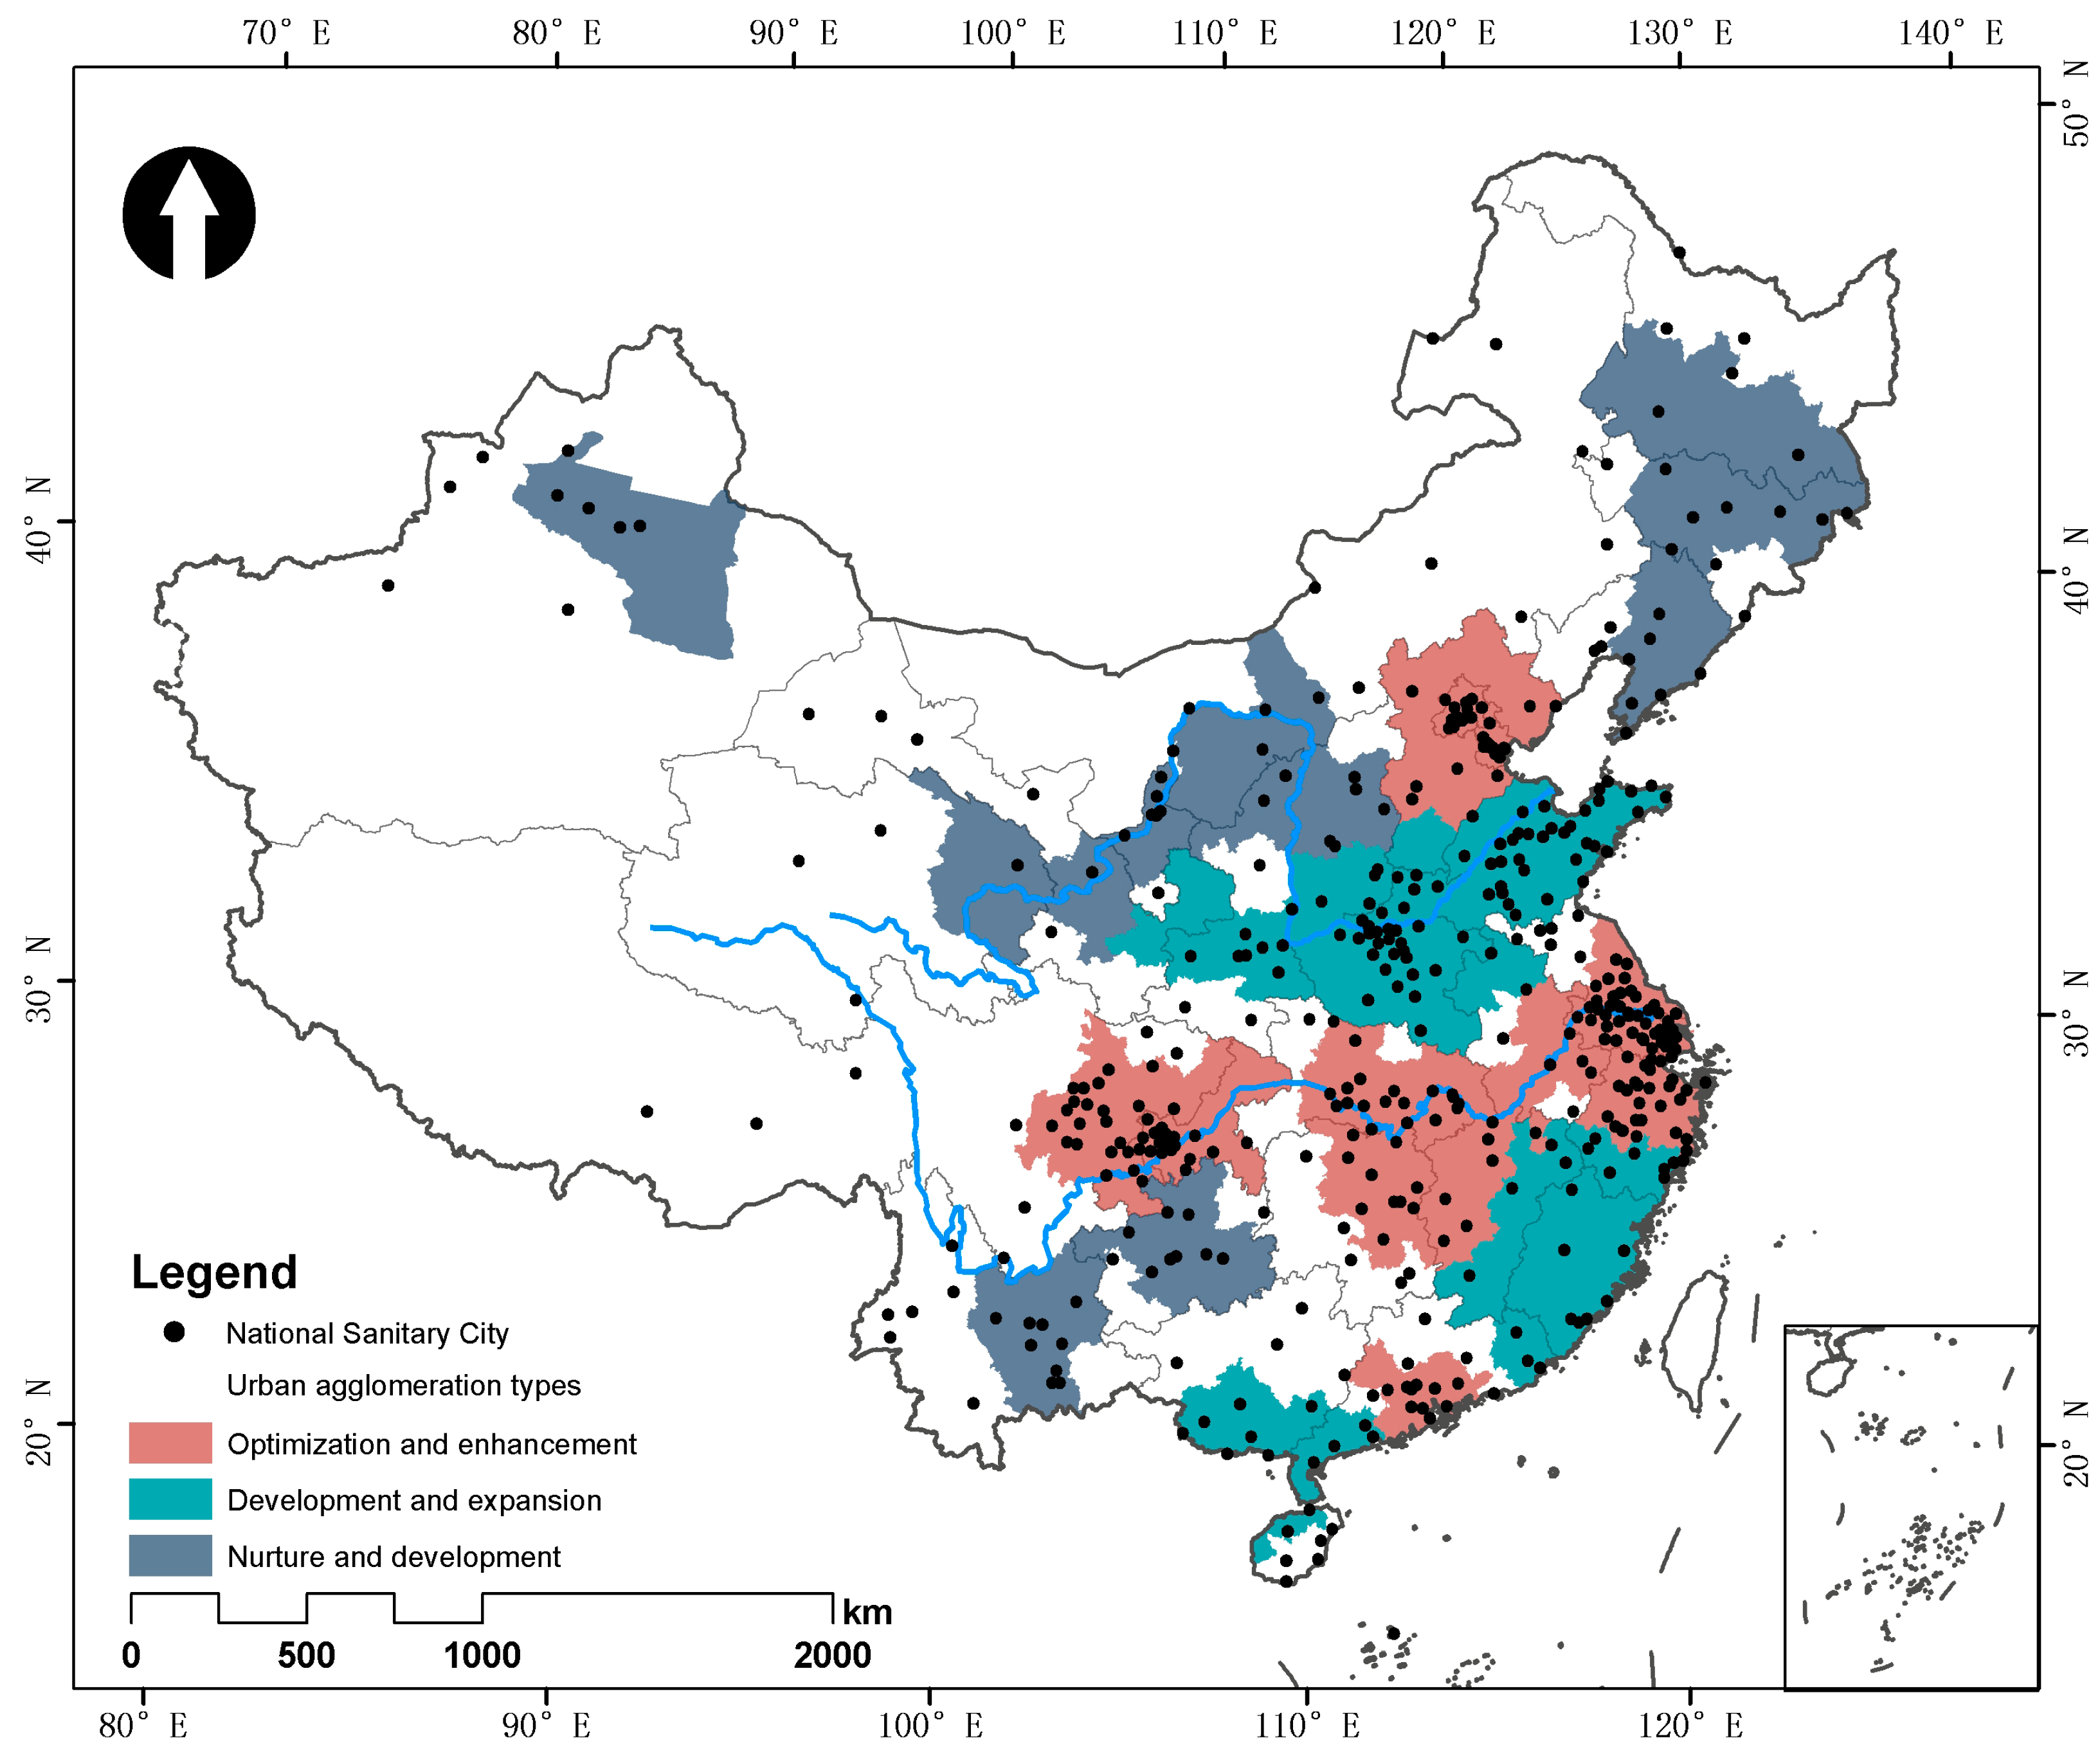
5.2.3. Urban Agglomerations and Urban Environment

Given that local governments need to voluntarily apply for NSCC status, the larger the number of cities within an administrative region, the greater the potential number of NSCCs. As shown in Figure 10, the number of cities within an administrative region significantly impacts the spatial distribution of NSCCs (q = 0.59, p < 0.01). Meanwhile, spatial overlay analysis between NSCCs and Chinese urban agglomerations shows that nearly 80% of NSCCs are located within urban agglomerations, demonstrating a significant spatial alignment between the main distributions of urban agglomerations and NSCCs. Figure 12 illustrates this finding. Additionally, the “14th Five-Year Plan for the National Economic and Social Development of the People’s Republic of China and the Long-Range Objectives Through the Year 2035” categorizes urban agglomeration development into three types: optimization and enhancement, development and expansion, and nurture and development [61]. As shown in Figure 12, nearly 50% of NSCCs are located within urban agglomerations prioritized for optimization and enhancement by the central government, indicating that the accumulation of NSCCs is influenced by both the uneven spatial distribution and the development of cities in China.
Additionally, as shown in Figure 10, the comprehensive utilization rate of general industrial solid waste has an explanatory power of 0.41 for the spatial distribution of NSCCs. It is statistically significant at the 0.05 level. The comprehensive utilization of industrial solid waste reduces environmental burdens and provides new resources for urban sustainable development. Jiangsu, with the highest number of NSCCs, has been promoting waste reuse since 1980. This study indicates that Jiangsu’s implementation of the “Comprehensive Resource Utilization” policy has significantly benefited the environment by promoting the reuse of industrial waste [62].

5.2.4. Medical Services and Resources

The distribution of medical services, particularly general practitioners (GPs), reflects the allocation of healthcare resources across regions. As shown in Figure 10, the explanatory power of the number of GPs per 10,000 people is 0.42, which is statistically significant, indicating that medical services and resources are significant drivers affecting the spatial distribution of NSCCs. A related study analyzed the distribution patterns of GPs, highlighting their importance in ensuring equitable access to health services for populations [63]. Research covering the years 2012 to 2017 examined trends and fairness in the distribution of GPs in China. The study revealed significant nationwide growth in the number of GPs. However, it also identified a pronounced geographical imbalance in the distribution of GPs, particularly a shortage of doctors in the western regions [64]. This disparity reflects the “more in the East, less in the West” pattern of regional medical resource allocation, which corresponds to the spatial distribution of NSCCs.
Furthermore, under China’s “Hospital Tier Management Standards”, hospitals undergo an evaluation process and are classified into three levels, with each further divided into grades A, B, and C; type 3A hospitals represent the highest level of medical service in the country [65]. A spatial overlay analysis of NSCCs with 3A hospitals shows that 6.74% of administrative regions have more than 20 grade 3A hospitals and nearly a quarter of NSCCs are located within these regions, as illustrated in Figure 13. In contrast, 18.33% of administrative regions have no 3A hospitals, and only 6.72% of NSCCs are in these areas. This indicates consistency between the availability of medical services and the spatial distribution of NSCCs. The richness of medical resources, such as the number of 3A hospitals, is correlated with urban health levels. The abundance of high-quality medical resources within a region may be crucial in enhancing urban health standards.

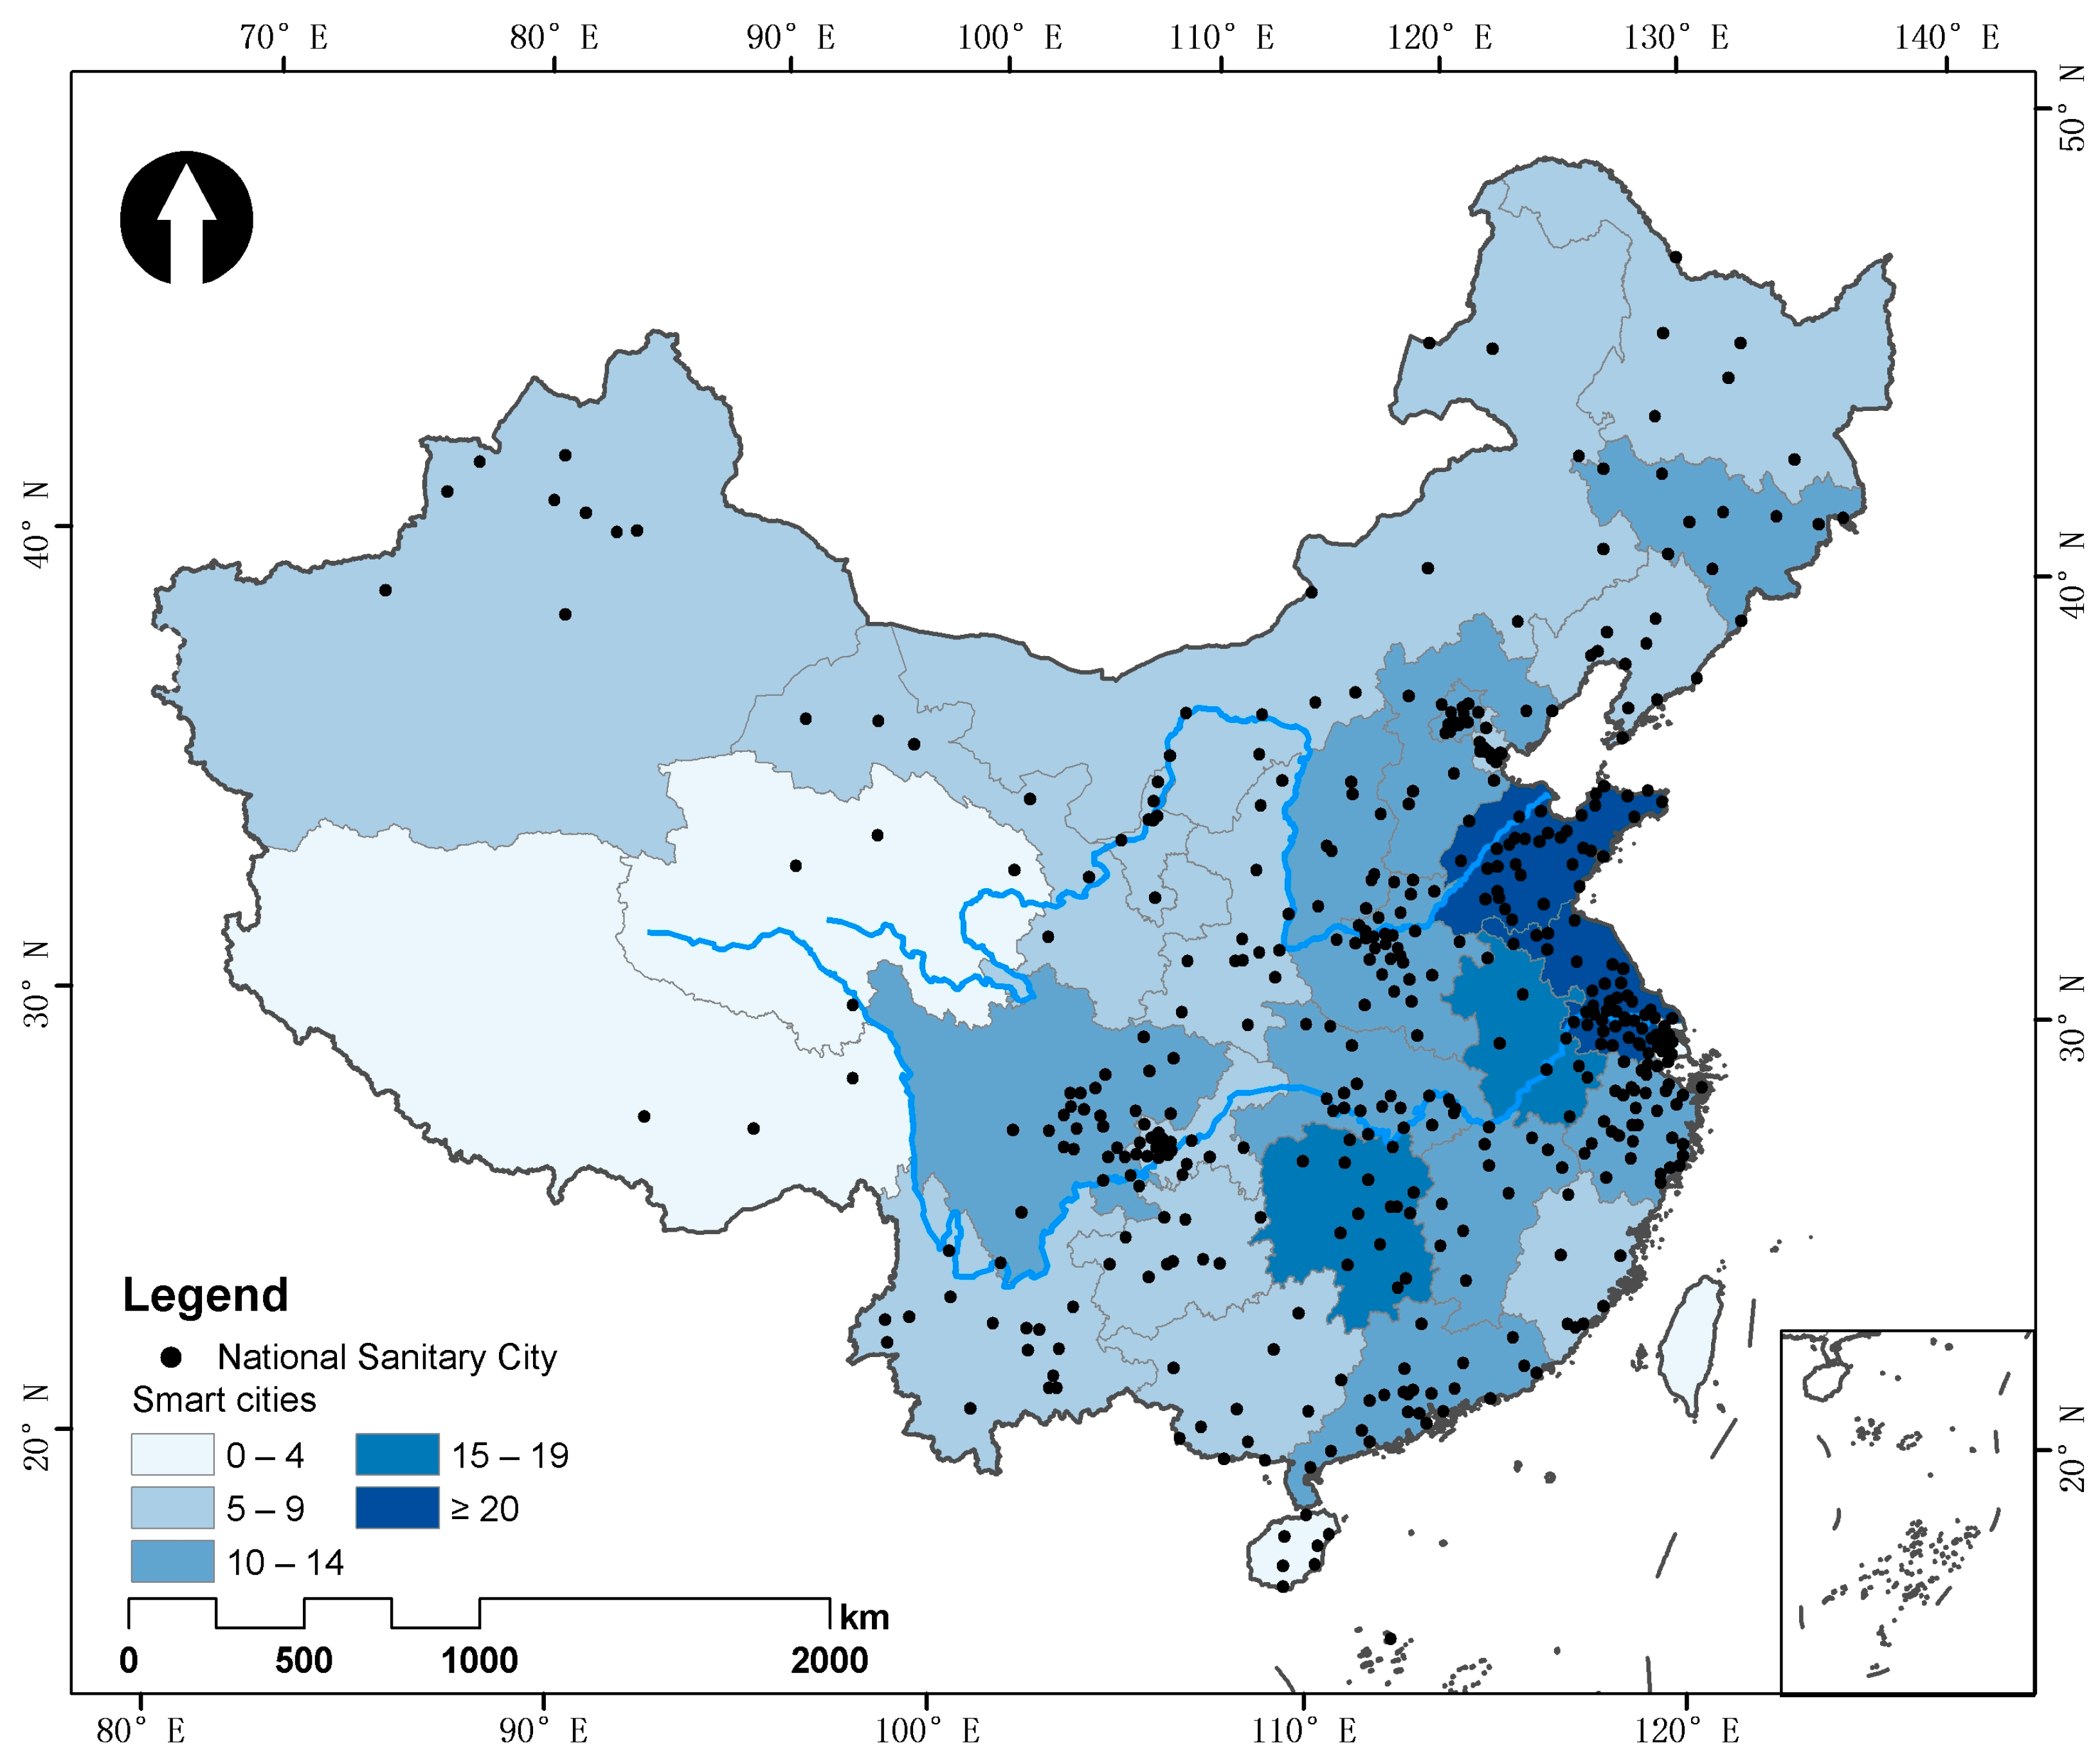
5.2.5. Information Technology and Smart Living

The advancement of information technologies and the development of smart cities have enhanced the digitalization and intelligent management of public health services, improving the efficiency of disease prevention, health monitoring, and medical services and strengthening the emergency response capabilities of urban public health systems. Figure 10 indicates that internet broadband access has an explanatory power of 0.79 and is statistically significant, showing its significant impact on the distribution of NSCCs. Research by Kim et al. (2021) highlighted the effect of broadband internet on supporting informal caregivers by improving access to and the communication of health information, thereby easing their burden and underscoring the importance of addressing disparities in public health and bridging the digital divide [66]. Milinovich et al. (2014) demonstrated that internet searches and social media data can be utilized to monitor infectious diseases, such as influenza and dengue fever. They emphasized the potential of such data collection and analysis to optimize resource allocation and identify epidemic trends, enhancing the response capacity to public health emergencies [67].
In 2012, the State Council issued the “Interim Management Measures for National Smart City Pilot Projects”, and, currently, the Ministry of Housing and Urban–Rural Development has announced 290 national-level smart city pilots. Figure 10 shows that the construction of smart cities is closely related to the distribution of NSCCs and is a significant driving factor (q = 0.54). Wu et al. (2022) and Wang et al. (2022) indicated that smart cities, by optimizing medical service utilization and significantly reducing haze pollution, not only effectively improve residents’ health but also enhance urban environmental quality [68,69]. A systematic review by Rocha et al. (2019) further emphasizes the crucial role of smart city infrastructure in monitoring population health, environmental conditions, and promoting healthy lifestyles [70]. Additionally, the spatial overlay analysis of NSCCs and national-level smart cities, as depicted in Figure 14, shows that 93% of NSCCs are located in provincial administrative regions with more than five national smart cities and 67% in regions with more than ten smart cities. This demonstrates the consistency between the prevalence of smart health facilities and the spatial distribution of NSCCs. Since becoming an NSCC in 1995, Hangzhou’s developments in the digital economy and smart city initiatives have significantly driven its progress. Innovations like the “City Brain” monitoring system, the epidemic management platform co-built with Alibaba, and the innovative “Health Code” system have shown effectiveness in controlling COVID-19 infection rates and rapid economic recovery and enhanced the efficiency and dynamic response of public health management [71].

6. Discussion

The NSCC policy, a strategic intervention implemented by the Chinese government, was designed to improve public health and is a key development strategy for achieving health for all within China. After exploring the significance and benefits of the NSCC policy, this study utilized GIS spatial analysis methods and R analytical tools to investigate the spatial distribution of 462 NSCCs in China, as shown in Table 4, and the driving factors behind them. The main research findings are presented below.
This study examined the NSCC policy, a key model of the Health Campaign in China over the past 30 years. The policy’s latest criteria promote the integration of health into all policies, emphasizing the incorporation of life-cycle health management in urban planning, construction, and management, signalling a strategic shift toward health-centred development. This comprehensive approach not only strengthens urban resilience against public health challenges but also offers valuable insights for global urban health governance.
The rapid increase in the number of NSCCs highlights China’s emphasis on urban health development during the urbanization process. Although the development of NSCCs trends toward regional balance, their current spatial distribution is uneven, with a greater density of NSCCs in the eastern regions compared to the central and western regions. These cities are mostly located in economically developed regions like the Yangtze River Delta and the Beijing–Tianjin–Hebei area, displaying a “two poles, two cores” distribution model. This distribution impacts not only health education and public health facilities but also disease prevention and environmental protection, directly affecting residents’ health and quality of life. The geographical imbalance may lead to disparities in access to and the utilization of health resources, resulting in significant health inequalities between cities. For instance, life expectancy varies significantly across China’s regions. Residents in the east, particularly in coastal areas, tend to live longer than those in the west. The Yangtze River Delta and Beijing–Tianjin–Hebei urban agglomerations have a higher life expectancy than the national average, while central and western regions generally have lower life expectancy [72]. Additionally, the results of this study demonstrate that the spatial heterogeneity in the distribution of NSCCs is influenced by multiple factors. Natural conditions such as climate and topography contribute to shaping the fundamental distribution patterns, while socioeconomic factors like economic levels, information technology, and population size amplify these imbalances. Among these factors, the disparity in economic levels is a significant factor influencing the uneven spatial distribution of NSCCs. Initially, NSCCs were highly concentrated in the eastern region, likely due to the greater degree of regional development inequality in China [73], with the eastern region being more developed than the central and western regions. However, through the implementation of targeted policies and investments, such as the “Rise of Central China” and “Great Western Development” strategies, the number of NSCCs in the central and western regions has increased significantly. Specifically, the Great Western Development policy notably enhanced the ecological foundation, service capacity, and residents’ well-being in cities through systematic interventions, greatly promoting the healthy development of cities in the western region [74,75]. Although the health gap between China’s eastern and western regions is narrowing [39], the average level of medical resources in western China is lower than in other regions [76,77]. This aligns with the broader pattern of socioeconomic deprivation in western China [78]. Policymakers and policy implementers should prioritize addressing regional disparities when advancing the development of healthy cities. By optimizing resource allocation strategies, strengthening infrastructure development, and enhancing healthcare service levels, they can promote more balanced urban development.

7. Conclusions

This study began with a qualitative analysis of the origin and criteria of the NSCC policy, emphasizing the importance and significance of its implementation. Subsequently, it quantitatively examined the spatial distribution characteristics and the main driving factors of NSCCs.
The NSCC policy has shifted from initially improving urban sanitation and enhancing public health to now emphasizing the co-construction and sharing of health for all. This evolution not only reflects China’s continuous emphasis on strengthening public health services and health infrastructure during urbanization but also demonstrates the government’s strategic adjustments in promoting health equity and resource equalization. Moreover, this policy not only improves public health and urban environments but also enhances the efficiency of urban governance and social welfare, offering effective solutions for other high-density cities facing environmental and public safety challenges.
Currently, the spatial distribution of NSCCs is uneven, primarily characterized by significant spatial clustering. Specifically, on a regional scale, it displays two core-density areas and two high-density areas, surrounded by scattered medium- and low-density areas, overall showing a laminar diffusion trend. Nationally, the NSCC distribution in the eastern regions is denser than in the west. Natural and social environmental factors are the main reasons for these policy pattern differences. Topography, climate, and other natural factors affect the spatial distribution of NSCCs to varying degrees. At the same time, socioeconomic factors, urban environments, and healthcare services are significant influencers of their distribution. Although the intent of the NSCC policy is to uniformly strengthen the public health system, the results reveal considerable regional variations. This regional disparity highlights the current policy’s limitations in achieving national health equity, particularly as regions with lower socioeconomic development levels face greater challenges.
This study still has many shortcomings. Firstly, this study focused on urban-level analysis, limiting our understanding of the NSCC policy’s impact on towns and villages. Future research should examine its influence on counties and towns to assess its effectiveness and mechanisms across different levels. Secondly, this study only analyzed the spatial distribution of NSCCs from a macroscopic perspective. While these methods reveal NSCC spatial patterns and their influencing factors, they emphasize associations rather than causal mechanisms. Thus, future research should include meso- and micro-level analyses, employing advanced methods (such as machine learning) and incorporating longitudinal data to examine the complex dynamics influencing NSCC policy implementation. Additionally, analyzing natural and socio-environmental factors separately may overlook their complex interactions; future research should explore integrated modelling approaches to better understand their impact on NSCCs.
This research not only emphasizes the role of geographical and socioeconomic factors in influencing policy outcomes but also reveals the urgent need for policy adjustments to address these imbalances. These findings provide critical evidence for policymakers and urban planners to improve health equity. Through recognizing the factors affecting the distribution of NSCCs, more refined and comprehensive policy interventions can be formulated based on the specific conditions of different regions. This is crucial for promoting balanced regional development, ensuring that all urban residents have equal access to health resources, and further promoting the sustainable development of urban environments.

Author Contributions

Conceptualization, Jiazhen Zhang and Jun Cai; methodology, Jiazhen Zhang; software, Yujia Deng; data curation, Yujia Deng and Lixia Feng; writing—original draft preparation, Yujia Deng; writing—review and editing, Jeremy Cenci, Jiazhen Zhang and Jun Cai; visualization, Lixia Feng; project administration, Jiazhen Zhang and Jun Cai. All authors have read and agreed to the published version of the manuscript.

Funding

This research was funded by the Sichuan Science and Technology Program, grant number 2025ZNSFSC1183.

Data Availability Statement

Not applicable.

Conflicts of Interest

The authors declare no conflict of interest.

References

  1. Kundu, D.; Pandey, A.K. World Urbanisation: Trends and Patterns. In Developing National Urban Policies: Ways Forward to Green and Smart Cities; Kundu, D., Sietchiping, R., Kinyanjui, M., Eds.; Springer Nature: Singapore, 2020; pp. 13–49. ISBN 978-981-15-3738-7. [Google Scholar]
  2. Singh, N.; Singh, S.; Mall, R.K. Chapter 17–Urban Ecology and Human Health: Implications of Urban Heat Island, Air Pollution and Climate Change Nexus. In Urban Ecology; Verma, P., Singh, P., Singh, R., Raghubanshi, A.S., Eds.; Elsevier: Amsterdam, The Netherlands, 2020; pp. 317–334. ISBN 978-0-12-820730-7. [Google Scholar]
  3. Chaudhry, D. Climate Change and Health of the Urban Poor: The Role of Environmental Justice. J. Clim. Change Health 2024, 15, 100277. [Google Scholar] [CrossRef]
  4. Mouratidis, K. Urban Planning and Quality of Life: A Review of Pathways Linking the Built Environment to Subjective Well-Being. Cities 2021, 115, 103229. [Google Scholar] [CrossRef]
  5. McGreevy, M.; Harris, P.; Delaney-Crowe, T.; Fisher, M.; Sainsbury, P.; Riley, E.; Baum, F. How Well Do Australian Government Urban Planning Policies Respond to the Social Determinants of Health and Health Equity? Land Use Policy 2020, 99, 105053. [Google Scholar] [CrossRef]
  6. Li, X.; Song, J.; Lin, T.; Dixon, J.; Zhang, G.; Ye, H. Urbanization and Health in China, Thinking at the National, Local and Individual Levels. Environ. Health 2016, 15, 113–123. [Google Scholar] [CrossRef] [PubMed]
  7. Du, P.; Sun, B.; Pan, L.J.; Cheng, Y.B.; Li, T.T.; Wang, X.L.; Shi, L.W.; Yao, X.Y.; Shi, X.M. Achievements and Prospects on Environmental Health and Sanitary Engineering in China. Zhonghua Yu Fang Yi Xue Za Zhi Chin. J. Prev. Med. 2019, 53, 865–870. [Google Scholar] [CrossRef]
  8. Li, Y.; Yang, H. The Incentive Effect of Creating a National Health City on the Ecological Welfare Performance: Based on the Evidence of Yangtze River Delta in China. Environ. Sci. Pollut. Res. 2023, 30, 83735–83759. [Google Scholar] [CrossRef]
  9. Yin, S.; Chen, W.Y.; Liu, C. Urban Forests as a Strategy for Transforming towards Healthy Cities. Urban. For. Urban. Green. 2023, 81, 127871. [Google Scholar] [CrossRef]
  10. Palutturi, S.; Saleh, L.M.; Rachmat, M.; Malek, J.A.; Nam, E.W. Principles and Strategies for Aisles Communities Empowerment in Creating Makassar Healthy City, Indonesia. Gac. Sanit. 2021, 35, S46–S48. [Google Scholar] [CrossRef]
  11. Bafarasat, A.; Cheshmehzangi, A.; Ankowska, A. A Set of 99 Healthy City Indicators for Application in Urban Planning and Design. Sustain. Dev. 2023, 31, 1978–1989. [Google Scholar] [CrossRef]
  12. Zhao, M.; Qin, W.; Zhang, S.; Qi, F.; Li, X.; Lan, X. Assessing the Construction of a Healthy City in China: A Conceptual Framework and Evaluation Index System. Public Health 2023, 220, 88–95. [Google Scholar] [CrossRef]
  13. Ali, M.; Rahaman, M.; Hossain, S. Urban Green Spaces for Elderly Human Health: A Planning Model for Healthy City Living. Land Use Policy 2022, 114, 105970. [Google Scholar] [CrossRef]
  14. Capolongo, S.; Rebecchi, A.; Dettori, M.; Appolloni, L.; Azara, A.; Buffoli, M.; Capasso, L.; Casuccio, A.; Conti, G.; D’Amico, A.; et al. Healthy Design and Urban Planning Strategies, Actions, and Policy to Achieve Salutogenic Cities. Int. J. Environ. Res. Public Health 2018, 15, 2698. [Google Scholar] [CrossRef]
  15. Xie, Y.; Meng, X.; Cenci, J.; Zhang, J. Spatial Pattern and Formation Mechanism of Rural Tourism Resources in China: Evidence from 1470 National Leisure Villages. ISPRS Int. J. Geo-Inf. 2022, 11, 455. [Google Scholar] [CrossRef]
  16. Zhang, Z.; Cenci, J.; Zhang, J. Policies for Equity in Access to Urban Green Space: A Spatial Perspective of the Chinese National Forest City Policy. Forests 2024, 15, 608. [Google Scholar] [CrossRef]
  17. Tao, W.; Zeng, Z.; Dang, H.; Li, P.; Chuong, L.; Yue, D.; Wen, J.; Zhao, R.; Li, W.; Kominski, G. Towards Universal Health Coverage: Achievements and Challenges of 10 Years of Healthcare Reform in China. BMJ Glob. Health 2020, 5, e002087. [Google Scholar] [CrossRef] [PubMed]
  18. Chen, J.; Lin, Z.; Li, L.; Li, J.; Wang, Y.; Pan, Y.; Yang, J.; Xu, C.; Zeng, X.; Xie, X.; et al. Ten Years of China’s New Healthcare Reform: A Longitudinal Study on Changes in Health Resources. BMC Public Health 2021, 21, 2272. [Google Scholar] [CrossRef] [PubMed]
  19. Fu, H.; Dai, J.; Gao, J.; Jia, Y.; Zheng, P. Healthy City Construction in China: Accomplishments and Prospects. Chin. J. Public Health 2019, 35, 1285–1288. [Google Scholar] [CrossRef]
  20. Liu, S.R.; Wang, H.; Xi, T.Y. Administrative Bidding, Performance, and Political Incentives——Evidence from National Health Cities. J. Public Manag. 2020, 17, 10–20. [Google Scholar] [CrossRef]
  21. Bai, Y.; Zhang, Y.; Zotova, O.; Pineo, H.; Siri, J.; Liang, L.; Luo, X.; Kwan, M.-P.; Ji, J.; Jiang, X.; et al. Healthy Cities Initiative in China: Progress, Challenges, and the Way Forward. Lancet Reg. Health West. Pac. 2022, 27, 100539. [Google Scholar] [CrossRef]
  22. Announcement of the 2021 National Sanitary City and Town Reassessment Results by the National Patriotic Health Campaign Committee. Available online: http://www.nhc.gov.cn/guihuaxxs/gongwen1/202202/253a2c03dbee4cf9a952238236fda163.shtml (accessed on 7 August 2024).
  23. Zheng, W.; Yao, H.; Yu, S.; Liu, J.; Hu, Y.; Wang, J. Residents’ Sense of Acquisition and Influencing Factors in China’s Sanitary City Initiative. Chin. J. Epidemiol. 2023, 44, 457–462. [Google Scholar] [CrossRef]
  24. Wang, Y.; Pei, R.; Gu, X.; Liu, B.; Liu, L. Has the Healthy City Pilot Policy Improved Urban Health Development Performance in China? Evidence from a Quasi-Natural Experiment. Sustain. Cities Soc. 2023, 88, 104268. [Google Scholar] [CrossRef]
  25. Tang, G.; Lin, M.; Xu, Y.; Li, J.; Chen, L. Impact of Rating and Praise Campaigns on Local Government Environmental Governance Efficiency: Evidence from the Campaign of Establishment of National Sanitary Cities in China. PLoS ONE 2021, 16, e0253703. [Google Scholar] [CrossRef]
  26. Yue, D.; Ruan, S.; Xu, J.; Zhu, W.; Zhang, L.; Cheng, G.; Meng, Q. Impact of the China Healthy Cities Initiative on Urban Environment. J. Urban Health 2017, 94, 149–157. [Google Scholar] [CrossRef] [PubMed]
  27. Gan, T.; Zhang, C.; Shen, R.; Li, B. Can the Establishment of National Sanitary Cities Better Resist the Impact of COVID-19? Front. Public Health 2023, 11, 1041355. [Google Scholar] [CrossRef]
  28. Zhou, M.; Wang, H.; Zeng, X.; Yin, P.; Zhu, J.; Chen, W.; Li, X.; Wang, L.; Wang, L.; Liu, Y.; et al. Mortality, Morbidity, and Risk Factors in China and Its Provinces, 1990–2017: A Systematic Analysis for the Global Burden of Disease Study 2017. Lancet 2019, 394, 1145–1158. [Google Scholar] [CrossRef] [PubMed]
  29. Barber, R.M.; Fullman, N.; Sorensen, R.J.D.; Bollyky, T.; McKee, M.; Nolte, E.; Abajobir, A.A.; Abate, K.H.; Abbafati, C.; Abbas, K.M.; et al. Healthcare Access and Quality Index Based on Mortality from Causes Amenable to Personal Health Care in 195 Countries and Territories, 1990–2015: A Novel Analysis from the Global Burden of Disease Study 2015. Lancet 2017, 390, 231–266. [Google Scholar] [CrossRef]
  30. The 2023 Statistical Bulletin on the Development of China’s Health Sector. Available online: https://www.gov.cn/lianbo/bumen/202408/content_6971241.htm (accessed on 4 September 2024).
  31. Yang, G. What Is Historical Political Science? Chin. Political Sci. Rev. 2022, 7, 1–28. [Google Scholar] [CrossRef]
  32. Feng, D.; Bao, W.; Yang, Y.; Fu, M. How Do Government Policies Promote Greening? Evidence from China. Land Use Policy 2021, 104, 105389. [Google Scholar] [CrossRef]
  33. Ding, A.; Cenci, J.; Zhang, J. Links between the Pandemic and Urban Green Spaces, a Perspective on Spatial Indices of Landscape Garden Cities in China. Sustain. Cities Soc. 2022, 85, 104046. [Google Scholar] [CrossRef]
  34. Dumais, G.; Ellison, G.; Glaeser, E.L. Geographic Concentration as a Dynamic Process. Rev. Econ. Stat. 2002, 84, 193–204. [Google Scholar] [CrossRef]
  35. Zhang, J.; Cenci, J.; Becue, V.; Koutra, S. Research of the Industrial Heritage Category and Spatial Density Distribution in Walloon Region and Northeast China. WIT Trans. Built Environ. 2021, 203, 285. [Google Scholar] [CrossRef]
  36. Wang, X.; Zhang, J.; Cenci, J.; Becue, V. Spatial Distribution Characteristics and Influencing Factors of the World Architectural Heritage. Heritage 2021, 4, 2942–2959. [Google Scholar] [CrossRef]
  37. Song, Y.; Wang, J.; Ge, Y.; Xu, C. An Optimal Parameters-Based Geographical Detector Model Enhances Geographic Characteristics of Explanatory Variables for Spatial Heterogeneity Analysis: Cases with Different Types of Spatial Data. GI Sci. Remote Sens. 2020, 57, 593–610. [Google Scholar] [CrossRef]
  38. Yang, Y.; Zhang, L.; Zhang, X.; Yang, M.; Zou, W. Efficiency Measurement and Spatial Spillover Effect of Provincial Health Systems in China: Based on the Two-Stage Network DEA Model. Front. Public Health 2022, 10, 952975. [Google Scholar] [CrossRef]
  39. Wang, K.; Zhang, Q.; Zhang, J. Analysis on Spatial Differences and Changes of Health Level in China. Adv. Appl. Math. 2022, 11, 7524–7532. [Google Scholar] [CrossRef]
  40. Ziafati Bafarasat, A.; Sharifi, A. How to Achieve a Healthy City: A Scoping Review with Ten City Examples. J. Urban Health 2024, 101, 120–140. [Google Scholar] [CrossRef]
  41. Xie, S.; Yin, G.; Wei, W.; Sun, Q.; Zhang, Z. Spatial–Temporal Change in Paddy Field and Dryland in Different Topographic Gradients: A Case Study of China during 1990–2020. Land 2022, 11, 1851. [Google Scholar] [CrossRef]
  42. Wang, X.-C.; Klemeš, J.J.; Dong, X.; Fan, W.; Xu, Z.; Wang, Y.; Varbanov, P.S. Air Pollution Terrain Nexus: A Review Considering Energy Generation and Consumption. Renew. Sustain. Energy Rev. 2019, 105, 71–85. [Google Scholar] [CrossRef]
  43. Xi, C.; Qian, T.; Chi, Y.; Chen, J.; Wang, J. Relationship between Settlements and Topographical Factors: An Example from Sichuan Province, China. J. Mt. Sci. 2018, 15, 2043–2054. [Google Scholar] [CrossRef]
  44. Chen, R.; Yin, P.; Wang, L.; Liu, C.; Niu, Y.; Wang, W.; Jiang, Y.; Liu, Y.; Liu, J.; Qi, J.; et al. Association between Ambient Temperature and Mortality Risk and Burden: Time Series Study in 272 Main Chinese Cities. BMJ 2018, 363, k4306. [Google Scholar] [CrossRef]
  45. Yao, N.; Li, Y.; Lei, T.; Peng, L. Drought Evolution, Severity and Trends in Mainland China over 1961–2013. Sci. Total Environ. 2018, 616–617, 73–89. [Google Scholar] [CrossRef] [PubMed]
  46. Liu, J.; Liu, T.; Burkart, K.G.; Wang, H.; He, G.; Hu, J.; Xiao, J.; Yin, P.; Wang, L.; Liang, X.; et al. Mortality Burden Attributable to High and Low Ambient Temperatures in China and Its Provinces: Results from the Global Burden of Disease Study 2019. Lancet Reg. Health West. Pac. 2022, 24, 100493. [Google Scholar] [CrossRef] [PubMed]
  47. Gao, W. A Case Study of the Relationship Between Vegetation Coverage and Urban Heat Island in a Coastal City by Applying Digital Twins. Front. Plant Sci. 2022, 13, 861768. [Google Scholar]
  48. Zhou, M.; Huang, Y.; Li, G. Changes in the Concentration of Air Pollutants before and after the COVID-19 Blockade Period and Their Correlation with Vegetation Coverage. Environ. Sci. Pollut. Res. 2021, 28, 23405–23419. [Google Scholar] [CrossRef] [PubMed]
  49. Crane, M.; Lloyd, S.; Haines, A.; Ding, D.; Hutchinson, E.; Belesova, K.; Davies, M.; Osrin, D.; Zimmermann, N.; Capon, A.; et al. Transforming Cities for Sustainability: A Health Perspective. Environ. Int. 2021, 147, 106366. [Google Scholar] [CrossRef]
  50. Johnston, B.M.; Burke, S.; Kavanagh, P.M.; O’Sullivan, C.; Thomas, S.; Parker, S. Moving beyond Formulae: A Review of International Population-Based Resource Allocation Policy and Implications for Ireland in an Era of Healthcare Reform. HRB Open Res. 2021, 4, 121. [Google Scholar] [CrossRef]
  51. Marmot, M. Health Equity in England: The Marmot Review 10 Years On. BMJ 2020, 368, m693. [Google Scholar] [CrossRef]
  52. Bellini, P.; Nesi, P.; Pantaleo, G. IoT-Enabled Smart Cities: A Review of Concepts, Frameworks and Key Technologies. Appl. Sci. 2022, 12, 1607. [Google Scholar] [CrossRef]
  53. Wan, S.; Chen, Y.; Xiao, Y.; Zhao, Q.; Li, M.; Wu, S. Spatial Analysis and Evaluation of Medical Resource Allocation in China Based on Geographic Big Data. BMC Health Serv. Res. 2021, 21, 1084. [Google Scholar] [CrossRef]
  54. You, H.; Wu, X.; Guo, X. Distribution of COVID-19 Morbidity Rate in Association with Social and Economic Factors in Wuhan, China: Implications for Urban Development. Int. J. Environ. Res. Public Health 2020, 17, 3417. [Google Scholar] [CrossRef]
  55. Smith, S.A.; Mays, G.P.; Felix, H.C.; Tilford, J.M.; Curran, G.M.; Preston, M.A. Impact of Economic Constraints on Public Health Delivery Systems Structures. Am. J. Public Health 2015, 105, e48–e53. [Google Scholar] [CrossRef] [PubMed]
  56. Ma, X.; Bai, Y.; Zhang, Z. Spatial Matching Analysis of Urban Health Resources and Population Distribution--A Case Study of the Central District of Lanzhou City. Resour. Dev. Mark. Chin. J. 2023, 39, 1619–1627. [Google Scholar] [CrossRef]
  57. Tan, X. Explaining Provincial Government Health Expenditures in China: Evidence from Panel Data 2007–2013. China Financ. Econ. Rev. 2017, 5, 9. [Google Scholar] [CrossRef]
  58. Zhang, D.; Rahman, K.M.A. Government Health Expenditure, OUT-OF-POCKET Payment and Social Inequality: A CROSS-NATIONAL Analysis of China and OECD Countries. Int. J. Health Plan. Manag. 2020, 35, 1111–1126. [Google Scholar] [CrossRef]
  59. Zhang, J.; Chang, Y.; Zhang, L.; Li, D. Do Technological Innovations Promote Urban Green Development?—A Spatial Econometric Analysis of 105 Cities in China. J. Clean. Prod. 2018, 182, 395–403. [Google Scholar] [CrossRef]
  60. Hu, F.; Qiu, L.; Xiang, Y.; Wei, S.; Sun, H.; Hu, H.; Weng, X.; Mao, L.; Zeng, M. Spatial Network and Driving Factors of Low-Carbon Patent Applications in China from a Public Health Perspective. Front. Public Health 2023, 11, 1121860. [Google Scholar] [CrossRef]
  61. 14th Five-Year Plan for the National Economic and Social Development of the People’s Republic of China and the Long-Range Objectives Through the Year 2035. Available online: http://www.gjbmj.gov.cn/n1/2021/0315/c409080-32051071.html (accessed on 15 August 2024).
  62. Zhu, J.; Chertow, M.R. Greening Industrial Production through Waste Recovery: “Comprehensive Utilization of Resources” in China. Environ. Sci. Technol. 2016, 50, 2175–2182. [Google Scholar] [CrossRef] [PubMed]
  63. Shu, Z.; Wang, Z.; Chen, R.; Li, M.; Lou, J.; Huang, X.; Wu, J.; Jing, L. Allocation and Development of the General Practitioner Workforce in China from 2012 to 2015: A Literature Review. Lancet 2017, 390, S91. [Google Scholar] [CrossRef]
  64. Yu, Q.; Yin, W.; Huang, D.; Sun, K.; Chen, Z.; Guo, H.; Wu, D. Trend and Equity of General Practitioners’ Allocation in China Based on the Data from 2012–2017. Hum. Resour. Health 2021, 19, 20. [Google Scholar] [CrossRef]
  65. Liu, H.; Fang, C.; Fan, Y. Mapping the Inequalities of Medical Resource Provision in China. Reg. Stud. Reg. Sci. 2020, 7, 568–570. [Google Scholar] [CrossRef]
  66. Kim, H.; Mahmood, A.; Goldsmith, J.V.; Chang, H.; Kedia, S.; Chang, C.F. Access to Broadband Internet and Its Utilization for Health Information Seeking and Health Communication among Informal Caregivers in the United States. J. Med. Syst. 2021, 45, 24. [Google Scholar] [CrossRef] [PubMed]
  67. Milinovich, G.J.; Williams, G.M.; Clements, A.C.A.; Hu, W. Internet-Based Surveillance Systems for Monitoring Emerging Infectious Diseases. Lancet Infect. Dis. 2014, 14, 160–168. [Google Scholar] [CrossRef]
  68. Wu, W.; Zhu, D.; Liu, W.; Wu, C.-H. Empirical Research on Smart City Construction and Public Health under Information and Communications Technology. Socioecon. Plann. Sci. 2022, 80, 100994. [Google Scholar] [CrossRef]
  69. Wang, L.; Xie, Q.; Xue, F.; Li, Z. Does Smart City Construction Reduce Haze Pollution? Int. J. Environ. Res. Public Health 2022, 19, 16421. [Google Scholar] [CrossRef] [PubMed]
  70. Rocha, N.P.; Dias, A.; Santinha, G.; Rodrigues, M.; Queirós, A.; Rodrigues, C. Smart Cities and Public Health: A Systematic Review. Procedia Comput. Sci. 2019, 164, 516–523. [Google Scholar] [CrossRef]
  71. Zhao, W.; Zou, Y. Smart Urban Governance in Epidemic Control: Practices and Implications of Hangzhou. Chin. Public Adm. Rev. 2021, 12, 51–60. [Google Scholar] [CrossRef]
  72. Zhang, Z.; Huang, Q.; Lu, Y.; Li, M.; Chen, Z.; LI, F. Analysis of Life Expectancy and the Spatial Differences of Its Influencing Factors of Chinese Residents. J. Geo-Inf. Sci. 2021, 23, 1575–1585. [Google Scholar] [CrossRef]
  73. Jain-Chandra, M.S.; Khor, N.; Mano, R.; Schauer, J.; Wingender, M.P.; Zhuang, J. Inequality in China–Trends, Drivers and Policy Remedies; International Monetary Fund: Washington, DC, USA, 2018; ISBN 1-4843-5753-1. [Google Scholar]
  74. Zhong, D.; Lu, Q.; Zhang, Y.; Li, J.; Lei, T.; Liu, C. How a Poverty Alleviation Policy Affected Comprehensive Disaster Risk Reduction Capacity: Evidence from China’s Great Western Development Policy. Int. J. Disaster Risk Reduct. 2024, 111, 104656. [Google Scholar] [CrossRef]
  75. Yang, F.; Yang, M.; Xue, B.; Luo, Q. The Effects of China’s Western Development Strategy Implementation on Local Ecological Economic Performance. J. Clean. Prod. 2018, 202, 925–933. [Google Scholar] [CrossRef]
  76. Pan, J.; Shallcross, D. Geographic Distribution of Hospital Beds throughout China: A County-Level Econometric Analysis. Int. J. Equity Health 2016, 15, 179. [Google Scholar] [CrossRef]
  77. Zhang, X.; Zhao, L.; Cui, Z.; Wang, Y. Study on Equity and Efficiency of Health Resources and Services Based on Key Indicators in China. PLoS ONE 2015, 10, e0144809. [Google Scholar] [CrossRef] [PubMed]
  78. Liu, Y.; Rao, K.; Wu, J.; Gakidou, E. China’s Health System Performance. Lancet 2008, 372, 1914–1923. [Google Scholar] [CrossRef] [PubMed]
Figure 1. Stages of NSCC construction.
Ijgi 14 00186 g001
Figure 2. Research flowchart.
Ijgi 14 00186 g002
Figure 3. Number of NSCCs by period to date.
Ijgi 14 00186 g003
Figure 4. Spatial distribution map of NSCCs.
Ijgi 14 00186 g004
Figure 5. The Lorenz curve for the NSCC distribution by administration regions.
Ijgi 14 00186 g005
Figure 6. NSCC kernel densitometry results.
Ijgi 14 00186 g006
Figure 7. A framework for the analysis of factors affecting the spatial distribution of NSCCs.
Ijgi 14 00186 g007
Figure 8. Spatial distribution of NSCCs overlaid with climatic factors.
Ijgi 14 00186 g008
Figure 9. Spatial distribution of NSCCs overlaid with (a) terrain and altitude and (b) normalized difference vegetation index.
Ijgi 14 00186 g009
Figure 10. Single-factor analysis results from the geodetector model.
Ijgi 14 00186 g010
Figure 11. Spatial distribution of NSCCs overlaid with population density.
Ijgi 14 00186 g011
Figure 12. Spatial distribution of NSCCs overlaid with urban agglomerations.
Ijgi 14 00186 g012
Figure 13. Spatial distribution of NSCCs overlaid with 3A hospitals.
Ijgi 14 00186 g013
Figure 14. Spatial distribution of NSCCs overlaid with smart cities.
Ijgi 14 00186 g014
Table 1. Statistical distribution of NSCCs across various administrative regions.
No.Administrative RegionNSCC AmountProportion/%Cumulative
Proportion/%
1Jiangsu418.878.87
2Shandong357.5816.45
3Zhejiang347.3623.81
4Henan316.7130.52
5Sichuan265.6336.15
6Guangdong224.7640.91
7Hubei204.3345.24
8Chongqing204.3349.57
9Shanghai183.9053.46
10Beijing183.9057.36
11Hunan153.2560.61
12Yunnan153.2563.85
13Tianjin153.2567.10
14Shaanxi132.8169.91
15Inner Mongolia132.8172.73
16Jiangxi112.3875.11
17Guizhou112.3877.49
18Guangxi112.3879.87
19Liaoning102.1682.03
20Jilin102.1684.20
21Xinjiang91.9586.15
22Shanxi91.9588.10
23Hainan81.7389.83
24Hebei71.5291.34
25Anhui71.5292.86
26Ningxia71.5294.37
27Fujian71.5295.89
28Heilongjiang61.3097.19
29Gansu61.3098.48
30Qinghai40.8799.35
31Tibet30.65100.00
Table 2. Number and proportion of NSCCs in the three regions of China (2000–2020).
Region200020112020
AmountProportion/% AmountProportion/% AmountProportion/%
Eastern region3380.48 11964.32 21546.54
Central region49.76 3217.30 10923.59
Western region49.76 3418.38 13829.87
Nationwide41100.00 185100.00 462100.00
Table 3. The selection of influencing factors.
DimensionsFactorsUnits
Economic and PopulationX1: Total value of secondary and tertiary industries100 million yuan (RMB)
X2: Urban population at year-endpersons
Policy Support and Technological InnovationX3: Proportion of government health expenditure in total health expenditure%
X4: Number of patent applicationspcs
Urban Agglomerations and Urban EnvironmentX5: Total number of cities in provincial-level administrative regionscities
X6: Comprehensive utilization rate of general industrial solid waste (utilized amount/generated amount)%
Medical Services and ResourcesX7: Number of general practitionerspersons per 10,000 population
X8: Number of beds in urban healthcare institutionsbeds/1000 persons
Information Technology and Smart LivingX9: Urban broadband internet subscribers10,000 households
X10: Smart cities in provincial-level administrative regionscities
Table 4. The spatial indices of NSCCs based on the function calculation.
No.FunctionIndex
1Nearest neighbour index0.85
2Geographic concentration index21.35
3Imbalance index0.3525
4Kernel density estimation0.20–5.91
Disclaimer/Publisher’s Note: The statements, opinions and data contained in all publications are solely those of the individual author(s) and contributor(s) and not of MDPI and/or the editor(s). MDPI and/or the editor(s) disclaim responsibility for any injury to people or property resulting from any ideas, methods, instructions or products referred to in the content.

