Abstract
This study introduces a geospatial comprehensive methodological system aimed at evaluating the suitability and need for agricultural digital solutions (ADSs) across Europe. This system integrates a diverse range of factors, including geophysical characteristics, climate patterns, and socioeconomic conditions, evaluated at regional- and farm-specific levels. By leveraging open-source Earth observations and socioeconomic data, we develop multiple performance, environmental, and socioeconomic similarity indexes that compare regions based on shared characteristics, such as soil quality, climate, and socioeconomic factors. Using advanced statistical and multi-criteria analysis tools, these indexes are tailored to different stages of agricultural production, enabling region-specific assessments that identify and prioritize the needs for digital solutions across Europe. The results indicate that the developed indexes effectively categorize regions based on comparable characteristics, facilitating the targeted recommendation of ADSs. Additionally, a connectivity performance index is created to assess the local deployment model of agricultural digital solutions (cloud, edge, or mixed), ensuring that the recommendations for technological implementation are feasible and effective given the local connectivity conditions.
1. Introduction
Agricultural digital solutions (ADSs) are seen by many authors as having become essential for modern farming as such solutions can enhance productivity, sustainability, and profitability. ADSs include a diverse range of tools and approaches, including precision agriculture, remote sensing, and data analytics, as well as advanced technologies, such as farm management software, UAV-embedded remote sensors, and automated machinery [1]. These integrated solutions facilitate optimizing resource use by enabling the precise management of inputs like water, fertilizers, and pesticides, thereby increasing yields while reducing environmental impacts [2]. Precision agriculture, for instance, uses Global Navigation Satellite Systems (GNSSs), IoT sensors, and Earth observation data to collect real-time data on soil conditions, crop health, and weather patterns, enabling farmers to make informed decisions on planting schedules, resource allocation, pest control, and overall crop management strategies [3]. These solutions can also be highly region-specific, designed to address the unique environmental and agricultural challenges of particular areas. For instance, AI models developed using local datasets are often employed to detect crop diseases or assess soil organic carbon (SOC) levels [4]. Additionally, other region-specific digital solutions may focus on optimizing irrigation or pest management in areas with particular climate conditions [5]. The integration of such technologies is crucial as it enables optimized management and targeted farming inputs, increasing efficiency and productivity. Farms which utilize these digital tools can achieve significant improvements in crop yields and efficiency, highlighting the potential of digital agriculture [6].
Despite the transformative potential of digital agriculture, its benefits are not uniformly realized due to unequal access, particularly in rural and underdeveloped areas. Variables and factors like high costs and a lack of infrastructure pose significant barriers to access, while limited digital literacy among farmers affects the effective use of these solutions [7]. Furthermore, the lack of reliable internet connectivity in rural areas makes the matter worse, as many digital solutions require internet access for real-time data collection and analysis [8]. Even when farmers have access to digital solutions, they often face challenges in how to effectively use them. These challenges often stem from the complexity of the technologies involved and the difficulty in interpreting the data generated [9].
Comprehensive Decision Support Systems (DSSs) specifically designed to facilitate the adoption of ADSs hold promise in addressing many of the barriers associated with digital transformation in agriculture. These systems are envisioned as centralized platforms that could help farmers and advisors navigate the complexity of selecting ADSs. Unlike traditional DSSs that primarily assist with operational farming decisions like crop management or irrigation scheduling, these systems focus on guiding users toward the most relevant and cost-effective digital solutions tailored to their specific needs. Despite their potential, such systems remain relatively uncommon, as the majority of existing DSSs are designed to optimize farm operations rather than to facilitate digital technology adoption. When developed, these ADS-focused DSSs can address challenges such as the availability and reliability of internet connectivity, recommending cloud-based, edge computing, or hybrid solutions based on local infrastructure. Examples include FairShare [10], which supports participatory approaches to digital tool adoption by providing insights into available ADSs, and Quantifarm [11], which evaluates the impact of specific ADS implementations to facilitate informed decision-making. These systems are typically equipped with user-friendly interfaces to accommodate varying levels of digital literacy among farmers [12]. This focused approach addresses the challenge of ADS selection and adoption by simplifying the decision-making process, empowering farmers to make choices that align with their unique circumstances.
Despite their potential, these ADS adoption-focused DSSs face challenges, such as system complexity, the need for localized data, and limited integration of geospatial information [13,14]. Geospatial frameworks play a crucial role in overcoming these challenges by enabling DSSs to generate region-specific recommendations tailored to local conditions, such as soil quality, climatic factors, and socioeconomic contexts. For example, geospatial supervisory tools like the Agricultural Drought Vulnerability Index evaluate exposure, sensitivity, and adaptive capacity to drought using geospatial indicators [15,16]. Similarly, the Geospatial Environmental Impact Monitoring Index assesses agricultural practices’ effects on the environment, supporting sustainability efforts [17]. By leveraging geospatial data, DSSs can provide actionable insights that are highly localized, practical, and accessible, making it easier for farmers and advisors to navigate the complexities of both daily agricultural management and digital solution deployment. By using data on local soil, climate, and socioeconomic conditions, geospatially enhanced DSSs generate targeted recommendations that match real-world farming needs. This localized approach aligns advanced digital technologies with on-farm realities, supporting greater adoption of ADSs while improving sustainability and productivity.
This research aims to overcome existing barriers to the integration and adoption of agricultural digital solutions (ADSs) by developing a geospatial methodological framework known as the “ADS geospatial framework”. The overarching objectives of this study are to integrate environmental, socioeconomic, and connectivity data to evaluate the practicability and replicability of agricultural digital solutions tailored to the unique needs of each region. By collecting and analyzing region-specific data such as soil health, climate conditions, and socioeconomic contexts, the framework can potentially provide farmers, advisors, and policymakers with actionable and localized recommendations, enabling informed decision-making to enhance agricultural productivity, sustainability, and economic viability.
Various agricultural sustainability frameworks have been developed over the years. For instance, MESMIS [18] offers a site-specific, participatory approach centered on farm-level indicators, and while it does incorporate some geospatial aspects, its focus is predominantly on local evaluations. SAFE [19] presents a hierarchical system of principles, criteria, and indicators that can be applied from the parcel to the regional scale, and certain applications of SAFE include geospatial data integration; however, its primary concern remains traditional environmental, economic, and social dimensions. Similarly, TAPE [20] is designed to evaluate agroecological performance through multi-dimensional, stakeholder-engaged methods, integrating spatial information to assess sustainability transitions. Although these frameworks have significantly advanced our understanding of agricultural sustainability, they do not explicitly evaluate connectivity, nor do they assess the replicability and necessity of agricultural digital solutions—critical aspects for modern farming systems. In fact, a recent systematic review of over a hundred sustainability indicators [21] confirms that critical factors, including rural connectivity and the deep integration of large-scale Earth observation (EO) data, are rarely featured. To bridge these gaps, our ADS geospatial framework is organized into three distinct sets of indexes.
- -
- The Agricultural Digital Solutions Needs Indexes, namely, the Fertilization Need Index (FNI), the Irrigation Need Index (INI), and the Pest Management Need Index (PMNI), assess the necessity for digital solutions across Europe at specific production steps such as fertilization, irrigation, and pest management. These indexes were chosen because fertilization, irrigation, and pest management are critical components of agricultural production that fundamentally drive yield and profitability. Improvements in nutrient management, water use, and pest control have historically played a significant role in increasing productivity [22], which justifies their selection as essential metrics for developing advanced decision-making tools for advisors and policymakers.
- -
- The Geographical Similarity Indexes, the natural characteristics similarity index (NCSI) and socioeconomic characteristics similarity index (SCSI), evaluate the geographical replicability of agricultural digital solutions. In this context, “replicability” refers to the likelihood that a solution proven effective in one region will deliver comparable results elsewhere under analogous conditions. These indexes were included because a solution that thrives in one region may fail in another due to differences in soil, climate, infrastructure, or farm size. They can help farmers identify and implement the most effective technologies used in similar regions and are essential tools for evaluating the replicability of open-source, free-to-use, and commercial ADSs, as well as open frameworks that provide detailed methodologies for region-specific solutions developed in research programs (e.g., Use Cases or Pilots in Horizon Europe projects). These indexes enable systematic adaptation of ADSs in other regions with similar environmental and socioeconomic conditions. Solutions like IRRINET [23] developed in Emilia-Romagna, Italy, to optimize irrigation, and Sativum [24], created in Spain for fertilization and crop management, demonstrate how region-specific technologies can potentially be transferred to other areas once local conditions are deemed sufficiently similar through the Geographical Similarity Indexes. IRRINET’s focus on managing water in drought-prone areas, and Sativum’s integration of fertilization and crop management, offers potential solutions for regions with similar soil, climate, and socioeconomic conditions. These indexes help in identifying areas where such solutions can be effectively adapted and implemented.
- -
- The Rural Connectivity Performance Index (RCPI) assesses the connectivity infrastructure of rural regions to advise on the most suitable deployment models for agricultural digital solutions—whether cloud-based, edge computing, or a hybrid approach. Connectivity is a prerequisite for real-time data collection, analytics, and decision support and remains a common barrier to adoption in rural areas [25]. For example, cloud-based farm management platforms such as LiteFarm [26], which provide real-time crop monitoring, data analytics, and decision support, rely heavily on high-speed broadband connectivity. Without robust broadband infrastructure, the efficiency and functionality of such platforms are significantly reduced.
By integrating these indexes, the framework ensures a holistic approach that addresses both the technological and practical barriers to adopt digital agriculture solutions. This approach aims to foster broader adoption and sustained use of digital agriculture solutions by providing tailored recommendations that are accessible and effective for farmers, regardless of their region’s specific challenges.
2. Materials and Methods
The development of the present ADS geospatial framework commenced with the identification and analysis of key parameters and important data. These parameters include climatic conditions, soil characteristics, connectivity variables, and socioeconomic factors. We source the latest available comprehensive relevant datasets from Eurostat [27], the European Union’s rural observatory [28], the Joint Research Center (JRC) [29], the European Soil Data Centre (ESDAC) [30], and multiple Earth observation (EO) data products. By focusing on rural areas, the data collection specifically targets farm and farm community levels. We harmonized the spatial data by aligning different datasets to a common spatial framework, enabling integrated analysis and comparison. This analysis uses the NUTS [31] (nomenclature of territorial units for statistics) levels two for basic regions and three for small regions. Various geospatial techniques were employed for the analysis and aggregation of the datasets to achieve this comprehensive assessment. Details of the datasets and the procedures are provided in Section 2.1 (“Rural Natural, Socioeconomic, and Connectivity Environment”). The collated NUTS 2 and NUTS 3 datasets were used to estimate the indices mentioned in the study scope. Section 2.2 presents further details about each of the indices, detailing the methodology underlying their development. A detailed workflow of the methodology is given in Figure 1.
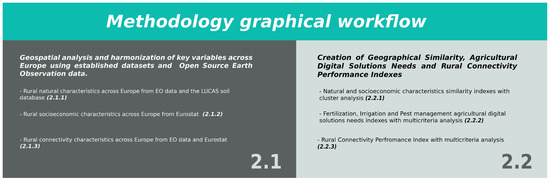
Figure 1.
Methodology graphical workflow.
2.1. Rural Natural, Socioeconomic, and Connectivity Environment
The methodology for analyzing natural, socioeconomic, and connectivity characteristics at the farm and farm community levels involves a comprehensive, multi-step process to ensure data relevance, integration, and adaptability. Natural environment characteristics are sourced from EO datasets and JRC repositories on a NUTS 3 scale. These include precipitation, temperature, soil organic carbon (SOC), nutrients (nitrogen and phosphorus), sand percentage, soil moisture, and species distribution data reported under Article 17 of the EU Habitats Directive (92/43/EEC) [32]. Socioeconomic characteristics are sourced from Eurostat at the NUTS 2 scale and include predominant farm size, economic size, and farm legal status. Connectivity parameters, including fixed broadband coverage, 5G mobile network coverage, population density, and topographic data (e.g., elevation), are gathered from Eurostat, the Rural Observatory, the JRC, and EO datasets at the NUTS 3 scale. Table 1 identifies the specific variables used for each index, showing how soil, climate and biodiversity, socioeconomic, and connectivity variables are applied across the different indices.

Table 1.
List of variables used for each individual index.
All the spatial datasets were reprojected to a common coordinate reference system to ensure spatial consistency. The point-based LUCAS topsoil measurements (SOC, nitrogen, and phosphorus) were masked to agricultural land using the Corine Land Cover 2018 product and then averaged within each NUTS 3 region to represent the overall soil fertility conditions. Raster variables, including soil sand percentage, digital elevation data, and population, were processed via zonal statistics at the NUTS 3 scale, yielding mean values for sand percentage, median values for elevation, and total sums for population. For climate-related Earth observation data (precipitation, temperature, and soil moisture), a five-year (2018–2023) temporal mean was computed to address interannual variability, and those averaged values were similarly aggregated using zonal statistics. Additionally, for the Article 17 species distribution dataset, a geospatial query was performed to count the number of distinct species polygons intersecting each NUTS 3 region, providing a measure of species richness. Socioeconomic data from Eurostat, such as farm size and legal status, were drawn from the latest available reporting year at NUTS 2 and transferred to corresponding NUTS 3 polygons. Connectivity metrics (broadband and 5G) were obtained for the most recent reporting period and proportionally allocated from the national (NUTS 0) level to NUTS 3. Any missing or inconsistent records were addressed through standard cleaning measures, including outlier checks and interpolation. This harmonized workflow ensured that differences in spatial resolution, data format, and temporal coverage did not impede the seamless integration of multiple datasets into a unified geospatial framework, enabling robust cross-comparisons of environmental, socioeconomic, and connectivity factors.
The following subsections further elaborate how the data from the datasets was processed, for each of the characteristics, toward ensuring their usability as input for the indices of the geospatial framework.
2.1.1. Rural Natural Environment
Dataset Description
The European climatic and rural soil data used in this analysis ensure comprehensive coverage and are used for the creation of the natural characteristics similarity index and the Agricultural Digital Solutions Needs Indexes. Key datasets include the LUCAS 2018 Soil Module [33,34,35], which provides detailed information on soil conditions across Europe, and the topsoil physical properties for Europe [36] based on LUCAS topsoil data [37]. Additionally, climatic and soil moisture data are derived from the Copernicus Climate Change Service’s [38] ERA5 dataset [39] and the NASA-USDA-Enhanced SMAP Global soil moisture data [40], respectively, known for their accuracy and temporal coverage. The potential monthly Fraction of Absorbed Photosynthetically Active Radiation (FAPAR) [41] is also used as a key variable in the assessment of crop growth status and cropland productivity. Furthermore, reported species distribution data across Europe were obtained from the European Environment Agency’s Article 17 2020 Spatial Data [42], sourced under the Habitats Directive 92/43/EEC. These datasets provide critical information on species presence and range, enhancing the understanding of habitat distribution and biodiversity.
Data Analysis
The variables utilized from these datasets for the current study were the soil organic carbon, soil nutrient content, soil sand percentage from the soil repository precipitation, soil moisture, temperature, FAPAR, and species richness data from the climatic, environmental, and biodiversity datasets. We employed geospatial analysis tools to process these datasets. First, we applied a mask of areas with agricultural land use from the Copernicus Land Monitoring Service’s [43] Corine Land Cover 2018 dataset [44]. Then, we isolated the European soil data for the agricultural areas within the NUTS 3 polygons and aggregated these values to the respective NUTS 3 polygon as a mean value. Variables such as soil organic carbon (SOC), phosphorus, and nitrogen were averaged within NUTS 3 polygons, providing a regional overview of soil health and fertility. The annual temporal averages of precipitation per square kilometer for the years 2018–2023 were aggregated for the NUTS 3 polygons. For each grid cell, the month with the highest Fraction of Absorbed Photosynthetically Active Radiation (FAPAR) was identified using the FAPAR dataset. Once this peak month was determined for each grid cell, the mean soil moisture values for that specific month were calculated for the period from 2018 to 2023. The average value was aggregated in the NUTS 3 polygons. The annual average number of days exceeding 10 degrees Celsius was extracted and aggregated for the NUTS 3 polygons over the same period. Furthermore, the number of distinct species was aggregated into the NUTS 3 polygons for the creation of a species richness variable.
Importance of Variables
The selection of these variables is justified by their critical roles in determining soil health, the conditions for agricultural productivity, their importance and connection to specific agricultural production steps, and their connection to the replicability analysis of ADSs. SOC is a crucial component of soil organic matter, influencing soil structure, fertility, and biological activity [45]. High levels of SOC indicate good soil health, essential for sustainable agricultural practices. Additionally, phosphorus and nitrogen are vital nutrients for plant growth and development; their availability in the soil significantly impacts crop yield and quality [46]. The SOC, phosphorus, and nitrogen data will be integral to developing the natural characteristics similarity index, which helps in identifying regions with similar soil and climate characteristics for the geographical replicability assessment of different ADSs. Additionally, these variables will inform the FNI, pinpointing areas with specific fertilization requirements. For example, regions with low SOC and nutrient levels are identified in this framework as needing advanced fertilization ADSs to improve soil fertility and crop yields. While this serves as a useful simplification for the purposes of this study, it is important to note that fertilization strategies and their relationship with SOC and nutrient levels are more complex. Sand percentage in soil significantly impacts irrigation and agricultural productivity. Soils with higher sand content have a lower water-holding capacity, leading to quicker drainage and an increased need for frequent irrigation. This is due to the larger particle size and smaller surface area of sand particles, which allows water to infiltrate and percolate more rapidly through the soil profile [47,48]. Soil moisture directly influences plant morphology and functions, including transpiration and photosynthetic rates [49]. Soil moisture for the month with the highest FAPAR was calculated for each grid cell, as FAPAR effectively captures the spatial and temporal variations in vegetation growth and health [50]. By selecting the month with the highest FAPAR, which indicates peak photosynthetic activity, we focus on the period when vegetation is most active. This approach ensures that soil moisture is assessed during the critical growth phase, providing meaningful insights into the relationship between soil moisture and vegetation dynamics. The data on soil moisture and texture will be used together with all the natural characteristic variables to develop the NCSI. These variables will also feed into the INI. The integration of soil moisture and sand content data helps provide a comprehensive understanding of the water retention capacity and overall soil health of different regions.
Precipitation and temperature are critical climate variables that significantly impact agricultural productivity and the suitability of different ADSs. Average annual precipitation and temperature data are also used to create the NCSI, aiding the climatic replicability assessment of ADSs. Precipitation will also feed into the INI. Pest management is highly influenced by climate variables, particularly temperature, which affects the lifecycle and prevalence of pests. Warmer temperatures can lead to increased pest activity and reproduction rates, thereby escalating the need for effective pest management solutions [51]. The PMNI will utilize temperature data to pinpoint regions where high temperatures necessitate advanced pest management ADSs. For example, in areas with a high number of days exceeding 10 degrees Celsius, which is the incubation threshold for many agricultural pests, e.g., Colorado Potato beetle [52], digital solutions such as automated pest monitoring systems, predictive modeling tools, and integrated pest management platforms can be particularly beneficial. Moreover, species richness has an important role in the analysis, particularly due to the established link between biodiversity and pest management. High biodiversity can reduce pest populations by promoting a stable and balanced ecosystem, where natural predators of pests thrive [53]. The inclusion of species richness as a variable in the PMNI will help identify areas with high biodiversity that may require fewer pest control interventions, thus supporting more sustainable agricultural practices.
2.1.2. Rural Socioeconomic Environment
Dataset Description
The primary variables for the rural socioeconomic environment include European farm size, European farm economic size, and European farm legal status. These variables are essential for understanding the socioeconomic landscape of farms across Europe, are used for the creation of the socioeconomic characteristics similarity index, and are sourced from the latest available Eurostat farm indicator data [54] for 2020 at the NUTS 2 scale. Utilizing standardized data from Eurostat ensures consistency and reliability across regions, facilitating accurate comparisons. The focus on NUTS 2 regions allows for detailed analysis at a regional level, capturing local variations in agricultural practices.
Data Analysis
The geospatial analysis for these variables includes calculating the predominant farm size, economic size, and legal status within each NUTS 2 region and aggregating this information based on the predominant value to the respective polygon. This method highlights the most common agricultural characteristics in each region, providing a clear picture of regional agricultural profiles. By aggregating the data to polygons, we can visualize and analyze spatial patterns, aiding in the identification of regions with similar socioeconomic conditions.
Importance of Variables
Farm size, measured in hectares, is a crucial variable that reflects the physical dimensions of agricultural operations. These data highlight the distribution of small, medium, and large farms within various NUTS 2 regions. Understanding farm size distribution is vital for tailoring digital solutions to the specific needs of different farm sizes. Smaller farms may require different technological solutions compared to larger farms, such as more cost-effective tools or those that enhance labor efficiency. The economic size of farms, indicated by their yearly income, is an essential indicator of financial health and productivity. This variable helps assess the economic viability of farms and their capacity to invest in new technologies. Farms with higher economic output are typically more capital-intensive and able to adopt advanced digital solutions. Conversely, smaller economic size farms might need affordable and scalable technologies to improve productivity. Finally, farm legal status categorizes farms as either a natural person (individual or family-owned) or a legal person (such as a corporation or cooperative). This classification influences governance, decision-making processes, and the ability to adopt new technologies. Natural person farms might prioritize user-friendly and cost-effective technologies, while legal person farms might have more resources and structured management to support the adoption of more sophisticated digital solutions [55].
By examining these variables, we provide a detailed understanding of the socioeconomic conditions of farms across Europe. This information is essential for conducting the analysis to create a SESI. This index will identify regions with similar socioeconomic conditions, which is crucial for tailoring digital solutions to specific regional needs. The resulting tool will deliver targeted recommendations, ensuring that the selected ADSs are well-suited to the unique characteristics and requirements of different farming regions. This approach enhances the overall effectiveness and sustainability of agricultural practices across Europe, supporting policymakers, farm advisors, farmers, and public administration in making informed, data-driven decisions.
2.1.3. Rural Connectivity Variables
Dataset Description
European rural connectivity variables, used for the development of the RCPI, provide a detailed understanding of fixed broadband and 5G infrastructure, population distribution, and terrain characteristics and are sourced from EO data, JRC repositories, and Eurostat datasets. These data enable the analysis of connectivity disparities and challenges faced by rural communities and allow for the creation of the RCPI. The topography data utilized in this analysis are sourced from the Copernicus Land Monitoring Services, specifically using the Copernicus Digital Elevation Model [56] (COP-DEM) at a 30 m resolution. COP-DEM provides high-resolution elevation data, essential for detailed analysis of the terrain across different NUTS 3 regions in Europe. This dataset captures elevation and terrain features with high accuracy, making it a valuable resource for assessing the impact of the physical landscape on connectivity infrastructure. The population density data leveraged in this analysis originate from the Joint Research Centre (JRC), which provides GHS-POP R2023A, a high-spatial-resolution (100 m) population raster for 2020 [57]. This dataset is fundamental for understanding how population is distributed across various NUTS 3 regions in Europe, influencing the demand and practicality of broadband infrastructure. Rural fixed broadband and 5G cellular network coverage data [58] from Eurostat provides the latest available information from 2022 and is expressed as a percentage. These data indicate the extent of the broadband and cellular infrastructure available in rural areas, showing how well connected different regions are in terms of service availability.
Data Analysis
Data processing begins with extracting elevation values from COP-DEM for each NUTS 3 polygon using geospatial analysis tools. For each NUTS 3 region, the median elevation value is identified from the COP-DEM data. The median is chosen over the mean to provide a more robust measure that is less influenced by extreme elevation values, offering a more accurate representation of typical terrain conditions within the region. The population values from the dataset are aggregated into NUTS 3 polygons, yielding a total population count for each region. This aggregation offers insights into the population concentration within each area, which is vital for assessing the viability and cost-effectiveness of deploying broadband infrastructure. The population density is then calculated by dividing the total population by the area of each NUTS 3 region. Geospatial analysis tools were employed to transform the national-level (NUTS 0) fixed broadband and 5G cellular infrastructure data into NUTS 3 polygons. This transformation involved dividing the national-level data into NUTS 3 regional levels to enable detailed analysis and integration with other variables. This process was essential to normalize the data, ensuring consistency and comparability with other variables.
Importance of Variables
Physiography, represented by the median elevation from the COP-DEM, is a critical factor in the analysis of rural connectivity for several reasons. Terrain complexity, such as mountains and valleys, poses significant challenges for broadband infrastructure deployment, with higher or more varied elevations increasing the cost and technical difficulty of installing and maintaining network infrastructure. Elevation and terrain features also affect the propagation of wireless signals, with regions having more uniform and lower elevations typically experiencing fewer signal obstructions, leading to better coverage and higher speeds [59]. Additionally, easier access to flat or gently sloping areas facilitates infrastructure development and ongoing maintenance, improving the reliability and sustainability of connectivity services. High population density areas typically exhibit higher demand for broadband services, making infrastructure investments more economically feasible. In contrast, sparsely populated regions often face greater challenges due to higher per-user infrastructure costs. Population density also affects service quality and accessibility; remote areas might have inadequate service coverage [60]. Rural fixed broadband and cellular 5G coverage are more straightforward variables for assessing connectivity as they directly measure the availability and quality of internet services in rural areas. These metrics provide clear insights into the level of infrastructure and the performance of broadband services, which are essential for evaluating connectivity.
2.2. Key Indices
The Geographical Similarity Indexes (NCSI and SCSI), the Agricultural Digital Solutions Needs Indexes (FNI, INI, and PMNI), and the RCPI are essential tools for assessing the geographic replicability and need distribution of ADSs at various agricultural production steps, as well as the connectivity performance across different regions at the NUTS 3 scale. These indices serve several critical functions. Firstly, the Geographical Similarity Indexes (NCSI and SCSI) help identify regions with similar conditions. This is crucial for determining the potential for replicating ADS implementations in different geographic areas, ensuring that the solutions are suitable and effective in similar environments. The Agricultural Digital Solutions Needs Indexes (FNI, INI, and PMNI) for various agricultural production steps, such as fertilization, irrigation, and pest management, highlight the specific needs of different regions. By identifying areas with particular requirements, these indices facilitate the targeted recommendation of ADSs, ensuring that digital solutions address the most pressing issues in each region. Finally, the RCPI assesses the local connectivity infrastructure, determining the feasibility of deploying cloud-based, edge, or mixed digital solutions. This index ensures that technological recommendations are practical given the connectivity conditions, thereby enhancing the likelihood of successful implementation and sustained use. By incorporating these indices into the ADS geospatial framework, we enhance its capacity to deliver precise, actionable recommendations tailored to the unique natural, socioeconomic, and connectivity conditions of each region. This comprehensive approach supports the effective deployment of digital solutions, promoting agricultural productivity, sustainability, and economic viability across Europe.
2.2.1. Geographical Similarity Indices
By creating two similarity indexes—natural and socioeconomic—we can effectively group regions with similar conditions, facilitating the deployment of appropriate ADSs. The natural variables similarity index utilizes natural environment variables, including soil organic carbon, phosphorus, nitrogen, soil moisture, mean annual precipitation, and mean annual temperature. The socioeconomic similarity index incorporates factors such as farm size, economic size, and legal status. These similarity indexes function as powerful tools to categorize regions based on their shared characteristics. For instance, regions with similar soil conditions and climate data can be grouped together under the natural similarity index, while regions with comparable farm size and economic and legal status can be clustered using the socioeconomic similarity index. This approach streamlines the process of selecting and deploying ADSs, ensuring that solutions are tailored to the specific needs and conditions of each region. The similarity indexes support the ADS geospatial framework by providing tailored recommendations that match the most suitable ADSs to regions with comparable conditions. For example, if a particular ADS has proven effective in a region with specific soil and climate conditions, it is likely to be effective in another region with similar conditions [61]. This targeted approach enhances the efficiency and productivity of agricultural practices by ensuring that the recommended ADSs are not only technically appropriate but also contextually relevant. Aligning an ADS with the unique characteristics of each region optimizes their effectiveness, ensuring maximum benefits in improving crop yields, enhancing resource use efficiency, and promoting sustainable agricultural practices. Moreover, this methodology enhances the scalability and replicability of ADSs. By understanding the conditions under which an ADS is most effective, we can replicate its success in similar regions, thereby accelerating the adoption of innovative agricultural technologies across Europe.
We began by preprocessing and standardizing the datasets of natural and socioeconomic variables to prepare them for clustering analysis. Normalizing the data—transforming values to have a mean of zero and a standard deviation of one—ensures that each feature contributes equally to the clustering process. To determine the optimal number of clusters for both indexes, we visualized the data using UMAP (Uniform Manifold Approximation and Projection), a dimensionality reduction technique. This approach allowed us to uncover natural separations in the data, guiding the selection of the number of clusters for both indexes. UMAP helped ensure the clusters were both meaningful and interpretable, capturing the most relevant variations in socioeconomic and natural conditions across Europe [62]. Additionally, we applied the elbow technique to quantitatively assess the within-cluster variance across a range of cluster numbers. By plotting the inertia values, we identified the point where adding additional clusters yielded only marginal improvements, leading to an optimal partition of four clusters for the socioeconomic index and four clusters for the natural characteristics index [63]. The combination of the UMAP visualization with the elbow technique allowed us to confidently choose four clusters for both indexes.
We then applied k-means clustering [64] to group regions based on their similarities, which is essential for developing similarity indexes that guide the deployment of ADSs. After clustering, we ordered the clusters based on their similarity to each other. This means arranging clusters to reflect their relative similarities—for example, Cluster 1 is more similar to Cluster 2 than to Cluster 3. This ordering helps us understand the relationships between clusters, enhancing the precision of our recommendations. Finally, to further validate our cluster selection, we used pairwise Welch’s t-tests [65] to compare the means of the variables across clusters. This test evaluates whether the differences in cluster means are statistically significant without assuming equal variances. The tests confirmed that the differences in cluster means were statistically significant, thereby supporting our choice of cluster numbers.
By recognizing the gradations between clusters, we can provide more nuanced and context-sensitive guidance for deploying ADSs. This methodology allows us to visualize and compare agricultural conditions across Europe, supporting informed decision-making and ensuring that the deployment of ADSs is both targeted and effective.
2.2.2. Agricultural Digital Solutions Needs Indices
The Agricultural Digital Solutions Needs Indexes for fertilization (FNI), irrigation (INI), and pest management (PMNI) identify NUTS 3 regions across Europe where advanced agricultural solutions are most needed.
To determine these indexes, we employed the Technique for Order of Preference by Similarity to Ideal Solution (TOPSIS) [66], an analytical multi-criteria decision-making approach that evaluates each alternative (region) based on its distance to the ideal (best) and negative-ideal (worst) solutions. In our application, we first constructed a decision matrix encompassing the relevant natural environment variables for each index. Each region’s value for each variable was normalized by dividing it by the square root of the sum of squared values for that variable.
where is the raw value for region i and variable j.
Next, we identified the positive-ideal (highest-performing) and negative-ideal (lowest-performing) values across all regions. For beneficial variables these are defined as follows:
For non-beneficial variables, the roles are reversed.
Following this, each region’s Euclidean distances to these reference points were computed. The distances are calculated using the following:
Finally, these distance measures for each region were combined into a final ranking using the TOPSIS closeness coefficient. The closeness coefficient is computed as follows:
The coefficient was then reversed with a score closer to 1 indicating a higher need for the corresponding advanced digital solution.
The core idea of this approach is that the optimal choice is the one closest to the positive-ideal solution and farthest from the negative-ideal solution. The FNI incorporates soil fertility indicators—soil organic carbon (SOC), phosphorus, and nitrogen levels—to pinpoint regions where enhanced fertilization strategies could improve soil health and productivity. The INI uses variables such as soil moisture, precipitation, and soil texture (sand percentage) to highlight areas requiring improved irrigation due to water retention challenges. The PMNI uses temperature data and biodiversity indicators—such as the average yearly number of days over 10 °C and species richness—as a starting point to identify areas that could benefit from advanced pest management strategies. However, these measures inevitably simplify complex ecological processes. Future studies should explore a broader range of environmental and biological variables to provide more nuanced insights into pest dynamics and refine management approaches.
Each index ranges from zero to one, with zero indicating a low need for the specific ADS and one indicating a high need. A score of zero represents ideal conditions—for the Fertilization Index, high values for SOC, phosphorus, and nitrogen; for the Irrigation Index, high soil moisture and precipitation with low sand percentage; and for the Pest Management Index, high species richness and fewer days over 10 degrees Celsius. Conversely, a score of one reflects conditions where advanced solutions are most needed. By creating these indices at the NUTS 3 regional level, this study provides a robust framework for assessing and recommending suitable ADSs tailored to the specific conditions of different regions. The indices support data-driven decision-making in agriculture, leading to more resilient and adaptable farming systems [67]. Decision-makers can leverage these indices to allocate resources effectively, prioritize interventions, and monitor the impact of deployed technologies, ensuring that agricultural advancements are both equitable and impactful across diverse regions. We used an unweighted TOPSIS approach to ensure that each variable contributed equally to the final score, establishing an unbiased baseline. Nonetheless, our methodology remains flexible, allowing for future work to incorporate weights that reflect specific priorities or stakeholder input. Since our analysis was unweighted, a sensitivity analysis was not conducted in this study; however, such an analysis could be easily integrated in future research by systematically varying weight assignments or modifying the input variables to assess the stability and robustness of the resulting rankings.
2.2.3. Connectivity Performance Index
The connectivity performance index identifies NUTS 3 regions where improvements in connectivity infrastructure are necessary to support the deployment of digital agricultural technologies. Similarly, using the unweighted TOPSIS methodology described earlier, we incorporated variables related to physiography, population, and connectivity without repeating methodological details. The analysis included rural fixed broadband and 5G cellular network coverage, population density, and physiographic data (median elevation) for each NUTS 3 region. The variables were normalized, and the regions were evaluated based on their proximity to ideal conditions—high fixed broadband 5G cellular coverage, high population density, and low median elevation. The index ranges from zero to one, with zero indicating low connectivity (combining negative-ideal values: low broadband and 5G cellular coverage, low population density, and high median elevation) and one representing high connectivity performance (ideal values for all variables). This index helps guide investments and policy decisions by highlighting regions where enhanced connectivity infrastructure is crucial for the effective deployment of digital agricultural technologies. It is important to note that the original connectivity data from Eurostat were provided only at the national (NUTS 0) level. To address this limitation and obtain a more regionally nuanced measure at the NUTS 3 level, we integrated additional variables—specifically, population density and median elevation. By incorporating these demographic and physiographic factors, we were able to interpolate and reallocate the national-level connectivity data, thereby producing a refined Rural Connectivity Performance Index (RCPI) that better captures regional variations.
3. Results
3.1. Rural Natural, Socioeconomic, and Connectivity Environment: Spatial Distribution
The natural, socioeconomic, and connectivity characteristics show a considerable variation across Europe’s NUTS 2 and NUTS 3 regions. The soil organic carbon (SOC) levels are notably lower in Southern and Eastern Europe, particularly in parts of Italy, Greece, and parts of Eastern Europe. Central Europe, particularly Austria, southern France, parts of Belgium, and the Netherlands, as well as Northern Europe, including Scandinavia, exhibit much higher levels, reflecting more fertile soils (Figure 2A). The nitrogen levels display a comparable trend, with decreased concentrations in Southern and Eastern Europe and elevated concentrations in Central and Northern Europe as in Figure 2B. Central Europe, specifically Belgium, Germany, and Poland, has elevated phosphorus levels compared to Northern Europe, Scandinavia, Southern Europe, and Southeastern Europe, including regions in Spain, Italy, and Greece (Figure 2C). The soil texture, specifically the sand percentage, is highest in Northern Europe, particularly in Scandinavia, indicating poor water retention. In contrast, Central and Southern Europe have lower sand percentages, suggesting better natural water retention capacity (Figure 2D).
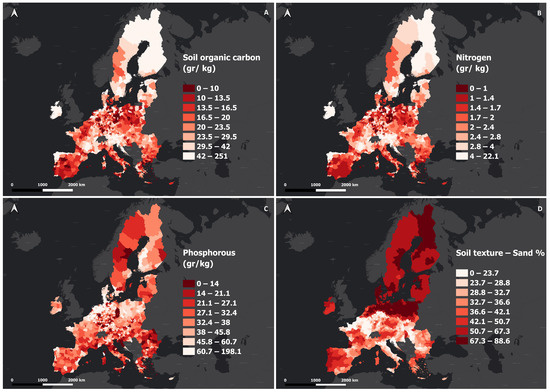
Figure 2.
Soil characteristics of the EU member states aggregated in NUTS 3 from JRC Lucas topsoil 2018 datasets. (A) Soil organic carbon (gr/kg). (B) Nitrogen (gr/kg). (C) Phosphorous (gr/kg). (D) Sand Percentage (%). Basemap in Web Mercator projection (EPSG: 3857); database originally in ETRS89/LAEA Europe (EPSG: 3035). Basemap: Esri, HERE, Garmin, FAO, NOAA, USGS, © OpenStreetMap contributors.
The highest annual precipitation occurs in Central and Northern Europe, especially in southern France, Austria, the Netherlands, and Scandinavia. In contrast, lower levels are seen in the Mediterranean and Eastern Europe, including Spain, Italy, Greece, and Poland (Figure 3A). Surface soil moisture follows a similar pattern, with higher average soil moisture levels concentrated in Central and Northern Europe, particularly in regions like France, Germany, Austria, and Scandinavia, while lower moisture levels are observed in the Mediterranean and Eastern Europe, especially Spain, Italy, Greece, Romania, and Hungary indicating more arid conditions (Figure 3B). The average number of days per year with temperatures above 10 degrees Celsius indicates a clear pattern with the highest values in Eastern Europe and Mediterranean countries, particularly southern Spain, Italy and Greece, and parts of the Balkans. Conversely, parts of Central Europe and Northern Europe, especially Scandinavia, have far fewer days above this temperature threshold (Figure 3C). Species richness from Article 17 of the Habitats Directive also shows a distinct pattern with higher biodiversity in Southern and Eastern Europe, indicating more varied ecosystems, and lower species richness in Northern and Central Europe (Figure 3D).
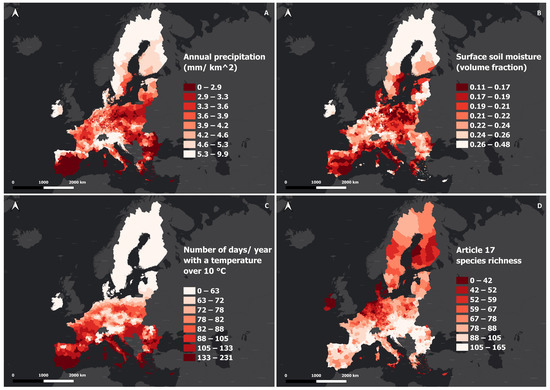
Figure 3.
Climate, soil moisture, and biodiversity characteristics in NUTS 3. (A) Annual mean precipitation in mm/km2. (B) Average surface soil moisture in volume fraction. (C) Average annual number of days with a temperature over 10 degrees Celsius. (D) Number of different Article 17 species. Basemap in Web Mercator projection (EPSG: 3857); database originally in ETRS89/LAEA Europe (EPSG: 3035). Basemap: Esri, HERE, Garmin, FAO, NOAA, USGS, © OpenStreetMap contributors.
The farm socioeconomic characteristics across Europe also show significant regional differences. The predominant farm size is generally larger in Central and Western Europe, specifically in France, Germany, and parts of Spain, with most farms exceeding 50 hectares and, in some cases, even 100. On the other hand, Mediterranean countries, including parts of Spain, Italy, Greece, and parts of Eastern Europe, are characterized by much smaller farms, with many regions dominated by farms of less than 10 hectares (Figure 4A). The economic size of farms, measured by annual income, highlights similar regional disparities. Northern and Central Europe, especially Belgium, the Netherlands, France, and parts of Germany, show larger economic sizes, with farms earning between EUR250,000 and over EUR500,000 annually. In contrast, Southern and Eastern Europe, including regions in Spain, Italy, Greece, Poland, and the Balkans, exhibit lower farm incomes, often below EUR10,000 per year, reflecting smaller-scale agricultural operations (Figure 4B). Across most of Europe, farms are primarily classified as “natural persons”, indicating they are individually or family-owned. However, notable exceptions include northern France, eastern Germany, Estonia, southern Portugal, and parts of Bulgaria, Hungary, and Romania, where farms are predominantly registered as “legal persons” (see Figure 4). Figure 4D illustrates the proportion of individual and family-owned farms relative to the total number of farms. The highest percentage of farms classified as “natural persons” is found in Greece, southern Italy, western Germany, central Poland, Austria, Slovenia, and parts of the Netherlands, with ratios exceeding 0.9.
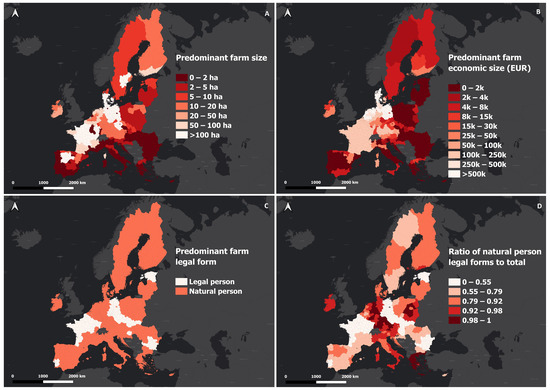
Figure 4.
Farm socioeconomic characteristics in NUTS 2. (A) Predominant NUTS 2 farm size in ha. (B) Predominant NUTS 2 farm economic size in EUR. (C) Predominant NUTS 2 farm legal form. (D) Natural person legal form-to-total ratio (0–1). Basemap in Web Mercator projection (EPSG: 3857); database originally in ETRS89/LAEA Europe (EPSG: 3035). Basemap: Esri, HERE, Garmin, FAO, NOAA, USGS, © OpenStreetMap contributors.
The geospatial distribution of rural fixed broadband coverage indicates high percentages in Central Europe, particularly in France, where coverage exceeds 99%. In contrast, parts of Northern, Eastern, and other parts of Central Europe, especially in regions of Poland and Scandinavian countries, show considerably lower coverage, with percentages falling below 80% in several areas (Figure 5A). The distribution of rural 5G network coverage shows that Italy and Central Europe have the highest levels of rural 5G availability, while Eastern Europe and Sweden have the lowest coverage (Figure 5B). Population density is also concentrated in Central and Western Europe, with regions like Belgium, the Netherlands, and Germany exceeding 500 people per square kilometer. Meanwhile, Northern Europe and Scandinavia, with their rural landscapes, have significantly lower population densities, often below 25 people per square kilometer, reflecting the more dispersed populations in these areas (Figure 5C). Finally, median elevation illustrates the diverse terrain across Europe. Mountainous regions, such as the Alps in Central Europe and the Scandinavian mountain ranges, show the highest median elevations. In contrast, large parts of Central Europe, as well as regions in Northern Europe, have much lower median elevations (Figure 5D).
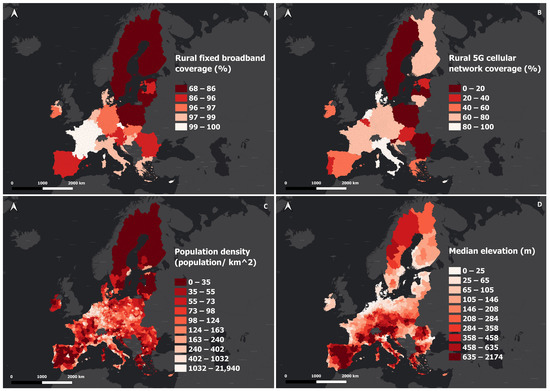
Figure 5.
Connectivity variables in NUTS 3. (A) Rural fixed broadband coverage in %. (B) Rural 5G cellular network coverage in %. (C) Population density of NUTS 3 in number of population per square kilometer. (D) Median elevation of NUTS 3 in meters. Basemap in Web Mercator projection (EPSG: 3857); database originally in ETRS89/LAEA Europe (EPSG: 3035). Basemap: Esri, HERE, Garmin, FAO, NOAA, USGS, © OpenStreetMap contributors.
3.2. Similarity Indexes: Spatial Distribution
The NCSI map (Figure 6) shows distinct regional patterns across Europe. In Southern Europe, Cluster 1 dominates most of Spain, Cyprus, Crete in Greece, and parts of Romania. Cluster 2 is common in Italy, Greece, the Balkans, and parts of France. Cluster 3 is concentrated in Central Europe, covering countries like Germany, parts of France and Belgium, Austria, and Czechia. Cluster 4 is prevalent in Northern Europe, especially across Scandinavia, the Netherlands, the Baltics, Poland, and stretching into parts of France and northern Germany. The four clusters show statistically significant differences across most environmental and soil variables, based on Welch’s t-tests. For moisture and annual precipitation, all the clusters differ significantly. Cluster 3 has the highest values for both, indicating the wettest conditions, while Cluster 1 has the lowest, suggesting the driest. In terms of soil texture, all the clusters differ except Clusters 2 and 3, which are statistically similar. For soil organic carbon (SOC), the differences are generally significant, with Clusters 1 and 2 being similar and Clusters 3 and 4 also closely matched. Cluster 3 shows the highest SOC overall, while Clusters 1 and 2 are on the lower end. When considering phosphorus in the soil, Clusters 1 and 2 are not significantly different. Cluster 4 has the highest phosphorus concentration, whereas Cluster 2 has the lowest. For nitrogen in the soil, Clusters 3 and 4 are similar, while all the others differ. Cluster 3 has the highest nitrogen levels and Cluster 2 the lowest. Lastly, for temperature-related growing conditions (degree-days > 10 °C), all the clusters differ significantly. Cluster 1 has the warmest conditions, followed by Clusters 2 and 3, with Cluster 4 being the coolest. These findings confirm that the clusters are meaningfully distinct in climate, soil texture, and nutrient availability, reflecting ecologically significant patterns.
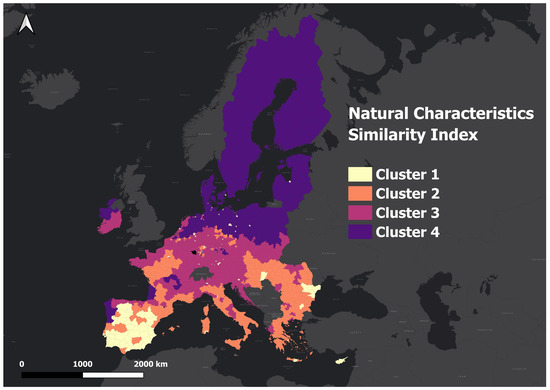
Figure 6.
Natural characteristics similarity index (Four distinct clusters). Basemap in Web Mercator projection (EPSG: 3857); database originally in ETRS89/LAEA Europe (EPSG: 3035). Basemap: Esri, HERE, Garmin, FAO, NOAA, USGS, © OpenStreetMap contributors.
The SCSI map (Figure 7) also reveals clear regional divisions. Clusters 1 and 2 dominate the Mediterranean, Sweden, Finland, the Baltics, and Eastern Europe, including countries such as Spain, Italy, Greece, Poland, and the Balkans, typically characterized by smaller farms and lower economic output. Cluster 3 covers large parts of France, Germany, and the Czech Republic. Cluster 4 completely covers Belgium, the Netherlands, and Luxembourg and some parts of Germany, France, Austria, and Spain. The four clusters show clear and statistically significant differences in both farm size and farm economic size, based on Welch’s t-tests. For farm size, most pairwise comparisons are significant, except between Clusters 1 and 2, which are statistically similar. This suggests that farms in Clusters 1 and 2 are of similar physical size. Cluster 3 contains the largest farms, while Cluster 4 also includes larger farms than Clusters 1 and 2, though smaller than those in Cluster 3. For farm economic size, a similar pattern is observed. Clusters 1 and 2 do not differ significantly and represent farms with lower economic output. Cluster 3 has a significantly higher economic size than Clusters 1 and 2, and Cluster 4 contains the most economically advanced farms. However, the difference between Clusters 3 and 4 is not statistically significant, suggesting comparable economic strength between them. In addition to these quantitative indicators, the clusters also differ in terms of legal status, a binary categorical variable that was not included in the t-tests. Although not analyzed statistically here, legal status may still play a role in the structural composition of each cluster.
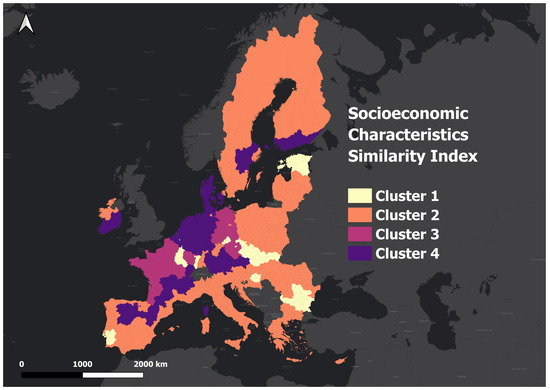
Figure 7.
Socioeconomic characteristics similarity index. (Four distinct clusters.) Basemap in Web Mercator projection (EPSG: 3857); database originally in ETRS89/LAEA Europe (EPSG: 3035). Basemap: Esri, HERE, Garmin, FAO, NOAA, USGS, © OpenStreetMap contributors.
3.3. Digital Farming Need Indices: Spatial Distribution
The FNI, INI, and PMNI provide a clear indication of regional ADS needs across Europe, with values ranging from 0 (indicating low need) to 1 (indicating high need). These indexes reflect how different regions require varying levels of intervention to support agricultural productivity and sustainability.
Significant regional differences in the need for fertilization ADSs are illustrated in the Fertilization Need Index (Figure 8). Values are especially high in the Mediterranean area, such as Greece, Italy, Spain, and Cyprus, with index values ranging between 0.57 and 0.85. These regions usually have reduced soil fertility, which necessitates improved fertilization methods to sustain crop yield. In Western Europe, covering France, Belgium, the Netherlands, and Luxembourg, there is a wide range of need for fertilization ADSs. While parts of Belgium and the Netherlands show lower values, some areas of France exhibit higher fertilization requirements. In general, the FNI in this area usually falls within a moderate range, typically ranging from 0.41 to 0.52 in index values. In Central Europe, the index values vary from moderate to high, ranging from 0.46 to 0.57. Certain areas in Germany have particularly high values, exceeding 0.6. In Eastern Europe, including Romania, Bulgaria, Hungary, parts of Poland, and the Balkans, the need is generally moderate to high, with index values ranging from 0.48 to 0.57. These areas require consistent improvements in fertilization to sustain agricultural productivity. The Scandinavian countries have the lowest index values across Europe, typically between 0 and 0.35, although some central areas of Sweden show slightly higher need.
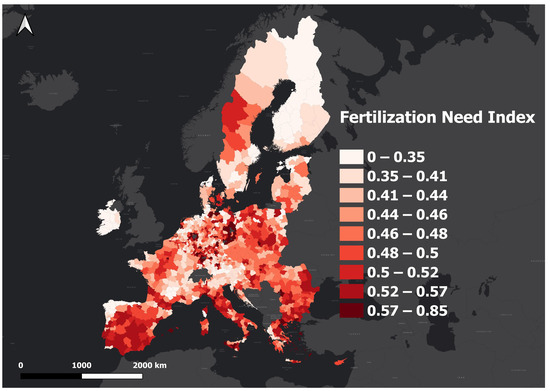
Figure 8.
Fertilization Need Index at NUTS 3 level, where 0 indicates low need and 1 indicates high need. Basemap in Web Mercator projection (EPSG: 3857); database originally in ETRS89/LAEA Europe (EPSG: 3035). Basemap: Esri, HERE, Garmin, FAO, NOAA, USGS, © OpenStreetMap contributors.
The INI (Figure 9) similarly reveals distinct regional patterns. The need for Irrigation ADSs is highest in the Mediterranean area, such as Spain, Italy, and Greece, with index values ranging from 0.53 to 0.78. The areas with the least amount of irrigation needed in Western Europe are found in southern Belgium, Luxembourg, and eastern and northern France, where the index value ranges from 0 to 0.33. However, irrigation needs are more varied in other parts of France, northern Belgium, and the Netherlands. In Central Europe, areas like southern Germany and Austria typically have low-to-moderate irrigation needs, with index values ranging from 0.28 to 0.45, whereas northeastern Germany and certain parts of Poland have higher index values. Irrigation ADS requirements in Eastern Europe, such as Romania, Bulgaria, Hungary, and the Balkans, vary from moderate to high, with index values ranging from 0.39 to 0.53. Much of Poland, in particular, exhibits very high ADS irrigation needs. In the Scandinavian countries, index values are relatively low. Finland has index values between 0 and 0.33, while Sweden and Denmark show more varied needs, ranging from low to moderate.
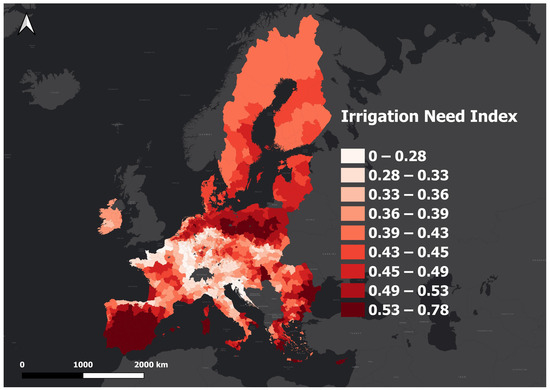
Figure 9.
Irrigation Need Index at NUTS 3 level, where 0 indicates low need and 1 indicates high need. Basemap in Web Mercator projection (EPSG: 3857); database originally in ETRS89/LAEA Europe (EPSG: 3035). Basemap: Esri, HERE, Garmin, FAO, NOAA, USGS, © OpenStreetMap contributors.
The PMNI (Figure 10) highlights notable regional differences in pest management ADS needs. In the Mediterranean area, such as Spain, Italy, and Greece, ADS pest management needs are at their peak, with index values varying from 0.57 to 0.9. In Western Europe, pest management needs vary from moderate to high, with index readings from 0.49 to 0.57 in places like Belgium and the Netherlands, while France typically has lower index values, ranging from 0.39 to 0.49. ADS pest management needs in Central Europe differ, with Germany having moderate values ranging from 0.46 to 0.53, while Austria and the Czech Republic have lower values. Eastern European countries such as Poland, Romania, Hungary, and Bulgaria are typically at a low-to-moderate level, with index values falling between 0 and 0.47. In Sweden and Finland, the PMNI has some of the lowest values in Europe, ranging from 0 to 0.43.
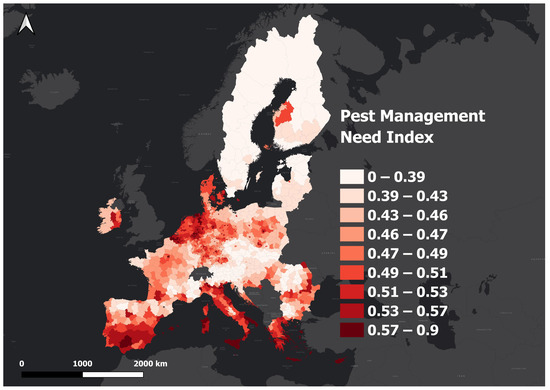
Figure 10.
Pest Management Need Index at NUTS 3 level, where 0 indicates low need and 1 indicates high need. Basemap in Web Mercator projection (EPSG: 3857); database originally in ETRS89/LAEA Europe (EPSG: 3035). Basemap: Esri, HERE, Garmin, FAO, NOAA, USGS, © OpenStreetMap contributors.
3.4. Rural Connectivity Performance Index: Spatial Distribution
The RCPI map reveals significant variations in rural connectivity across Europe, evaluated at the NUTS 3 level (Figure 11). The index ranges from 0 (indicating low rural connectivity) to 1 (indicating high rural connectivity). This index illustrates the conditions across different regions that determine their capacity to support the deployment of digital agricultural solutions, which rely heavily on adequate internet connectivity. In Western Europe, including countries such as France, Belgium, and the Netherlands, connectivity performance is particularly strong, with the highest index values ranging from 0.65 to 0.85, indicating conditions favorable for well-developed digital connectivity in rural areas. In contrast, Eastern Europe, especially in countries like Poland and parts of the Balkans, shows significantly lower connectivity, with index values predominantly between 0 and 0.42. In the Mediterranean region, Greece and Spain also display some of the lowest rural connectivity scores, with values between 0.43 and 0.5, highlighting challenges in digital infrastructure that could hinder the implementation of ADSs, while Italy indicated slightly higher connectivity values. In Scandinavian countries, Sweden exhibits very low connectivity in rural areas, with much of the country showing index values below 0.42, while Finland shows medium-to-low values between 0.43 and 0.56. This map provides a clear picture of the regions where conditions are favorable for supporting the deployment of digital agricultural technologies, based on rural connectivity performance. It highlights areas where the connectivity is strong enough to facilitate digital solutions and where improvements in connectivity are still needed to fully enable such technologies.
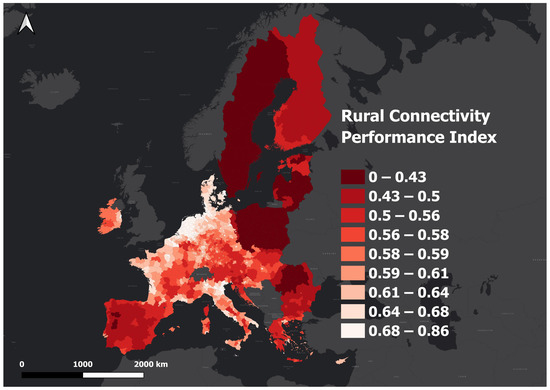
Figure 11.
Rural Connectivity Performance Index at NUTS 3 level, where 0 indicates low connectivity and 1 indicates high connectivity. Basemap in Web Mercator projection (EPSG: 3857); database originally in ETRS89/LAEA Europe (EPSG: 3035). Basemap: Esri, HERE, Garmin, FAO, NOAA, USGS, © OpenStreetMap contributors.
3.5. Indexes Interplay for ADS Adoption
To better understand how regional characteristics interact and affect the adoption of ADSs, it is crucial to connect the insights from the RCPI with the NCSI and SCSI, alongside the Digital Farming Need Indexes. Regions with low connectivity, such as parts of Southern and Eastern Europe, not only struggle with limited internet infrastructure but also rank high in ADS needs across multiple areas. These regions, identified through the NCSI as having low soil fertility and poor water retention, show high demand for fertilization and irrigation solutions. However, their low connectivity performance hinders their ability to adopt cloud-based or data-heavy ADSs that could help address these issues. In these cases, edge computing or hybrid models might be more viable, as they are less reliant on continuous internet access. On the other hand, regions in Western Europe, such as France, Belgium, and the Netherlands, exhibit high connectivity performance and, according to the SCSI, have larger, more economically resilient farms. These regions generally show moderate needs for fertilization and pest management but have the infrastructure in place to adopt cloud-based ADSs that could enhance precision-farming techniques. The combination of favorable socioeconomic conditions and strong connectivity infrastructure places these regions in a better position to scale up digital agriculture. In Central Europe, regions like Germany and Austria show moderate-to-high needs for fertilization and pest management according to the Need Indexes, while also benefiting from moderate-to-high connectivity performance. This allows for a more flexible approach to ADS adoption, where both cloud and edge computing solutions could be implemented depending on specific regional challenges. By integrating these indexes, we can see how regions with both high agricultural needs and low connectivity face compounded challenges, while those with high connectivity are better positioned to leverage advanced ADS technologies effectively. This interconnected analysis reinforces the need for tailored approaches that consider not just agricultural needs but also the technological infrastructure required to support sustainable and effective digital solutions.
4. Discussion and Conclusions
This study presents a comprehensive geospatial framework for assessing the suitability and demand for ADSs across Europe. By creating and integrating indexes of natural, socioeconomic, and connectivity characteristics, the framework enables a highly localized approach to decision-making in agricultural technology adoption. This localized approach lays the foundation for a robust decision support tool (DST) that empowers various stakeholders, including policymakers, technology providers, regional planners, and individual farmers, to precisely assess, select, and implement the most suitable ADSs based on specific local conditions. By leveraging these integrated indexes, the DST could offer actionable insights uniquely tailored to regional characteristics, thus significantly enhancing the framework’s practical applicability and facilitating targeted policy development, strategic planning, and effective deployment of digital agricultural technologies.
The framework’s primary value lies in its capacity to meaningfully support decision-makers, policymakers, farmers, and technology providers by delivering tailored recommendations aligned with each region’s specific agricultural and socioeconomic profiles. Policymakers can utilize this framework to prioritize regions requiring immediate intervention, effectively allocate resources, and implement regional policies aligned with local agricultural realities. Technology providers can benefit from clearly defined market opportunities, enabling the creation and delivery of region-specific ADSs that address targeted agricultural challenges such as connectivity gaps or socioeconomic limitations. Farmers and agricultural cooperatives gain precise, actionable recommendations, enhancing productivity, sustainability, and profitability. Additionally, the framework’s inherent scalability and flexibility promote the replication of successful ADS implementations in regions with comparable conditions, thereby accelerating the broader adoption and sustainable integration of digital agriculture solutions across Europe.
The indexes of natural and socioeconomic similarity show that Europe has a wide variety of agricultural landscapes, each with unique regional characteristics that mirror different environmental and socioeconomic circumstances. These indexes help categorize regions with similar characteristics, thereby facilitating the identification and deployment of ADSs that are tailored to the specific needs of each area. For instance, the NCSI identified most of the Mediterranean region as a distinct cluster, which shares specific natural conditions such as soil and climate characteristics that influence the choice of suitable digital agricultural solutions. The decision to use these two separate indexes, rather than a single index containing all variables, was made to provide greater flexibility for end-users, allowing them to focus on specific regional factors that are most relevant to their needs. Furthermore, certain ADSs, particularly those leveraging AI models trained on local datasets, may require even more specialized indexes to ensure accuracy and effectiveness. For instance, an AI-based solution for assessing soil organic carbon (SOC) that relies on local spectrometer data would benefit from a soil condition similarity index to better match regional soil characteristics. Similarly, an ADS designed to detect specific pests might require a climatic similarity index to account for weather patterns that influence pest prevalence, allowing for more targeted and reliable applications in varying environments.
The FNI, INI, and PMNI further illustrate the regional variations in demand for digital tools for key agricultural processes, such as fertilization, irrigation, and pest management. In regions like the Mediterranean and some parts of Eastern Europe, where soil fertility and water retention are limited, there is a definite requirement for sophisticated digital solutions to tackle these issues. Conversely, areas in Western and Central Europe with better natural conditions have lower needs, highlighting the significance of tailored digital strategies. The high pest management needs in southern regions highlight the influence of warmer climates on pest activity, reinforcing the necessity for targeted pest control technologies. Future research could enhance these indexes by incorporating additional variables that capture dynamic agricultural changes over time, such as evolving climate conditions, crop rotation patterns, or new soil health indicators. Integrating real-time data could further improve the accuracy of the Need Indexes, allowing them to adapt to fluctuations in environmental and agricultural conditions.
The RCPI sheds light on the significant disparities in rural connectivity across Europe. High-performing regions in Western Europe, such as France, Belgium, and the Netherlands, are well positioned to adopt cloud-based ADSs, given their strong digital infrastructure. Conversely, countries like Poland, Greece, and parts of Scandinavia face challenges with low rural connectivity, which could limit the effective implementation of ADSs. In these regions, edge computing or hybrid models may be more appropriate, where reliance on continuous internet access is minimized. To further improve this index, future research could focus on creating two distinct indexes: one assessing the suitability for cloud-based ADSs and another tailored to edge-based solutions. The latter would benefit from integrating datasets from low-power wide-area network (LPWAN) providers, such as LoRaWAN and Sigfox, which specifically track connectivity options ideal for edge computing. This dual-index approach would enable a precise understanding of regional connectivity capacities, providing clearer guidance on the most feasible ADS infrastructure for each area. Such refinement would ensure that ADS recommendations align more closely with each region’s connectivity realities, enhancing the effectiveness and reach of digital agricultural solutions.
While this framework provides a robust method for assessing the suitability of ADSs across Europe, certain limitations should be considered. Firstly, the framework relies on available open-source datasets, which are often static and may not fully capture real-time changes in environmental conditions, socioeconomic factors, or connectivity. In addition, certain relevant variables that could enhance future studies—such as pesticide use—rely on data from regional authorities, which is not always accessible or standardized. This reliance on static data may affect the responsiveness of the indexes to evolving agricultural needs and infrastructure developments. Secondly, the current framework assumes that regional conditions remain relatively stable over time. However, factors such as climate change, shifts in agricultural practices, and technological advancements in connectivity infrastructure could lead to significant changes in regional suitability for specific ADSs. As a result, the recommendations provided by the framework may become less accurate over time unless updated regularly with new data. Another important limitation is the spatial granularity of the datasets used, which may not capture fine-scale variations within regions. Many of the datasets are aggregated at larger regional levels (e.g., NUTS 2 or NUTS 3), which could overlook local differences that are crucial for precision agriculture. This level of aggregation might limit the framework’s effectiveness for smaller regions or highly heterogeneous areas where sub-regional variations in soil quality, climate, or connectivity could significantly impact ADS suitability. However, it is important to note that policymakers often use these regional levels to adopt and implement legislation, making them a practical and relevant scale for broader decision-making. For finer spatial scales, local (municipality) level data collection could potentially address sub-regional variability, but such data would likely be less standardized and potentially less reliable, posing additional challenges for consistency and comparability. In addition, while our current analysis emphasizes spatial trends and relative rankings derived from multi-criteria decision-making methods, we acknowledge that further validation of the relationships among soil, climate, and connectivity factors with ADS needs could be beneficial. Future studies should consider incorporating statistical significance tests and correlation analyses using more granular or independently sourced datasets to rigorously validate these relationships and further refine our framework.
A promising direction for future research is the development of an environmental impact index, offering a nuanced view of regions under ecological stress. This index could identify areas where sustainable practices are most needed or where they could have the greatest impact on European ecology, focusing on regions for ecological improvements and ensuring that ADS recommendations align with governmental initiatives promoting conservation and environmental stewardship. Another key avenue involves refining the methodology to account for predominant crop types, specific crop needs, and economic value. A crop-aware approach would tailor ADS recommendations to each region’s agricultural profile. For example, irrigation needs could be assessed with greater accuracy by factoring in crop type and economic value, resulting in more effective and profitable ADS applications. By aligning digital solutions with region-specific agricultural and economic priorities, the framework can deliver targeted recommendations that enhance both productivity and sustainability across diverse landscapes.
Author Contributions
Conceptualization, Theodoros Chalazas, Antonis Koukourikos, Nikos Kalatzis, Panagiotis Ilias, Nikolaos Marianos and Christopher Brewster; Data curation, Theodoros Chalazas, Antonis Koukourikos, Jan Bauwens, Nick Berkvens and Jonathan Van Beek; Formal analysis, Theodoros Chalazas, Antonis Koukourikos, Jan Bauwens, Nick Berkvens and George Papadopoulos; Funding acquisition, Nikos Kalatzis, Panagiotis Ilias, Nikolaos Marianos and Christopher Brewster; Methodology, Theodoros Chalazas, Antonis Koukourikos, Jan Bauwens, Nick Berkvens, Jonathan Van Beek and Nikolaos Marianos; Supervision, Panagiotis Ilias, Nikolaos Marianos and Christopher Brewster; Visualization, Theodoros Chalazas and Jan Bauwens; Writing—original draft, Theodoros Chalazas, Antonis Koukourikos, Jan Bauwens, Nick Berkvens and Jonathan Van Beek; Writing—review and editing, Nikos Kalatzis, George Papadopoulos, Panagiotis Ilias, Nikolaos Marianos, and Christopher Brewster. All authors have read and agreed to the published version of the manuscript.
Funding
Parts of the work presented here were funded by the European Commission within the H2020 Programme project: “OpenAgri—Democratising digital farming through tailored open source and open hardware solutions” under grant agreement no. 101134083 (https://horizon-openagri.eu/) (accessed on 23 April 2025).
Data Availability Statement
The geospatial database created and used in this study, provided in GeoPackage format, along with a detailed .md documentation file, is available at https://github.com/openagri-eu/Geodatabase_OpenAgri (accessed on 23 April 2025). The documentation outlines the structure, methodology, and instructions for using the dataset.
Acknowledgments
The LUCAS 2018 topsoil dataset used in this work was made available by the European Commission through the European Soil Data Centre managed by the Joint Research Centre (JRC), http://esdac.jrc.ec.europa.eu/ (accessed on 23 April 2025).
Conflicts of Interest
The authors declare no conflicts of interest.
Abbreviations
The following abbreviations are used in this manuscript:
| ADS | Agricultural Digital Solution |
| FNI | Fertilization Need Index |
| INI | Irrigation Need Index |
| PMNI | Pest Management Need Index |
| NCSI | Natural Characteristics Similarity Index |
| SCSI | Socioeconomic Characteristics Similarity Index |
| RCPI | Rural Connectivity Performance Index |
| NUTS | Nomenclature of Territorial Units for Statistics |
| EO | Earth Observation |
| EU | European Union |
| JRC | Join Research Center |
| FAPAR | Fraction of Absorbed Photosynthetically Active Radiation |
References
- Papadopoulos, G.; Arduini, S.; Uyar, H.; Psiroukis, V.; Kasimati, A.; Fountas, S. Economic and environmental benefits of digital agricultural technologies in crop production: A review. Smart Agric. Technol. 2024, 8, 100441. [Google Scholar] [CrossRef]
- Bongiovanni, R.; Lowenberg-Deboer, J. Precision Agriculture and Sustainability. Precis. Agric. 2004, 5, 359–38787. [Google Scholar] [CrossRef]
- Karunathilake, E.M.B.M.; Le, A.T.; Heo, S.; Chung, Y.S.; Mansoor, S. The Path to Smart Farming: Innovations and Opportunities in Precision Agriculture. Agriculture 2023, 13, 1593. [Google Scholar] [CrossRef]
- Tripathi, A.; Tiwari, R.K.; Tiwari, S.P. A deep learning multi-layer perceptron and remote sensing approach for soil health based crop yield estimation. Int. J. Appl. Earth Obs. Geoinf. 2022, 113, 102959. [Google Scholar] [CrossRef]
- Harmanny, K.S.; Malek, Ž. Adaptations in irrigated agriculture in the Mediterranean region: An overview and spatial analysis of implemented strategies. Reg. Environ. Change 2019, 19, 1401–1416. [Google Scholar] [CrossRef]
- Abiri, R.; Rizan, N.; Balasundram, S.K.; Shahbazi, A.B.; Abdul-Hamid, H. Application of digital technologies for ensuring agricultural productivity. Heliyon 2023, 9, e22601. [Google Scholar] [CrossRef]
- Dibbern, T.; Romani, L.A.S.; Massruhá, S.M.F.S. Main drivers and barriers to the adoption of Digital Agriculture technologies. Smart Agric. Technol. 2024, 8, 100459. [Google Scholar] [CrossRef]
- Salemink, K.; Strijker, D.; Bosworth, G. Rural development in the digital age: A systematic literature review on unequal ICT availability, adoption, and use in rural areas. J. Rural Stud. 2017, 54, 360–371. [Google Scholar] [CrossRef]
- Ofori, M.; El-Gayar, O. Drivers and challenges of precision agriculture: A social media perspective. Precis. Agric. 2021, 22, 1019–1044. [Google Scholar] [CrossRef]
- FairShare Project. Available online: https://fairshare-pnf.eu/ (accessed on 2 April 2025).
- Quantifarm Toolkit. Available online: https://quantifarmtoolkit.eu/index.html (accessed on 2 April 2025).
- Zhai, Z.; Martínez, J.F.; Beltran, V.; Martínez, N.L. Decision support systems for agriculture 4.0: Survey and challenges. Comput. Electron. Agric. 2020, 170, 105256. [Google Scholar] [CrossRef]
- Fountas, S.; Carli, G.; Sørensen, C.; Tsiropoulos, Z.; Cavalaris, C.; Vatsanidou, A.; Liakos, B.; Canavari, M.; Wiebensohn, J.; Tisserye, B. Farm management information systems: Current situation and future perspectives. Comput. Electron. Agric. 2015, 115, 40–50. [Google Scholar] [CrossRef]
- Nash, E.; Korduan, P.; Bill, R. Applications of open geospatial web services in precision agriculture: A review. Precis. Agric. 2009, 10, 546–560. [Google Scholar] [CrossRef]
- Kim, S.J.; Park, S.; Lee, S.J.; Shaimerdenova, A.; Kim, J.; Park, E.; Lee, W.; Kim, G.S.; Kim, N.; Kim, T.H.; et al. Developing spatial agricultural drought risk index with controllable geo-spatial indicators: A case study for South Korea and Kazakhstan. Int. J. Disaster Risk Reduct. 2021, 54, 102056. [Google Scholar] [CrossRef]
- Murthy, C.; Laxman, B.; Sai, M.S. Geospatial analysis of agricultural drought vulnerability using a composite index based on exposure, sensitivity and adaptive capacity. Int. J. Disaster Risk Reduct. 2015, 12, 163–171. [Google Scholar] [CrossRef]
- Kross, A.; Kaur, G.; Jaeger, J.A. A geospatial framework for the assessment and monitoring of environmental impacts of agriculture. Environ. Impact Assess. Rev. 2022, 97, 106851. [Google Scholar] [CrossRef]
- López-Ridaura, S.; Masera, O.; Astier, M. Evaluating the sustainability of complex socio-environmental systems. The MESMIS framework. Ecol. Indic. 2002, 2, 135–148. [Google Scholar] [CrossRef]
- Van Cauwenbergh, N.; Biala, K.; Bielders, C.; Brouckaert, V.; Franchois, L.; Garcia Cidad, V.; Hermy, M.; Mathijs, E.; Muy, B.; Reijnders, J.; et al. SAFE—A hierarchical framework for assessing the sustainability of agricultural systems. Agric. Ecosyst. Environ. 2007, 120, 229–242. [Google Scholar] [CrossRef]
- Mottet, A.; Bicksler, A.; Lucantoni, D.; De Rosa, F.; Scherf, B.; Scopel, E.; López-Ridaura, S.; Gemmil-Herren, B.; Kerr, R.B.; Sourisseau, J.-M.; et al. Assessing Transitions to Sustainable Agricultural and Food Systems: A Tool for Agroecology Performance Evaluation (TAPE). Front. Sustain. Food Syst. 2020, 4, 579154. [Google Scholar] [CrossRef]
- Bathaei, A.; Štreimikienė, D. A Systematic Review of Agricultural Sustainability Indicators. Agriculture 2023, 13, 241. [Google Scholar] [CrossRef]
- Pingali, P.L. Green Revolution: Impacts, limits, and the path ahead. Proc. Natl. Acad. Sci. USA 2012, 109, 12302–12308. [Google Scholar] [CrossRef]
- IRRIFRAME. Available online: https://www.irriframe.it/irriframe/home/index_er (accessed on 2 April 2025).
- Sativum. Available online: https://www.sativum.es/web/sativum (accessed on 2 April 2025).
- OECD. Bridging the Rural Digital Divide; OECD Digital Economy Papers, No. 265; OECD Publishing: Paris, France, 2018. [Google Scholar] [CrossRef]
- LiteFarm. Available online: https://www.litefarm.org/ (accessed on 2 April 2025).
- Eurostat. Available online: https://ec.europa.eu/eurostat (accessed on 2 April 2025).
- European Union’s Rural Observatory. Available online: https://observatory.rural-vision.europa.eu/?lng=en&ctx=RUROBS (accessed on 2 April 2025).
- Joint Research Centre (JRC). Available online: https://data.jrc.ec.europa.eu/dataset (accessed on 2 April 2025).
- Panagos, P.; Van Liedekerke, M.; Borrelli, P.; Köninger, J.; Ballabio, C.; Orgiazzi, A.; Lugato, E.; Liakos, L.; Hervas, J.; Jones, A.; et al. European Soil Data Centre 2.0: Soil data and knowledge in support of the EU policies. Eur. J. Soil Sci. 2022, 73, e13315. [Google Scholar] [CrossRef]
- Eurostat GISCO—Territorial Units for Statistics (NUTS). Available online: https://ec.europa.eu/eurostat/web/gisco/geodata/statistical-units/territorial-units-statistics (accessed on 2 April 2025).
- European Commission. Council Directive 92/43 CEE on the Conservation of Natural Habitats and of Wild Fauna and Flora. European Community Gazzette, 22 July 1992; pp. 1–50. [Google Scholar]
- European Soil Data Centre (ESDAC). LUCAS 2018 Topsoil Data. Available online: https://esdac.jrc.ec.europa.eu/content/lucas-2018-topsoil-data (accessed on 2 April 2025).
- Fernandez, U.O.; Scarpa, S.; Orgiazzi, A.; Panagos, P.; Van, L.M.; Maréchal, A.; Jones, A. LUCAS 2018 Soil Module; JRC Publications Repository: Luxembourg; Publications Office of the European Union: Luxembourg, 2022. [Google Scholar] [CrossRef]
- Orgiazzi, A.; Ballabio, C.; Panagos, P.; Jones, A.; Fernández-Ugalde, O. LUCAS Soil, the largest expandable soil dataset for Europe: A review. Eur. J. Soil Sci. 2018, 69, 140–153. [Google Scholar] [CrossRef]
- European Soil Data Centre (ESDAC). Topsoil Physical Properties for Europe Based on LUCAS Topsoil Data. Available online: https://esdac.jrc.ec.europa.eu/content/topsoil-physical-properties-europe-based-lucas-topsoil-data (accessed on 2 April 2025).
- Ballabio, C.; Panagos, P.; Monatanarella, L. Mapping topsoil physical properties at European scale using the LUCAS database. Geoderma 2016, 261, 110–123. [Google Scholar] [CrossRef]
- Copernicus Climate Change Service (C3S). Available online: https://climate.copernicus.eu/ (accessed on 2 April 2025).
- Hersbach, H.; Bell, B.; Berrisford, P.; Hirahara, S.; Horányi, A.; Muñoz-Sabater, J.; Nicolas, J.; Peubey, C.; Radu, R.; Schepers, D.; et al. The ERA5 global reanalysis. Q. J. R. Meteorol. Soc. 2020, 146, 1999–2049. [Google Scholar] [CrossRef]
- Entekhabi, D.; Njoku, E.G.; O’Neill, P.E.; Kellogg, K.H.; Crow, W.T.; Edelstein, W.N.; Entin, J.K.; Goodman, S.D.; Jackson, T.J.; Johnson, J.; et al. The Soil Moisture Active Passive (SMAP) Mission. Proc. IEEE 2010, 98, 704–716. [Google Scholar] [CrossRef]
- Hengl, T.; Walsh, M.G.; Sanderman, J.; Wheeler, I.; Harrison, S.P.; Prentice, I.C. Global mapping of potential natural vegetation: An assessment of machine learning algorithms for estimating land potential. PeerJ 2018, 6, e5457. [Google Scholar] [CrossRef]
- European Environment Agency (EEA). Article 17 Spatial Data—Habitats Directive. Available online: https://www.eea.europa.eu/data-and-maps/data/article-17-database-habitats-directive-92-43-eec-2/article-17-2020-spatial-data/article-17-2020-spatial-data-geodatabase (accessed on 2 April 2025).
- Copernicus Land Monitoring Service. Available online: https://land.copernicus.eu/en (accessed on 2 April 2025).
- Corine Land Cover 2018 Dataset. Available online: https://sdi.eea.europa.eu/catalogue/copernicus/api/records/71c95a07-e296-44fc-b22b-415f42acfdf0?language=all (accessed on 2 April 2025).
- Herrick, J.E.; Wander, M.M. Relationships Between Soil Organic Carbon and Soil Quality in Cropped and Rangeland Soils: The Importance of Distribution, Composition, and Soil Biological Activity. In Soil Processes and the Carbon Cycle; CRC Press: Boca Raton, FL, USA, 2018; pp. 405–425. [Google Scholar] [CrossRef]
- Fageria, N.K.; Baligar, V.C.; Li, Y.C. The Role of Nutrient Efficient Plants in Improving Crop Yields in the Twenty First Century. J. Plant Nutr. 2008, 31, 1121–1157. [Google Scholar] [CrossRef]
- Hillel, D. Introduction to Environmental Soil Physics; Elsevier: Amsterdam, The Netherlands, 2003. [Google Scholar]
- Saxton, K.E.; Rawls, W.J. Soil Water Characteristic Estimates by Texture and Organic Matter for Hydrologic Solutions. Soil Sci. Soc. Am. J. 2006, 70, 1569–1578. [Google Scholar] [CrossRef]
- Wang, C.; Fu, B.; Zhang, L.; Xu, Z. Soil moisture–plant interactions: An ecohydrological review. J. Soils Sediments 2018, 19, 1–9. [Google Scholar] [CrossRef]
- Meroni, M.; Rembold, F.; Verstraete, M.M.; Gommes, R.; Schucknecht, A.; Beye, G. Investigating the Relationship Between the Inter-Annual Variability of Satellite-Derived Vegetation Phenology and a Proxy of Biomass Production in the Sahel. Remote Sens. 2014, 6, 5868–5884. [Google Scholar] [CrossRef]
- Deutsch, C.A.; Tewksbury, J.J.; Tigchelaar, M.; Battisti, D.S.; Merrill, S.C.; Huey, R.B.; Naylor, R.L. Increase in crop losses to insect pests in a warming climate. Science 2018, 361, 916–919. [Google Scholar] [CrossRef] [PubMed]
- Alyokhin, A.V.; Ferro, D.N. Reproduction and Dispersal of Summer-Generation Colorado Potato Beetle (Coleoptera: Chrysomelidae). Environ. Entomol. 1999, 28, 425–430. [Google Scholar] [CrossRef]
- Tscharntke, T.; Klein, A.M.; Kruess, A.; Steffan-Dewenter, I.; Thies, C. Landscape perspectives on agricultural intensification and biodiversity—ecosystem service management. Ecol. Lett. 2005, 8, 857–874. [Google Scholar] [CrossRef]
- Eurostat. Farm Management Dataset. Available online: https://ec.europa.eu/eurostat/databrowser/view/ef_m_farmang/default/table?lang=en (accessed on 2 April 2025).
- Moga, L.M.; Constantin, D.L.; Antohi, V.M. A regional approach of the information technology adoption in the Romanian agricultural farms. Inform. Econ. 2012, 16, 29. [Google Scholar]
- Copernicus DEM. Available online: https://doi.org/10.5270/ESA-c5d3d65 (accessed on 2 April 2025).
- Schiavina, M.; Melchiorri, M.; Pesaresi, M.; Politis, P.; Freire, S.; Maffenini, L.; Florio, P.; Ehrlich, D.; Goch, K.; Tommasi, P.; et al. GHSL Data Package 2022; Publications Office of the European Union: Luxembourg, 2022. [Google Scholar]
- Eurostat. Broadband Internet Coverage by Technology Dataset. Available online: https://ec.europa.eu/eurostat/databrowser/view/isoc_cbt/default/table?lang=en (accessed on 2 April 2025).
- Kurner, T.; Cichon, D.; Wiesbeck, W. Concepts and results for 3D digital terrain-based wave propagation models: An overview. IEEE J. Sel. Areas Commun. 1993, 11, 1002–1012. [Google Scholar] [CrossRef]
- Rachfal, C.L. Persistent Digital Divide: Selected Broadband Deployment Issues and Policy Considerations; CRS Report R47506; Congressional Research Service: Washington, DC, USA, 2023. Available online: https://crsreports.congress.gov/product/pdf/R/R47506 (accessed on 24 January 2025).
- Jones, J.W.; Antle, J.M.; Basso, B.; Boote, K.J.; Conant, R.T.; Foster, I.; Godfray, H.C.J.; Herrero, M.; Howitt, R.E.; Janssen, S.; et al. Toward a new generation of agricultural system data, models, and knowledge products: State of agricultural systems science. Agric. Syst. 2017, 155, 269–288. [Google Scholar] [CrossRef]
- McInnes, L.; Healy, J.; Melville, J. UMAP: Uniform Manifold Approximation and Projection for Dimension Reduction. arXiv 2020. [Google Scholar] [CrossRef]
- Sugar, C.A.; James, G.M. Finding the Number of Clusters in a Dataset: An Information-Theoretic Approach. J. Am. Stat. Assoc. 2003, 98, 750–763. [Google Scholar] [CrossRef]
- Macqueen, J. Some methods for classification and analysis of multivariate observations. In Proceedings of the 5-th Berkeley Symposium on Mathematical Statistics and Probability, Davis, CA, USA, 21 June–18 July 1965; University of California Press: Berkeley, CA, USA, 1967. [Google Scholar]
- Welch, B.L. The Generalization of ‘Student’s’ Problem when Several Different Population Variances are Involved. Biometrika 1947, 34, 28–35. [Google Scholar] [CrossRef]
- Tzeng, G.-H.; Huang, J.-J. Multiple Attribute Decision Making: Methods and Applications; CRC Press: Boca Raton, FL, USA, 2011. [Google Scholar]
- Antle, J.M.; Jones, J.W.; Rosenzweig, C. Next generation agricultural system models and knowledge products: Synthesis and strategy. Agric. Syst. 2017, 155, 179–185. [Google Scholar] [CrossRef]
Disclaimer/Publisher’s Note: The statements, opinions and data contained in all publications are solely those of the individual author(s) and contributor(s) and not of MDPI and/or the editor(s). MDPI and/or the editor(s) disclaim responsibility for any injury to people or property resulting from any ideas, methods, instructions or products referred to in the content. |
© 2025 by the authors. Published by MDPI on behalf of the International Society for Photogrammetry and Remote Sensing. Licensee MDPI, Basel, Switzerland. This article is an open access article distributed under the terms and conditions of the Creative Commons Attribution (CC BY) license (https://creativecommons.org/licenses/by/4.0/).