Article

Unveiling the Spatial Inequality of Accessibility to High-Quality Healthcare Resources in the Beijing–Tianjin–Hebei Urban Agglomeration of China: A Focus on the Impacts of Intercity Patient Mobility

Faculty of Geographical Science, Beijing Normal University, Beijing 100875, China
*
Author to whom correspondence should be addressed.
These authors contributed equally to this work.
ISPRS Int. J. Geo-Inf. 2025, 14(4), 168; https://doi.org/10.3390/ijgi14040168
Submission received: 2 March 2025 / Revised: 31 March 2025 / Accepted: 10 April 2025 / Published: 11 April 2025
(This article belongs to the Special Issue HealthScape: Intersections of Health, Environment, and GIS&T)

Abstract

:
The equality of accessibility to high-quality healthcare resources is an important issue in the development of urban agglomerations. However, comprehensive consideration of the impacts of intercity patient mobility and multilevel transportation networks is still lacking. This study develops a novel directional two-step floating catchment area method for measuring spatial accessibility to high-quality hospitals in the Beijing–Tianjin–Hebei (BTH) urban agglomeration. This method emphasizes the direction of intercity patient mobility caused by the hierarchy of high-quality healthcare resource distributions. Empirical analyses were conducted based on subdistrict-level population census data in 2020, 3-A hospital data from healthcare commissions, and door-to-door travel time data via multilevel intercity transportation networks from online maps in 2023. The analyses revealed obvious spatial inequalities in accessibility to high-quality healthcare resources in the BTH urban agglomeration, which is primarily caused by intercity inequality. Intercity patient mobility, however, can significantly mitigate the spatial inequality of healthcare accessibility within the BTH urban agglomeration. Moreover, it was determined that intracity first-mile and last-mile transfer transportation is the major barrier to intercity healthcare seeking and accessibility. This study has valuable implications for the planning and management of high-quality healthcare resources and intercity patient mobility in the BTH urban agglomeration. The developed methods are useful for measuring healthcare accessibility and inequality at the urban agglomeration scale.

1. Introduction

Good health is at the core of basic human needs, and as such, it has gained increasing attention as socioeconomic development has continued to progress. “Good health and well-being” is highlighted as one of the 17 Sustainable Development Goals adopted by the United Nations [1]. Among the diverse determinants of health, healthcare services are of great importance and have drawn extensive attention. Access to healthcare services can be interpreted from various dimensions, e.g., accessibility, availability, accommodation, affordability, and acceptability (the five “A”s) [2]. According to the conceptual framework of Khan [3], spatial accessibility integrates the accessibility and availability dimensions, whereas aspatial accessibility refers mainly to the other three dimensions. From a spatial perspective, residents must overcome a certain distance impedance via certain transport modes to access healthcare services, the ease of which can be captured by the concept of spatial accessibility [4,5].
Spatial accessibility has been widely applied as a useful tool for evaluating the spatial configuration of healthcare and other types of services, and various methods have been developed [6,7,8,9]. Among these methods, the two-step floating catchment area (2SFCA) method has been widely applied and extended [10,11]. The inequality of spatial accessibility has been widely adopted as an operational definition and measurement of the spatial inequity of healthcare services [12,13]. Since the spatial accessibility measured using the 2SFCA method can be interpreted as potential opportunities for healthcare services per person, the inequality of spatial accessibility can directly represent the inequality of opportunities [14]. Existing studies have recognized the existence of inequality in healthcare services at various spatial scales, e.g., the city scale [15,16], the provincial scale [17,18], the national scale [19,20,21], the (sub-)continental scale [22,23], and even the global scale [24].
The supply of and demand for healthcare services are closely associated with the processes and patterns of urbanization. In the global context, an emerging phenomenon is that urbanized areas spread beyond the boundaries of cities, and multiple parts of urbanized areas are connected by intense socioeconomic interactions [25]. This phenomenon was first observed by Gottman [26] in the development of the concept of a metropolis. Several similar concepts have been adopted by researchers around the world, including the global city-region [27] and the megaregion [28] in the U.S. context, the polycentric urban region [29] and megacity region [25] in the European context, and the Desakota region [30] in the Asian context. In China, the concept of urban agglomeration has been proposed and widely applied in academic studies and planning practices [31]. In the National New-type Urbanization Plan issued by the central government of China [32], urban agglomerations have been endowed with the critical role of “the main form of urbanization”. Owing to the intense flows of people, goods, and information between cities, transport accessibility and mobility within urban agglomerations have drawn extensive attention [33,34,35,36]. Rail, especially high-speed rail, is considered a promising and efficient solution for intercity transportation at the urban agglomeration scale [37,38].
With the emergence of urban agglomerations, the spatial accessibility of healthcare services and its inequality at the urban agglomeration scale has attracted increasing attention. Existing studies have revealed an uneven distribution of healthcare resources across cities [39,40]. Additionally, regional disparities in healthcare resources require patients to move across administrative boundaries to meet their needs, which is captured by the concept of patient mobility [41,42]. Previous studies have focused on the spatial patterns and determinants of intercity patient mobility [42,43,44,45]. A recent study demonstrated that intercity patient mobility can improve spatial accessibility to both existing and optimized high-quality healthcare resources within an urban agglomeration [46]. Furthermore, there is a tendency for core cities with more high-quality healthcare resources to offer more services to patients, which has an impact on healthcare accessibility at the urban agglomeration scale [47]. Intercity transportation (including rail) has significant impacts on the inequality of healthcare accessibility [48]. However, there is still a research gap with respect to the direction of intercity patient mobility and its impacts on the inequality of accessibility to healthcare resources at the urban agglomeration scale.
Therefore, the aim of this study is to develop a novel method for measuring spatial accessibility to healthcare services at the urban agglomeration scale. The proposed method makes marginal methodological improvements from two aspects. First, this method considers the hierarchy of high-quality healthcare services and the direction of intercity patient mobility. Second, it emphasizes the role of multilevel rail transportation networks in supporting intercity patient mobility. The Beijing–Tianjin–Hebei urban agglomeration, one of the largest urban agglomerations in China, was selected as the study area to illustrate the applicability of the proposed method.

2. Methods and Data

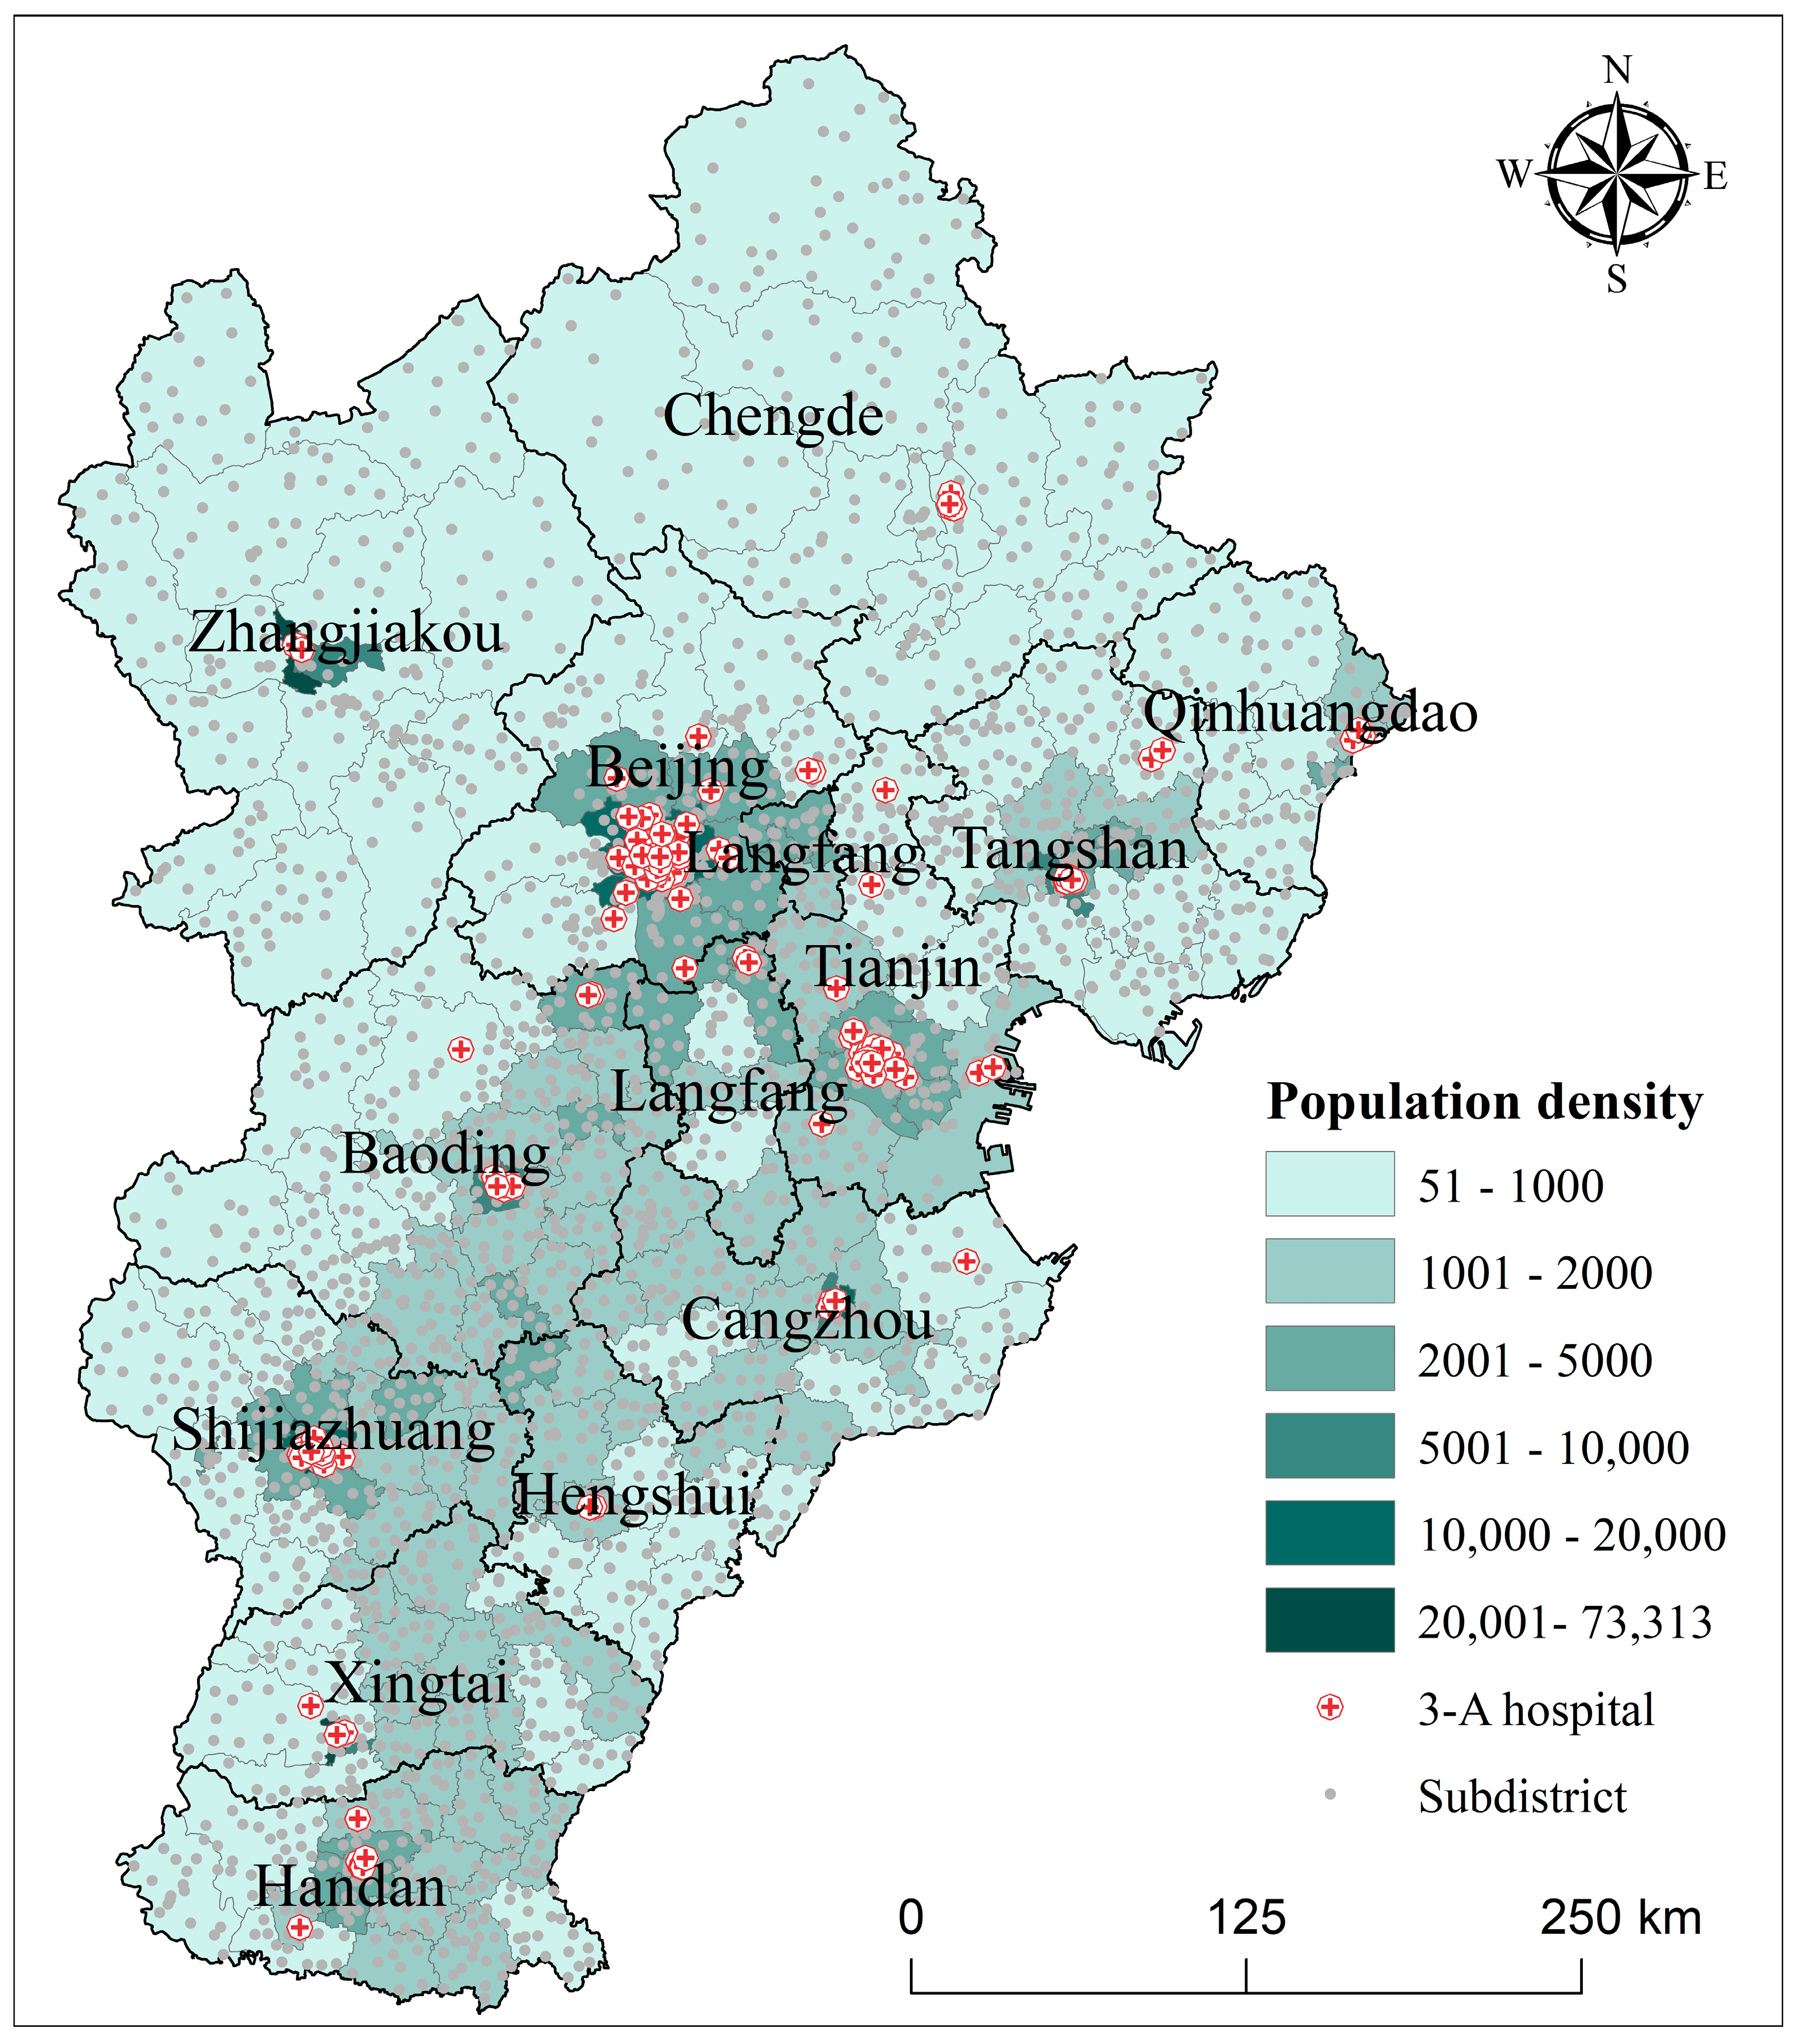
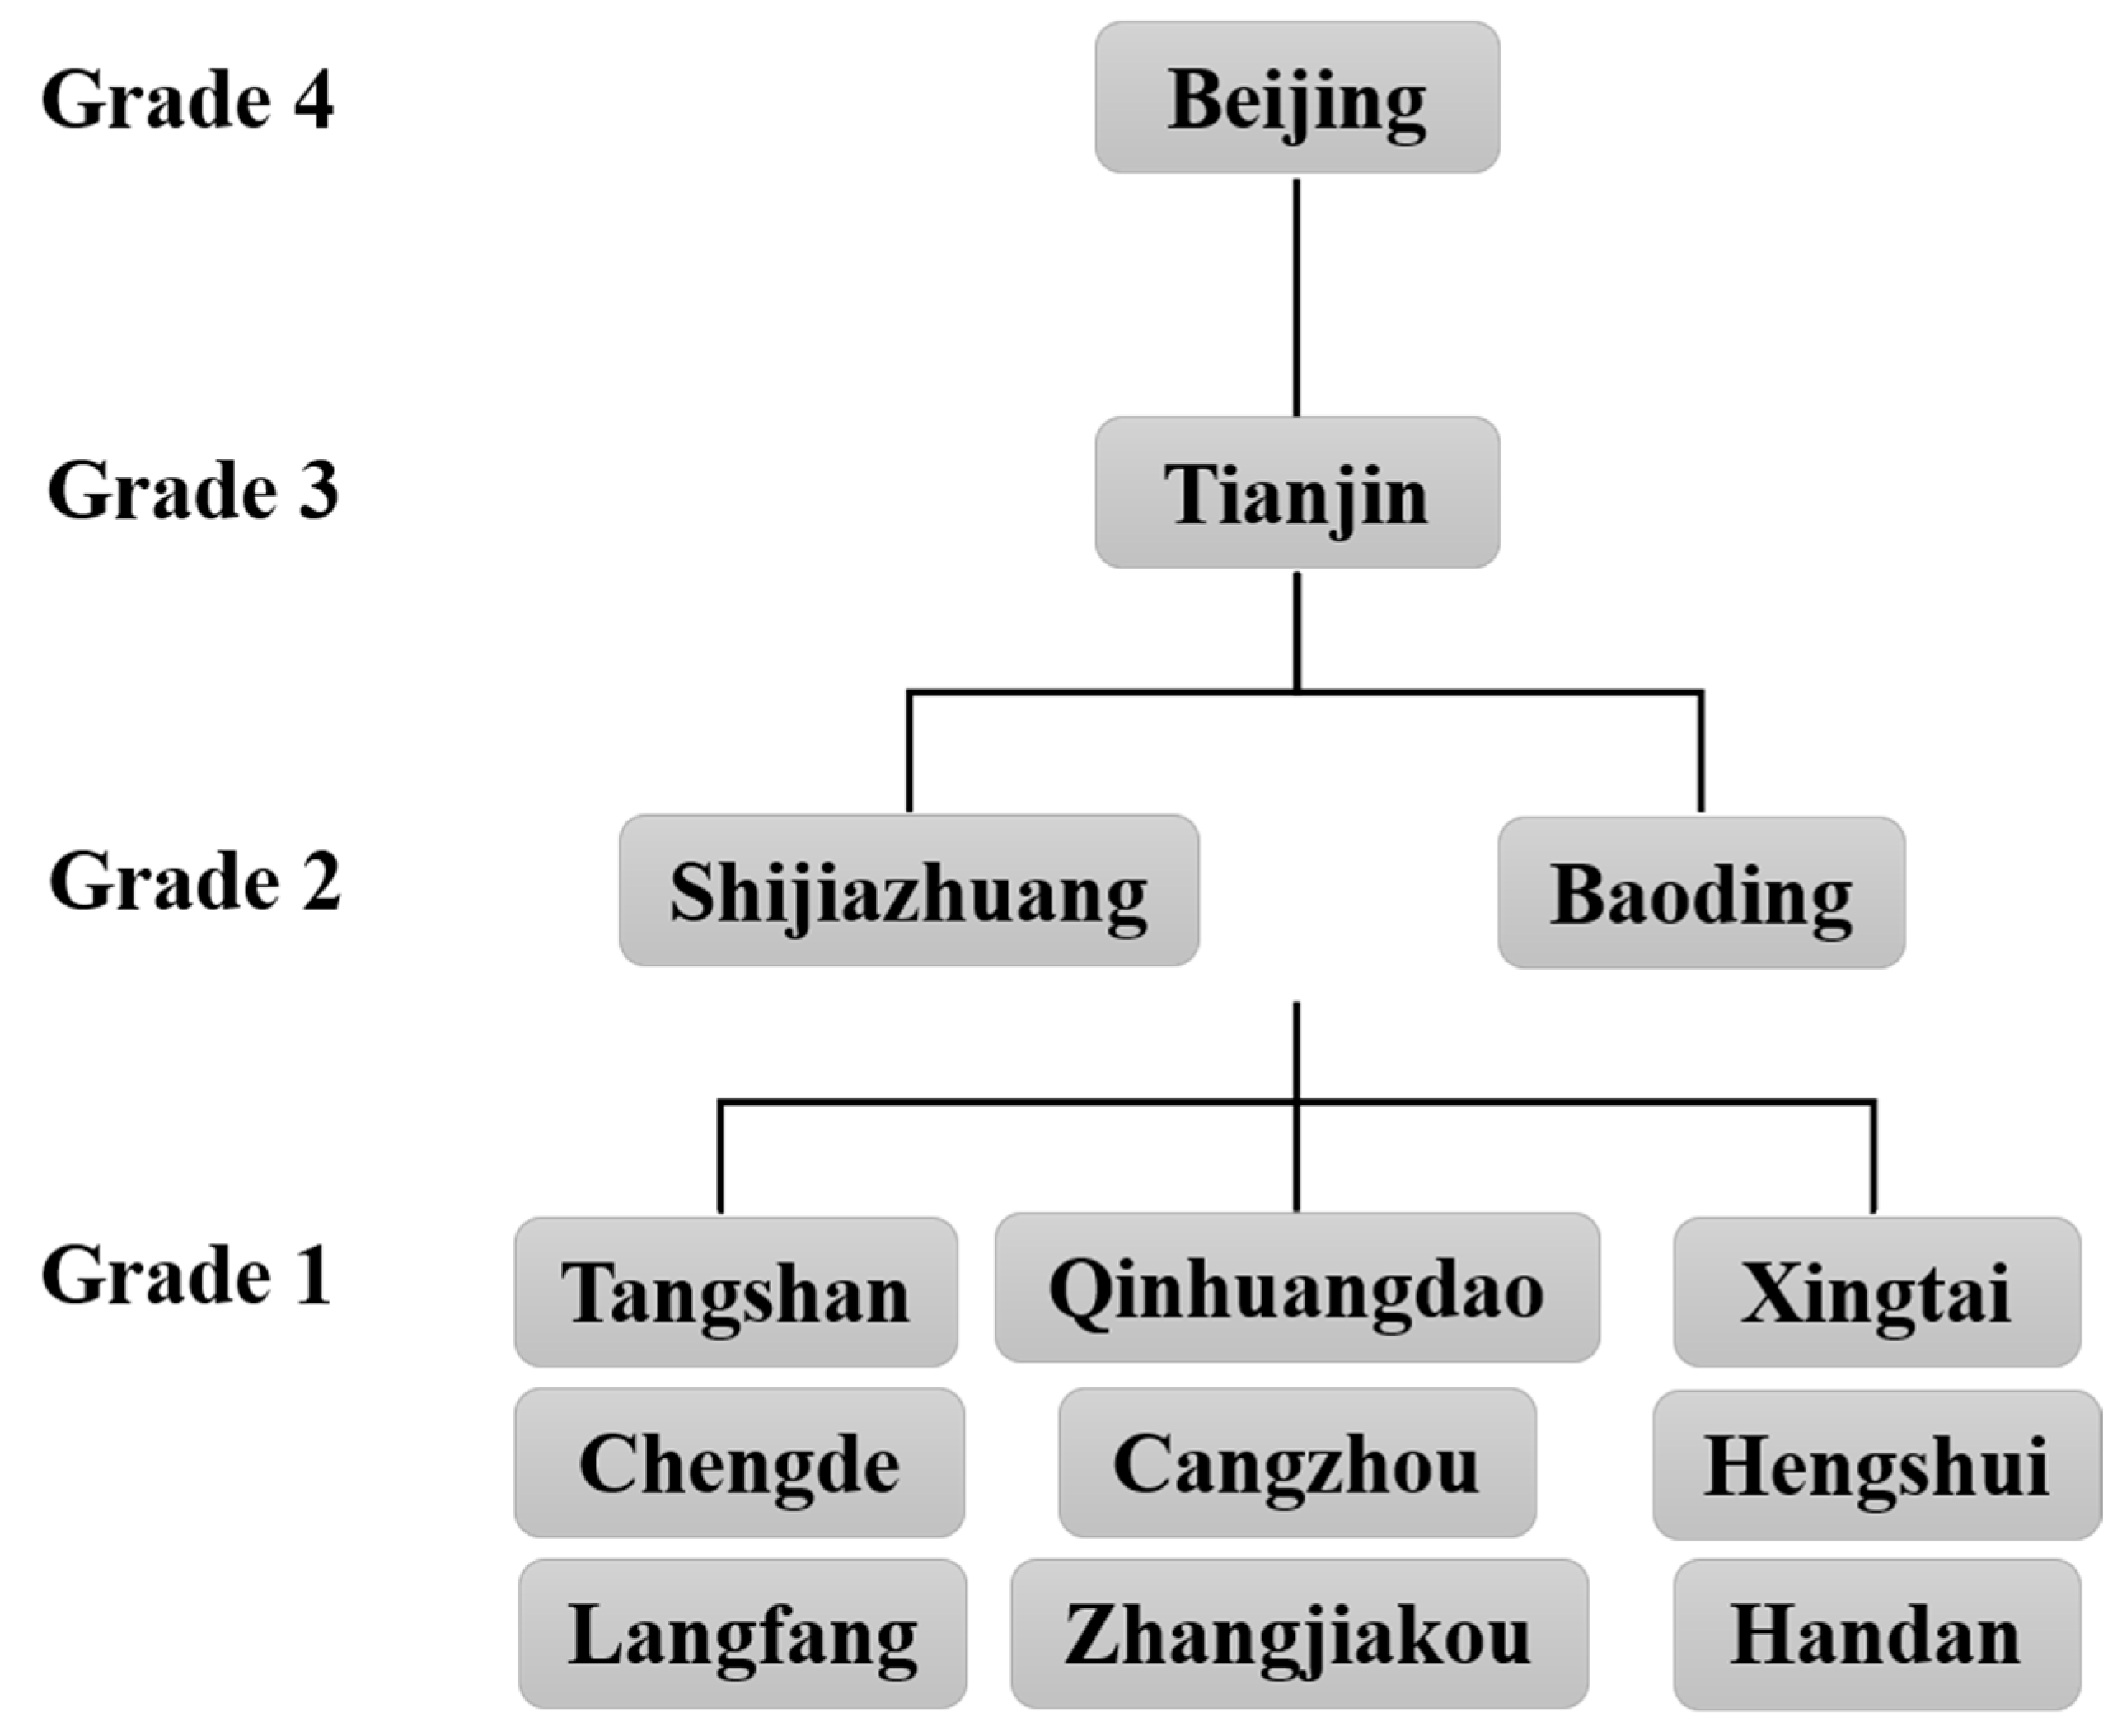
2.1. Study Area and Data Sources

The Beijing–Tianjin–Hebei (BTH) urban agglomeration is one of the largest and most developed urban agglomerations in China. It consists of one province (Hebei) and two provincial-level cities directly governed by the central government (Beijing and Tianjin), with a total area of 218 thousand km2 and a population of 109.7 million. Beijing is the capital of China. Hebei Province consists of 11 prefecture-level cities, with Shijiazhuang as the provincial capital.
In China, hospitals are divided into three levels, i.e., tertiary, secondary, and primary hospitals. Each grade is further classified into three classes (A, B, and C). According to this official classification system, Grade 3 (tertiary) Class A hospitals (3-A hospitals hereafter) are widely perceived to be high-quality hospitals in China [40]. In addition, public hospitals play a vital role in the Chinese healthcare service system with respect to healthcare resources and both outpatient and inpatient services [49]. Therefore, high-quality healthcare services are represented by public 3-A hospitals. The names, addresses, and numbers of physicians and beds of 162 public 3-A hospitals were collected from the Health Commission of each city in the BTH urban agglomeration in 2023. This is an official and reliable source of hospital data in China. The spatial distribution of these 3-A hospitals is shown in Figure 1.
The town-level population data were obtained from the Seventh National Population Census of China in 2020, which is the most reliable population data source in China. These data are the latest official population census data, and town-level data are the finest census data that can be publicly accessed. There were 2987 town-level units (subdistricts hereafter) in total, including towns in rural areas and jiedaos in urban areas.
Travel time estimations rely on multisource data. The travel times between railway stations were collected from schedules on the 12306 platform (www.12306.cn (accessed on 1–15 November 2023)), the official railway ticket booking platform in China. The travel times to/from railway stations via driving or public transit were collected by leveraging the navigation application programming interface (API) of Baidu Map. This approach has been widely applied in travel time estimations owing to its comprehensive consideration of real-time traffic congestion, first-mile and last-mile walking times, transfer times, and public transit service frequencies [50].

2.2. The Directional Two-Step Floating Catchment Area Method

To improve the estimation of spatial accessibility, researchers have developed a multitude of methods, some of which include the shortest travel time method, which measures the shortest travel time from each location to the closest facility [24]; the supply-to-demand ratio method, which calculates the ratio of service supply to demand within given boundaries [19]; and the cumulative opportunities method, which sums the number of facilities within a certain travel time threshold [51]. However, these methods fail to account for the complex interactions between service supply and population demand [5,52]. The popular gravity-based methods are superior in terms of integrating accessibility and availability [53], whereas the two-step floating catchment area (2SFCA) method, which was initiated by Radke and Mu [54] and refined by Luo and Wang [10], is a popular variant of the gravity model. Owing to its understandability, the 2SFCA method has been widely applied and extended [11]. Dozens of studies have contributed methodological developments to the gravity and 2SFCA framework [53], e.g., incorporating additional distance decay functions [55,56] or variable catchment areas [57,58], considering multiple transportation modes [59,60], improving the modeling of competition effects [60,61,62], and incorporating actual utilization behaviors [63,64].
At the urban agglomeration scale, high-quality healthcare resources are concentrated in central cities, thus facilitating patients’ travel across cities to obtain healthcare services [48]. To obtain a full picture of healthcare accessibility in an urban agglomeration, it is necessary to consider the possibility that patients might visit healthcare facilities in other cities. In other words, intercity patient mobility should be considered in the measurement of healthcare accessibility [46,48]. In existing studies, however, an unrealistic assumption was made that patients are able to select healthcare facilities located in any city within the urban agglomeration. In fact, the distribution of high-quality healthcare resources across various cities in an urban agglomeration is hierarchical, with more resources concentrated in central cities [40]. As a result, patients do not consider hospitals in all cities when seeking high-quality healthcare resources beyond the city in which they reside (or their home city). Instead, intercity patient flows should be hierarchical and directional, namely, from cities with less high-quality healthcare resources to cities with more high-quality healthcare resources [44,45,47].
According to the administrative grades of cities and quantities of high-quality healthcare resources, the cities in the BTH urban agglomeration can be classified into 4 grades (Figure 2). From highest to lowest, there is only one Grade 4 city, Beijing, where high-quality healthcare resources are the most concentrated. Existing studies have demonstrated the central role of Beijing in the country-wide intercity patient mobility network [65]. Grade 3 also includes only one city, Tianjin, which is a provincial-level city. The economic development level and quantity of 3-A hospitals are greater than those of other cities in the BTH urban agglomeration but lower than those in Beijing. Grade 2 includes two cities, Shijiazhuang and Baoding. Shijiazhuang is the current provincial capital of Hebei Province, while Baoding was the former provincial capital.
In the traditional 2SFCA method, the interactions between demand and supply are restricted within the catchment area, which is usually defined as a certain travel time threshold. To account for the hierarchy and direction of patient mobility in an urban agglomeration, this study develops an extended 2SFCA method, termed the directional two-step floating catchment area (D2SFCA) method. The rationale of the D2SFCA method can be demonstrated via a two-step procedure. In the first step, the resources of each facility are allocated to all potential demand units located in the same city or in lower-grade cities. The supply–demand ratio is calculated for each facility using the following equation:
R j = S j k q C q = C j ,   g C q < g C j P k f t k j
where R j is the supply–demand ratio of facility j, measured in beds per person; S j is the supply size of facility j, represented by the number of beds; P k is the demand size of the demand unit (subdistrict) k, represented by the age structure-adjusted population [46]; t k j is the travel time from demand unit k to facility j; f is the distance decay function; C q ( C j ) denotes the city where demand unit q (facility j) is located; and function g defines the grade of the city.
In the second step, the accessibility of each unit can be calculated by summing the supply–demand ratios of all potential facilities, which can be expressed as follows:
A i = j r C r = C i ,   g C r > g C i R j f t i j
where A i is the accessibility score of demand unit i; C r denotes the city where facility r is located; and the other variables are the same as those in Equation (1). In the application of the 2SFCA method, various forms of distance decay functions have been introduced into the model, including power functions, exponential function, Kernel density functions and Gaussian functions [11]. In this study, the catchment area of each facility is determined according to the grades of the cities in the regional healthcare service system rather than according to a given threshold of travel time. Existing studies have shown that the power function outperforms other functions in modeling actual healthcare-seeking behaviors at the intercity scale in China [17]. Therefore, the distance decay function assumes a power function form in this study, which can be expressed as follows:
f t i j = t i j β
where β is the parameter of the power function and the other variables are the same as those in Equation (1). As estimated by existing studies [17], the distance decay parameter β is approximately −1 for tertiary healthcare-seeking behaviors in Hubei Province, China, the spatial scale of which is similar to that of the BTH urban agglomeration. Therefore, β is set as −1 in this study.

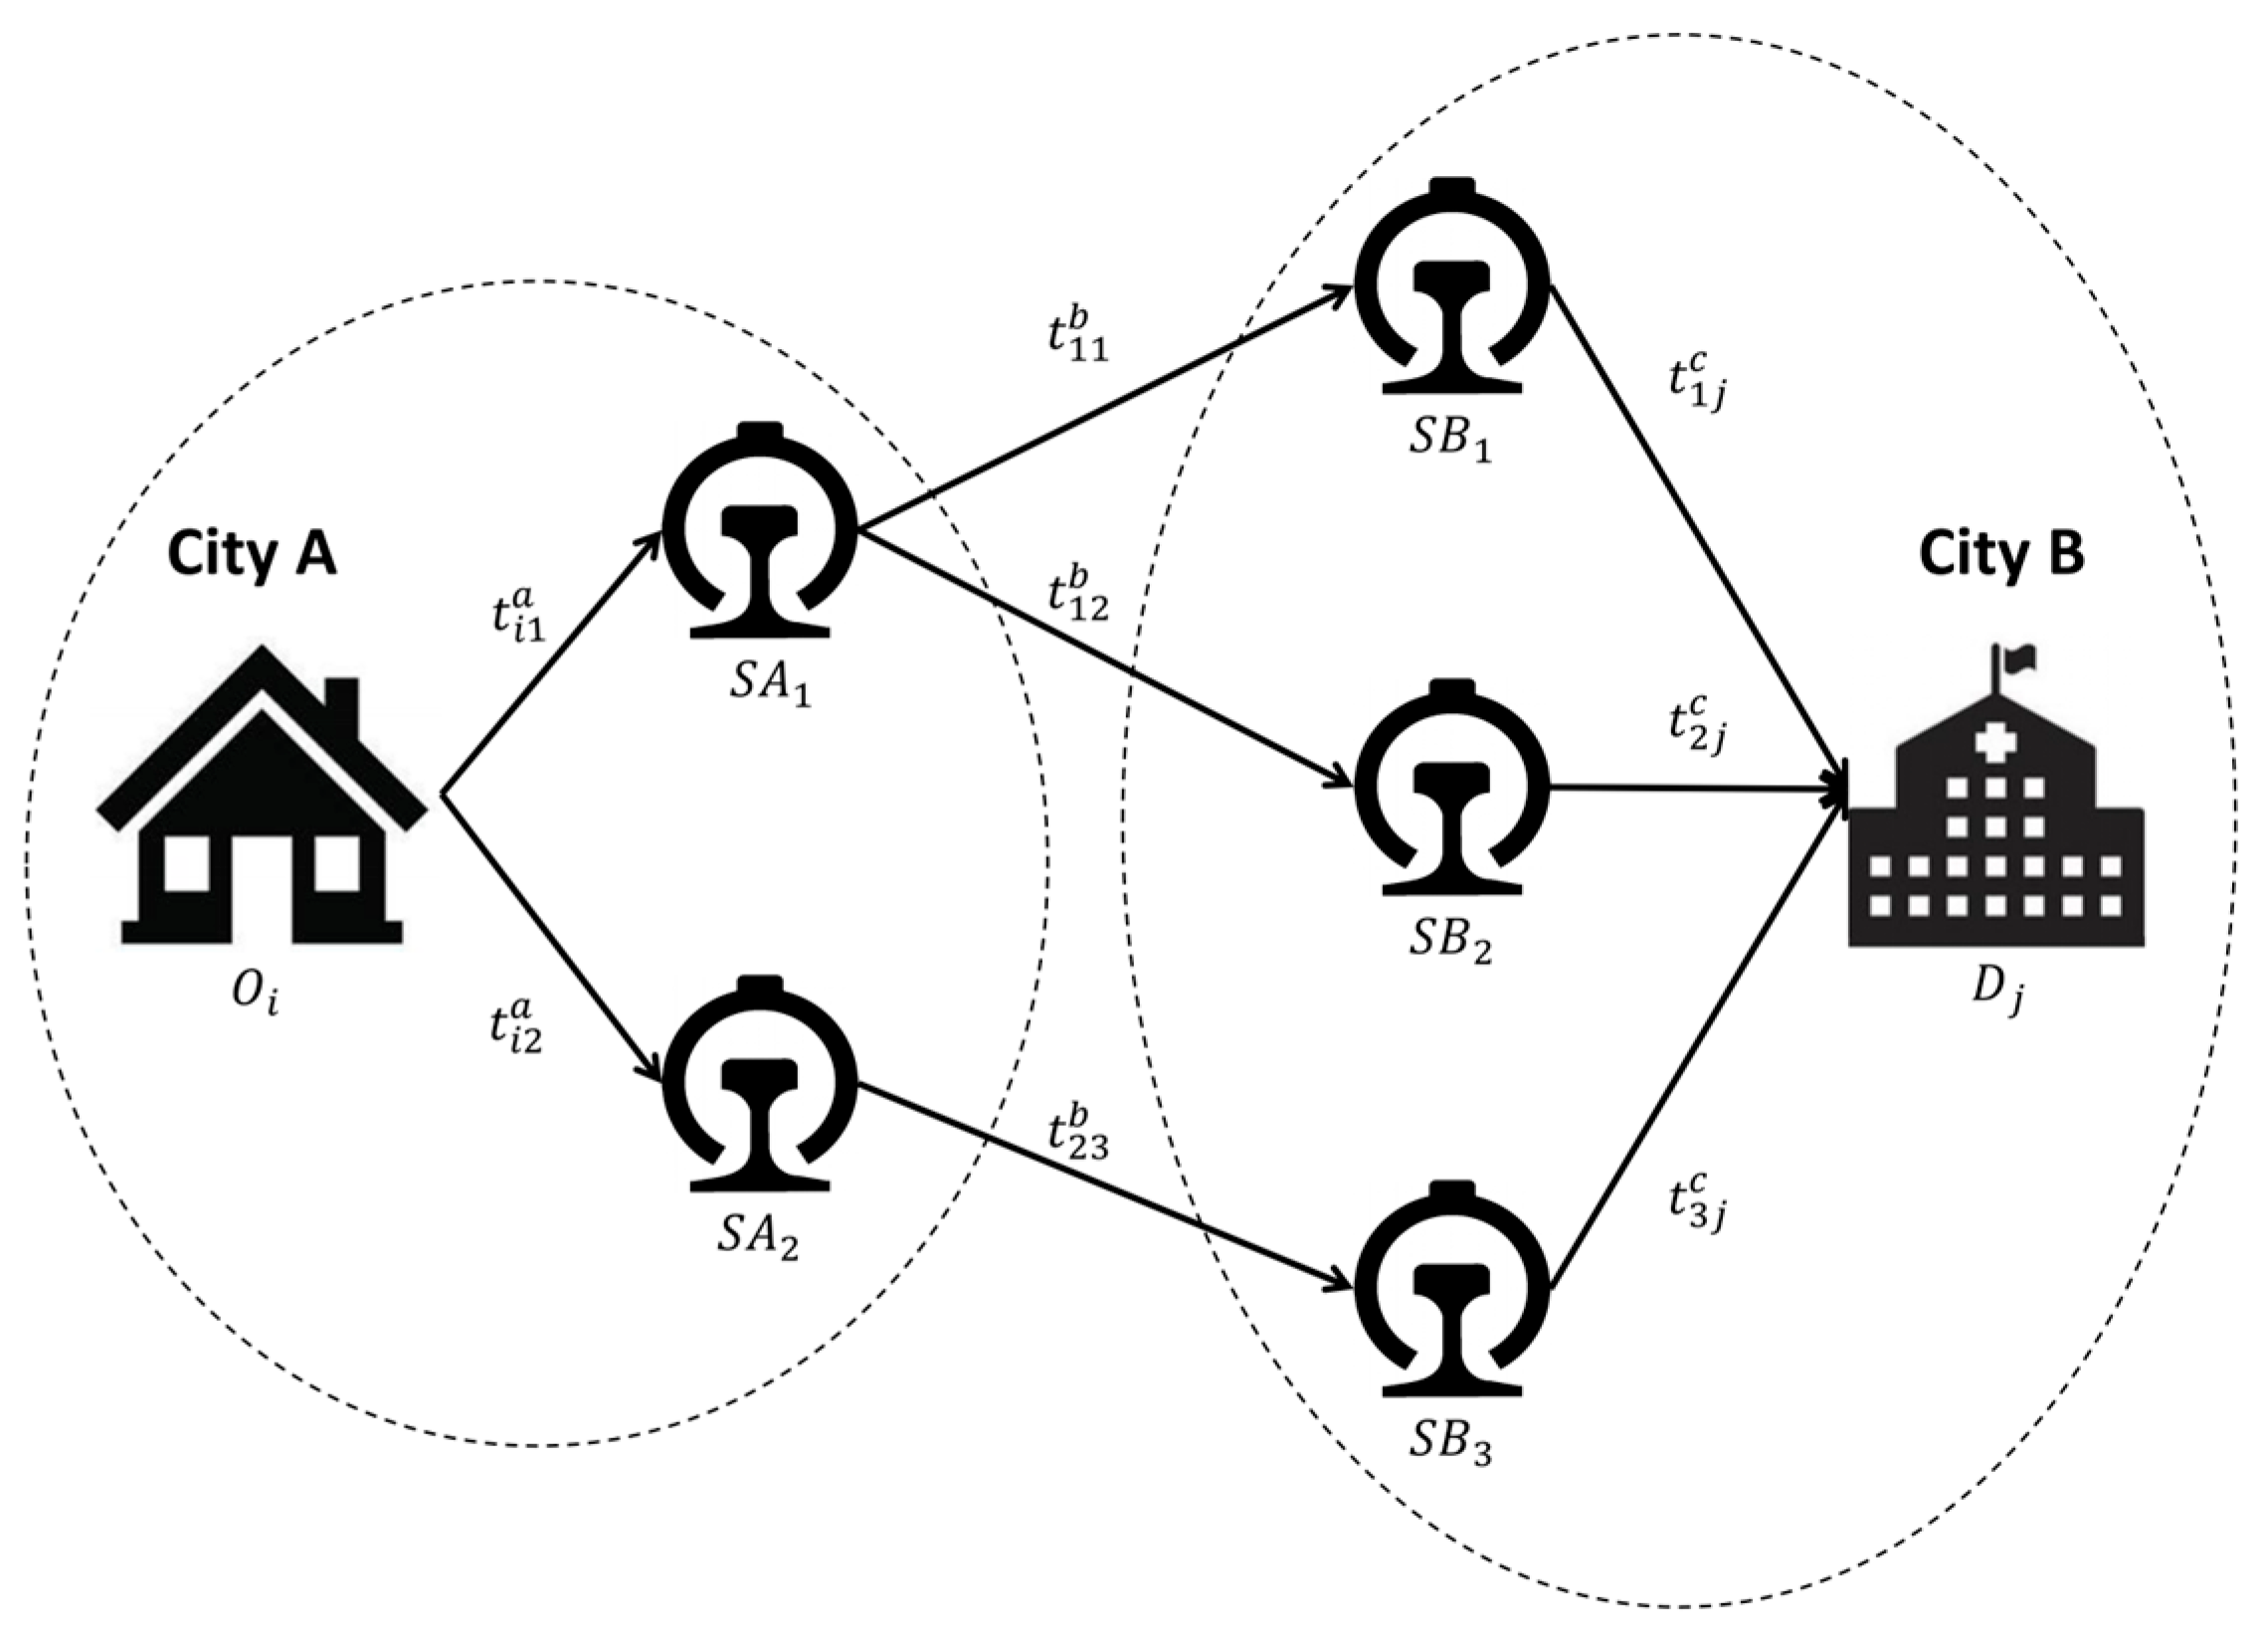
2.3. Estimating Travel Time via a Multilevel Transportation Network

A challenge regarding the measurement of healthcare accessibility in urban agglomerations is the estimation of travel time. Urban agglomerations commonly feature multilevel transportation networks, including regional railways, urban metro lines, bus lines and road networks. As depicted in Figure 3, when regional railways are considered, each intercity travel to hospitals across city boundaries can be divided into three phases, i.e., home-city travel from home to railway stations, intercity travel between two railway stations, and destination-city travel from railway stations to hospitals.
Multiple railway stations may exist in one city. When traveling between a given pair of cities, travelers may take different routes, namely, different combinations of railway stations. Generally, travel times vary across different travel routes. Therefore, it is essential to estimate the travel times of alternative routes and identify the route with the shortest travel time. As shown in Figure 3, considering two cities, A and B, patients in city A travel to city B for healthcare services. There are two railway stations (denoted by S A k , k = 1, 2) in city A and three stations (denoted by S B l , l = 1, 2, 3) in city B. There may be multiple railways connecting S A k and S B l , e.g., S A 1 S B 1 , S A 1 S B 2 , and S A 2 S B 3 , as shown in Figure 3. In this case, for patients living at O i in city A and visiting hospital D j in city B, there are three alternative travel routes. The total travel times of the three routes can be estimated as follows:
t i j 1 = t i 1 a + t 11 b + t 1 j c
t i j 2 = t i 1 a + t 12 b + t 2 j c
t i j 3 = t i 2 a + t 23 b + t 3 j c
The shortest travel time from O i to D j (denoted as t i j ) can be identified as follows:
t i j = min { t i j 1 , t i j 2 ,   t i j 3 }
For the intracity (both home-city and destination-city) phases of intercity travel, i.e., t i 1 a and t i 2 a for the home-city phase and t 1 j c , t 2 j c and t 3 j c for destination-city travel, patients can use various transportation modes. In this study, driving and public transit modes are considered for intracity travel to/from rail stations, which are commonly used as feeder transportation by railway travelers [66].

2.4. Decomposition of Inequality

The Gini coefficient has been widely applied to measure inequalities, including the spatial inequalities related to healthcare supply and accessibility [67,68]. Researchers further emphasize that inequalities can be decomposed into various levels. The Dagum composition method of the Gini coefficient has been widely applied to achieve such inequality decomposition [69]. In the case of spatial inequality, the whole study area is divided into a certain number of groups (or regions), and the inequalities can be decomposed into three components, namely intra-regional inequality, inter-regional inequality, and super-variable density inequality [70]. The calculation of the Dagum’s Gini coefficient can be formulated as follows:
G = j = 1 k h = 1 k i = 1 n j r = 1 n h y j i y h r 2 μ n 2
where y i j ( y h r ) is the accessibility score of subdistrict i (r) in region j (h); μ is the average accessibility score of all subdistricts; n is the number of subdistricts (2987 in this study); and k is the number of regions. In this study, each city is considered a region or group; therefore, there are 13 regions and n j ( n k ) denotes the number of subdistricts in region j ( h ). According to Dagum’s decomposition method, the Gini coefficient G can be decomposed into three components:
G = G w + G n b + G t
where G w is the intracity component of the Gini coefficient, G n b is the intercity component, and G t is the super-variable density component. The formulas of the three components can be found in the original study [69], and the calculation and decomposition of Dagum’s Gini coefficient were conducted in SPSSAU.

2.5. Calculation of the Proportions of Intercity and Intracity Travel Times

As previously stated, each form of intercity healthcare-seeking travel can be divided into three parts, all of which contribute to healthcare accessibility and its inequality. Based on the three phases of intercity healthcare-seeking travel, the proportions of intercity and intracity travel time can be decomposed. From the demand side, the average proportion of intracity travel time to the total travel time for each subdistrict is calculated using the following formula:
p o i = j ( t i j a + t i j c ) / t i j m
where p o i is the average proportion of intracity travel time from subdistrict i to all potential hospitals; j denotes hospitals; m is the number of potential hospitals that residents in subdistrict i can visit; t i j is the shortest travel time from subdistrict i to hospital j; and t i j a and t i j c are the home-city and destination-city travel times, respectively, in the intracity phases.
From the supply side, the average proportion of intracity travel time to the total travel time for each hospital can be calculated as follows:
p d j = i t i j c / t i j n
where p d j is the average proportion of intracity travel time from all potential subdistricts to hospital j; n is the number of potential subdistricts that have access to hospital j; and the other variables are the same as those in Equation (10).

3. Results

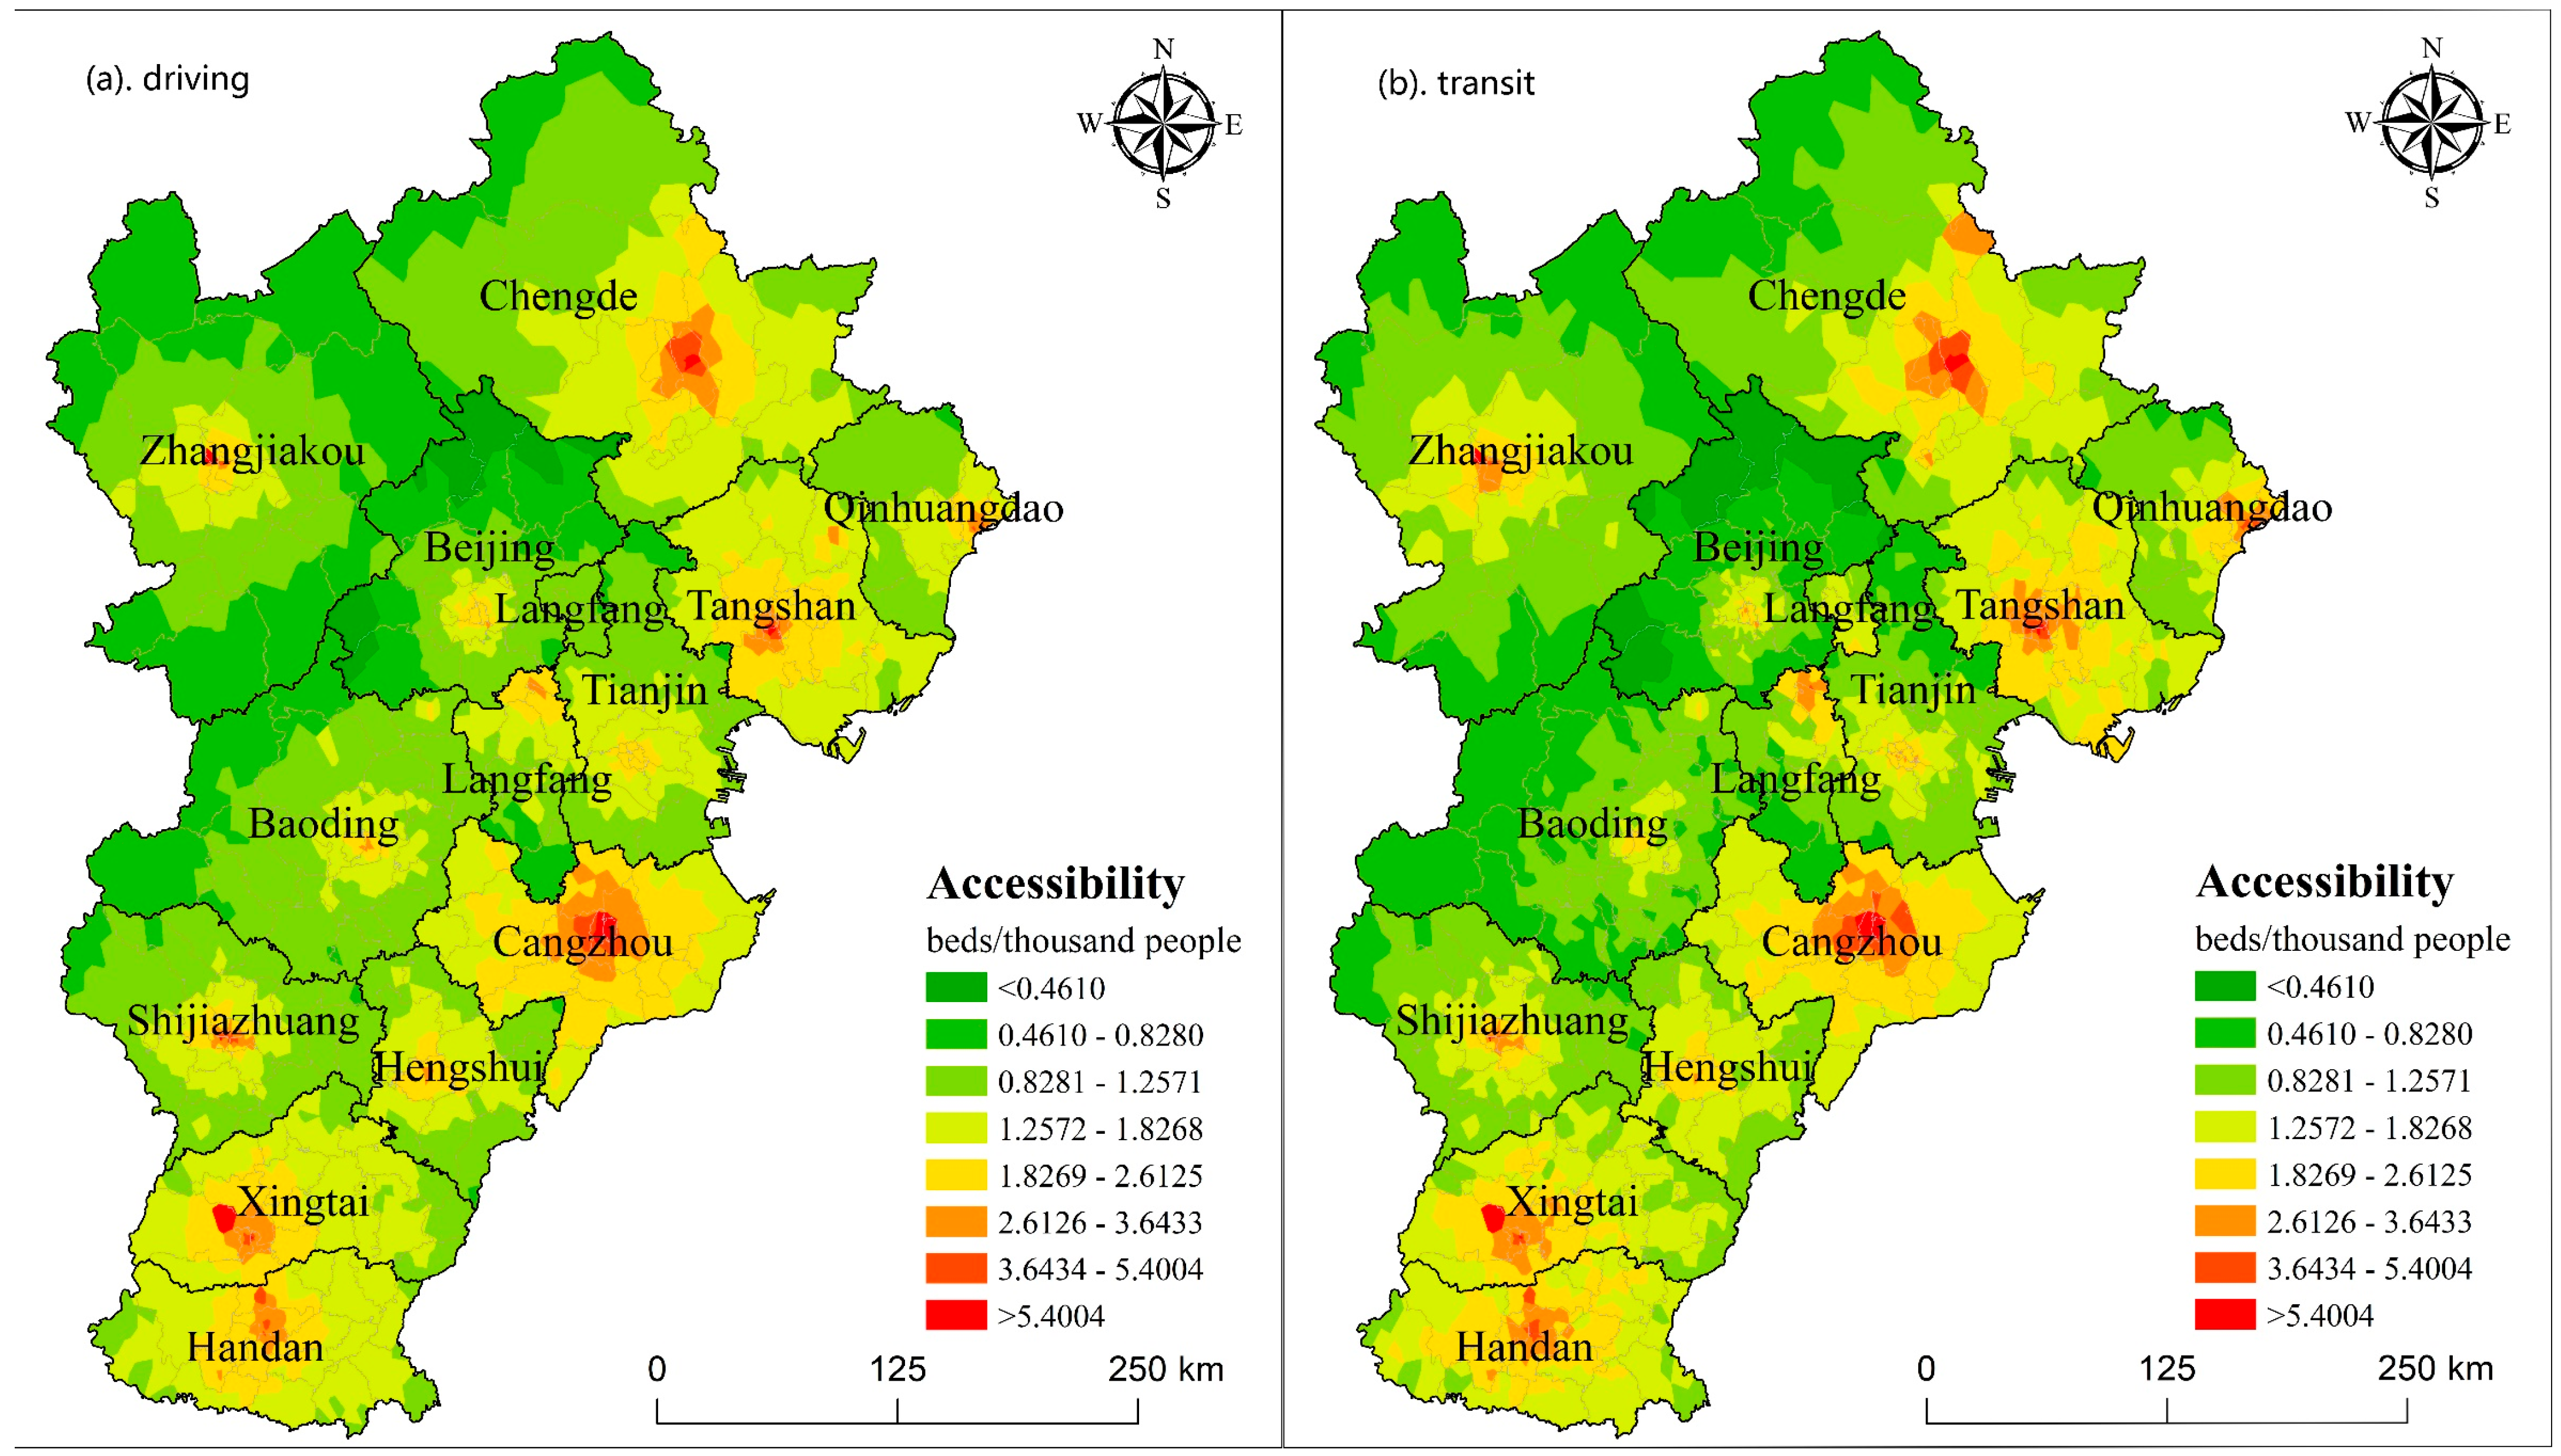
3.1. Spatial Distribution and Equality of Healthcare Accessibility in the Intracity Scenario

The spatial distributions of healthcare accessibility at the subdistrict scale by driving or transit modes in the intracity scenario are visualized in Figure 4. The distribution of healthcare accessibility exhibits a similar pattern when considering driving or transit modes for intracity transportation. Healthcare accessibility in central urban areas is better than that in the peripheral counties. In addition, healthcare accessibility is relatively high in Beijing, Tianjin, and Shijiazhuang but low in Zhangjiakou, Langfang, and Hengshui. In the intracity scenario, such disparities in healthcare accessibility across cities are caused by the unequal distribution of high-quality healthcare resources in the BTH urban agglomeration. Within each city, healthcare accessibility decreases gradually from the city center to peripheral counties, which results from the concentration of high-quality healthcare resources in central urban areas within each city.
Dagum’s Gini coefficients of healthcare accessibility and three components in various scenarios are shown in Table 1. In the Intracity—Driving scenario in which intracity transportation is considered driving, the overall Gini coefficient of healthcare accessibility is 0.459, indicating obvious inequalities in the supply of healthcare resources and consequent healthcare accessibility at the subdistrict scale in the BTH urban agglomeration. By decomposing Dagum’s Gini coefficient, it is found that the intracity component of the Gini coefficient is quite small (0.028, 6.1% of the overall inequality). As demonstrated above, intracity accessibility inequality is caused mainly by urban–rural disparities. In contrast, the intercity component contributes more than two-thirds (69.3%) to the overall inequality. The inequality of healthcare accessibility in the BTH urban agglomeration is caused, for the most part, by disparities between cities. In addition, the super-variable density component also contributes a certain proportion of inequality (24.6%), which means that the healthcare accessibility of some subdistricts in a city with lower average accessibility is better than that of some subdistricts in other cities with higher average accessibility. In the Intracity—Transit scenario, the overall Gini coefficient is larger than that in the Intracity—Driving scenario, indicating greater inequality in healthcare accessibility by transit mode. Similarly, the intercity component contributes approximately two-thirds (67.5%) to the overall inequality.

3.2. Spatial Distribution and Equality of Healthcare Accessibility in the Intercity Scenario

The spatial distributions of healthcare accessibility at the subdistrict scale by driving or transit mode in the intercity scenario are presented in Figure 5, which shows that healthcare accessibility is more evenly distributed in the intercity scenarios than it is in intracity scenarios (Figure 4). Similar to the intracity scenarios, healthcare accessibility also declines from central urban areas to peripheral counties, but the declining trend is weaker. However, healthcare accessibility increases in lower-grade cities, e.g., Cangzhou, Xingtai, Handan, Tangshan, and Chengde, but decreases in higher-grade cities, e.g., Beijing, Tianjin, and Shijiazhuang.

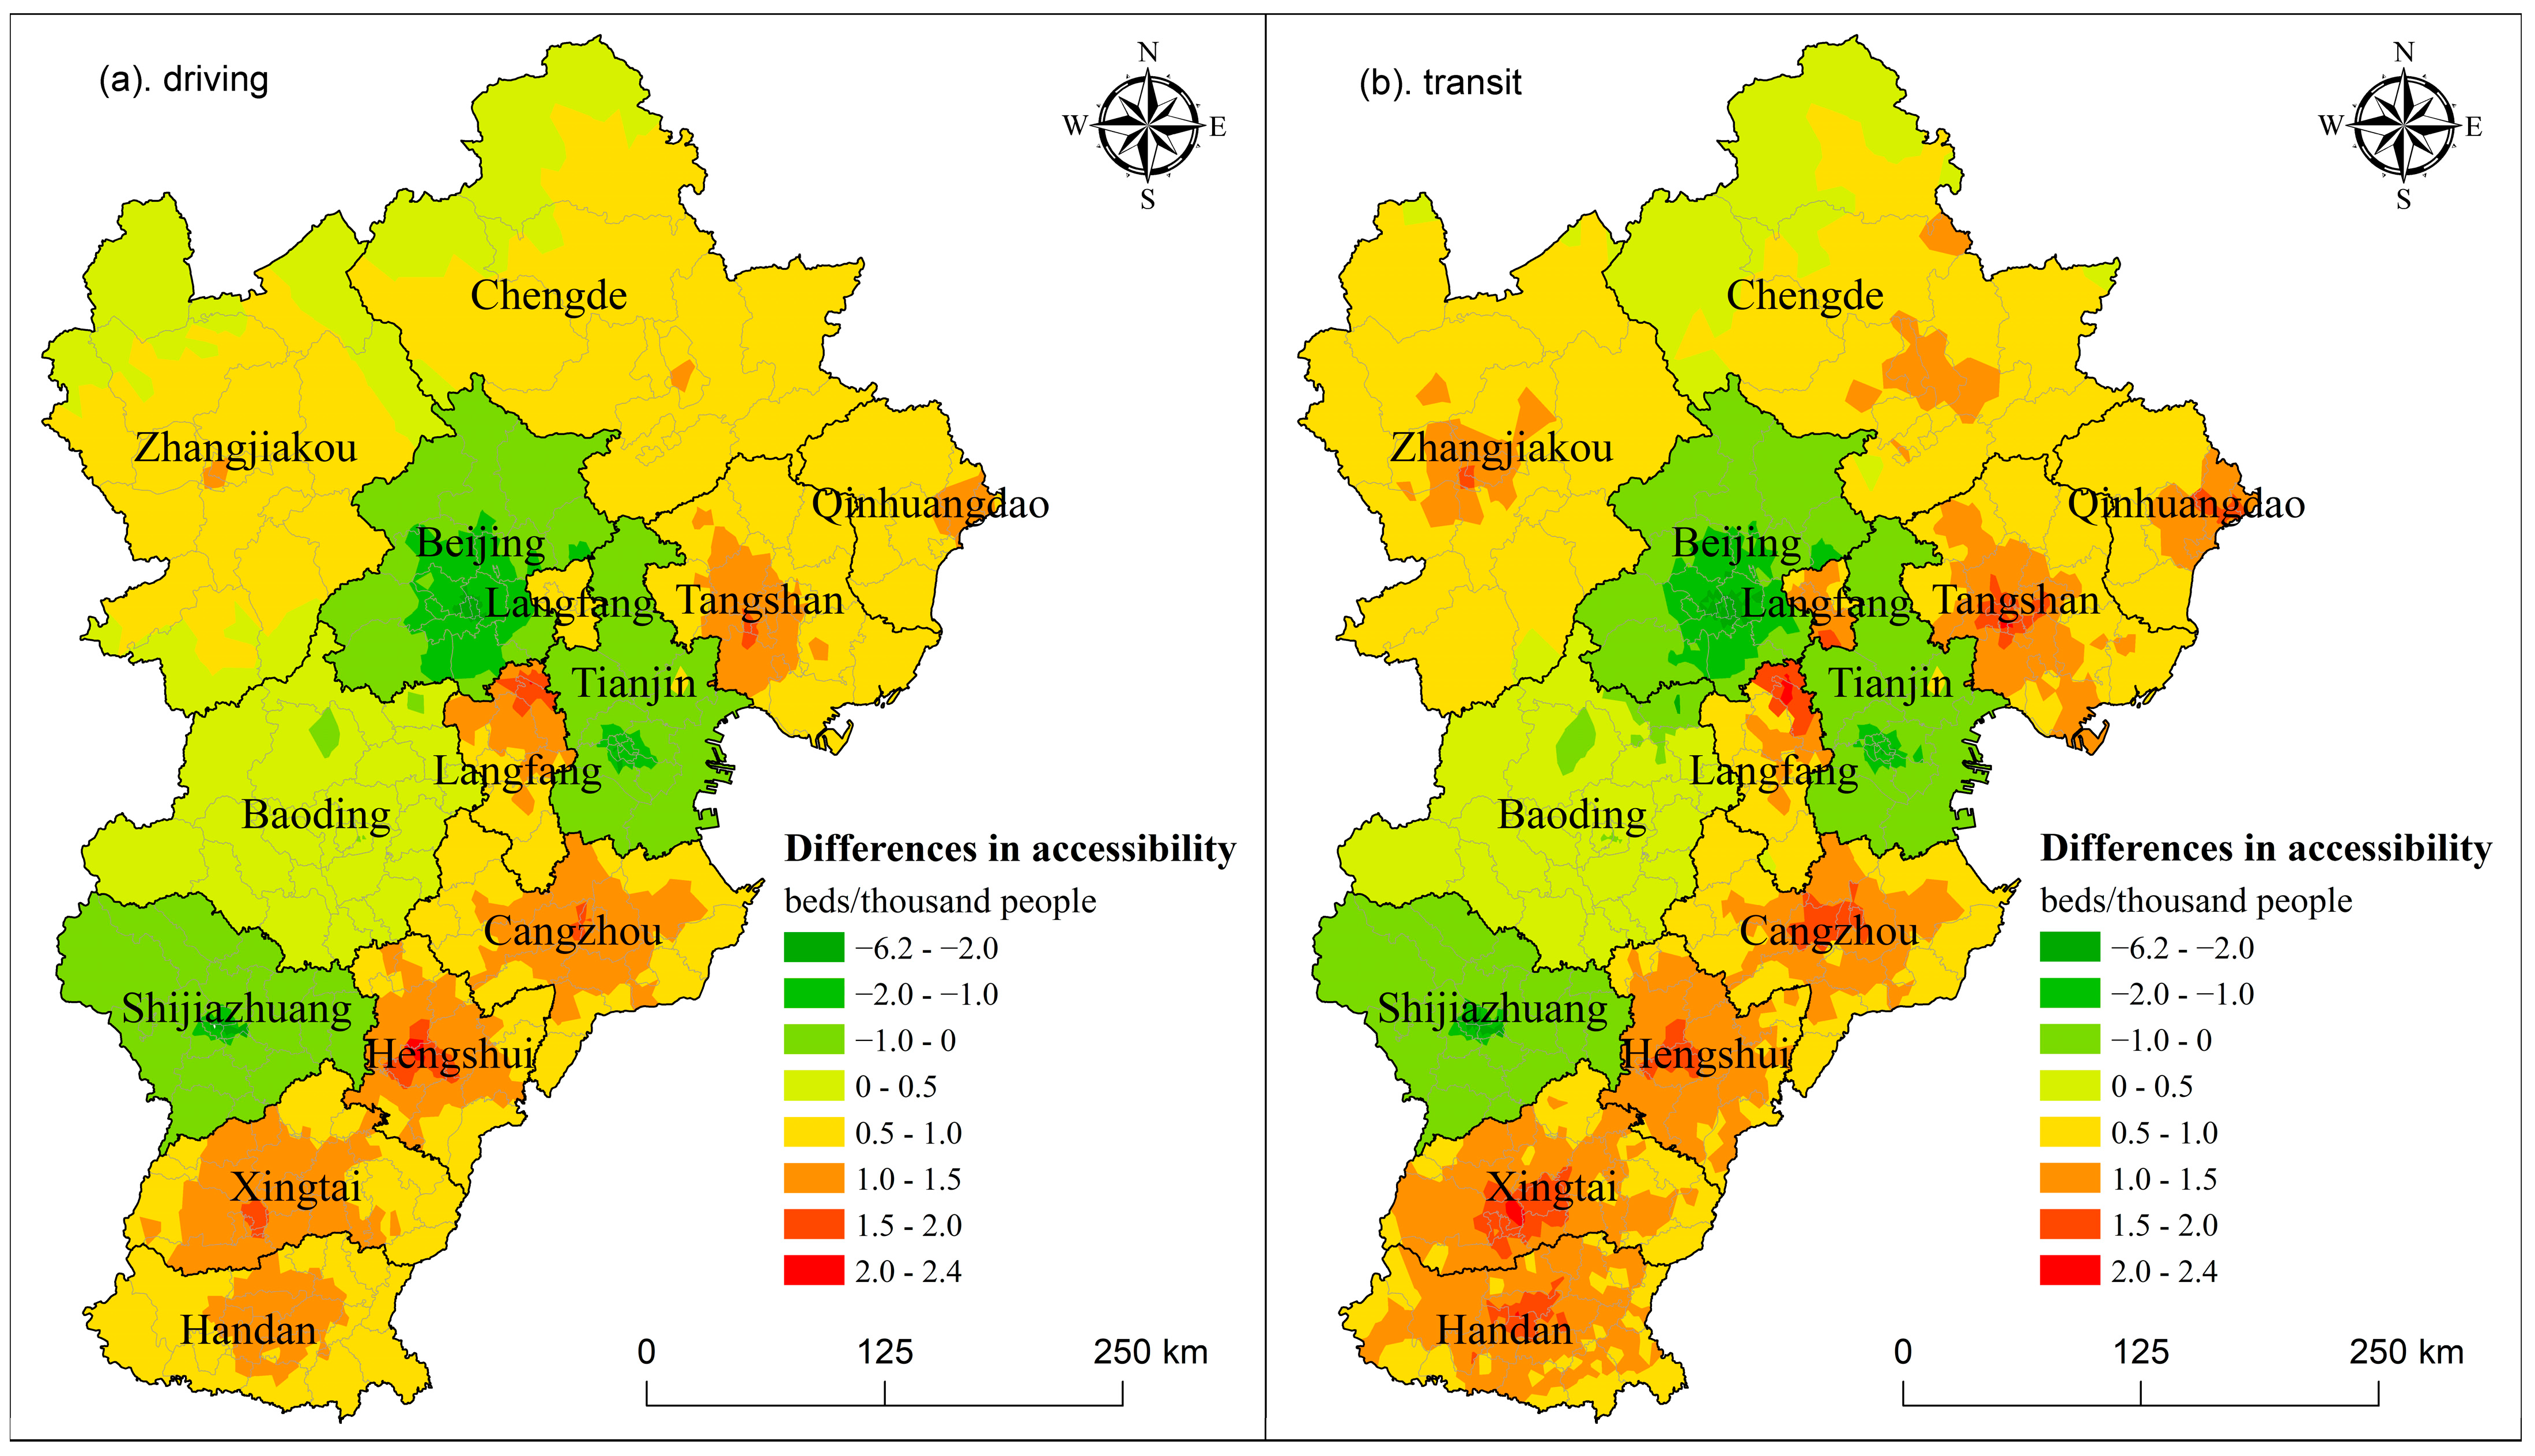
3.3. The Differences Between the Two Scenarios and the Impacts of Intercity Patient Mobility

The differences in healthcare accessibility between the intercity and intracity scenarios by driving or transit mode are presented in Figure 6. Positive values indicate that healthcare accessibility is greater in the intercity scenarios than it is in the intracity scenarios. In other words, intercity patient mobility improves healthcare accessibility in these subdistricts. Positive differences in healthcare accessibility can be observed in all Grade 1 cities, especially in the southeastern cities, i.e., Langfang, Cangzhou, Hengshui, Xingtai, and Handan. In addition, the magnitude of the positive difference in accessibility gradually decreases from the central urban areas to the peripheral counties in these cities. This finding indicates that the central areas in Grade 1 cities can benefit more in terms of healthcare accessibility due to the impacts of intercity patient mobility, whereas healthcare accessibility has decreased in Beijing, Tianjin, and Shijiazhuang. In intercity scenarios, patients living in lower-grade cities that lack high-quality healthcare resources can travel to higher-grade cities to access high-quality healthcare resources. Notably, although Baoding is also a Grade 2 city, its healthcare accessibility slightly increases in the intercity scenarios, possibly because Baoding is close to Beijing, Tianjin, and Shijiazhuang, where high-quality healthcare resources are the most concentrated. This locational advantage and the consequent benefits in healthcare accessibility can counteract some of the resources used by patients from other low-grade cities.
In the Intercity—Driving scenario, the overall Gini coefficient of healthcare accessibility across subdistricts in the BTH urban agglomeration is much smaller than that in the Intracity—Driving scenario (0.265 versus 0.459). Similarly, the overall Gini coefficient is also significantly lower in the Intercity—Transit scenario than in the Intracity—Transit scenario (0.297 versus 0.466; see Table 1). These differences between the intercity and intracity scenarios demonstrate that allowing intercity patient mobility can significantly mitigate the inequality of high-quality healthcare accessibility in the BTH urban agglomeration. In addition to the overall Gini coefficient, all three components decrease in the intercity scenarios compared with the intracity scenarios. However, the reduction in the intercity component is the largest among the three components, which decreases by 58.8% (from 0.318 to 0.131) or 49.5% (from 0.315 to 0.159), respectively, when driving and transit intracity transportation modes are considered.

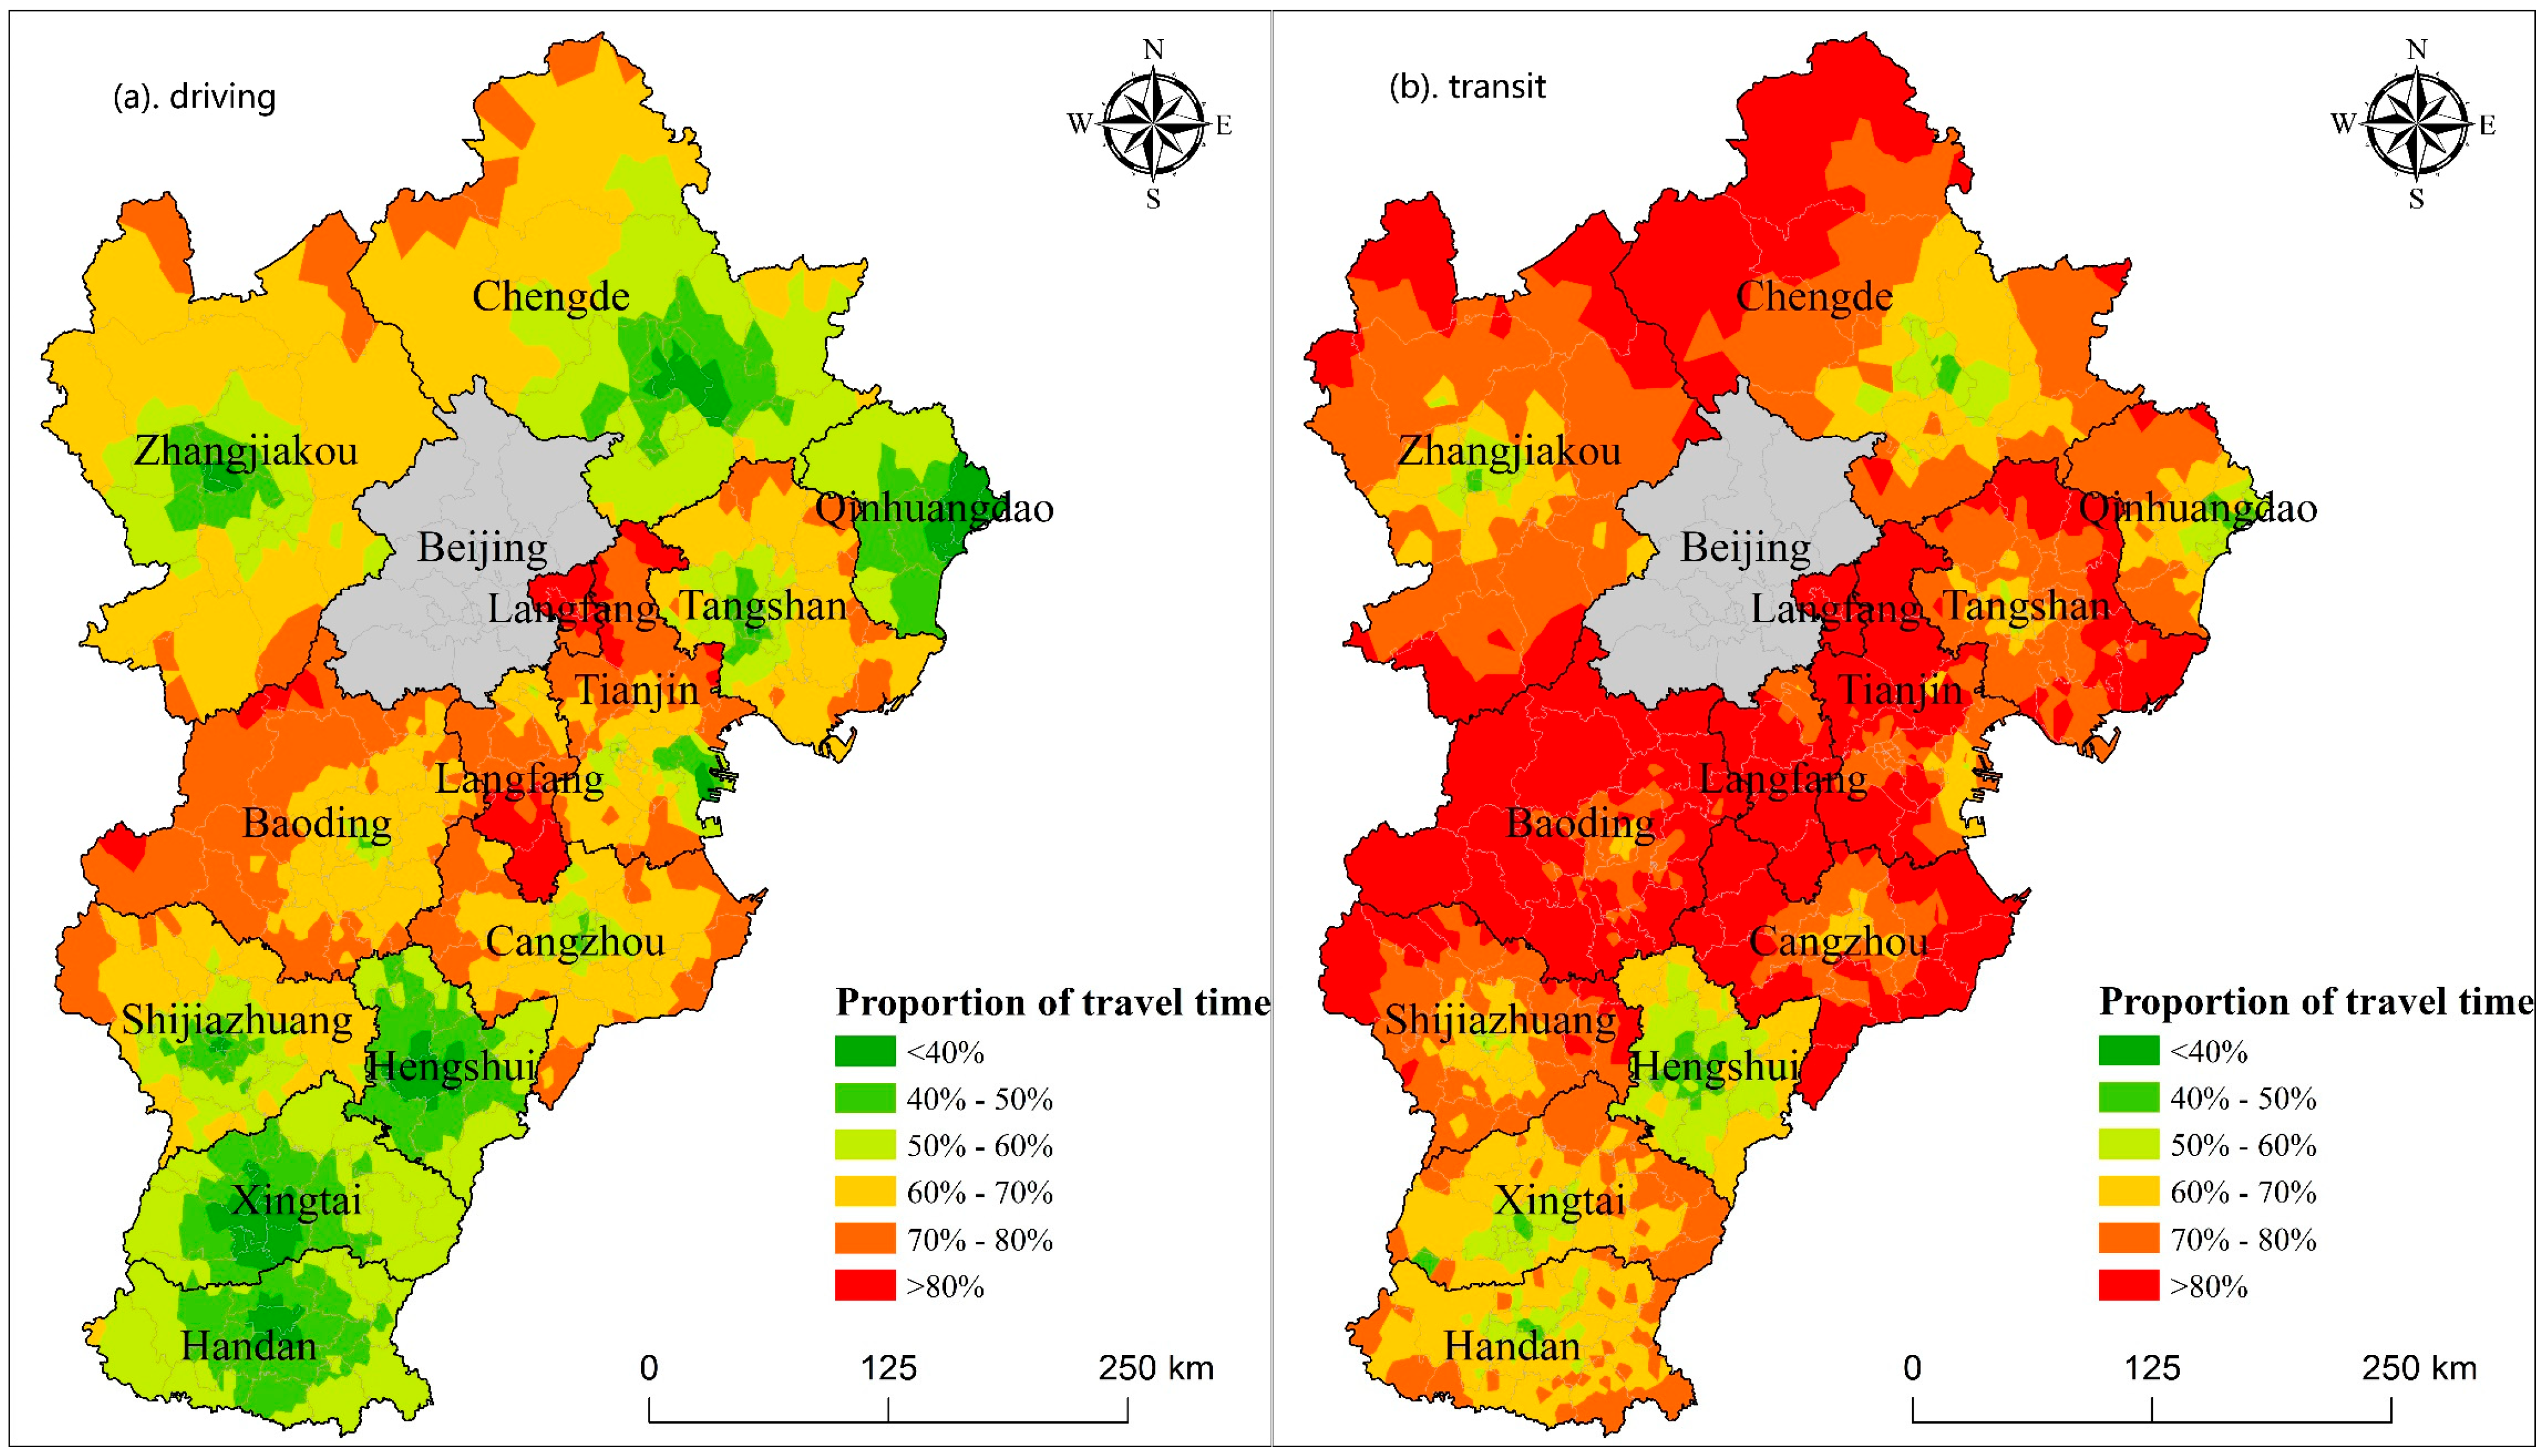
3.4. Proportions of Intercity and Intracity Travel Times

From the demand side, the proportions of intracity travel time in the intercity scenarios by driving and transit modes are presented in Figure 7. Within each city, it is obvious that the proportion of intracity travel time increases from central urban areas to peripheral counties. At the urban agglomeration scale, the proportion is significantly greater in the areas around Beijing and gradually decreases with increasing distance from Beijing. In other words, the contribution of intercity rail transportation to healthcare accessibility is greater in areas that are further from higher-grade cities (especially Beijing).
In the Intracity—Driving scenario, the proportion of intracity travel time is more than 60% in most areas of Langfang, Baoding, Cangzhou, and Tianjin and in the peripheral counties of Zhangjiakou, Tangshan, and Shijiazhuang. In these areas, intracity travel time accounts for the majority of geographical barriers to travel for intracity, whereas intercity transportation only contributes to a limited proportion. In the Intracity—Transit scenario, the proportion of intracity travel time is more than 70% in most areas, excluding the majority of Hengshui and parts of Handan, Xingtai, Chengde, Zhangjiakou, and Qinhuangdao, which indicates obvious first-mile problems in intercity healthcare-seeking travel in these areas.
From the supply side, the proportions of destination-city travel time (i.e., travel times from rail stations to hospitals) in the intercity scenarios are presented in Figure 8, which shows that the proportion of destination-city travel time varies across hospitals within each city. In the Intercity—Driving scenario, the proportions of destination-city travel time are lower than 20% for hospitals located in central urban areas but reach 30–40% for some hospitals located far from the rail stations. In the Intercity—Transit scenario, the proportions of destination-city travel time are much greater, reaching more than 40% for many hospitals. For some peripheral hospitals, e.g., those located in northern Beijing, northern Tianjin, and northern Baoding, the proportion reaches more than 60%. These findings reveal obvious last-mile problems in intercity healthcare-seeking travel to certain 3-A hospitals. In summary, after the proportions of the intracity and intercity phases of travel time are decomposed, it is evident that although intercity rail transportation is essential for supporting intercity healthcare-seeking travels, the first-mile and last-mile problems caused by intracity transfer transportation should not be overlooked.

4. Discussion

Intercity patient mobility is a common phenomenon caused by unevenly distributed high-quality healthcare resources. Given that spatial and socioeconomic integration is the fundamental feature of urban agglomerations, mitigating the inequality of spatial accessibility to high-quality healthcare resources at the urban agglomeration scale has become a focus. However, a full picture of the spatial inequality of healthcare accessibility at the urban agglomeration scale is still lacking because the hierarchy of high-quality healthcare resource distribution and the impacts of intercity rail transportation are being ignored. This study contributes to this field by developing a novel method for measuring healthcare accessibility at the urban agglomeration scale that incorporates the hierarchy of high-quality healthcare services, the direction of intercity patient mobility and the role of multilevel rail transportation networks.
The results revealed obvious spatial inequalities in the spatial accessibility of high-quality healthcare resources (3-A hospitals) in the BTH urban agglomeration. In intracity scenarios, it is assumed that patients would select hospitals within the city in which they reside. Therefore, the estimated healthcare accessibility in the intracity scenarios reflects the supply level of high-quality healthcare resources relative to demand. Although healthcare accessibility is relatively high in higher-grade cities (especially Beijing, Tianjin, and Shijiazhuang), it exhibits obvious urban–rural disparities within each city. These findings confirm the need to consider the hierarchy of high-quality healthcare resources and the direction of intercity patient mobility in the measurement of healthcare accessibility on the urban agglomeration scale, which is also consistent with existing studies [46,47]. Dagum’s Gini coefficient was then applied to decompose the intracity and intercity components of the inequality of healthcare accessibility. The intercity component, i.e., the inequality of healthcare accessibility between cities, accounts for the majority of accessibility inequality, thus suggesting that to mitigate the spatial inequalities of healthcare accessibility at the urban agglomeration scale, the key is to narrow the gaps in high-quality healthcare resources among cities.
The healthcare accessibility and the accompanying inequalities in intracity and intercity scenarios are further compared. The differences between these scenarios reflect the impacts of intercity patient mobility on the inequalities in healthcare accessibility. The inequality of healthcare accessibility is obviously lower in the intercity scenarios than in the intracity scenarios. In addition, although both the intracity and intercity inequality components decrease, the intercity component decreases more. This finding indicates that given the uneven distribution of high-quality healthcare resources in the BTH urban agglomeration, intercity patient mobility, i.e., the flow of patients across city boundaries, significantly mitigates the inequalities, especially the intercity inequality, of healthcare accessibility.
Notably, our findings are consistent with those of existing studies in the Changsha–Zhuzhou–Xiangtan urban agglomeration [47] and the Shenzhen–Dongguan–Huizhou agglomeration [46]. However, as only the driving mode is considered in these studies, the crucial role of rail transportation in intercity travel is overlooked. In addition to considering the direction of intercity patient mobility, this study also improves the measurement of urban agglomeration-scale healthcare accessibility by incorporating multilevel intercity transportation networks, i.e., multiple rail stations within a city, multiple rail lines connecting a pair of cities, and first- and last-mile transfer transportation to/from rail stations via driving or transit. This improved method more accurately estimates intercity patients’ travel time to hospitals.
Furthermore, we separated intercity healthcare-seeking travels into intracity (including home-city and destination-city) and intercity phases. The proportions of intracity travel time to total travel time were calculated from both the demand and supply sides. From the demand side, the proportion of intracity travel time shows obvious disparities across subdistricts and is significantly greater in the areas around Beijing. When patients use the transit mode in the intracity phase, the proportion of intracity travel time is quite high, reaching more than 70% in most areas. This finding indicates that intracity transportation, i.e., first-mile and last-mile transfer transportation, is the major barrier to intercity healthcare accessibility. On the supply side, our analyses demonstrate that hospitals distant from rail stations are more likely to suffer from the last-mile intracity transportation dilemma.
This study sheds light on the methodological development of spatial accessibility measurement in urban agglomerations or other functional areas where intercity connections play a vital role. First, it is necessary to account for intercity interactions between demand and supply as well as the structure or hierarchy of such interactions. By contrast, traditional analyses limited to a single city might lead to biased results. Second, door-to-door travel time estimation is essential for accurate measurement of spatial accessibility at a cross-city scale.
These findings can also provide valuable practical implications for policymaking and planning of healthcare resources. First, the configuration of high-quality healthcare resources within an urban agglomeration should emphasize intercity coordination. On the one hand, higher-grade cities not only provide high-quality healthcare services to local patients but also service patients from lower-grade cities. Therefore, more high-quality healthcare services should be allocated to the central cities of an urban agglomeration. On the other hand, policy countermeasures should be put forward to facilitate intercity patient mobility, e.g., improving intercity healthcare accessibility, promoting cross-city settlement of medical insurance, and making it more convenient to schedule appointments. Second, it is suggested to strengthen intracity transportation connections between rail stations and high-grade hospitals in the central cities.
We acknowledge that there are limitations to this study. First, only travel time costs between stations and from/to stations are considered in measuring healthcare accessibility, whereas other costs, e.g., waiting and transfer time costs within stations and economic costs, are not taken into account. Second, although our focus is on spatial accessibility to healthcare resources, future studies should focus on socioeconomic barriers to intercity patient mobility and accessibility. Third, while the hierarchy of high-quality healthcare resources and the direction of intercity patient mobility are important assumptions in this study, they are not substantiated based on actual intercity healthcare-seeking behaviors. Greater effort is needed to re-examine our findings by considering patients’ actual behaviors and using the data to support the findings. Fourth, all 3-A hospitals were included in this study. However, these hospitals have different specializations or functions and varied compositions of departments. Therefore, the influences by intercity patient mobility might vary across hospitals. Future studies could better distinguish between the different types of hospitals and consider the heterogeneity in patients’ preferences. Fifth, it is assumed that intercity travels are based on railway mode, while the possibility that some patients might travel by driving across cities was overlooked in this study.

5. Conclusions

While spatial inequalities regarding the accessibility to high-quality healthcare resources on the urban agglomeration scale are an important issue, they face challenges due to intense socioeconomic interactions and patient mobility between cities. This study developed a novel directional 2SFCA method for revealing the spatial inequalities of accessibility to 3-A hospitals in the BTH urban agglomeration, with a focus on the impacts of intercity patient mobility. To address the methodological challenges posed by the characteristics of urban agglomerations, our method emphasizes the direction of intercity patient mobility caused by the hierarchy of high-quality healthcare resource distribution. To reveal the impacts of intercity patient mobility, multilevel intercity rail transportation connecting various cities and intracity transfer transportation by driving or transit are considered when estimating door-to-door travel times.
The results revealed obvious spatial inequalities in the accessibility of high-quality healthcare resources in the BTH urban agglomeration. Intercity inequalities, i.e., disparities between cities, account for more than two-thirds of the overall accessibility inequalities. Although intercity patient mobility can significantly mitigate the spatial inequalities of healthcare accessibility within the BTH urban agglomeration, intracity first-mile and last-mile transfer transportation is the major barrier to intercity healthcare accessibility. Hence, this study has valuable implications for the planning and management of high-quality healthcare resources and intercity patient mobility in the BTH urban agglomeration. The developed methods are useful for measuring healthcare accessibility and inequalities at the urban agglomeration scale.

Author Contributions

Conceptualization, Zhuolin Tao; methodology, Yandi Wang, Lin Chen, Binglin Liu and Zhuolin Tao; software, Yandi Wang, Lin Chen and Binglin Liu; validation, Yandi Wang, Lin Chen, Binglin Liu and Zhuolin Tao; formal analysis, Yandi Wang, Lin Chen, Binglin Liu and Zhuolin Tao; investigation, Zhuolin Tao; resources, Zhuolin Tao; data curation, Yandi Wang, Lin Chen and Binglin Liu; writing—original draft preparation, Yandi Wang, Lin Chen and Zhuolin Tao; writing—review and editing, Yandi Wang, Lin Chen and Zhuolin Tao; visualization, Yandi Wang, Lin Chen and Binglin Liu; project administration, Zhuolin Tao; funding acquisition, Zhuolin Tao. All authors have read and agreed to the published version of the manuscript.

Funding

This research was funded by the National Natural Science Foundation of China, grant numbers 42471262 and 42101189.

Data Availability Statement

All data used in this study are free to access.

Acknowledgments

The authors would like to thank the editor and anonymous reviewers for their suggestions.

Conflicts of Interest

The authors declare no conflicts of interest.

References

  1. The United Nations (UN). Sustainable Development Goals 3; The United Nations (UN): New York, NY, USA, 2015. [Google Scholar]
  2. Penchansky, R.; Thomas, J.W. The concept of access: Definition and relationship to consumer satisfaction. Med. Care 1981, 19, 127–140. [Google Scholar] [CrossRef] [PubMed]
  3. Khan, A.A. An integrated approach to measuring potential spatial access to health care services. Socio Econ. Plan. Sci. 1992, 26, 275–287. [Google Scholar] [CrossRef] [PubMed]
  4. Guagliardo, M.F. Spatial accessibility of primary care: Concepts, methods and challenges. Int. J. Health Geogr. 2004, 3, 3. [Google Scholar] [CrossRef] [PubMed]
  5. McGrail, M.R. Spatial accessibility of primary health care utilising the two step floating catchment area method: An assessment of recent improvements. Int. J. Health Geogr. 2012, 11, 50. [Google Scholar] [CrossRef]
  6. Park, Y.; Guldmann, J. Understanding disparities in community green accessibility under alternative green measures: A metropolitan-wide analysis of Columbus, Ohio, and Atlanta, Georgia. Landsc. Urban Plan. 2020, 200, 103806. [Google Scholar] [CrossRef]
  7. Sharma, G.; Patil, G.R. Spatial and social inequities for educational services accessibility—A case study for schools in Greater Mumbai. Cities 2022, 122, 103543. [Google Scholar] [CrossRef]
  8. Sharma, G.; Patil, G.R. Urban spatial structure and equity for urban services through the lens of accessibility. Transp. Policy 2024, 146, 72–90. [Google Scholar] [CrossRef]
  9. Xiong, Q.; Liu, Y.; Xing, L.; Wang, L.; Ding, Y.; Liu, Y. Measuring spatio-temporal disparity of location-based accessibility to emergency medical services. Health Place 2022, 74, 102766. [Google Scholar] [CrossRef]
  10. Luo, W.; Wang, F. Measures of spatial accessibility to health care in a GIS environment: Synthesis and a case study in the Chicago region. Environ. Plan. B Plan. Des. 2003, 30, 865–884. [Google Scholar] [CrossRef]
  11. Wang, F. Measurement, optimization and impact of healthcare accessibility: A methodological review. Ann. Assoc. Am. Geogr. 2012, 102, 1104–1112. [Google Scholar] [CrossRef]
  12. Oliver, A.; Mossialos, E. Equity of access to health care: Outlining the foundations for action. J. Epidemiol. Community Health 2004, 58, 655–658. [Google Scholar] [CrossRef] [PubMed]
  13. Whitehead, J.; Pearson, A.L.; Lawrenson, R.; Atatoa-Carr, P. How can the spatial equity of health services be defined and measured? A systematic review of spatial equity definitions and methods. J. Health Serv. Res. Policy 2019, 24, 270–278. [Google Scholar] [CrossRef] [PubMed]
  14. Wang, F.; Tang, Q. Planning toward equal accessibility to services: A quadratic programming approach. Environ. Plan. B Plan. Des. 2013, 40, 195–212. [Google Scholar] [CrossRef]
  15. Du, X.; Liu, M.; Luo, S. Exploring Equity in a Hierarchical Medical Treatment System: A Focus on Determinants of Spatial Accessibility. ISPRS Int. J. Geo Inf. 2023, 12, 318. [Google Scholar] [CrossRef]
  16. Vallée, J.; Shareck, M.; Le Roux, G.; Kestens, Y.; Frohlich, K.L. Is accessibility in the eye of the beholder? Social inequalities in spatial accessibility to health-related resources in Montréal, Canada. Soc. Sci. Med. 2020, 245, 112702. [Google Scholar] [CrossRef]
  17. Tao, Z.; Cheng, Y.; Du, S.; Feng, L.; Wang, S. Accessibility to delivery care in Hubei Province, China. Soc. Sci. Med. 2020, 260, 113186. [Google Scholar] [CrossRef]
  18. Ghorbanzadeh, M.; Kim, K.; Erman Ozguven, E.; Horner, M.W. Spatial accessibility assessment of COVID-19 patients to healthcare facilities: A case study of Florida. Travel Behav. Soc. 2021, 24, 95–101. [Google Scholar] [CrossRef]
  19. Yan, X.; He, S.; Webster, C.; Yu, M. Divergent distributions of physicians and healthcare beds in China Changing patterns, driving forces, and policy implications. Appl. Geogr. 2022, 138, 102626. [Google Scholar] [CrossRef]
  20. Jia, P.; Wang, Y.; Yang, M.; Wang, L.; Yang, X.; Shi, X.; Yang, L.; Wen, J.; Liu, Y.; Yang, M.; et al. Inequalities of spatial primary healthcare accessibility in China. Soc. Sci. Med. 2022, 314, 115458. [Google Scholar] [CrossRef]
  21. Ye, P.; Ye, Z.; Xia, J.; Zhong, L.; Zhang, M.; Lv, L.; Tu, W.; Yue, Y.; Li, Q. National-scale 1-km maps of hospital travel time and hospital accessibility in China. Sci. Data 2024, 11, 1130. [Google Scholar] [CrossRef]
  22. Falchetta, G.; Hammad, A.T.; Shayegh, S. Planning universal accessibility to public health care in sub-Saharan Africa. Proc. Natl. Acad. Sci. USA 2020, 117, 31760–31769. [Google Scholar] [CrossRef] [PubMed]
  23. Juran, S.; Broer, P.N.; Klug, S.J.; Snow, R.C.; Okiro, E.A.; Ouma, P.O.; Snow, R.W.; Tatem, A.J.; Meara, J.G.; Alegana, V.A. Geospatial mapping of access to timely essential surgery in sub-Saharan Africa. BMJ Glob. Health 2018, 3, e000875. [Google Scholar] [CrossRef] [PubMed]
  24. Weiss, D.J.; Nelson, A.; Vargas-Ruiz, C.A.; Gligorić, K.; Bavadekar, S.; Gabrilovich, E.; Bertozzi-Villa, A.; Rozier, J.; Gibson, H.S.; Shekel, T.; et al. Global maps of travel time to healthcare facilities. Nat. Med. 2020, 26, 1835–1838. [Google Scholar] [CrossRef] [PubMed]
  25. Hall, P.; Pain, K. The Polycentric Metropolis: Learning from Megacity Regions in Europe; Earthscan: London, UK, 2006. [Google Scholar]
  26. Gottmann, J. Megalopolis or the Urbanization of the Northeastern Seaboard. Econ. Geogr. 1957, 33, 189–200. [Google Scholar] [CrossRef]
  27. Scott, A.J. Global City-Regions: Trends, Theory, Policy; Oxford University Press: New York, NY, USA, 2001. [Google Scholar]
  28. Florida, R.; Gulden, T.; Mellander, C. The rise of the mega-region. Camb. J. Reg. Econ. Soc. 2008, 1, 459–476. [Google Scholar] [CrossRef]
  29. Kloosterman, R.; Musterd, S. The Polycentric Urban Region: Towards a Research Agenda. Urban Stud. 2001, 38, 623–633. [Google Scholar] [CrossRef]
  30. McGee, T.G. The Emergence of Desakota Regions in Asia: Expanding a Hypothesis. In The Extended Metropolis: Settlement Transition Is Asia; Ginsburg, N., Koppel, B., McGee, T.G., Eds.; University of Hawaii Press: Honolulu, HI, USA, 1991. [Google Scholar]
  31. Fang, C.; Yu, D. Urban agglomeration: An evolving concept of an emerging phenomenon. Landsc. Urban Plan. 2017, 162, 126–136. [Google Scholar] [CrossRef]
  32. The State Council of China. The National New-Type Urbanization Plan; The State Council of China: Beijing, China, 2014. [Google Scholar]
  33. Dash Nelson, G.; Rae, A. An Economic Geography of the United States: From Commutes to Megaregions. PLoS ONE 2016, 11, e0166083. [Google Scholar] [CrossRef]
  34. Huang, H.; Xia, T.; Tian, Q.; Liu, T.; Wang, C.; Li, D. Transportation issues in developing China’s urban agglomerations. Transp. Policy 2020, 85, A1–A22. [Google Scholar] [CrossRef]
  35. Marull, J.; Font, C.; Boix, R. Modelling urban networks at mega-regional scale: Are increasingly complex urban systems sustainable? Land Use Policy 2015, 43, 15–27. [Google Scholar] [CrossRef]
  36. Zhang, W.; Fang, C.; Zhou, L.; Zhu, J. Measuring megaregional structure in the Pearl River Delta by mobile phone signaling data: A complex network approach. Cities 2020, 104, 102809. [Google Scholar] [CrossRef]
  37. Lin, X.; Yang, J.; MacLachlan, I. High-speed rail as a solution to metropolitan passenger mobility: The case of Shenzhen-Dongguan-Huizhou metropolitan area. J. Transp. Land Use 2018, 11, 1257–1270. [Google Scholar] [CrossRef]
  38. Ross, C. Transport and megaregions: High-speed rail in the United States. Town Plan. Rev. 2011, 82, 341–356. [Google Scholar] [CrossRef]
  39. Harrington, D.W.; Rosenberg, M.W.; Wilson, K. Comparing health status and access to health care in Canada’s largest metropolitan areas. Urban Geogr. 2014, 35, 1156–1170. [Google Scholar] [CrossRef]
  40. Yu, M.; He, S.; Wu, D.; Zhu, H.; Webster, C. Examining the Multi-Scalar Unevenness of High-Quality Healthcare Resources Distribution in China. Int. J. Environ. Res. Public Health 2019, 16, 2813. [Google Scholar] [CrossRef]
  41. Brekke, K.R.; Levaggi, R.; Siciliani, L.; Straume, O.R. Patient mobility and health care quality when regions and patients differ in income. J. Health Econ. 2016, 50, 372–387. [Google Scholar] [CrossRef]
  42. Koylu, C.; Delil, S.; Guo, D.; Celik, R.N. Analysis of big patient mobility data for identifying medical regions, spatio-temporal characteristics and care demands of patients on the move. Int. J. Health Geogr. 2018, 17, 32. [Google Scholar] [CrossRef]
  43. Beraldo, S.; Collaro, M.; Marino, I. Patient migration as a response to the regulation of subnational healthcare budgets. Reg. Stud. 2023, 57, 2207–2219. [Google Scholar] [CrossRef]
  44. Ding, J.; Yang, C.; Wang, Y.; Li, P.; Wang, F.; Kang, Y.; Wang, H.; Liang, Z.; Zhang, J.; Han, P.; et al. Influential factors of intercity patient mobility and its network structure in China. Cities 2023, 132, 103975. [Google Scholar] [CrossRef]
  45. Wang, X.; Nie, X. The uneven distribution of medical resources for severe diseases in China: An analysis of the disparity in inter-city patient mobility. Appl. Geogr. 2024, 165, 103226. [Google Scholar] [CrossRef]
  46. Zhong, Q.; Wu, J.; Tao, Z. Intercity patient mobility can improve healthcare accessibility and equality in metropolitan areas: A case study of Shenzhen metropolitan area, China. Appl. Geogr. 2024, 171, 103383. [Google Scholar] [CrossRef]
  47. Li, C.; Wang, J. A hierarchical two-step floating catchment area analysis for high-tier hospital accessibility in an urban agglomeration region. J. Transp. Geogr. 2022, 102, 103369. [Google Scholar] [CrossRef]
  48. Zhang, H.; Zhou, B.-B.; Liu, S.; Hu, G.; Meng, X.; Liu, X.; Shi, H.; Gao, Y.; Hou, H.; Li, X. Enhancing intercity transportation will improve the equitable distribution of high-quality health care in China. Appl. Geogr. 2023, 152, 102892. [Google Scholar] [CrossRef]
  49. Yip, W.; Fu, H.; Chen, A.T.; Zhai, T.; Jian, W.; Xu, R.; Pan, J.; Hu, M.; Zhou, Z.; Chen, Q.; et al. 10 years of health-care reform in China: Progress and gaps in Universal Health Coverage. Lancet 2019, 394, 1192–1204. [Google Scholar] [CrossRef]
  50. Tao, Z.; Yao, Z.; Kong, H.; Duan, F.; Li, G. Spatial accessibility to healthcare services in Shenzhen, China: Improving the multi-modal two-step floating catchment area method by estimating travel time via online map APIs. BMC Health Serv. Res. 2018, 18, 345. [Google Scholar] [CrossRef]
  51. Chen, K.; Zhao, P.; Qin, K.; Kwan, M.; Wang, N. Towards healthcare access equality: Understanding spatial accessibility to healthcare services for wheelchair users. Comput. Environ. Urban Syst. 2024, 108, 102069. [Google Scholar] [CrossRef]
  52. Yang, D.; Goerge, R.; Mullner, R. Comparing GIS-based methods of measuring spatial accessibility to health services. J. Med. Syst. 2006, 30, 23–32. [Google Scholar] [CrossRef]
  53. Stacherl, B.; Sauzet, O. Gravity models for potential spatial healthcare access measurement: A systematic methodological review. Int. J. Health Geogr. 2023, 22, 34. [Google Scholar] [CrossRef]
  54. Radke, J.; Mu, L. Spatial decomposition, modeling and mapping service regions to predict access to social programs. Geogr. Inf. Sci. 2000, 2, 105–112. [Google Scholar] [CrossRef]
  55. Dai, D. Black residential segregation, disparities in spatial access to health care facilities, and late-stage breast cancer diagnosis in metropolitan Detroit. Health Place 2010, 16, 1038–1052. [Google Scholar] [CrossRef]
  56. Luo, W.; Qi, Y. An enhanced two-step floating catchment area (E2SFCA) method for measuring spatial accessibility to primary care physicians. Health Place 2009, 15, 1100–1107. [Google Scholar] [CrossRef] [PubMed]
  57. McGrail, M.R.; Humphreys, J.S. Measuring spatial accessibility to primary health care services: Utilising dynamic catchment sizes. Appl. Geogr. 2014, 54, 182–188. [Google Scholar] [CrossRef]
  58. Langford, M.; Higgs, G.; Fry, R. Multi-modal two-step floating catchment area analysis of primary health care accessibility. Health Place 2016, 38, 70–81. [Google Scholar] [CrossRef]
  59. Mao, L.; Nekorchuk, D. Measuring spatial accessibility to healthcare for populations with multiple transportation modes. Health Place 2013, 24, 115–122. [Google Scholar] [CrossRef] [PubMed]
  60. Delamater, P.L. Spatial accessibility in suboptimally configured health care systems: A modified two-step floating catchment area (M2SFCA) metric. Health Place 2013, 24, 30–43. [Google Scholar] [CrossRef]
  61. Luo, J. Integrating the Huff Model and Floating Catchment Area Methods to Analyze Spatial Access to Healthcare Services. Trans. GIS 2014, 18, 436–448. [Google Scholar] [CrossRef]
  62. Shao, Y.; Luo, W. Supply-demand adjusted two-steps floating catchment area (SDA-2SFCA) model for measuring spatial access to health care. Soc. Sci. Med. 2022, 296, 114727. [Google Scholar] [CrossRef]
  63. Wang, J.; Du, F.; Huang, J.; Liu, Y. Access to hospitals: Potential vs. observed. Cities 2020, 100, 102671. [Google Scholar] [CrossRef]
  64. Wei, Z.; Bai, J.; Feng, R. Evaluating the spatial accessibility of medical resources taking into account the residents‘ choice behavior of outpatient and inpatient medical treatment. Socio Econ. Plan. Sci. 2022, 83, 101336. [Google Scholar] [CrossRef]
  65. Wei, W.; Xiang, B. Spatial pattern of cross-city medical network and supply-demand relationship of medical facilities in China: Based on cross-city medical internet data. Geogr. Res. 2024, 43, 701–717. [Google Scholar]
  66. Jia, W.; Huang, Z.; Bao, J.; Shen, W. Spatiotemporal differences in the accessibility of scenic spots based on door-to-door travel by high-speed rail: A case study of Shanghai-Nanjing intercity travel. Tour. Trib. 2023, 38, 148–159. [Google Scholar]
  67. Dai, G.; Li, R.; Ma, S. Research on the equity of health resource allocation in TCM hospitals in China based on the Gini coefficient and agglomeration degree: 2009–2018. Int. J. Equity Health 2022, 21, 145. [Google Scholar] [CrossRef] [PubMed]
  68. Skaftun, E.K.; Verguet, S.; Norheim, O.F.; Johansson, K.A. Geographic health inequalities in Norway: A Gini analysis of cross-county differences in mortality from 1980 to 2014. Int. J. Equity Health 2018, 17, 64. [Google Scholar] [CrossRef] [PubMed]
  69. Dagum, C. A New Approach to the Decomposition of the Gini Income Inequality Ratio. Empir. Econ. 1997, 22, 515–531. [Google Scholar] [CrossRef]
  70. Peng, R.; Huang, J.; Deng, X. Spatiotemporal evolution and influencing factors of the allocation of social care resources for the older adults in China. Int. J. Equity Health 2023, 22, 222. [Google Scholar] [CrossRef]
Figure 1. The distribution of subdistrict-level population density and healthcare facilities.
Ijgi 14 00168 g001
Figure 2. Hierarchy of cities in terms of the provision of high-quality healthcare resources.
Ijgi 14 00168 g002
Figure 3. Illustration of intercity healthcare-seeking travel via multilevel transportation networks.
Ijgi 14 00168 g003
Figure 4. Healthcare accessibility by driving (a) or transit (b) in the intracity scenario.
Ijgi 14 00168 g004
Figure 5. Healthcare accessibility by driving (a) or transit (b) in the intercity scenario.
Ijgi 14 00168 g005
Figure 6. Differences in healthcare accessibility between the intercity and intracity scenarios by driving (a) or transit (b).
Ijgi 14 00168 g006
Figure 7. Proportions of intracity travel time in the intercity scenarios by driving (a) or transit (b) from the demand side.
Ijgi 14 00168 g007
Figure 8. Proportions of destination-city travel times in intercity scenarios by driving (ad) or transit (eh) from the supply side.
Ijgi 14 00168 g008
Table 1. Dagum’s Gini coefficients of healthcare accessibility in various scenarios.
ScenarioOverall Gini CoefficientIntracity ComponentIntercity ComponentSuper-Variable Density Component
Intracity—Driving0.4590.028
(6.1%)
0.318
(69.3%)
0.113
(24.6%)
Intracity—Transit0.4660.029
(6.3%)
0.315
(67.5%)
0.122
(26.2%)
Intercity—Driving0.2650.019
(7.2%)
0.131
(49.4%)
0.116
(43.8%)
Intercity—Transit0.2970.020
(6.8%)
0.159
(53.7%)
0.117
(39.5%)
Disclaimer/Publisher’s Note: The statements, opinions and data contained in all publications are solely those of the individual author(s) and contributor(s) and not of MDPI and/or the editor(s). MDPI and/or the editor(s) disclaim responsibility for any injury to people or property resulting from any ideas, methods, instructions or products referred to in the content.

