Abstract
Due to the complexity of outdoor environments, we still face challenges in collecting up-to-date outdoor road network maps because of high data collection costs, resulting in a lack of navigation road network maps in outdoor scenarios. Existing road network extraction methods are mainly divided into trajectory data-based and remote sensing image-based methods. Due to factors such as tree occlusion, methods based on remote sensing images struggle to extract complete road information in outdoor environments. The methods based on trajectory data mainly use vehicle trajectories to extract two-dimensional roads, lacking three-dimensional (3D) road information such as elevation and slope, which are important for navigation path planning in outdoor scenarios. Given this, this paper proposes a hierarchical map construction method for extracting the three-dimensional outdoor pedestrian road network based on crowdsourced trajectory data. This method models the pedestrian road network as a graph composed of pedestrian areas, intersections, and road segments connecting these areas. Three-dimensional roads within and between the intersection areas are generated hierarchically. Experiments and comparative analyses were conducted using real-world outdoor trajectory datasets. Results show that the proposed method has higher accuracy in extracting 3D road information than existing methods.
1. Introduction
The pedestrian navigation road network is an important supplement to vehicle navigation networks and serves as a crucial slow-moving network for people’s walking, cycling, and other outdoor activities. The concept of the pedestrian road network originated in 1797 [1]. At that time, the French army occupied Venice and attempted to establish a structure that connects the island group through waterways. By building canals, bridges, and roads, this amphibious city was transformed into a homogeneous pedestrian network. Farkisch et al. [2] and Fonseca et al. [3] understood the pedestrian road network as a specific structure in urban space, which consists of interconnected streets with elements of accessibility and connectivity. Kasemsuppakorn and Karimi [4] defined the pedestrian road network as a topological graph network that depicts the geometric relationships between pedestrian path segments. Yang et al. [5] defined the pedestrian road network as a slow-moving traffic network composed of pedestrian roads and pedestrian areas for people to walk. The pedestrian road network is an important supplement to the vehicle road network and is also an important green corridor for people’s walking, cycling, and other movements [6]. With the continuous expansion of the navigation market and the increasing demand of users for walking trips, relying on a pedestrian road network map with high precision, full coverage, strong currency, and rich semantics has become a new requirement for people’s walking trips [7]. However, due to the complexity of the outdoor environment, current professional mapping technologies (such as field surveys and remote sensing technologies) still face huge challenges in collecting large-scale outdoor road network information due to problems such as high costs of large-scale data collection and serious tree occlusion, resulting in a relative lack of outdoor navigation road network map data and an inability to meet the needs of personalized travel applications.
With the rapid development of navigation and positioning technologies, sensors, and mobile communication technologies, mobile terminal devices such as smartphones can record users’ spatial positions, movement speeds, directions, and other spatio-temporal information in real time, thereby accumulating massive spatio-temporal trajectory big data, which provides an important data source for the rapid construction and dynamic update of outdoor navigation road network maps. However, currently, the methods for extracting road network information based on trajectory data mainly extract vehicle road network information from vehicle trajectory data, which can be mainly divided into clustering-based methods, rasterization-based methods, intersection connection-based methods, and incremental update-based methods [8,9,10]. Among them, clustering-based methods generally cluster large-scale trajectory points or trajectory segments, fit the clusters or representative points, and then sequentially connect the cluster centers to form the center line of the road [11]. Edelkamp and Schrödl [12] used the K-means clustering method to obtain cluster centers and connected them to generate a road network. Rasterization-based methods first convert the original trajectory data into a trajectory distribution density map, binarize the density map through threshold segmentation, and then finally use mathematical morphology operators to extract the skeleton line from the binarized density image as the center line of the road [5,13]. Intersection connection-based methods model the road network as a complex network composed of road intersections and road segments connecting road intersections, such as clustering turning points for refined modeling of intersections [4,14]. Some scholars used low-frequency Global Positioning System (GPS) trajectory data to generate urban road networks and reconstruct the detailed geometric structures inside complex urban intersections [15,16,17]. Incremental update-based methods gradually match and fuse trajectory segments to obtain a complete road network. For example, Ahmed and Wenk [18] selected trajectories as the initial road network, added the trajectories one by one to match with the initial road network, updated the parts that did not match the road network to the original road network data, and then iteratively processed them to obtain the entire road network data. Recently, deep learning models were applied by scholars to extract road networks from different data sources. For example, He et al. [19] proposed an incremental method called Roadrunner for road network tracking from trajectory data, which fuses trajectory segments with similar positions and shapes, segments the trajectories at road intersections, and incrementally extracts the road network. Zhao et al. [20] proposed a method to extract the road network for historical maps with a GAN model. Xu et al. [21] extracted the road network by fusing remote sensing images and GPS trajectories using deep learning methods.
Currently, the algorithms for extracting urban vehicle road network structures using vehicle trajectory data have been relatively mature. Some scholars have directly applied these road network generation methods based on vehicle trajectory data to pedestrian road network extraction [5,14] and have made certain progress. In recent years, some scholars have also paid attention to the extraction of three-dimensional road structures and achieved some results. For example, Wang et al. [22] used satellite imagery, elevation data, and two-dimensional (2D) road centerline data as inputs to automatically generate 3D road networks. However, the outdoor scenarios considered by existing trajectory-based approaches are relatively simple. Existing methods mainly use trajectory data to extract the two-dimensional geometric structures of roads, lacking three-dimensional (3D) road information such as elevation and slope, which are important components of pedestrian navigation maps and key information for outdoor path planning. Therefore, this paper proposes a hierarchical method for constructing a three-dimensional pedestrian navigation road network based on crowdsourced outdoor trajectory data. This method models the pedestrian road network as a graph model composed of pedestrian areas, intersections, and road segments connecting these areas and then adopts a hierarchical modeling idea of decomposition–combination to extract a fine outdoor three-dimensional pedestrian navigation road network. Experiments and comparative analyses were conducted using some real-world outdoor trajectory datasets. The results show that the proposed method has higher position extraction accuracy in extracting 3D road information than existing representative methods.
2. Methodology
Our method models the pedestrian road network as a graph of interconnected pedestrian areas, intersections, and road segments. Leveraging a ’decomposition-combination’ strategy, we propose a hierarchical framework to construct the 3D pedestrian road network, addressing both planar and vertical complexities inherent in outdoor environments. Based on the “decomposition-combination” divide-and-conquer research strategy, a hierarchical construction method of the three-dimensional pedestrian navigation road network is proposed. The flowchart of the proposed method is shown in Figure 1. This method mainly includes three main steps: trajectory data preprocessing, intersection and pedestrian area identification, and hierarchical extraction of the three-dimensional pedestrian road network. First, considering that the original trajectory data in the outdoor scene has problems such as low positioning accuracy and a lot of noise, it is difficult to directly use it for the extraction of the navigation road network. Especially in the complex outdoor scene, compared to plane positioning accuracy, the elevation positioning accuracy of the trajectory data usually has a larger error. Therefore, a trajectory data aggregation method and a trajectory data quality enhancement method based on digital elevation model (DEM) data are proposed to improve the quality of the original trajectory data and ensure the accuracy of road network extraction. Based on the preprocessing of the trajectory data, a density clustering method considering direction constraints is proposed to extract pedestrian areas and intersections. Finally, we use 3D trajectory data clustering and the curve fitting algorithm to extract the three-dimensional road structure information in the intersection area and the road segment. Then, we fuse the pedestrian areas, the roads in the intersections, and the roads on the road segments. In this way, we generate a complete pedestrian road network. The main steps of the proposed method are described in detail below.
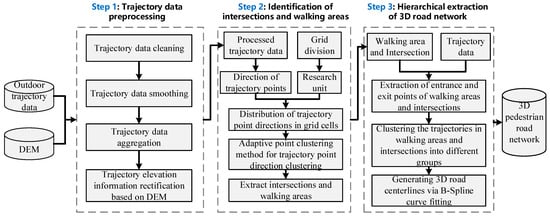
Figure 1.
The framework of the proposed method.
2.1. Preprocessing of Outdoor Trajectory Data
There are a large amount of data with serious position deviations in the original outdoor trajectory data due to positioning errors and signal occlusions. Therefore, it is necessary to preprocess the outdoor trajectory data first. The preprocessing steps are as follows:
- (a)
- Remove the trajectory points in the first minute and delete duplicate and redundant data.
- (b)
- Remove outliers and isolated trajectory points and segment the trajectory segments with abnormal distances or times. If the sampling distance or time between trajectory points is greater than a certain threshold, segment them.
- (c)
- Use the linear interpolation method for the trajectory points with sampling intervals that are too large to ensure the uniform spatial distribution of the trajectory points.
- (d)
- Use the trajectory data aggregation algorithm based on the gravity–repulsion force model [23] to aggregate the original trajectory data, gather the trajectory data towards the high-density central area, improve the spatial position accuracy of the original trajectory data, and ensure that the corrected trajectory points do not deviate from their original positions by more than the specified distance threshold. When performing trajectory aggregation, an extended gravity–repulsion force model is constructed to aggregate the trajectory points. In the model, the gravitational force from adjacent trajectory points will attract the source trajectory point towards the areas with higher density. In order to prevent the source trajectory point from deviating too much from its original position, a repulsive force is used to constrain the magnitude of the movement from its original position. The calculation formula for the gravitational force is as follows:The calculation formula for the repulsive force is as follows:where is the potential energy intensity, N is the number of trajectories, and are the variances, k is the spring constant, and t and are the offset distances from the road center and the original position, respectively. When conducting the experiments, we set the parameters , , , and k according to [23]. Specially, the potential energy intensity is set to 1; the variances is set to 5 m, and is set to 5 m as the standard deviation of the Gaussian distribution of the GPS error, and the spring constant is set to 0.005.
- (e)
- Use the high-precision DEM data with a spatial resolution of 12.5 m obtained by the Advanced Land Observing Satellite (ALOS) to perform the overall correction of the elevation information. Calculate the average value of the elevation differences between all trajectory points and the DEM (denoted as Ave). Delete the trajectory data with Ave greater than a certain threshold as abnormal data and correct the elevation of each trajectory point with Ave as the correction value for the remaining trajectory data. If the elevation difference between a certain trajectory point and the DEM data is greater than 10 m (the 10 m elevation correction threshold was determined based on the typical vertical positioning error (5–15 m) of consumer-grade GPS devices in obstructed outdoor environments) and the elevation differences between the two adjacent trajectory points and the DEM are small, mark it as an error point and replace the elevation of this trajectory point with the average value of the elevations of the two adjacent trajectory points. For the trajectory points with a difference from the DEM data of less than 10 m, update their elevations to the average of the elevations of the trajectory points and the DEM.
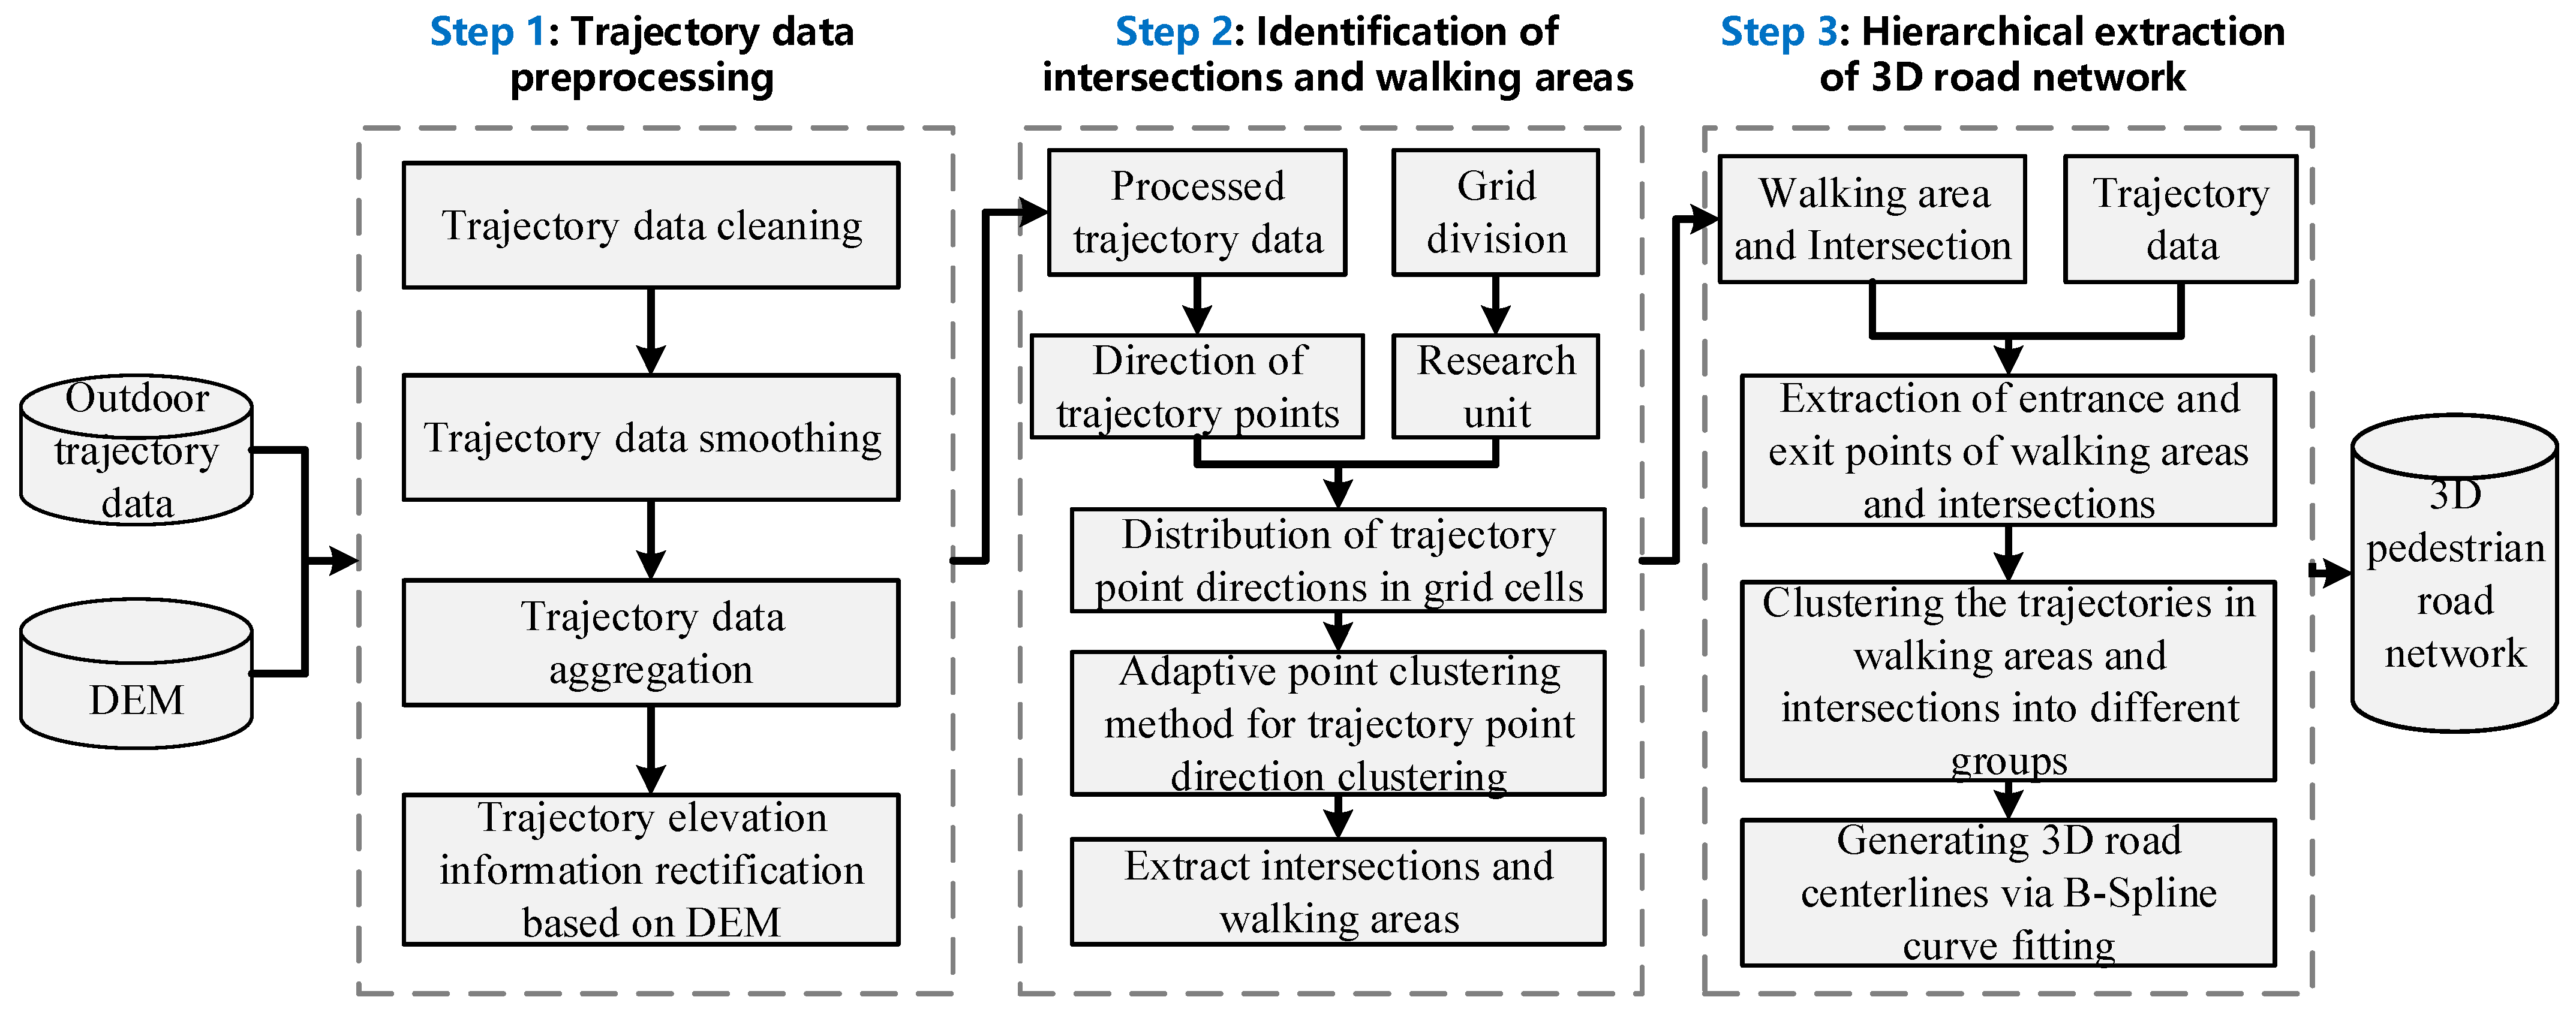
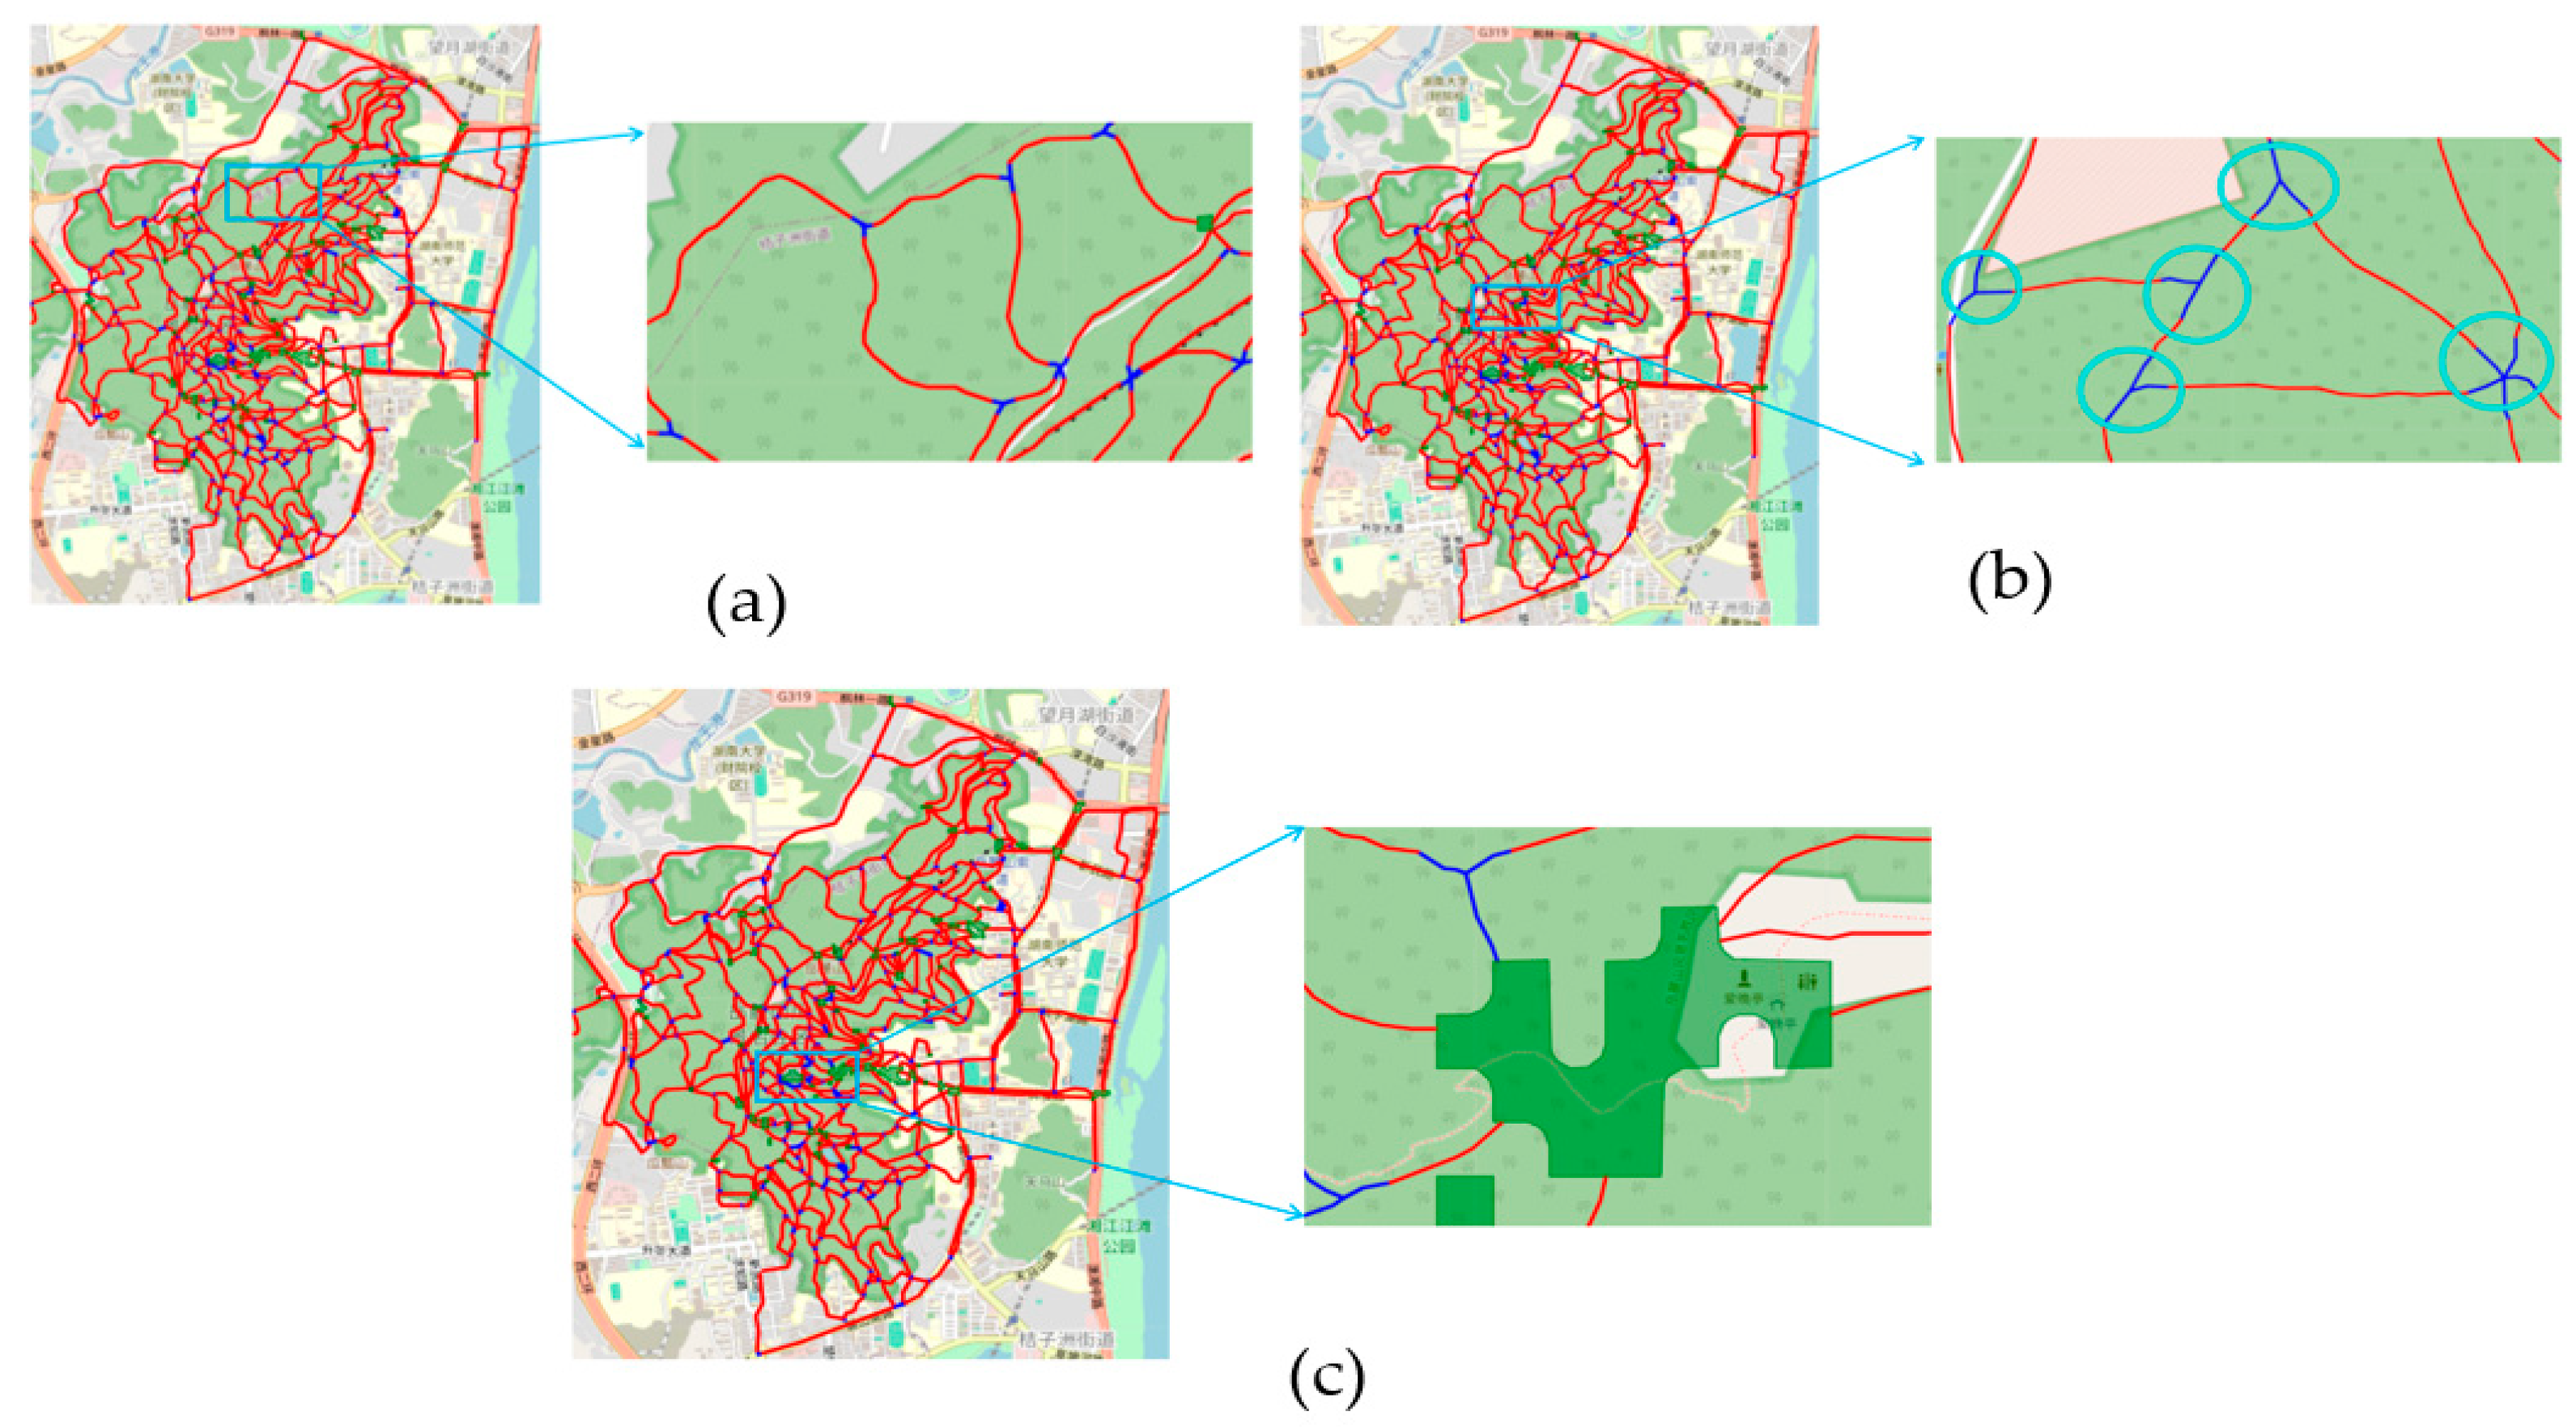
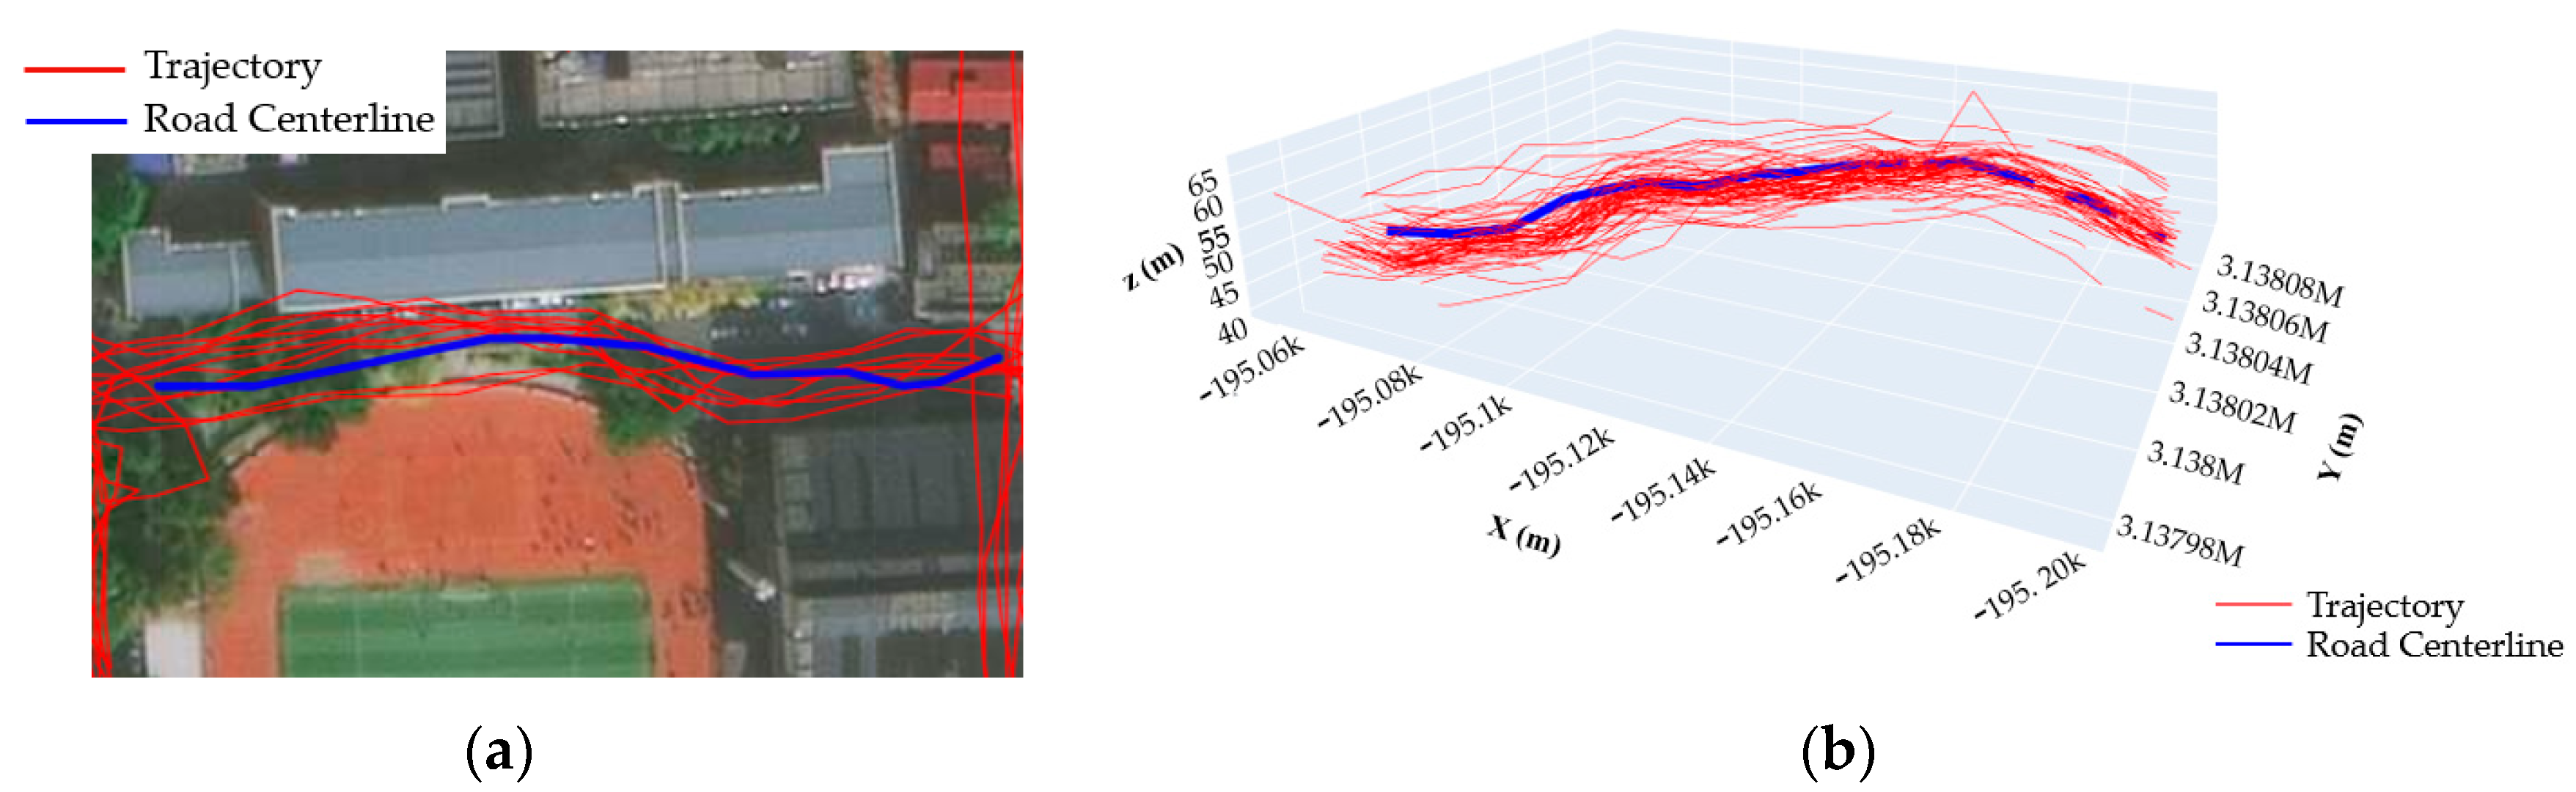
Figure 2 shows the comparison of the results of the outdoor sport trajectory data in a certain area before and after trajectory data preprocessing.
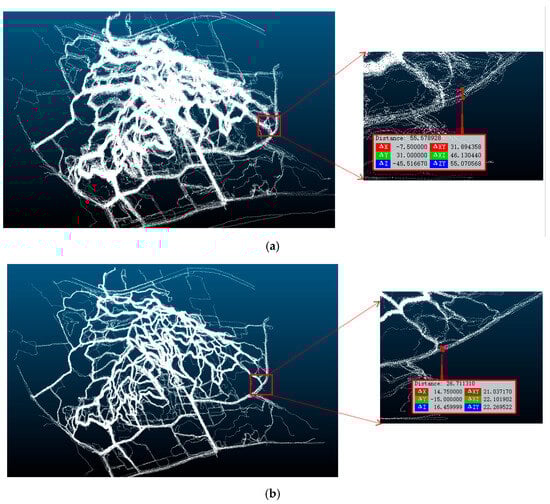
Figure 2.
Illustration of the pre-processing results of the 3D outdoor trajectory data: (a) raw trajectory data; (b) processed trajectory data.
2.2. Identification of Intersections and Pedestrian Areas
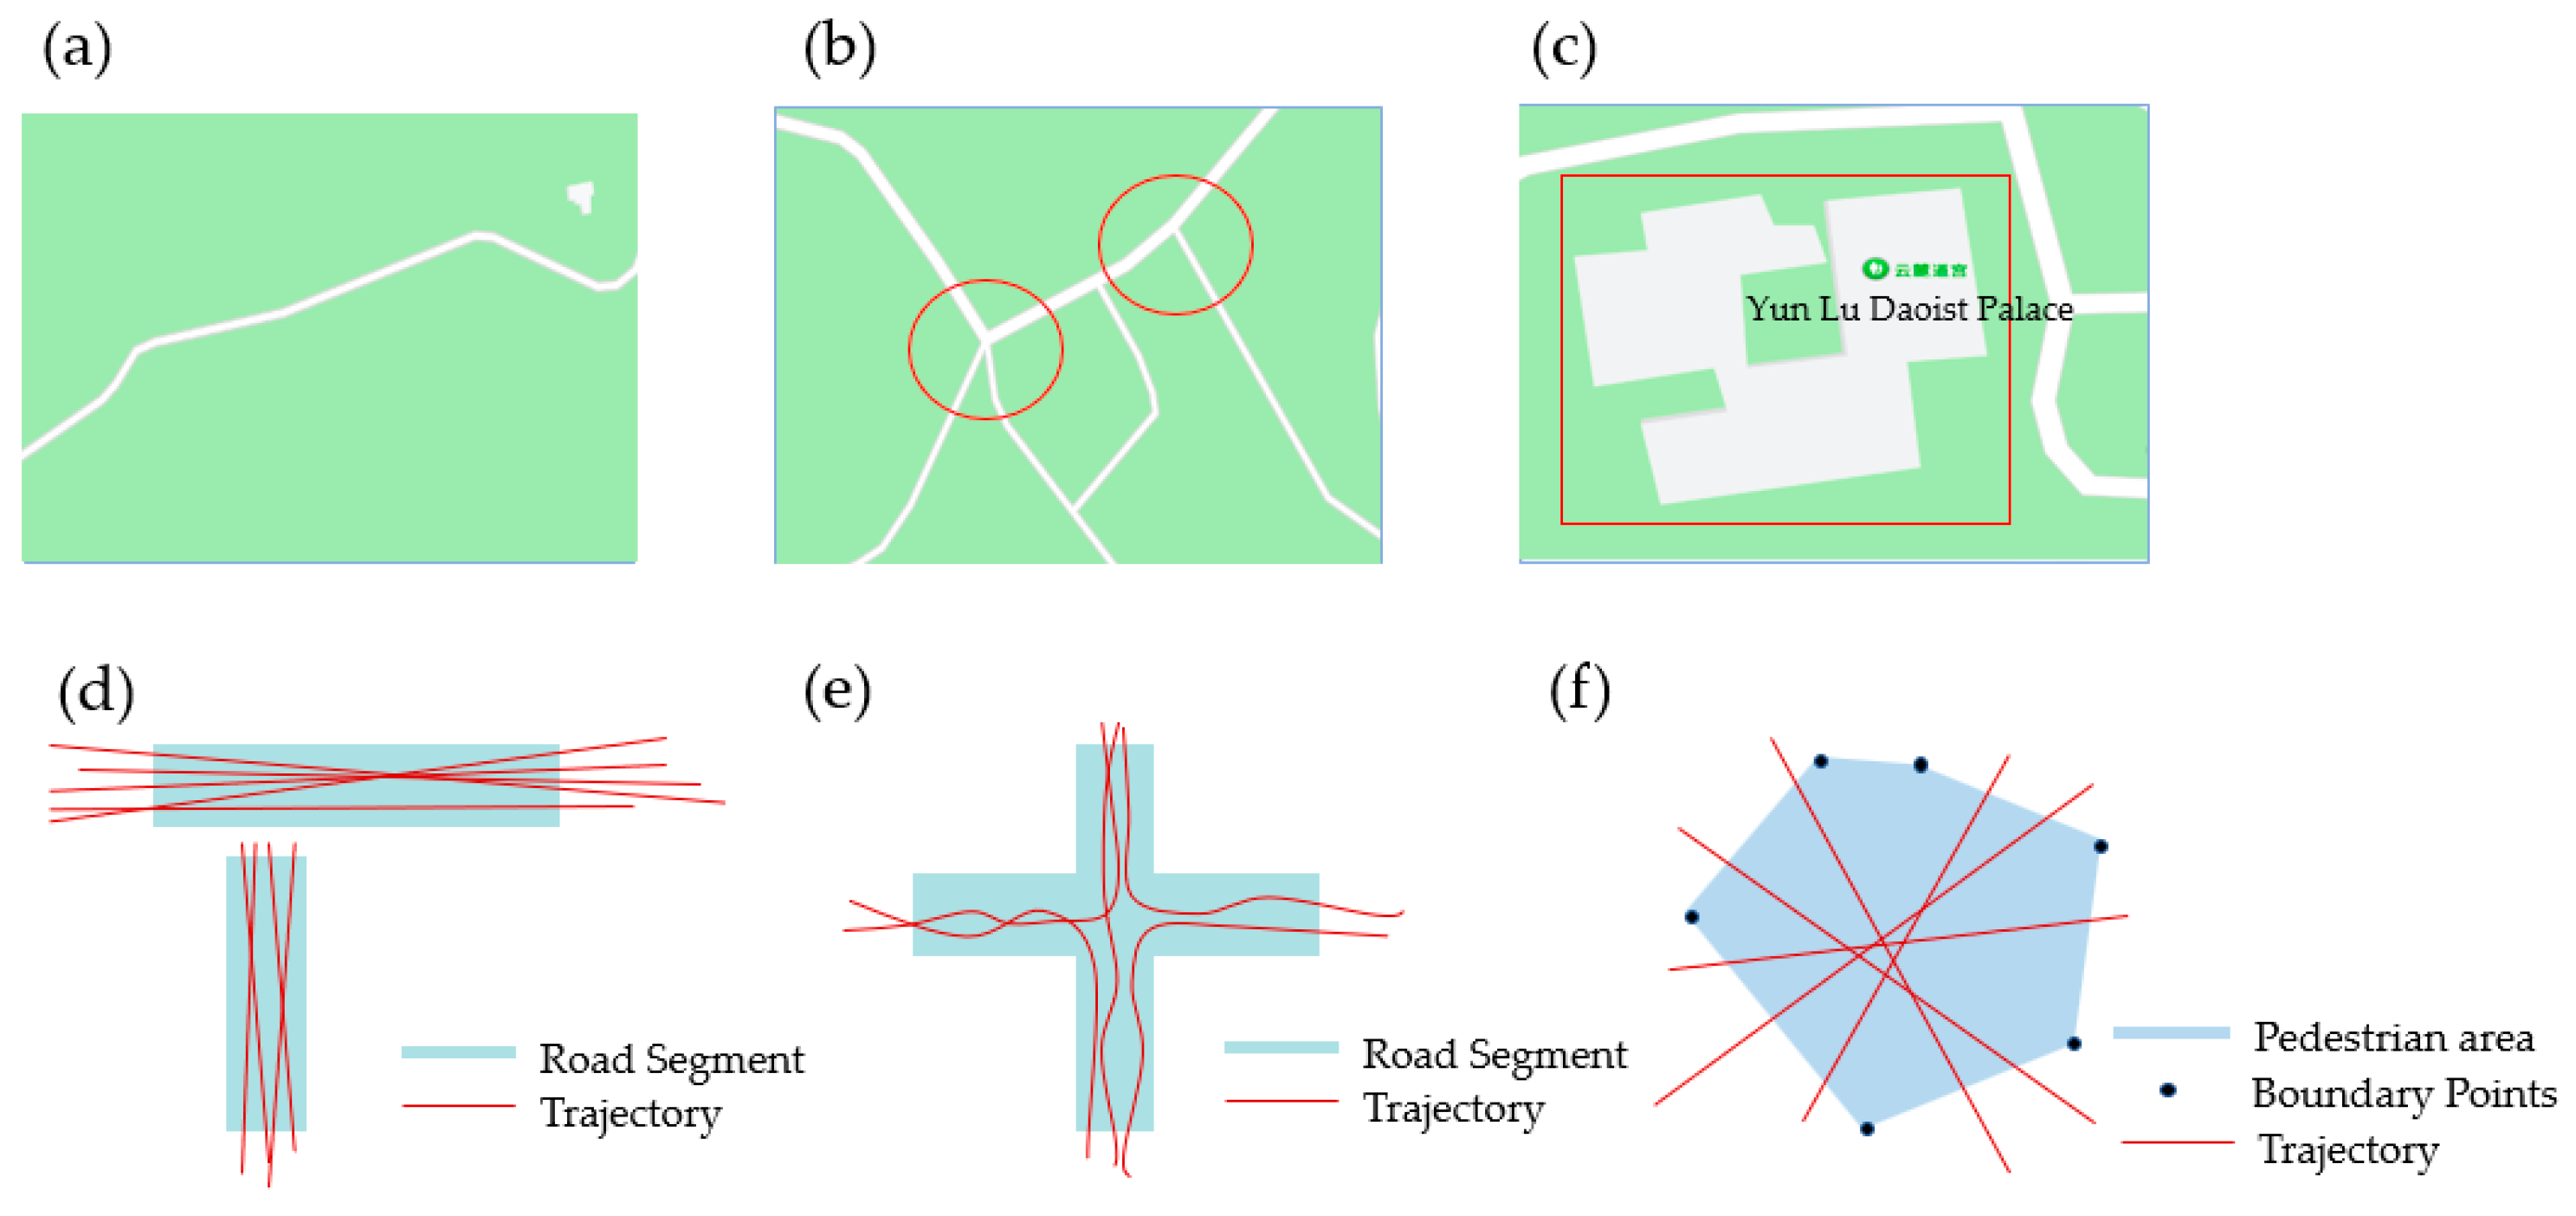
Combined with the characteristics of pedestrian walking movements in the outdoor scene, when we walk on the road, the trajectory points are usually distributed regularly near the center of the road. When we walk through the intersection of the road, the direction of the movement trajectory will obviously change. When we are in a square, sports field, or other pedestrian areas, the movement trajectories of pedestrians are generally disordered and show an irregular distribution. This paper presents the distribution patterns of outdoor pedestrian trajectories in three different pedestrian road network structures, as shown in Figure 3.
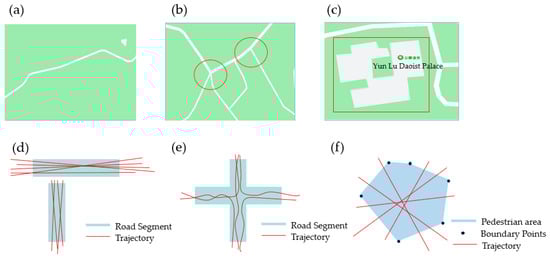
Figure 3.
Characteristics of trajectory distributions in different regions of a pedestrian road network: (a) road; (b) intersection; (c) pedestrian area; (d) trajectories on road segments; (e) trajectories in an intersection area; (f) trajectories in a pedestrian area.
By analyzing the characteristics of pedestrian movement trajectory data, the following conclusions can be obtained:
- (a)
- On the road segment, the forward directions of the trajectory points are basically the same;
- (b)
- In the road intersection, the directions of the trajectory points are distributed in several main directions;
- (c)
- In the pedestrian area, due to the absence of specific road segments, the forward directions of the trajectories are relatively chaotic.
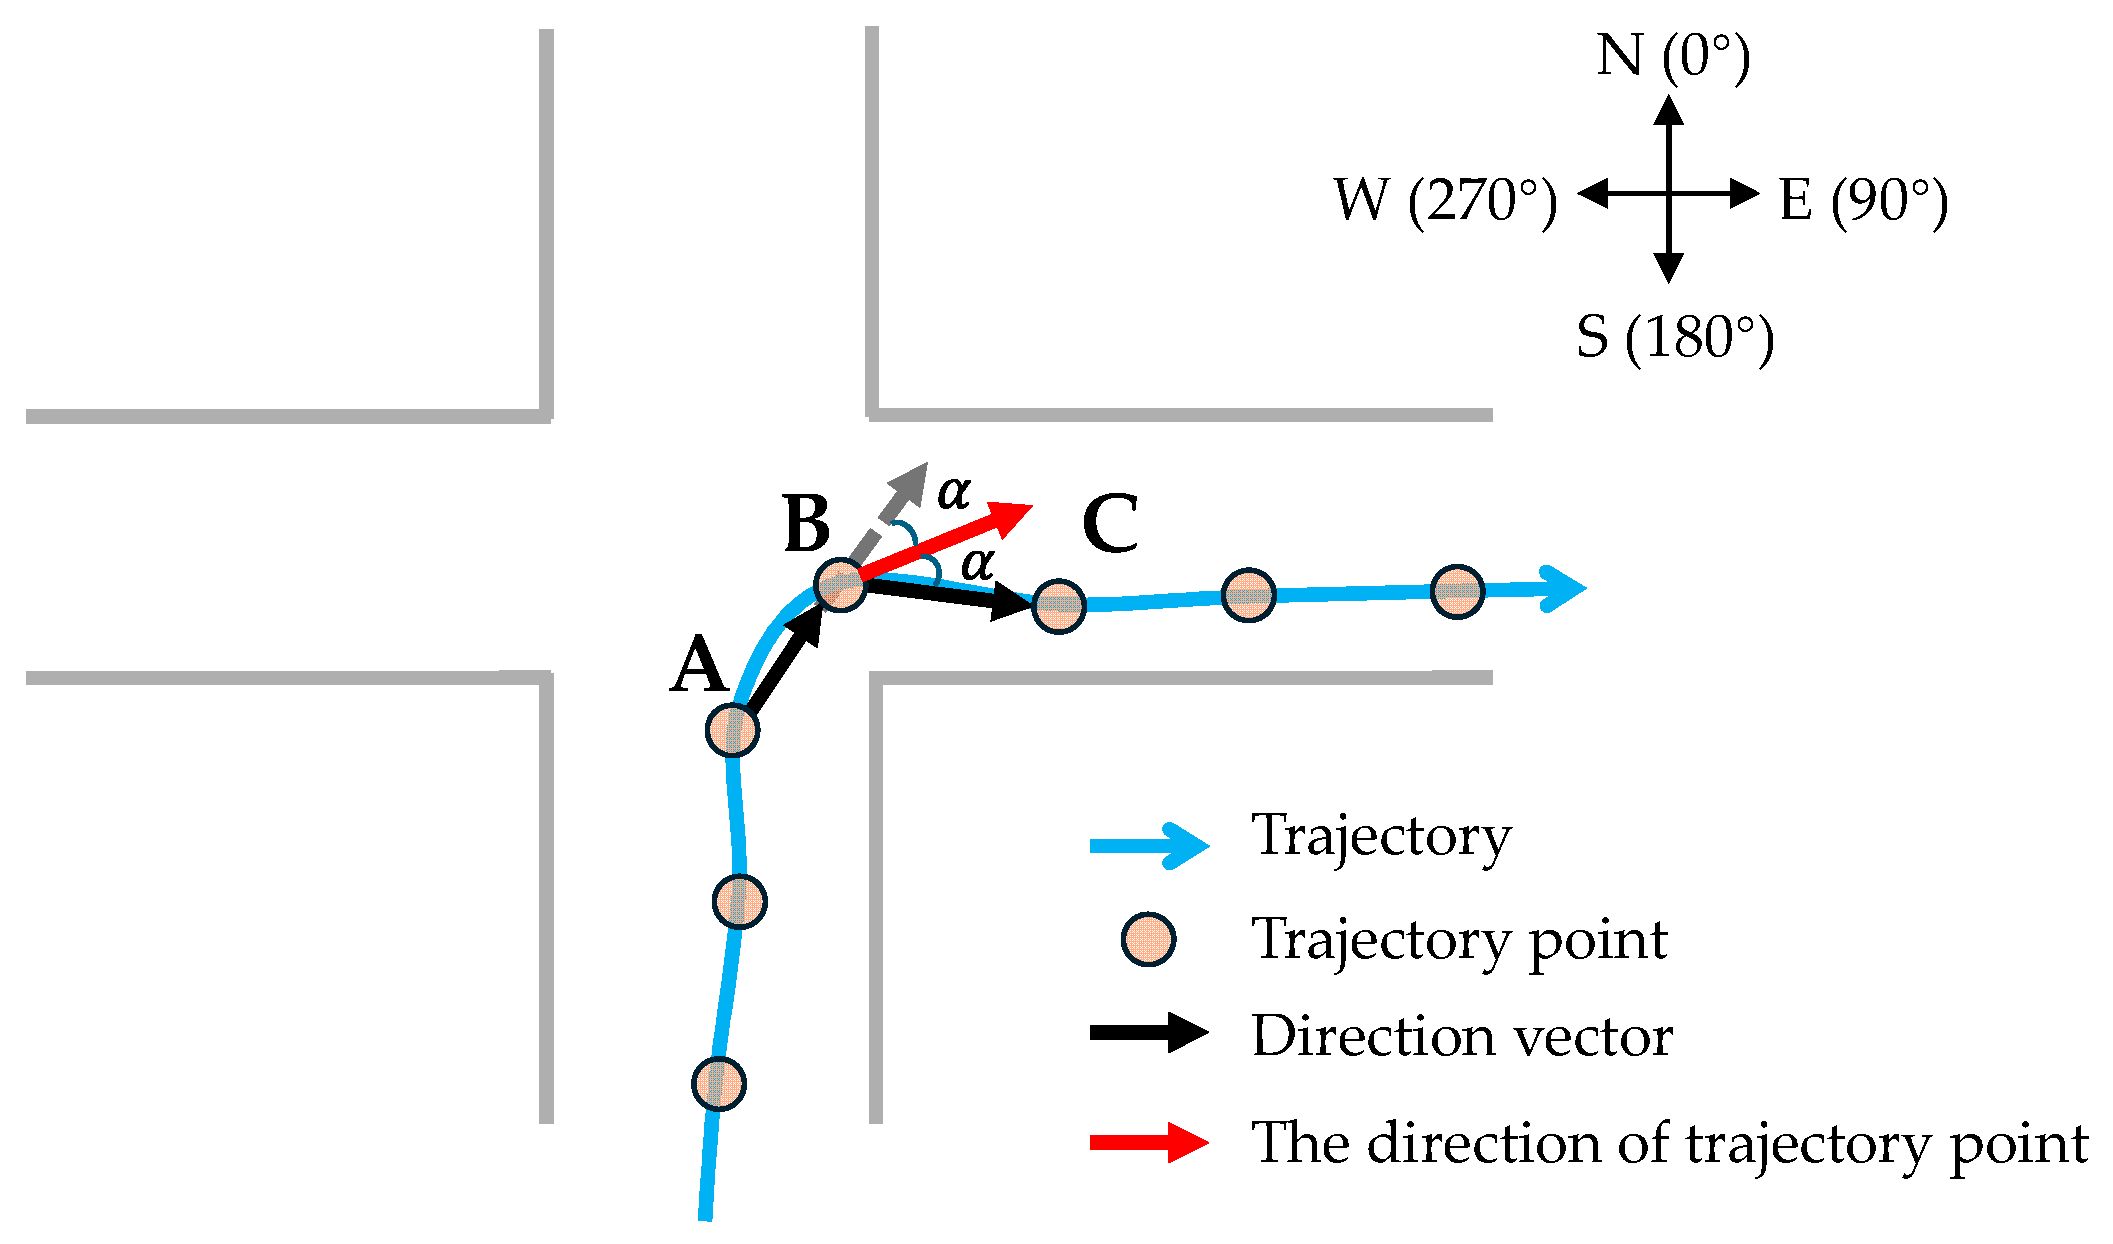
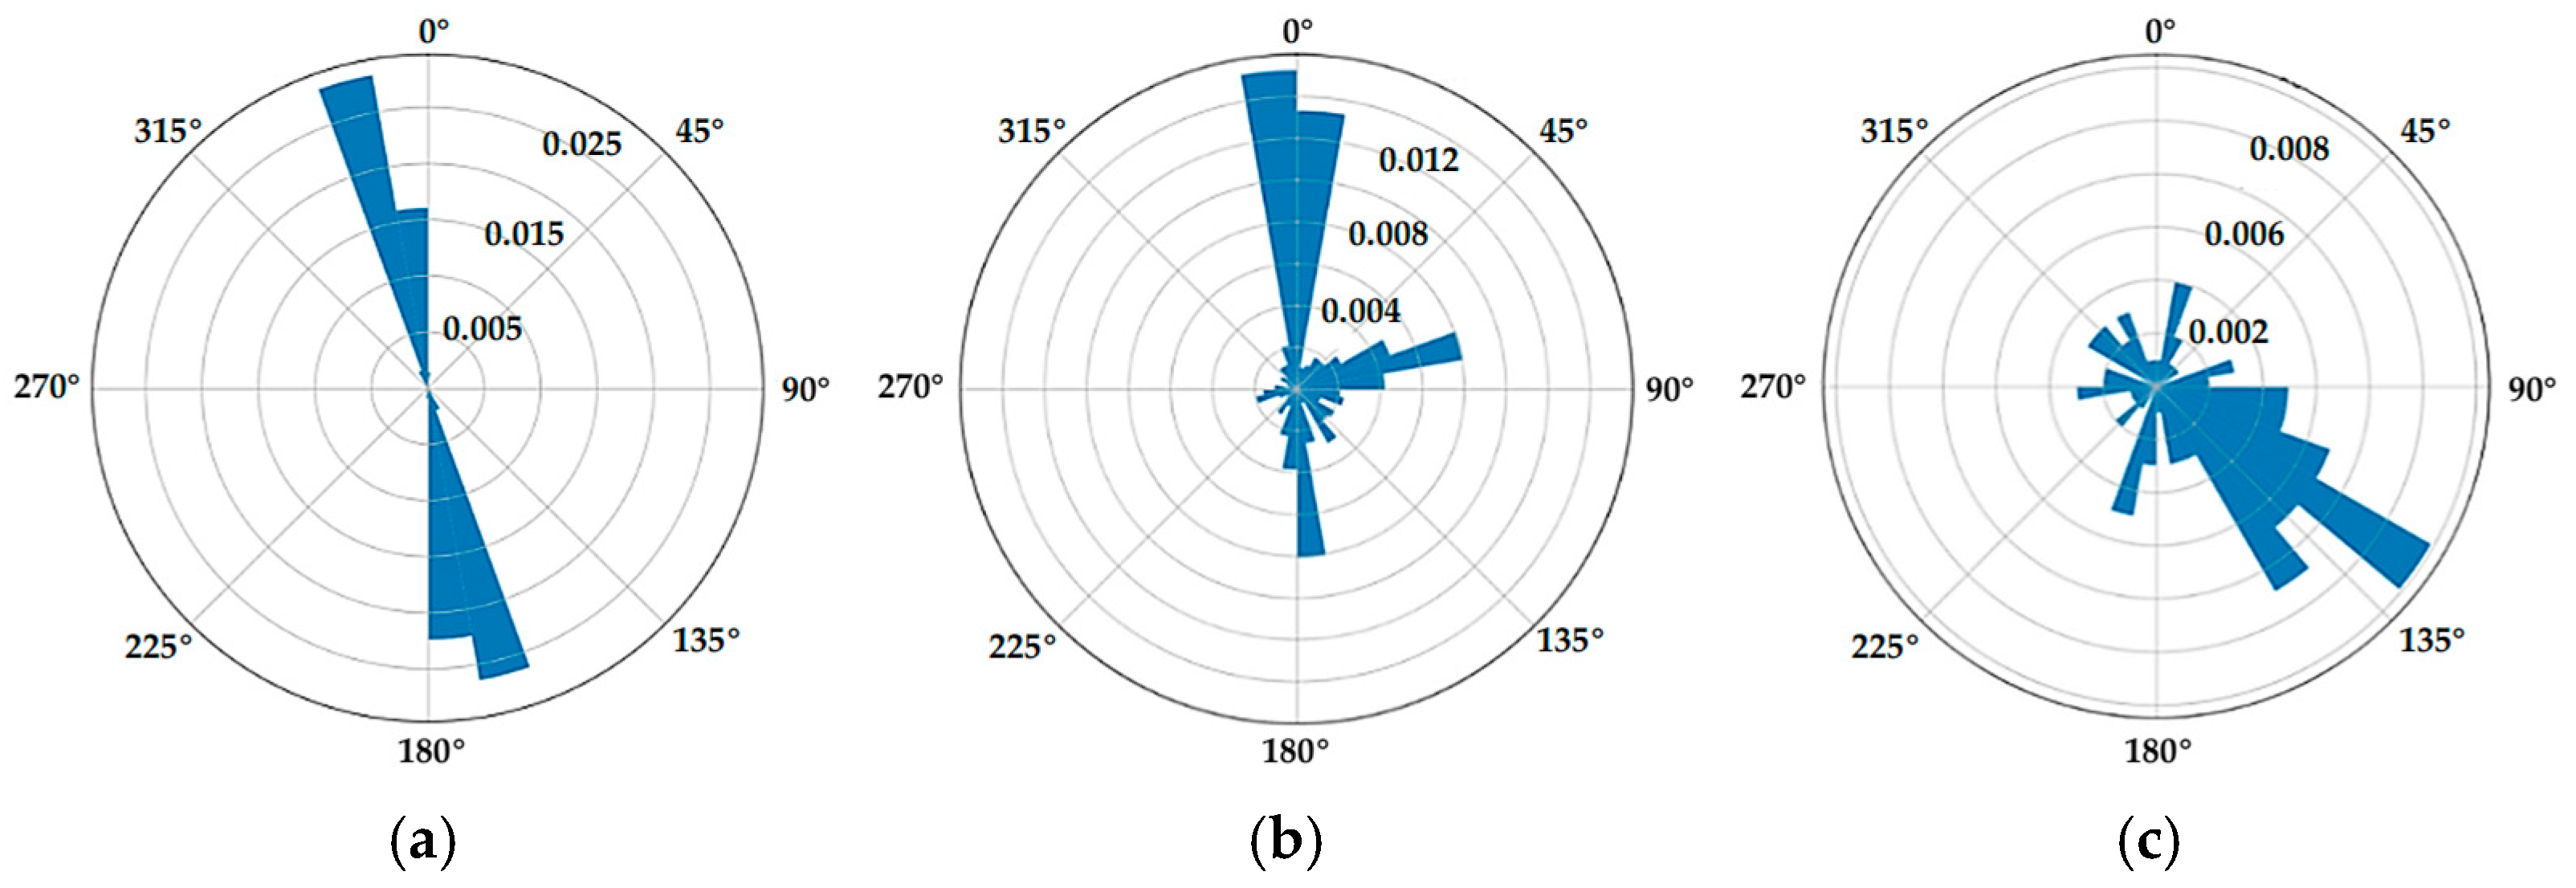
In this paper, the trajectory direction is defined as the average moving direction of the trajectory points in a certain spatial neighborhood. When calculating the direction of trajectory points, as shown in Figure 4, among the consecutive trajectory points A, B, and C, the trajectory direction of point B is defined as the average direction of two direction vectors, namely and . Figure 5 shows the statistical distribution of the directions of the trajectory points in different pedestrian road network structures. It can be found that the distribution patterns of the directions of the trajectory points in different road structures are as follows: (1) At the road segment, the directions of the trajectory points show two main direction clusters. (2) In the intersection area, the directions of the trajectory points show multiple main direction clusters. (3) In the pedestrian area, the directions of the trajectory points are chaotic, and a large number of trajectory points are difficult to cluster into high-density direction clusters. Based on the above analysis, to quickly identify intersections and pedestrian areas from massive trajectory data, this paper divides the research area into different grid cells and identifies the distribution patterns of the trajectory movements in each grid to determine whether the grid cell belongs to an intersection area, a pedestrian area, or a road segment. Considering the average width of the road in the outdoor scene, through multiple experiments, this paper sets the grid cell size to 30 m × 30 m. Furthermore, to identify road intersections and pedestrian areas, this paper proposes an improved density clustering algorithm that considers direction constraints.
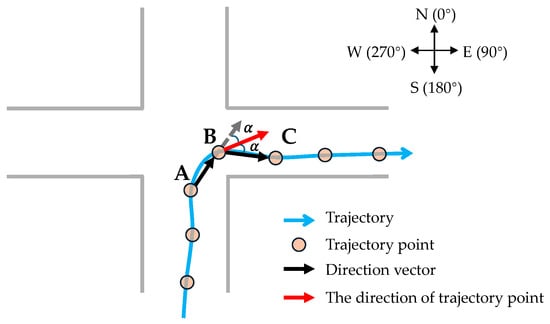
Figure 4.
Calculation of the direction of the trajectory point.
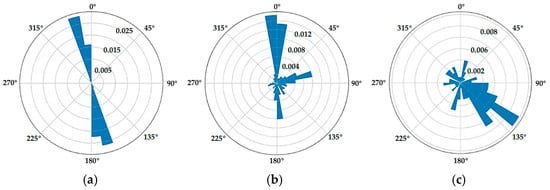
Figure 5.
Direction distribution of trajectory points in different regions of a pedestrian road network: (a) trajectory point direction distribution on a road segment; (b) trajectory point direction distribution in an intersection; (c) trajectory point direction distribution in a pedestrian area.
The classic density-based spatial clustering algorithm, such as the DBSCAN (density-based spatial clustering of applications with noise) algorithm [24], is relatively sensitive to the setting of the density threshold parameter (denoted as ). Due to the heterogeneity of the spatial distribution of the trajectory data, it is difficult to apply a globally unified density threshold parameter to grid cells with different densities. Therefore, this paper proposes an improved DBSCAN clustering method that considers direction constraints. This algorithm is based on an improved DBSCAN clustering method with direction density constraints. By analyzing the spatial distribution and movement direction characteristics of pedestrian trajectory points, the area is divided into 30 m × 30 m grids. First, the movement trends before and after the trajectory points are integrated to calculate the direction vectors of the trajectory points. Subsequently, angle-constrained clustering is carried out within the grids. And the clustering density parameter is dynamically adjusted. Finally, roads, intersections, and pedestrian areas are automatically identified according to the clustering characteristics. This method clusters the trajectory points not only considering the spatial proximity of the trajectory points but also considering the direction similarity between the trajectory points. The appropriate density threshold parameter is estimated according to the distribution density of the trajectory points in different grid units, and the calculation formula is as follows:
where c is a coefficient, Ni is the number of trajectory points in the i-th grid, and a is the number of trajectory points in the minimum cluster. Based on cross-validation analysis, in the experiments of this paper, the parameter c is set to 0.1, and a is set to 4.
At the same time, in order to solve the problems of setting the angle similarity threshold parameter in the DBSCAN clustering algorithm, this paper estimates the prior accuracy of the existing trajectory data. A certain number of low-density and high-density road segments, road intersections, and pedestrian area grid cells are randomly selected (as shown in Figure 6), and the distribution characteristics of the angle directions of the trajectory points in each type of grid are calculated (as shown in Figure 4), and the angle similarity threshold is estimated. In the experiments of this paper, the parameter is set to 30°.
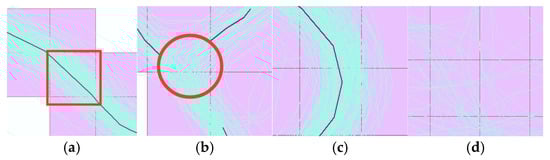
Figure 6.
Selected sample grids of different regions: (a) road segment grid; (b) intersection grid; (c) turning road grid; (d) pedestrian area grid.
According to the above parameter settings, this paper uses the DBSCAN clustering algorithm which considers direction similarity to cluster the trajectory points in each grid cell, obtains the main distribution directions of the trajectory points in each grid cell, and identifies the road intersection and pedestrian area grid cells through the following rules:
- (a)
- If the number of trajectory point clusters in a certain grid cell is one (one-way street) or two (two-way street), the average mean square error of the direction angles of the clusters is less than 20°, the number of trajectory points in each cluster is greater than , and the number of noise points is less than , then mark the grid as a road segment area.
- (b)
- If the number of trajectory point clusters in a certain grid cell is three or more (the intersection of multiple roads), the average mean square error of the direction angles of the clusters is less than 20°, the number of trajectory points in each cluster is greater than , and the number of noise points is less than , then mark the grid as a road intersection area.
- (c)
- In other cases, mark it as a pedestrian area, where is the number of trajectory points in the -th grid; the parameter is set to 0.15. Set the number of trajectory points in the minimum cluster to 4, and represents the floor function.
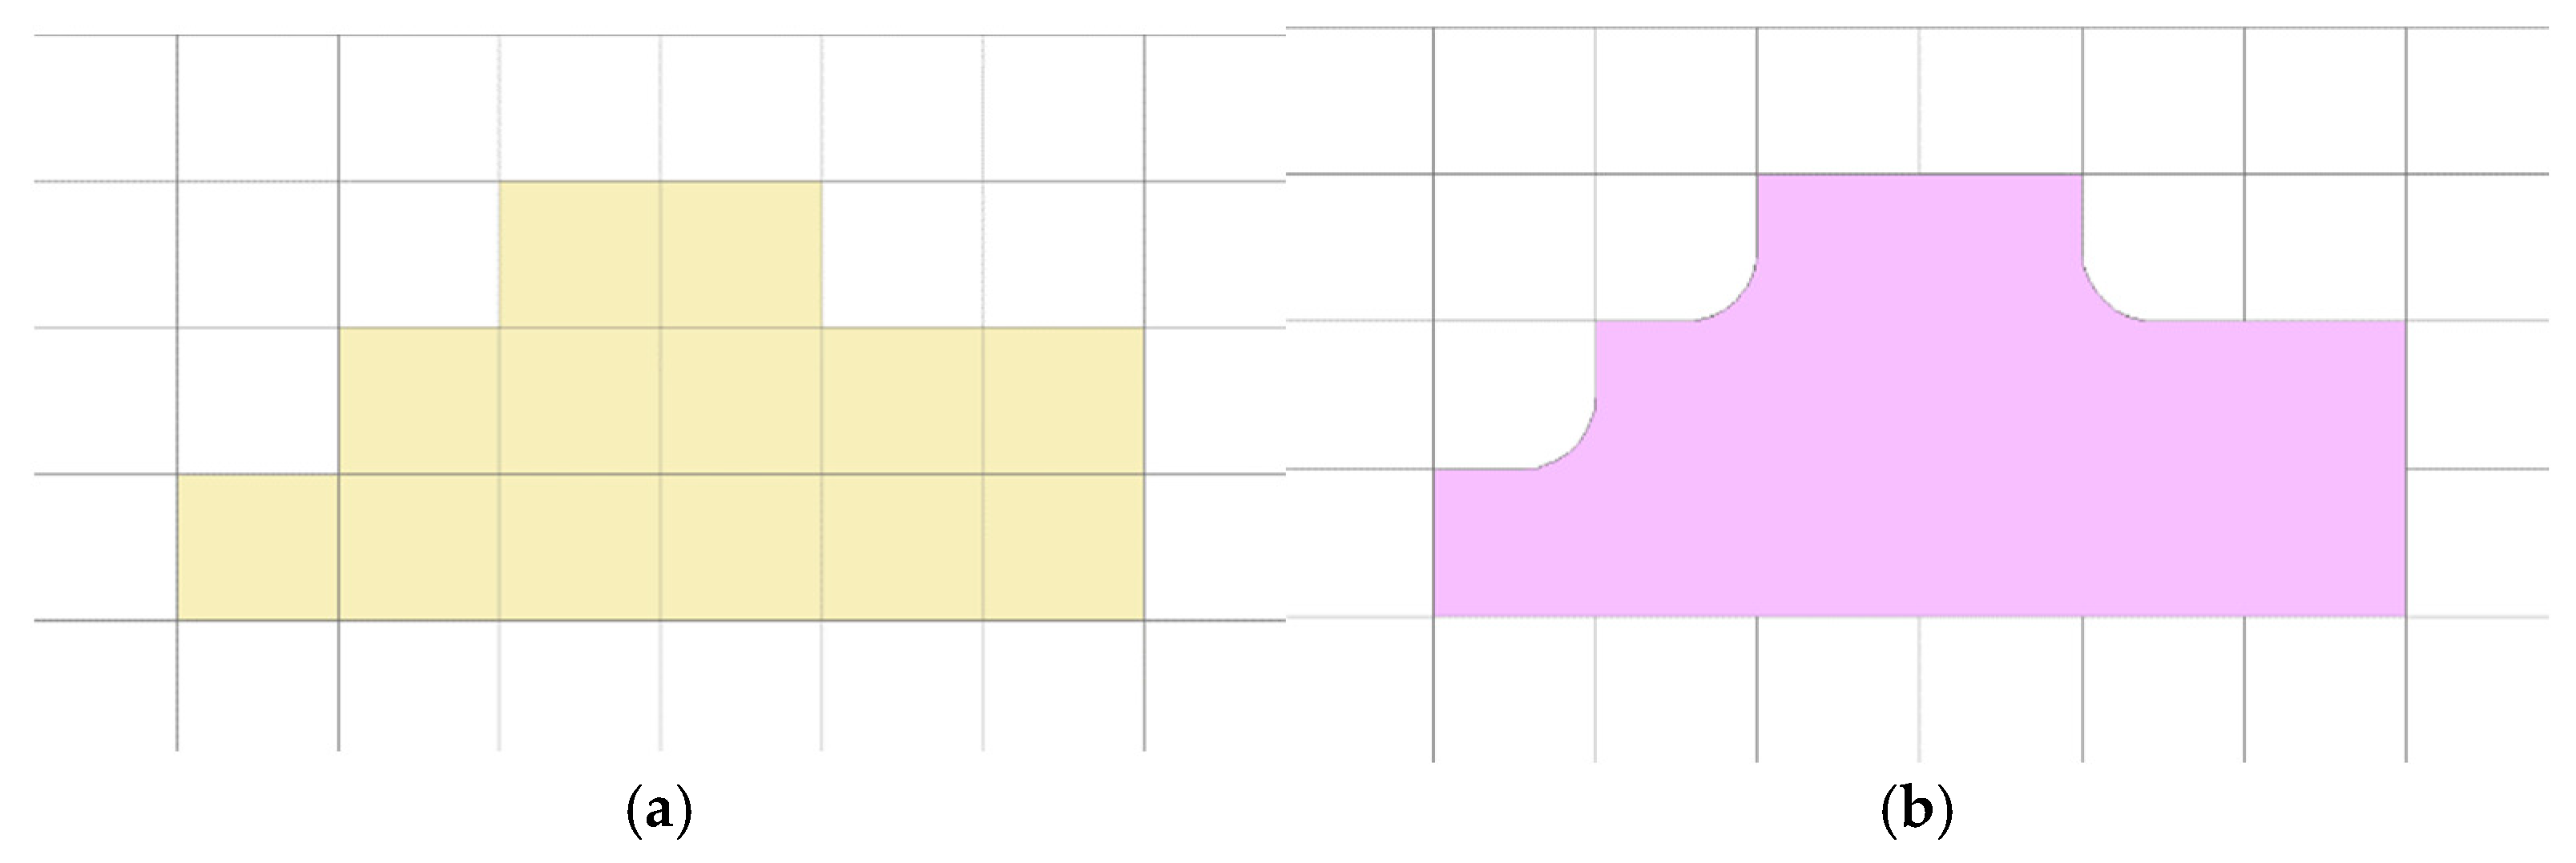
Through the above steps, the intersection areas and pedestrian areas in the research area can be identified. The spatially adjacent pedestrian area grids are merged to obtain the final identification results of pedestrian areas. As shown in Figure 7, the sharp concave corners in the boundary generated by the merging of square grid cells are further smoothed to generate the final boundary of pedestrian areas.

Figure 7.
Extraction of the pedestrian area: (a) grid of the pedestrian area; (b) grid merging and boundary smoothing.
2.3. Hierarchical Extraction of the 3D Pedestrian Road Network Structure
Compared with the vehicle road network, the structures of road intersections and pedestrian areas in outdoor scenarios are more complex. To extract an outdoor pedestrian navigation road network with an accurate structure, refined modeling of intersections and pedestrian areas is a crucial step. Based on the identification results of road intersections and pedestrian areas in Section 2.2, a hierarchical modeling strategy is adopted. Firstly, the scope of the road intersection is identified; then, the entrance and exit points of the road intersection are extracted. Furthermore, based on the entrance and exit points of the road intersection, the trajectory data connecting these points inside the intersection are extracted, and the road structure information inside the intersection is extracted through the trajectory clustering and curve fitting algorithm. Then, the trajectory data connecting the entrance and exit points of the intersections between intersections and pedestrian areas are extracted to extract the three-dimensional structure information of the road segments. Finally, the road structure information inside the road intersections, the pedestrian areas, and the road segments connecting the intersections and pedestrian areas is fused to obtain the complete three-dimensional pedestrian navigation road network data.
Based on the road intersection grid cells identified in Section 2.2, the scope, entrance and exit points, and three-dimensional structure of the road centerline of the road intersection are further finely identified. For the convenience of description, in this paper, the center point of all trajectory points in a certain grid is defined as the density center of the grid. The main steps of the 3D pedestrian road network extraction method are as follows.
- Identification of the scope of the road intersection: Based on the grid where the identified road intersection is located, further calculate the density center of the grid and merge the density centers within a certain distance threshold range. Use the minimum circumscribed circle of the grid center point as the estimation of the spatial scope of the road intersection. In the experiments of this paper, the distance threshold of the density center points is set to 5 m.
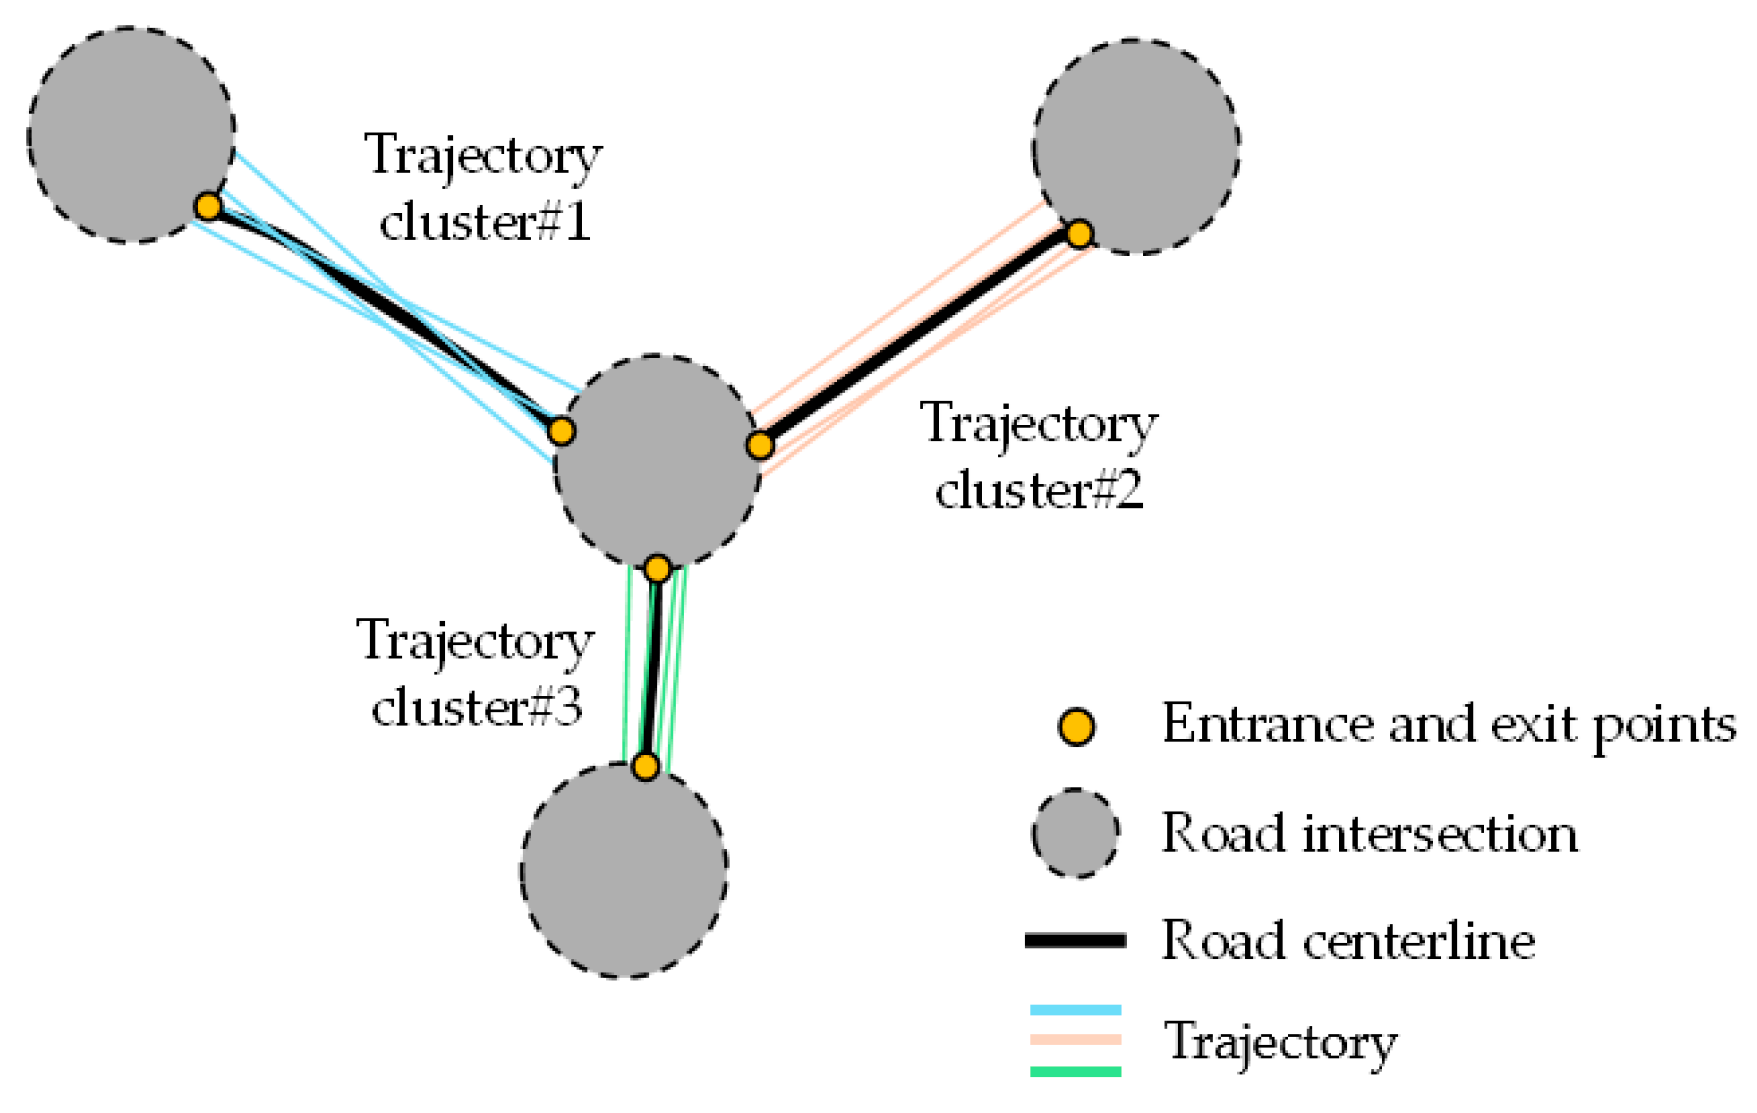
- Identification of intersection entrance and exit points: As shown in Figure 8, for the extraction of intersection entrance and exit points, first extract the trajectory data passing through the road intersection area and crop the trajectory through the boundary of the road intersection scope. Then, through a trajectory clustering method, such as the HDBSCAN-based trajectory clustering method [25], cluster the trajectories whose start and end points belong to the same road intersection into the same trajectory cluster. Calculate the intersection points of the trajectory cluster and the boundary of the road intersection scope and take the highest density point in the neighborhood as the plane position of the entrance and exit points of the road intersection. Take the average value of the elevation coordinates of a series of intersection points as the elevation value of the entrance and exit points.
- Extraction of 3D road centerline structures: Segment the trajectory data passing through the road intersection or pedestrian area. Then, use the trajectory clustering algorithm to extract the trajectory clusters between the road intersections or pedestrian areas. Finally, obtain the road centerline with curve fitting. In this paper, first pre-cluster the start and end points of the trajectory data. Then, screen the high-density trajectory clusters based on the Hausdorff distance and use the B-spline curve fitting method to fit the 3D road centerline from the screened trajectory clusters.
Topological Extraction and Optimization of the Three-dimensional Road Network: As shown in Figure 9, the automated construction of the road network mainly includes the extraction of road centerlines, the topological extraction of intersections or pedestrian areas, and the topological reconstruction of road centerlines and road intersections or pedestrian areas. In the above steps, based on the entrances and exits of intersections and the centerlines of intersection roads, all turning clusters outside the intersections can be extracted. Then, by using the method of B-spline curve fitting for road centerline extraction, the road centerlines between road intersections or pedestrian areas can be generated. For the interior of intersections, the center points of intersections are first extracted. Then, the centerlines are extracted by selecting the central trajectories between the road center points and the entrances and exits, and these centerlines are smoothed to obtain the topological structure within the road intersections. Subsequently, the topological reconstruction can be carried out by connecting the road centerlines with the entrance and exit points of intersections. The topological reconstruction of the outdoor three-dimensional pedestrian navigation road network mainly includes the topological extraction of road centerlines, the topological extraction of road intersections, and the topological extraction of pedestrian areas.
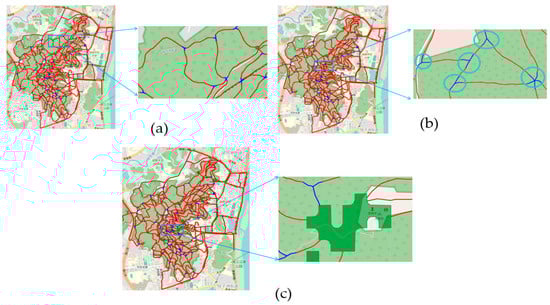
Figure 9.
The extraction principle of the entrance and exit points of road intersections: (a) topological extraction of road centerlines; (b) topological extraction of road intersections; (c) topological extraction of the pedestrian area.
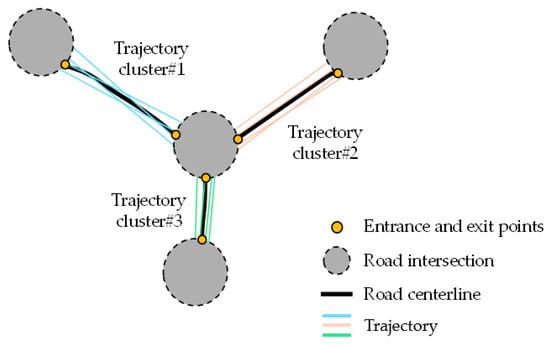
Figure 8.
Topological extraction and optimization of the three-dimensional road network.
Figure 8.
Topological extraction and optimization of the three-dimensional road network.
For the pre-clustering of trajectory data, if the regions passed by the start and end points of two trajectories are the same, then these two trajectories will be merged into the same cluster. Specifically, given the trajectory and trajectory , where and represent the start and end points of the trajectory, respectively, and the and are the regions corresponding to the start and end points of the trajectory, then the similarity of the two trajectories is defined as
The trajectories are preliminarily clustered by calculating the similarity between two trajectories; that is, the trajectories whose start or end points pass through the same road intersection or pedestrian area are aggregated.
For the initial trajectory clusters obtained from the above steps, this paper further divides them using a clustering method based on the Hausdorff distance to automatically cluster the trajectories with similar shapes and paths into one cluster. The specific steps are as follows:
In the formula, represents the three-dimensional Euclidean space distance between trajectory point and trajectory point . represents the Hausdorff distance between two trajectories, namely and . If (Through iterative testing, we set to 30 m with the aim of balancing the granularity of clustering and connectivity. This is because a value that is too small will fragment valid road segments, while a value that is too large will merge distinct paths.), then these two trajectories are considered to belong to the same cluster, and the trajectory clusters with less than 3 trajectories are removed, as shown in Figure 10.
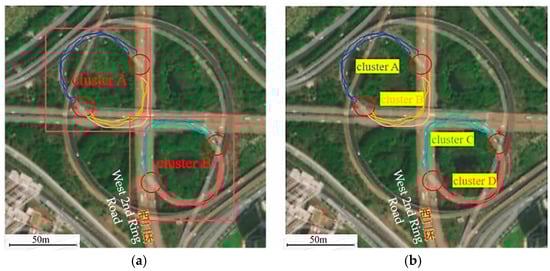
Figure 10.
Trajectory segment clustering process: (a) pre-clustering of trajectory data; (b) Hausdorff distance-based trajectory clustering.
Furthermore, based on the obtained high-density trajectory clusters, calculate the central trajectory of the trajectory cluster, that is, the trajectory in the cluster with the minimum sum of Hausdorff distances to other trajectories. Taking the trajectory points of the central trajectory of the trajectory cluster as control points, a relatively smooth centerline is obtained by three-dimensional B-spline fitting as the centerline of the trajectory cluster, that is, the centerline of the three-dimensional road corresponding to the trajectory cluster, as shown in Figure 11.
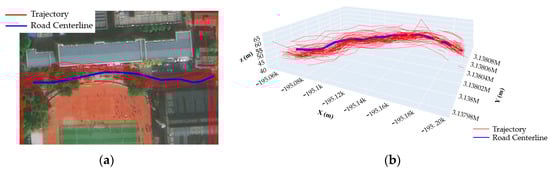
Figure 11.
Illustration of the generated 3D road centerline: (a) center trajectory extraction; (b) B-spline curve fitting result.
3. Experimental Analysis
3.1. Research Area and Experimental Data
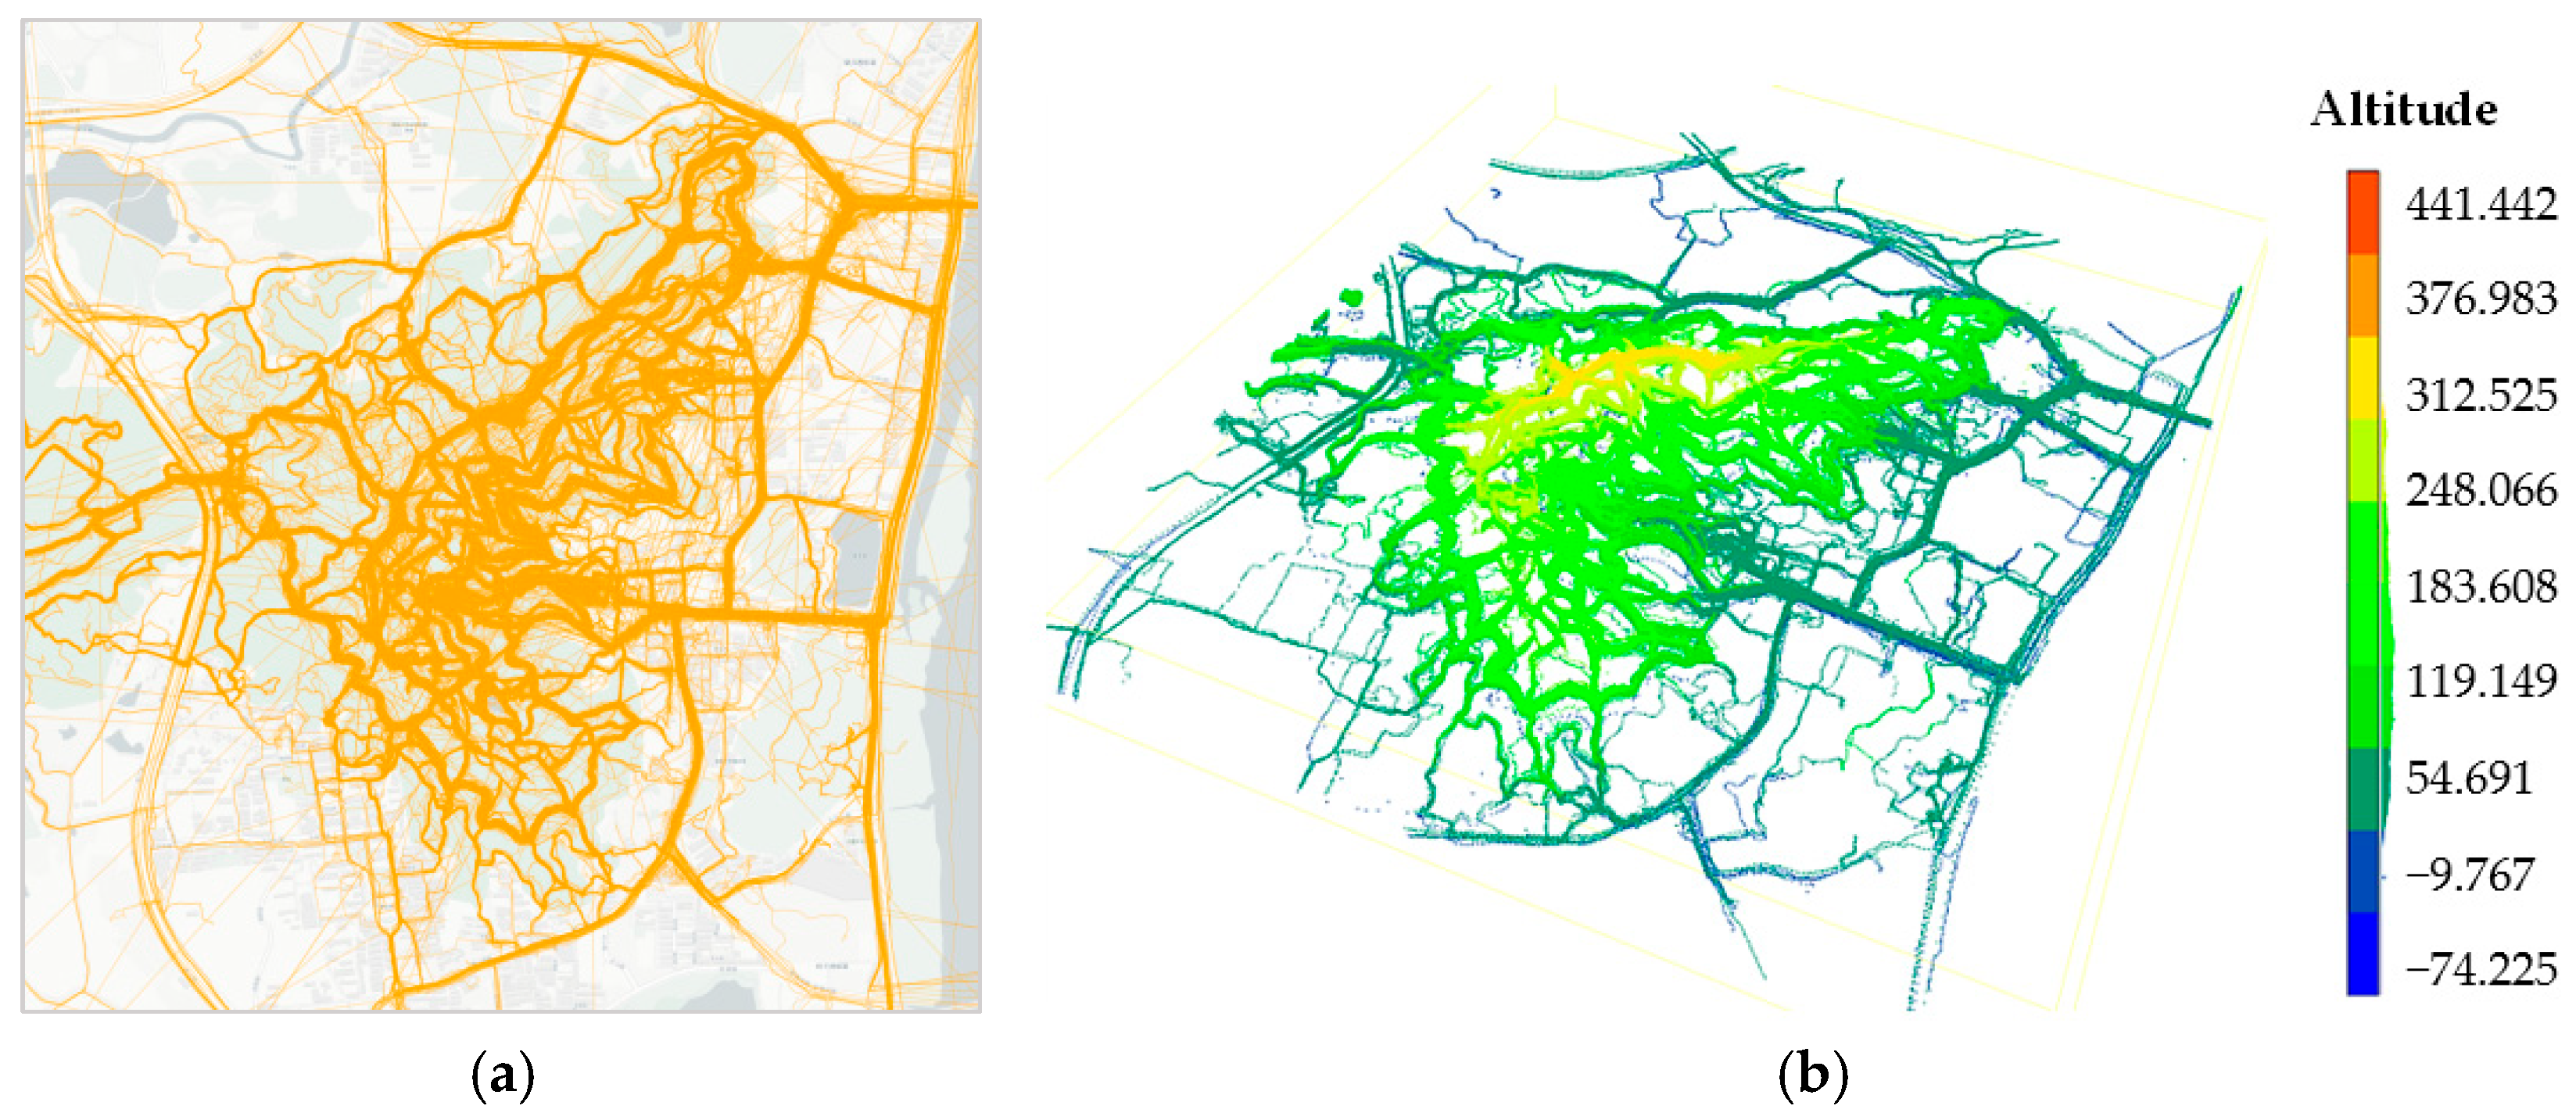
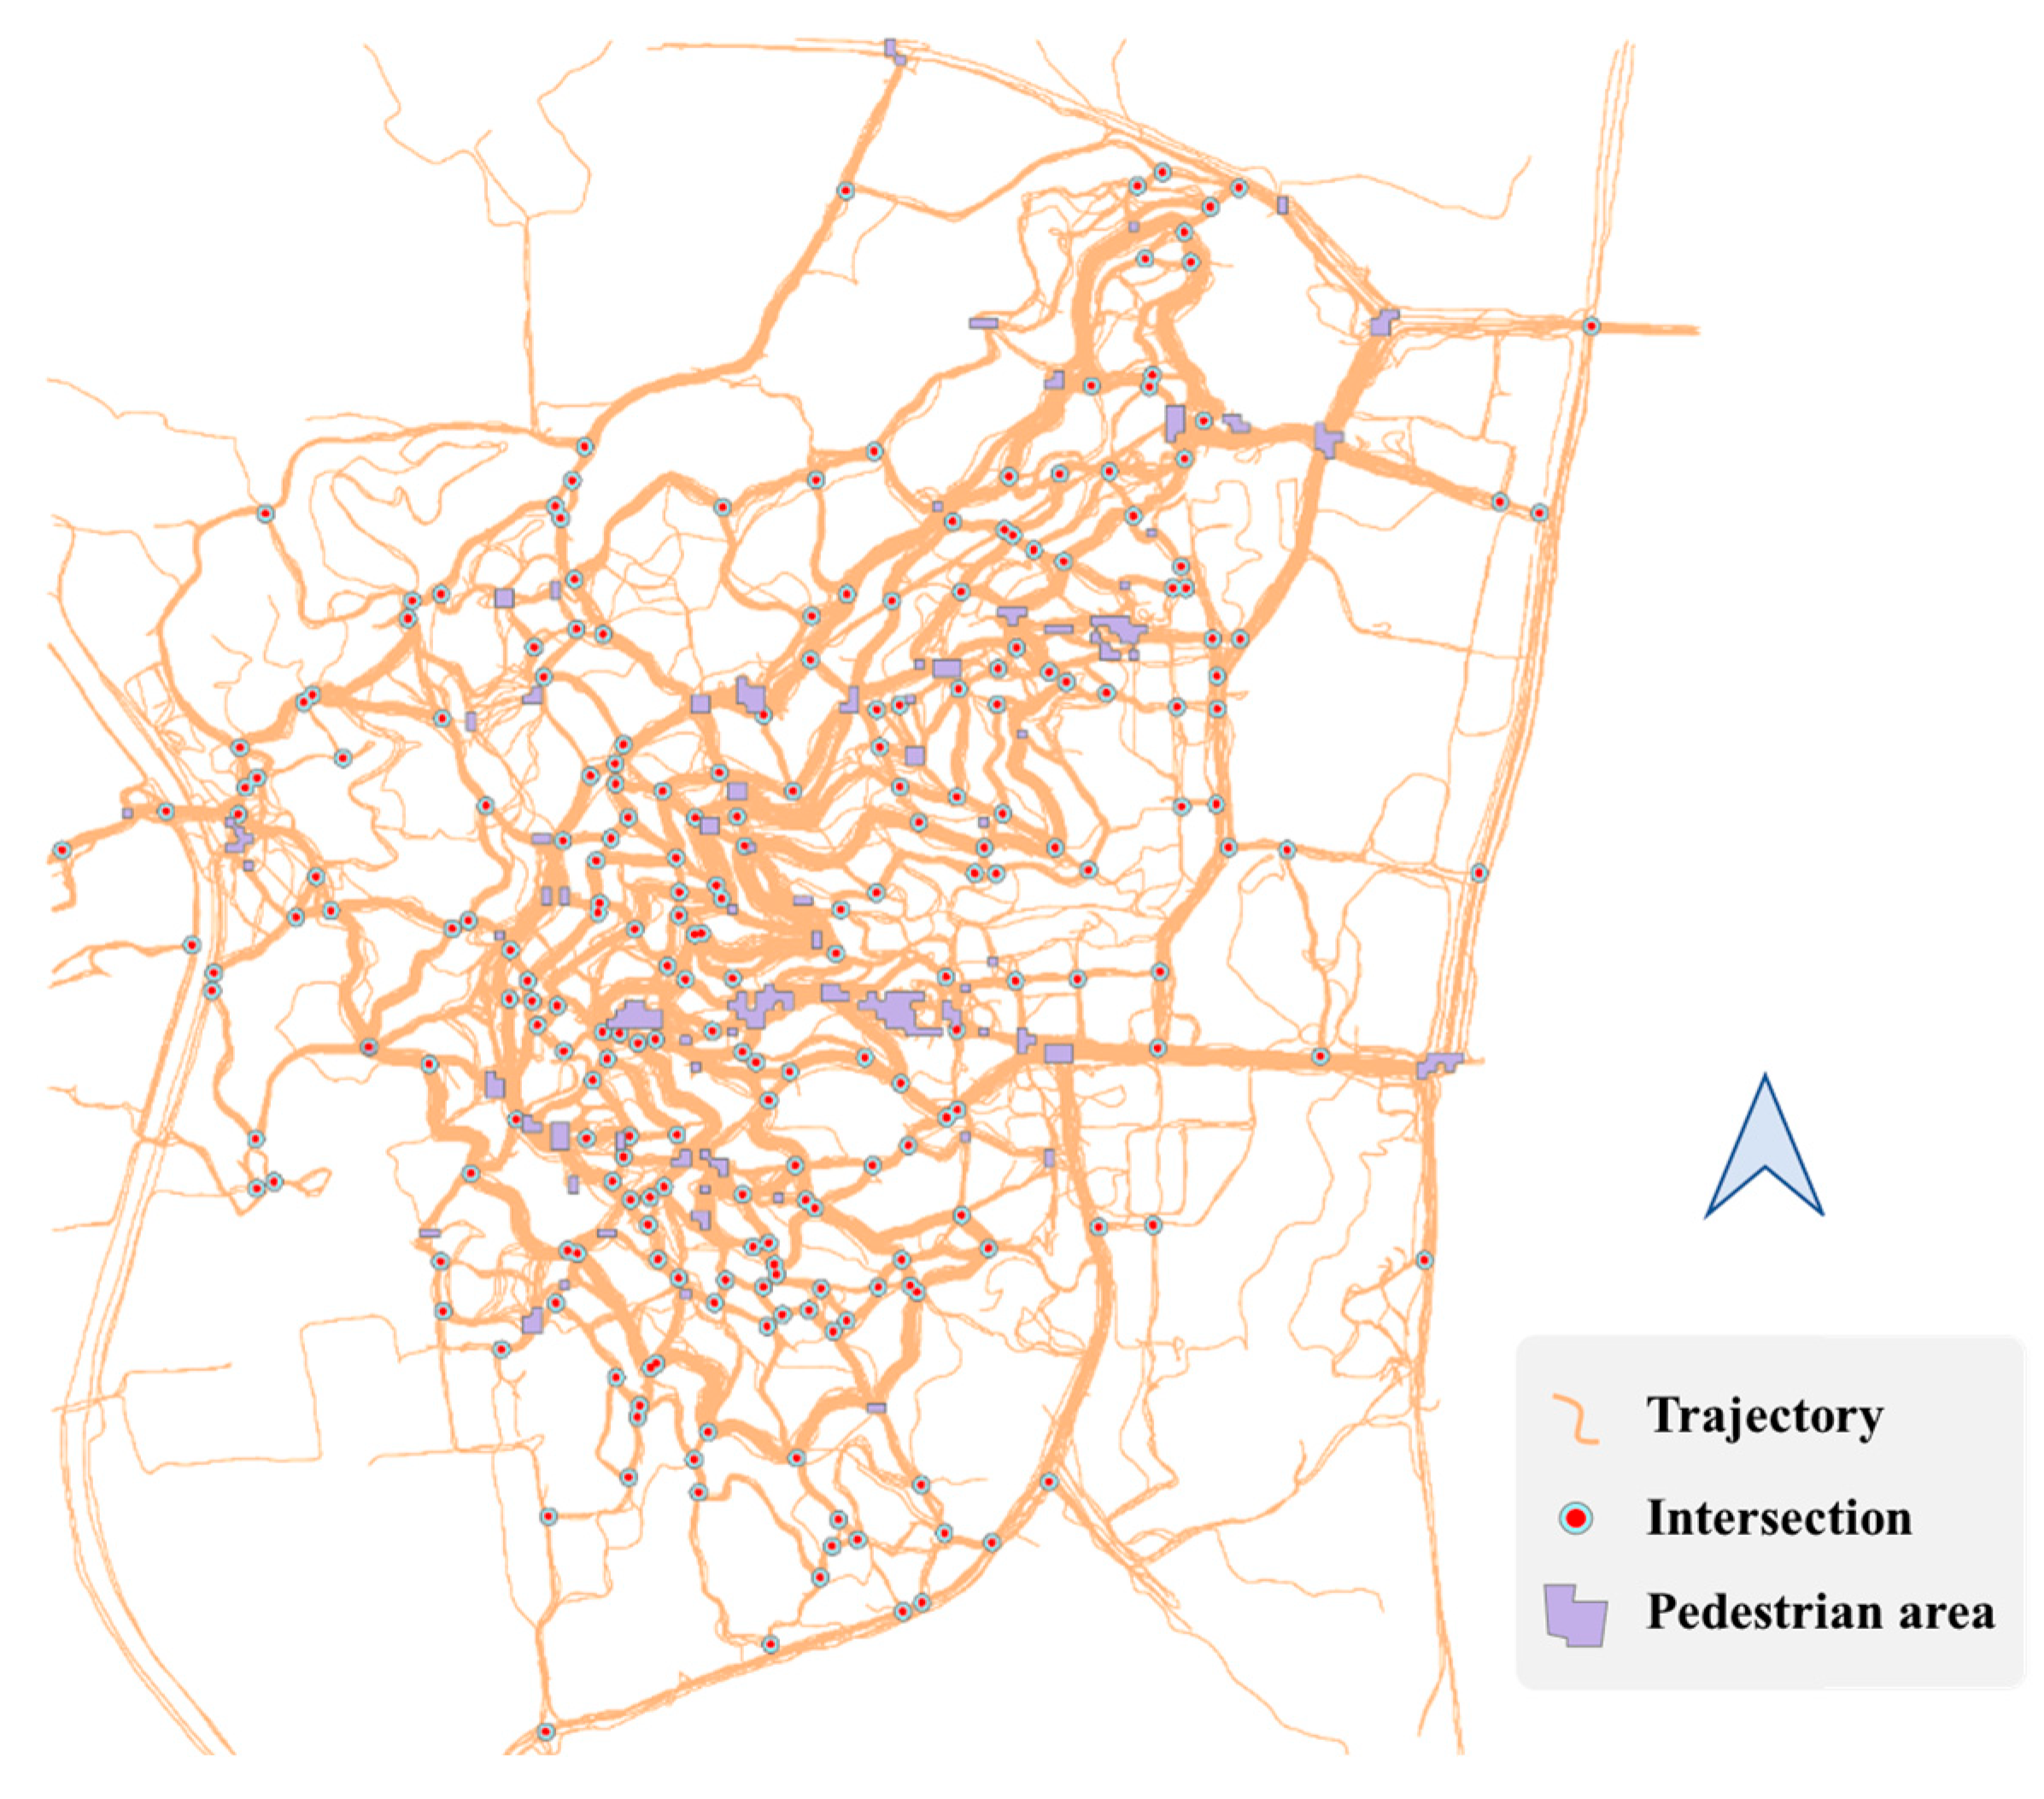
This paper selects the Yuelu Mountain Scenic Area in Changsha, Hunan Province, China, as the study area. The Yuelu Mountain area was selected due to its diverse terrain (e.g., slopes, stairs, and forest trails) and high pedestrian traffic, representing a typical yet challenging outdoor environment. While our method is optimized for such scenarios, its applicability extends to other outdoor regions (e.g., urban parks or campus pathways) by adjusting grid sizes and density thresholds based on local path widths and trajectory densities. The pedestrian trajectory data at the Yuelu Mountain Scenic Area from January 2015 to June 2023 shared by the outdoor travel applications from foooooot (https://www.foooooot.com, (accessed on 10 November 2024)) and 2bulu (https://www.2bulu.com, (accessed on 10 November 2024)) were obtained. Among them, 1985 pieces of trajectory data are from 2bulu and 1421 pieces of trajectory data are from foooooot, which are used as the research dataset of this paper. The specific range of the study area is from 112.91500° E to 112.95399° E in longitude and from 28.166° N to 28.206° N in latitude. The sampling frequency of the trajectory data is 5~10 s, and the data contain information such as user number, longitude, latitude, elevation, timestamp, and speed. There are approximately 6.2 million three-dimensional trajectory points in total, as shown in Figure 12.
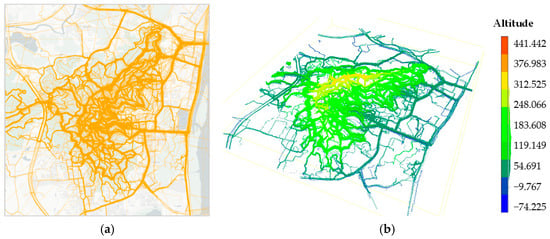
Figure 12.
Trajectory data used in our experiments: (a) experimental trajectory data (plan view); (b) experimental trajectory data (3D view).
3.2. Experimental Results and Analysis
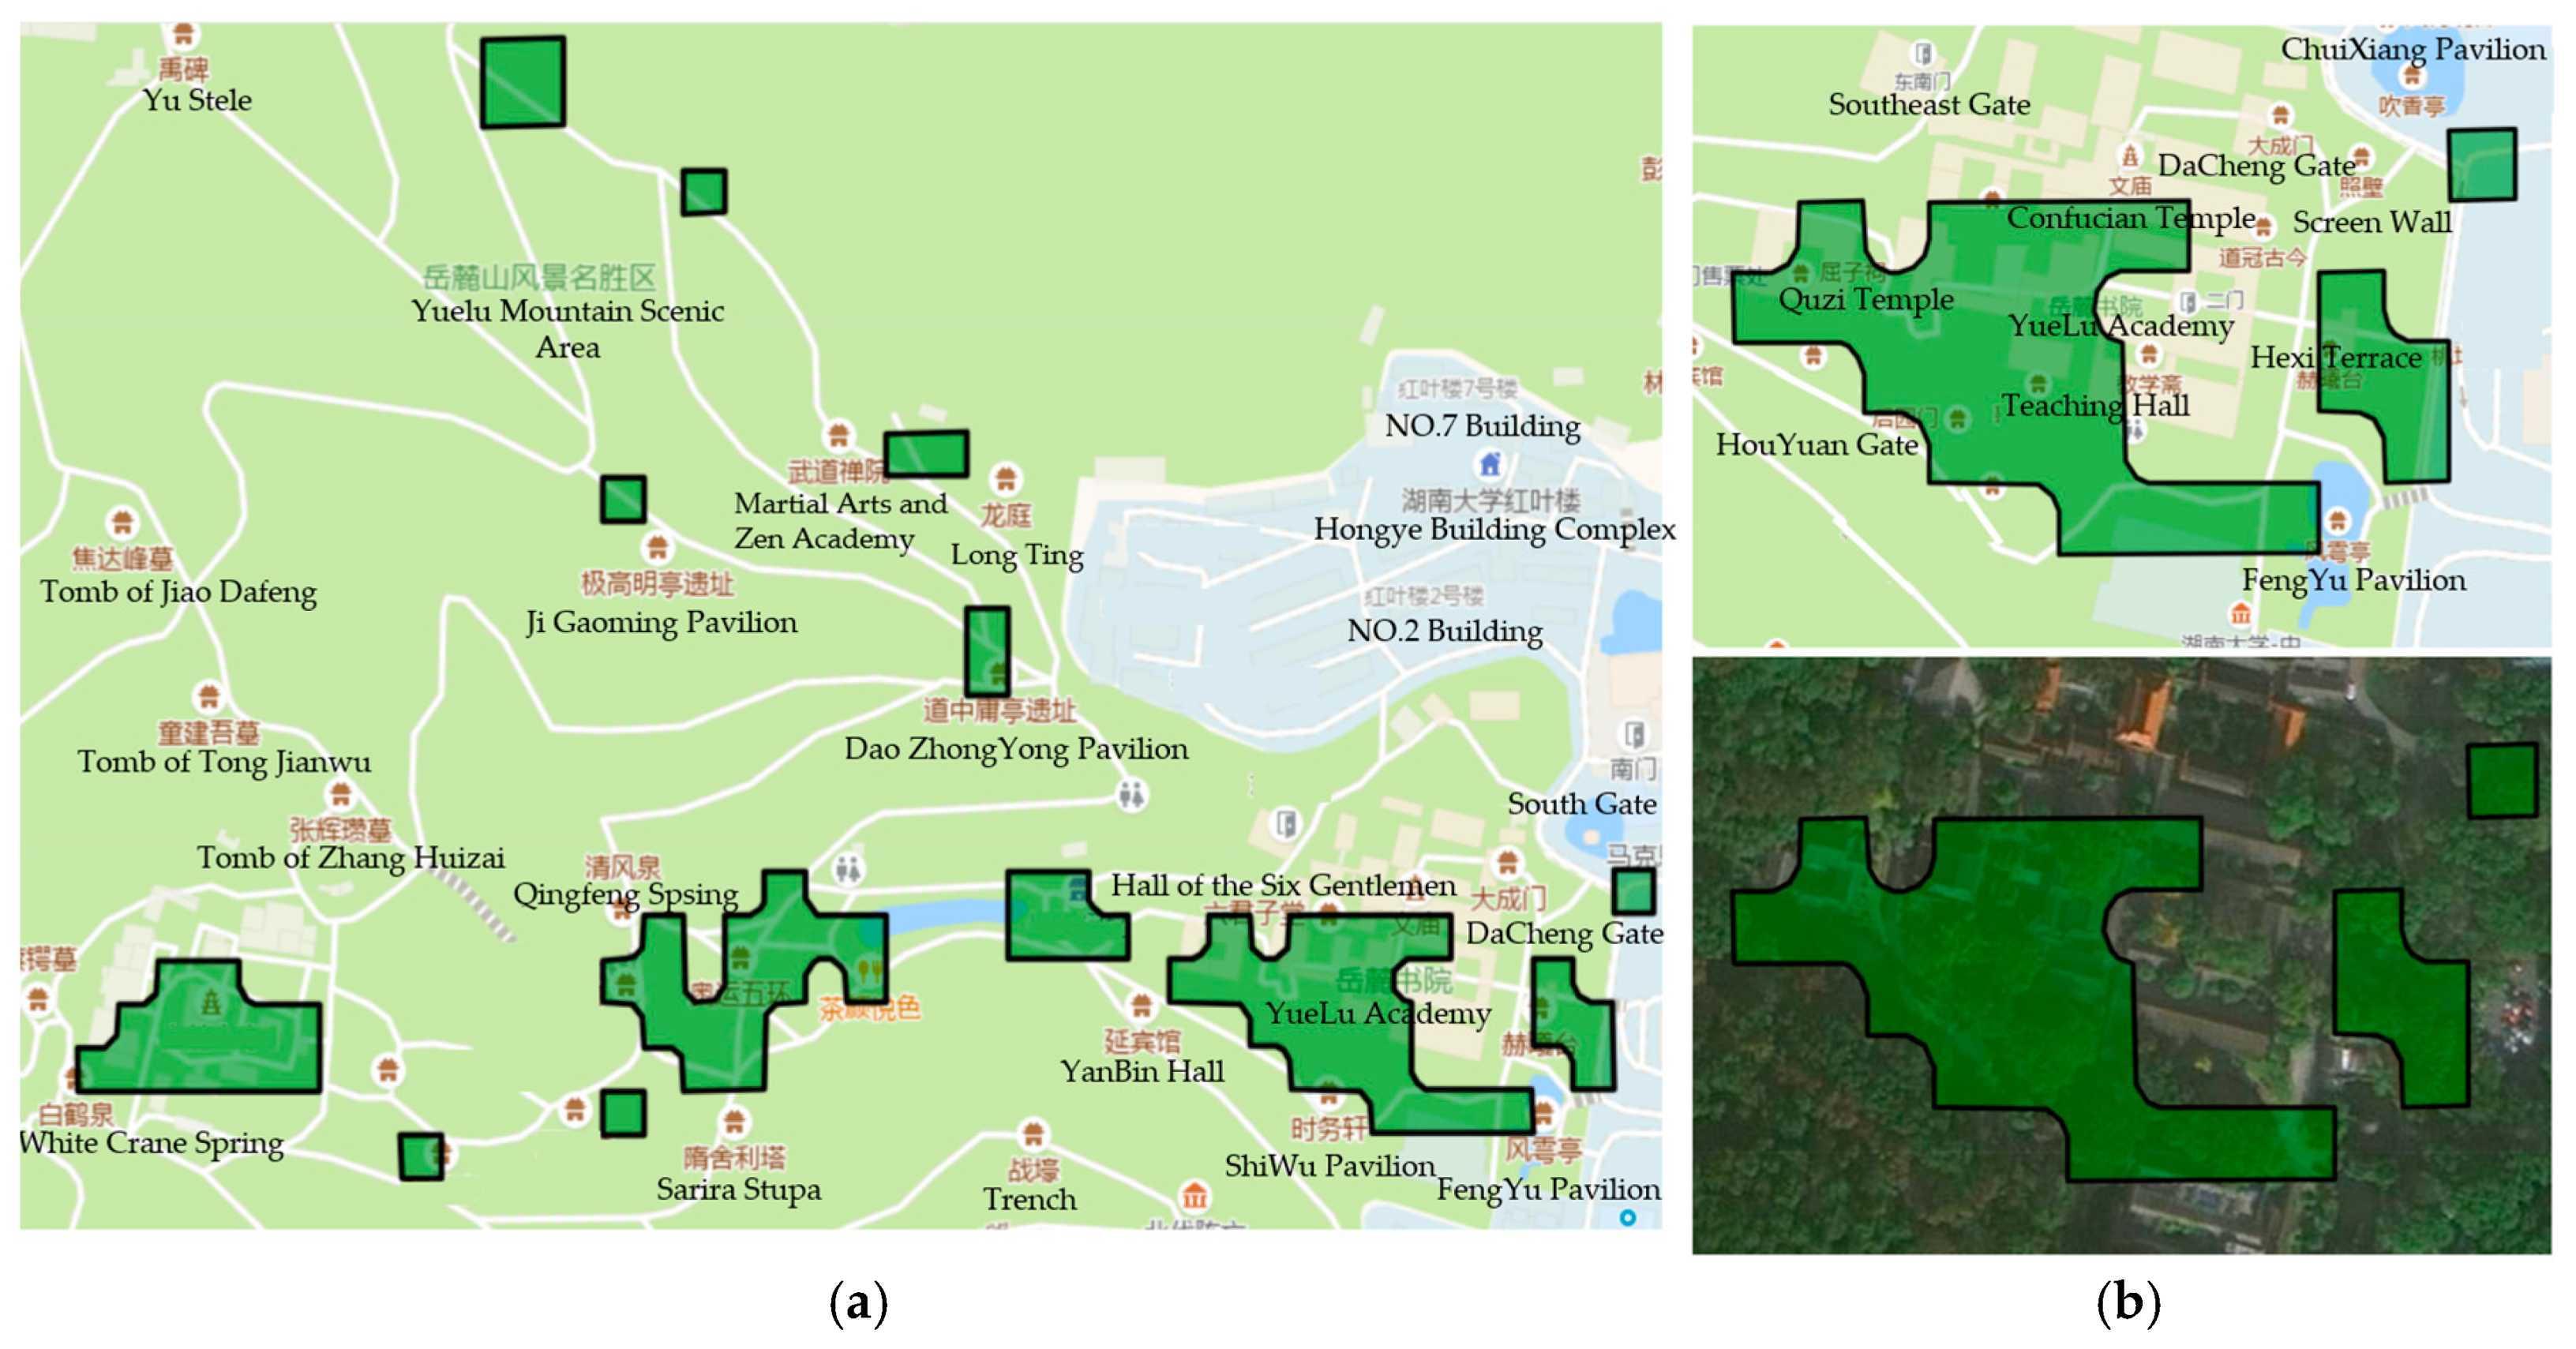
Using the outdoor pedestrian trajectory data at Yuelu Mountain for analysis, a total of 264 pedestrian area grids in the Yuelu Mountain area were identified. The results of the pedestrian area grids were visualized, as shown in Figure 13a. By observing and analyzing each pedestrian area grid, it can be found that the pedestrian areas identified by the method in this paper are mainly located at popular points of interest, buildings, squares, and popular scenic spots, such as Yuelu Academy, and also include points of interest not marked on the map. To further verify the accuracy of the method in this paper in identifying the scope of the pedestrian area, the identification results were overlaid and compared with the remote sensing image data. The results are shown in Figure 13b, indicating that the method in this paper can effectively identify the grids where the pedestrian areas are located.
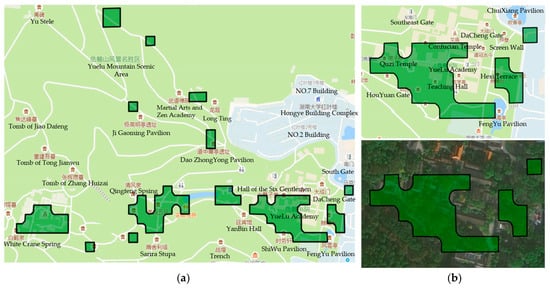
Figure 13.
Pedestrian area recognition results: (a) some recognized pedestrian areas; (b) overlay of a pedestrian area with the remote sensing image.
Based on the extraction of road intersections or pedestrian areas, the scope of the pedestrian areas and the center points of the road intersections are extracted, and the center points with a distance of less than 5 m between the center points of the road intersections are merged. (The 5 m density center threshold corresponds to the average width of pedestrian areas in our study area, ensuring that merged intersections reflect realistic spatial extents.) The final identification results of the intersections and pedestrian areas are shown in Figure 14. Considering the distribution of scenic spots and the road structure in the Yuelu Mountain Scenic Area, it can be seen from the figure that the method in this paper can better identify the road intersections and pedestrian areas in the research area.
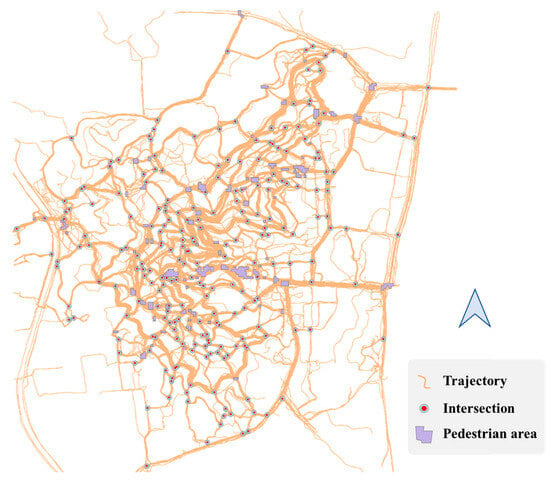
Figure 14.
Results of the identified road intersections and pedestrian areas.
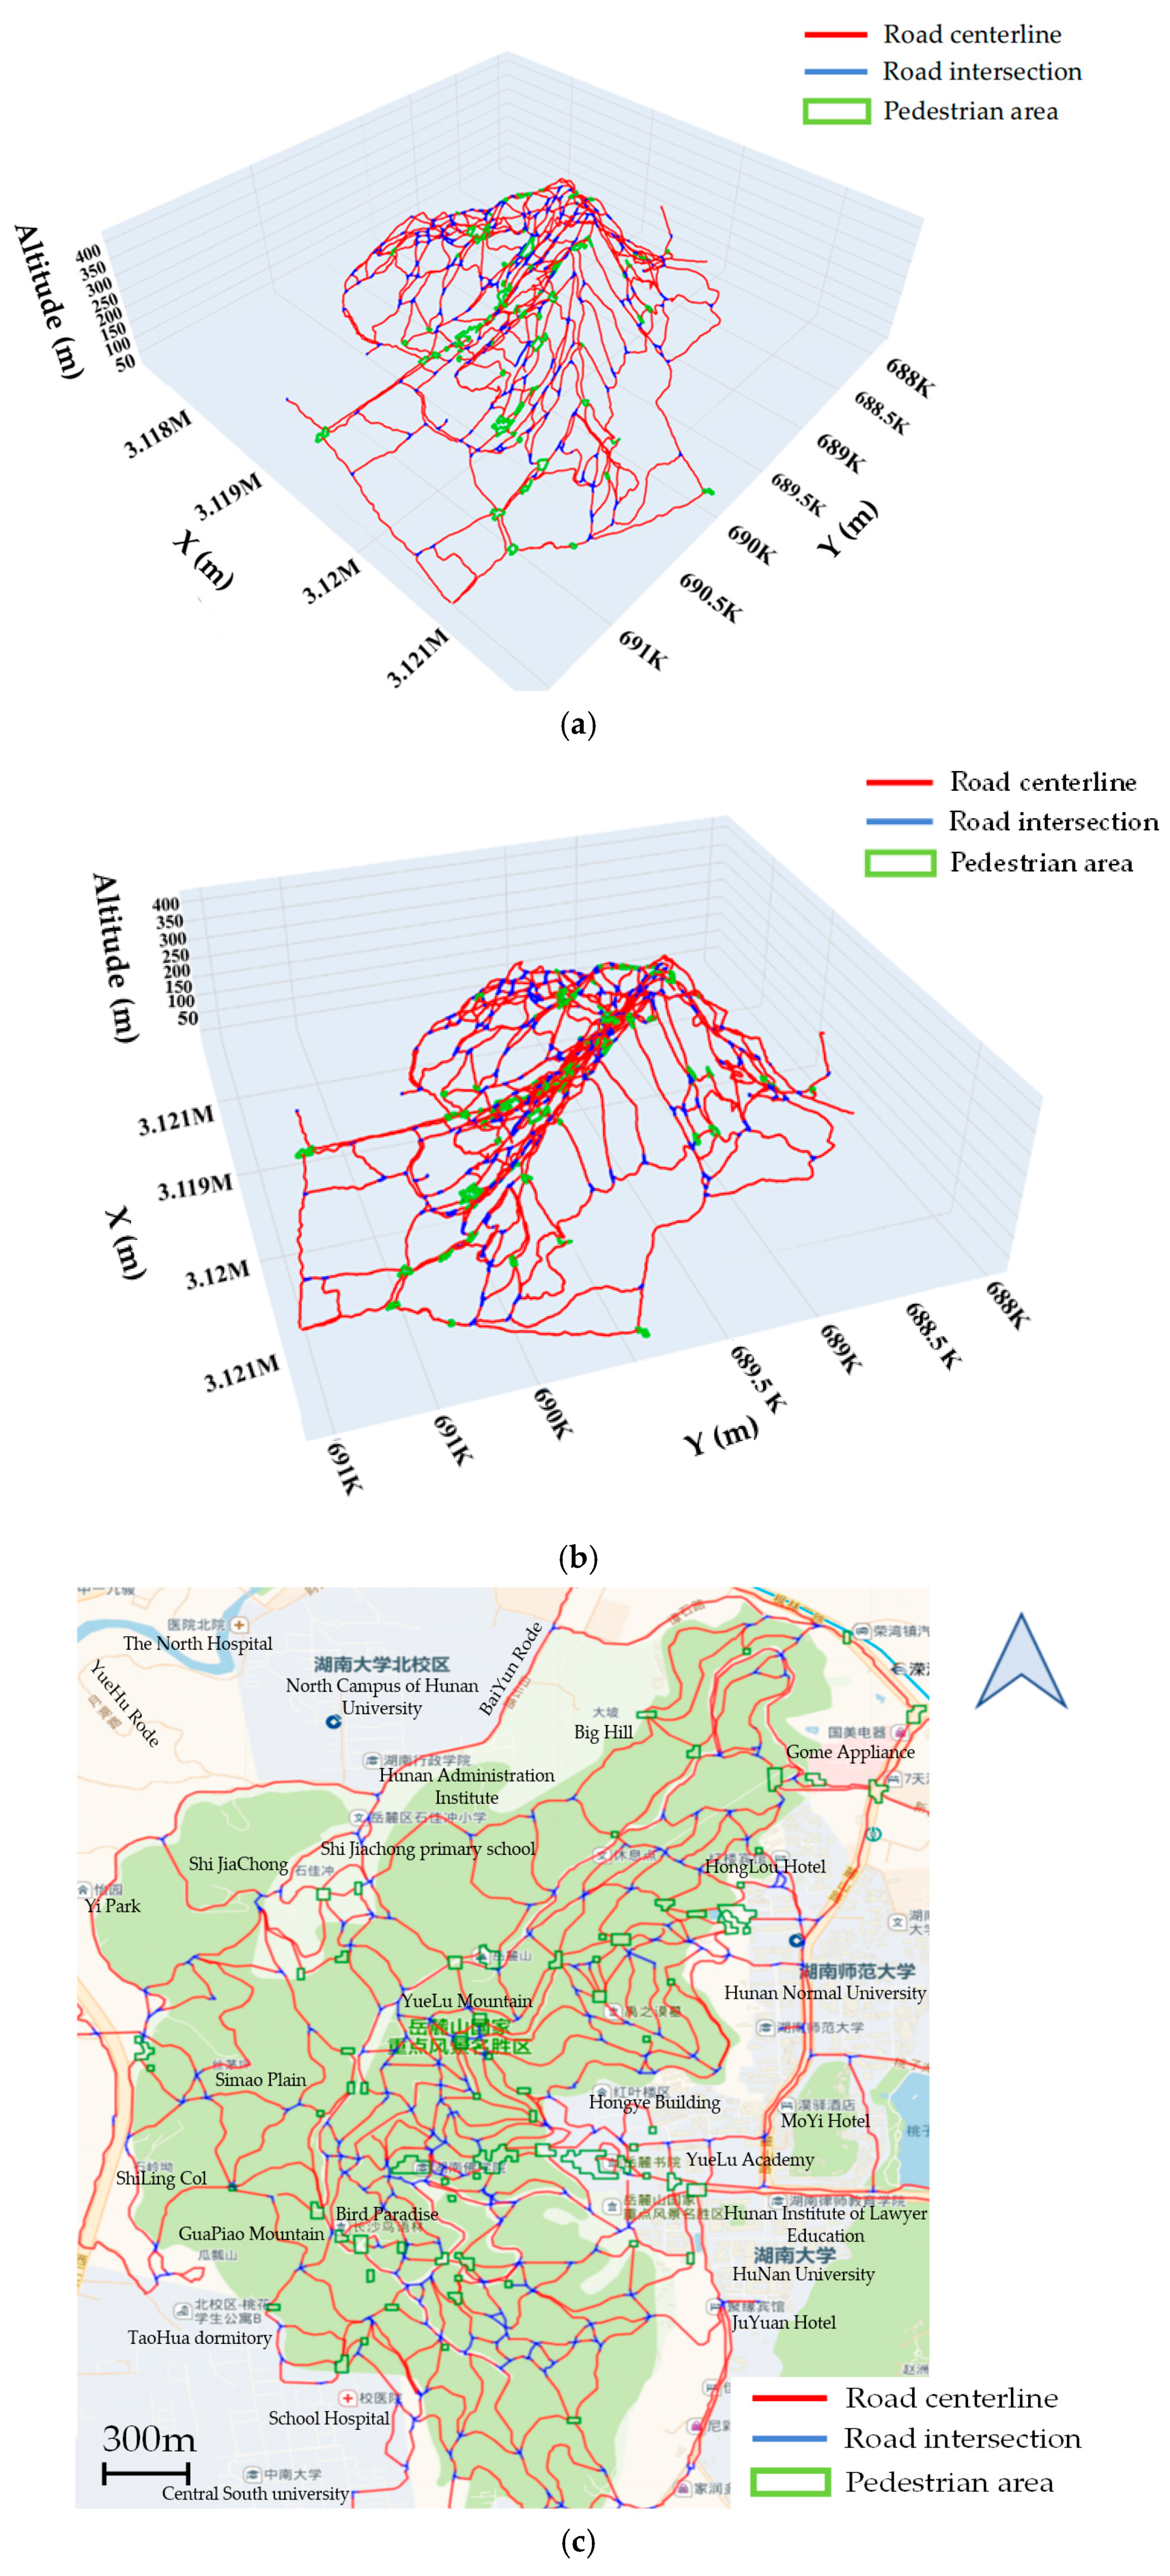
The visualization results of the three-dimensional pedestrian navigation road network extracted by the method in this paper are shown in Figure 15. In the figure, different colors and line types are used to mark the pedestrian areas, the topological structures of the road intersections, and the three-dimensional road centerlines. Among them, the road centerlines between the road intersections or the pedestrian areas are represented by red; the topological structures in the road intersections are represented by blue, and the pedestrian areas are represented by green. It can be seen from the figure that the method in this paper can extract a relatively complete three-dimensional pedestrian navigation road network in the research area, including road intersections and pedestrian areas. Compared with the current map products (such as Baidu Map and Gaode Map), in the outdoor scenario, the outdoor three-dimensional navigation road network structure information constructed by the method in this paper is more detailed and semantically richer, which can provide application support and basic data services for personalized outdoor travel navigation.
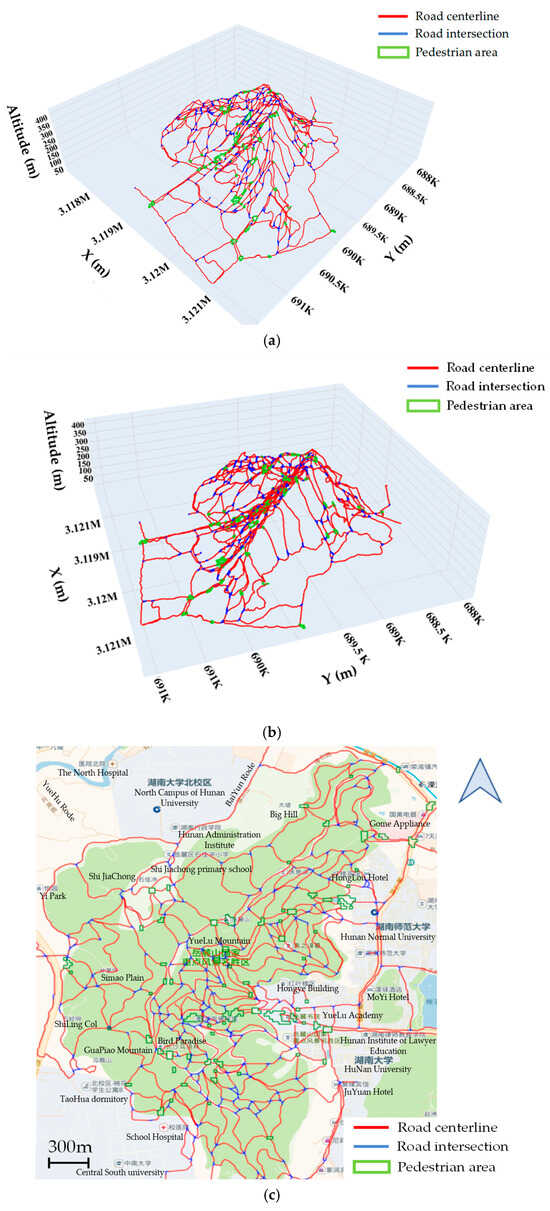
Figure 15.
Three-dimensional visualization of outdoor pedestrian navigation road network results. (a) side view A; (b) side view B; (c) top view.
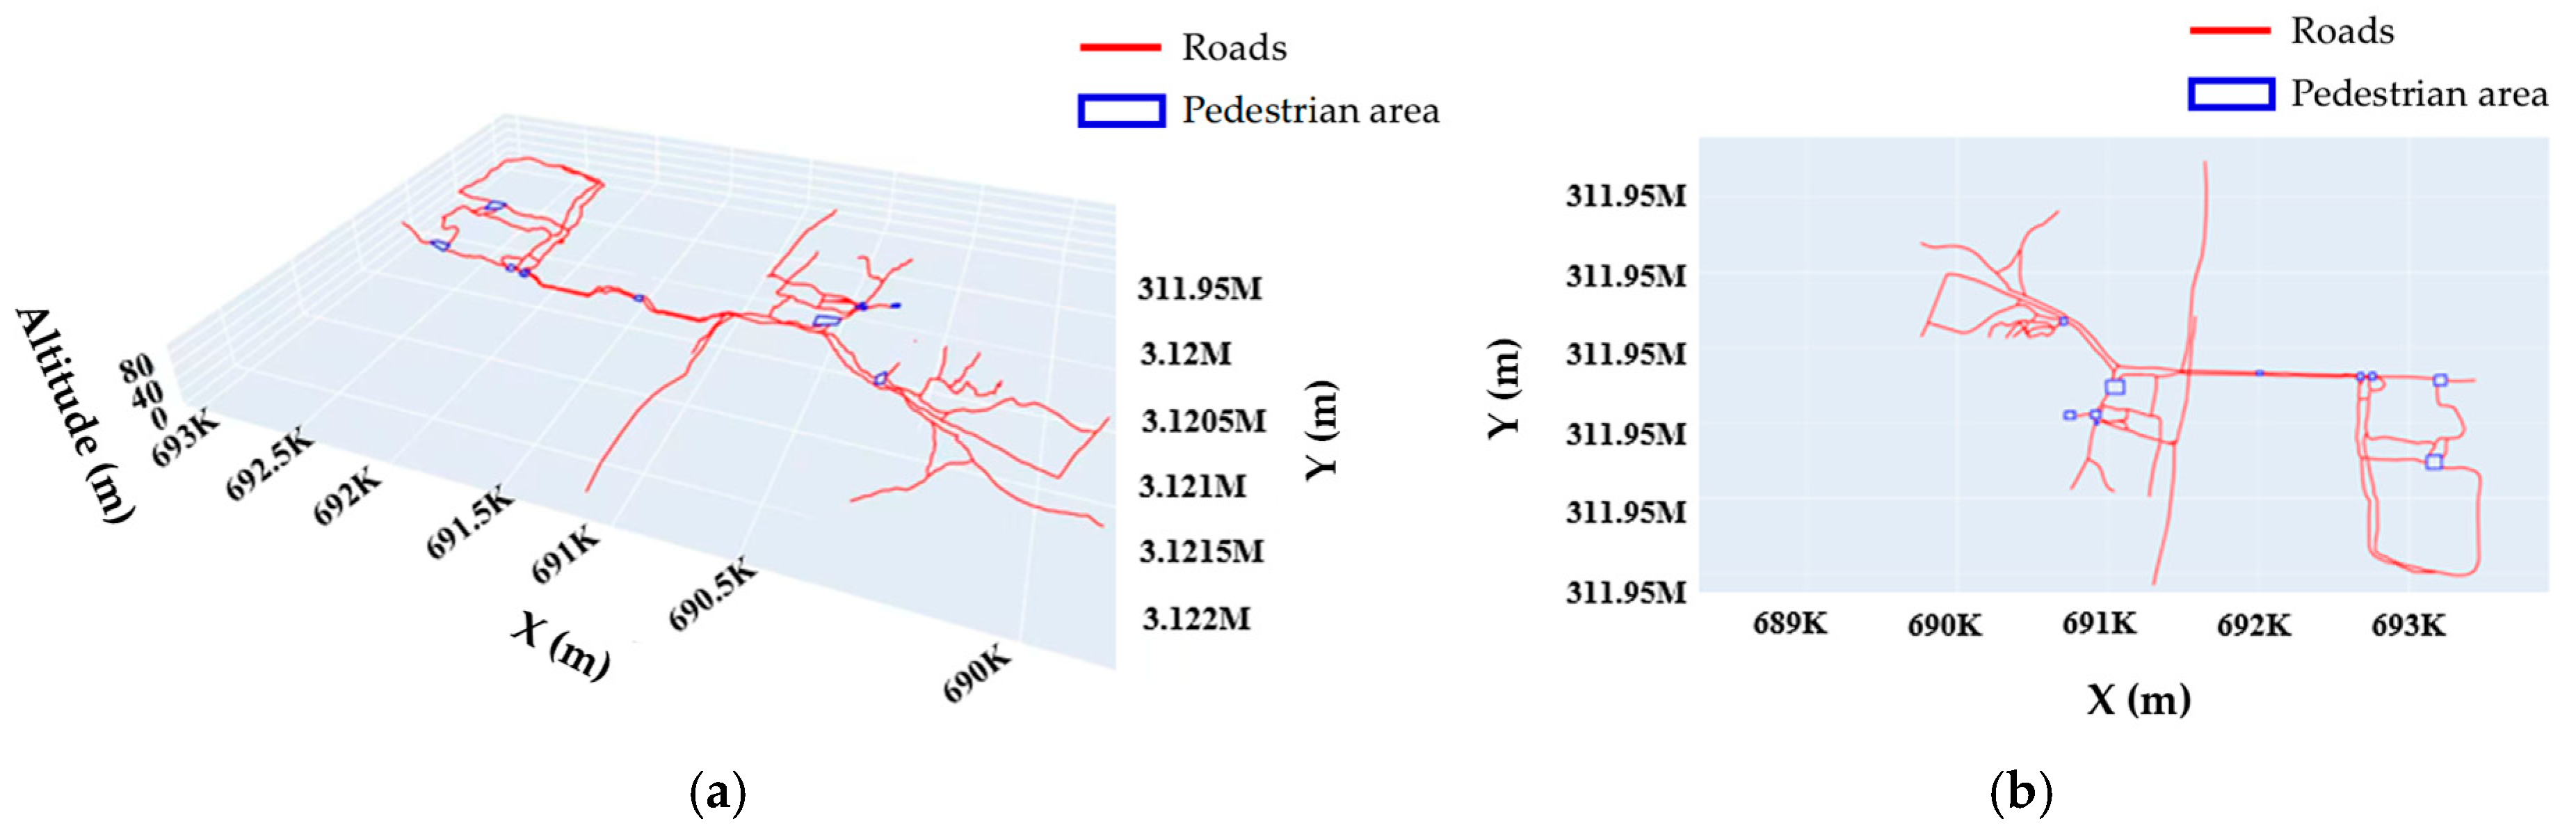
To verify the performance of the proposed method under diverse terrains, this paper obtained more trajectory data of mixed terrains (including sidewalk, communities, and streets) around Yuelu Mountain for experiments. The experimental results are shown in Figure 16.
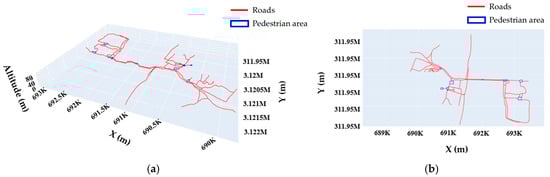
Figure 16.
Three-dimensional visualization of outdoor pedestrian navigation road network results in mixed terrain. (a) Three-dimensional view; (b) plan view.
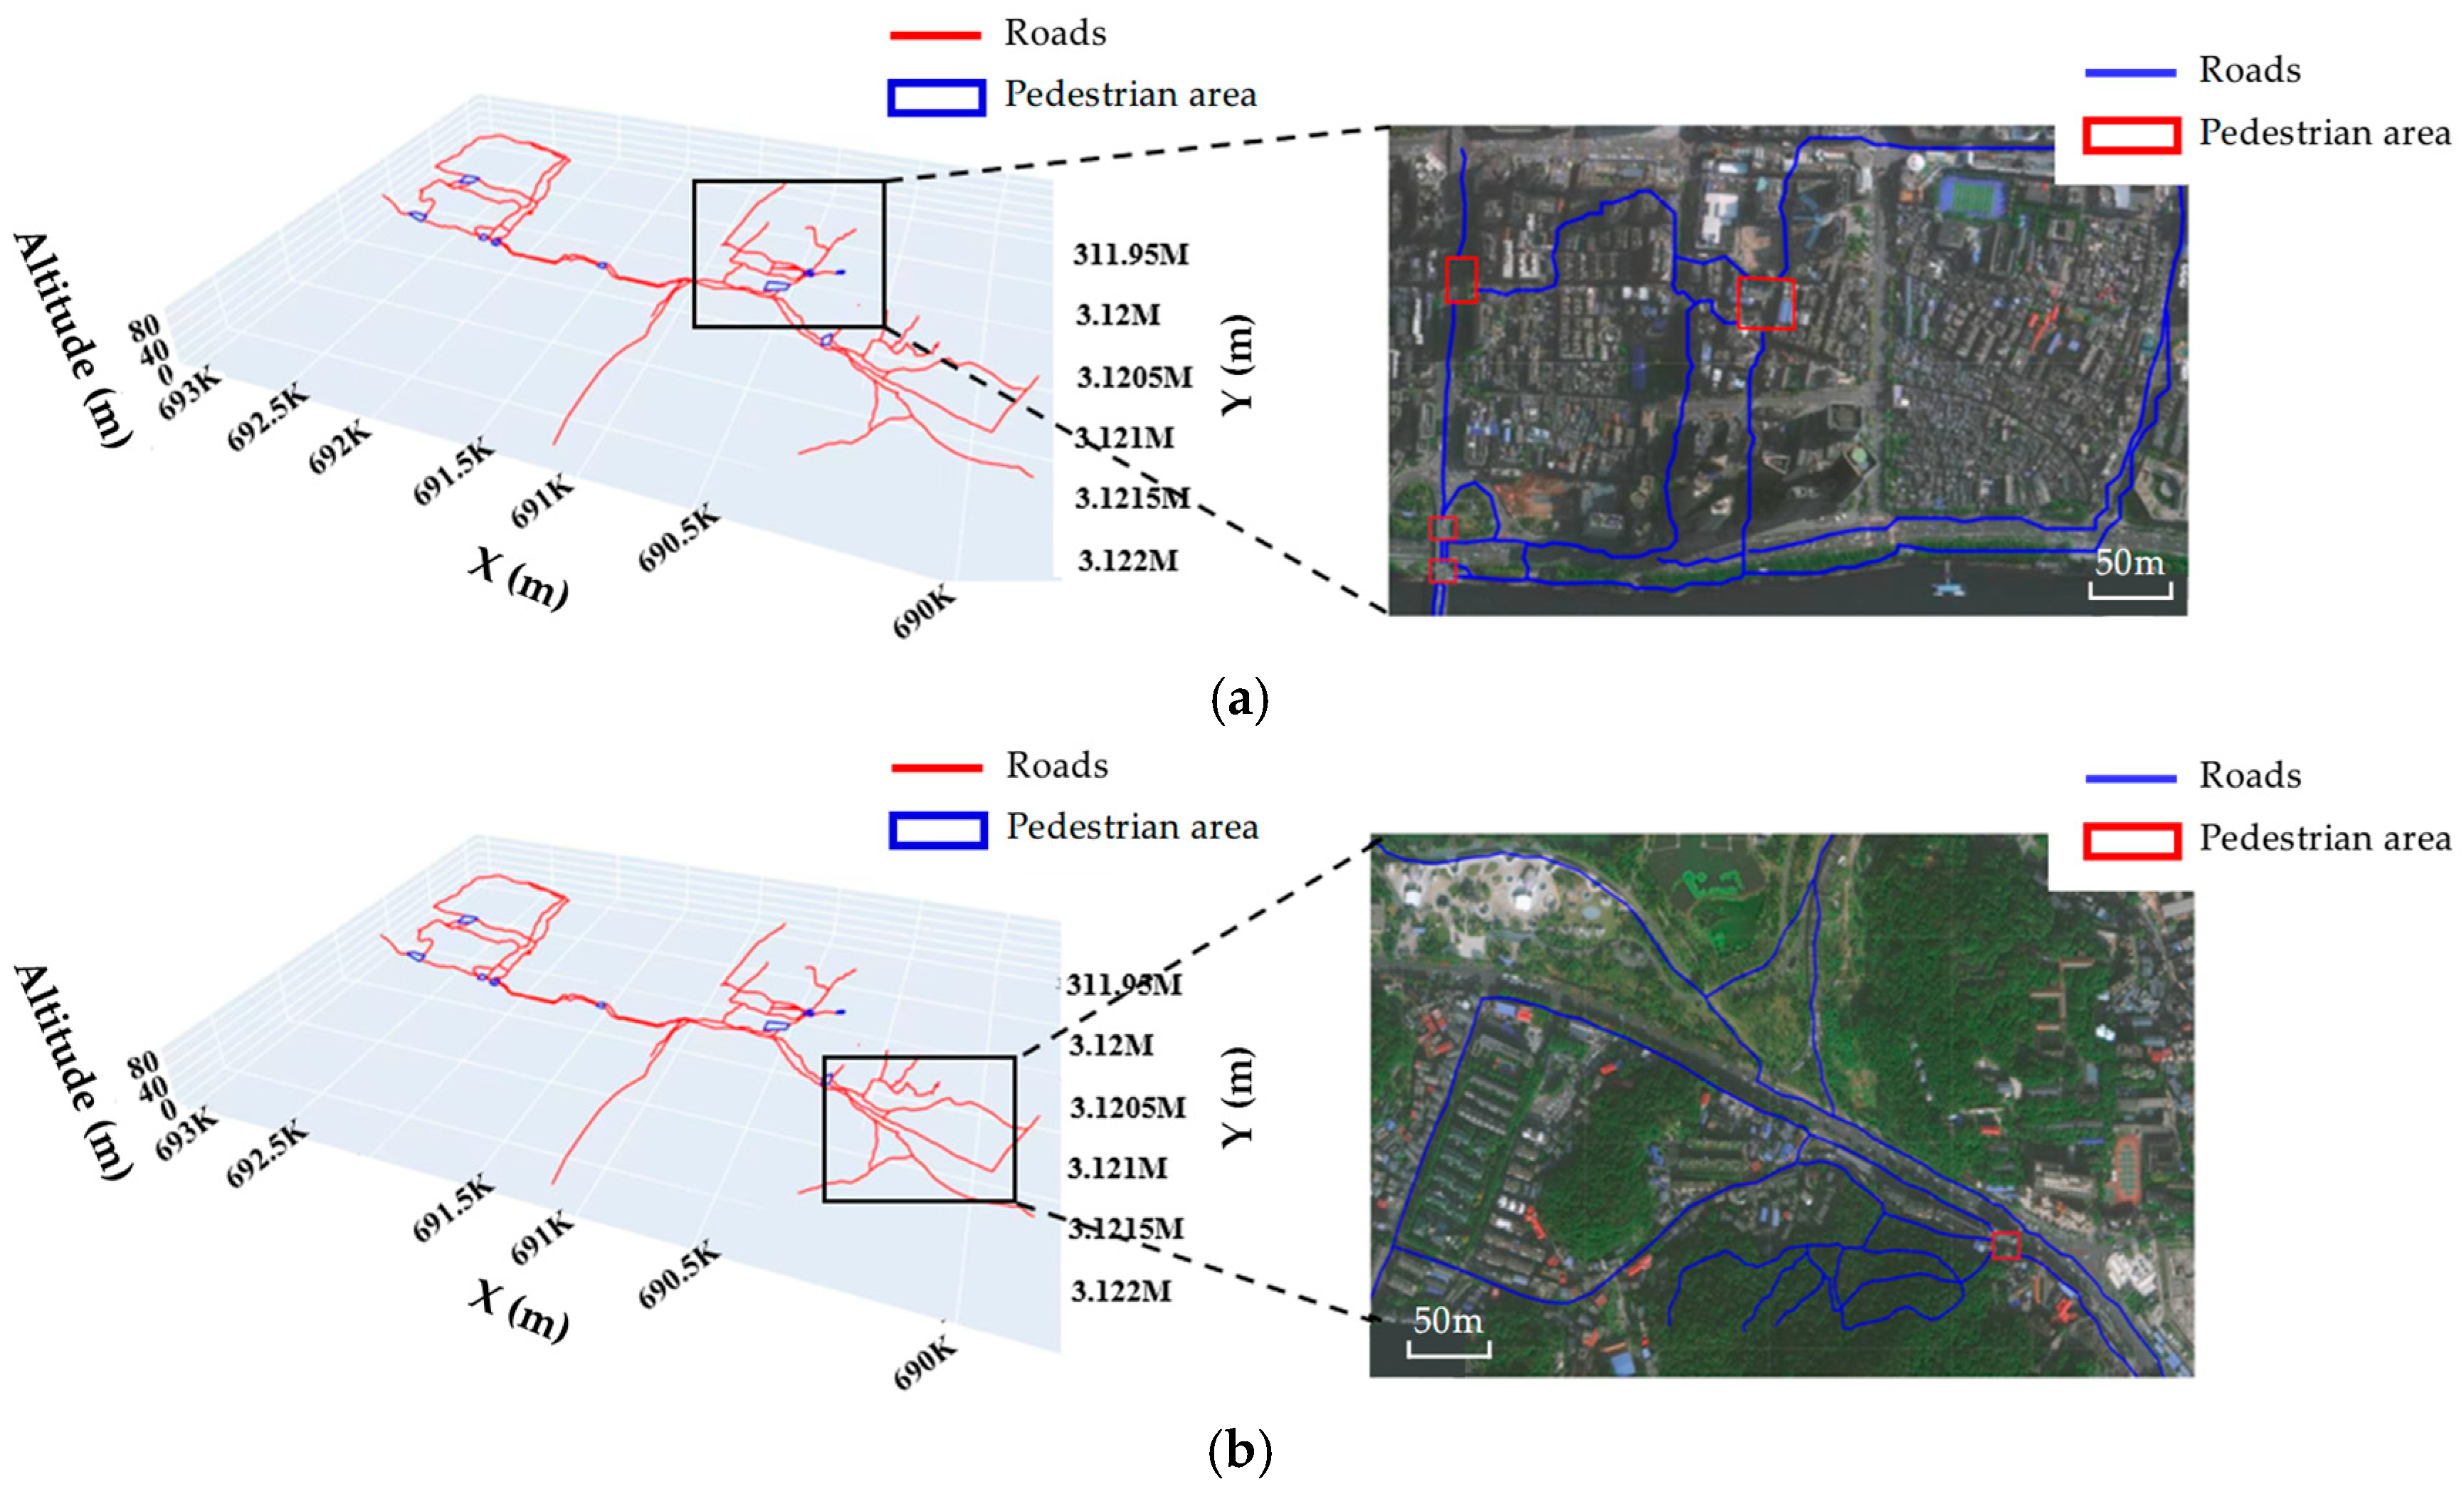
To more intuitively observe the recognition of roads and pedestrian areas by our method, we overlaid the recognition results with remote sensing images, and the obtained results are shown in Figure 17. The results show that in urban areas with flat terrain (such as streets, communities, pedestrian walkways, and other areas), our method can also correctly extract 3D roads, road intersections, and pedestrian walking areas. Although the elevation undulation is relatively small, our algorithm can still accurately extract the road structure at the three-dimensional level.
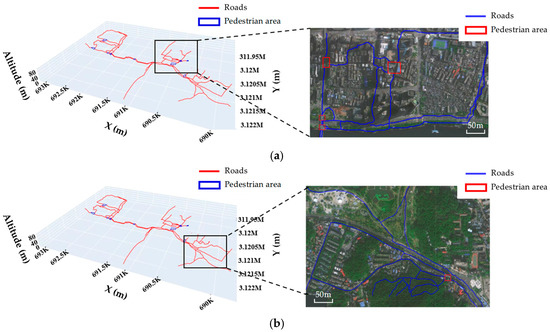
Figure 17.
Overlay the 3D pedestrian navigation road network with remote sensing images. (a) Area A; (b) Area B.
3.3. Comparative Analysis
To further verify the effectiveness of the method in this paper, quantitative indicators are used to evaluate the accuracy of the extraction results of the method in this paper, and a comparative analysis is carried out on the results of the current classic road network information extraction methods based on trajectory data. The precision, recall, and F1 scores are used to evaluate the recognition accuracy of road intersections and pedestrian areas. The specific calculation formulas are as follows:
In the formula, “correctly detected” represents the number of road intersections (or pedestrian areas) correctly identified by the algorithm, “incorrectly detected” represents the number of road intersections (or pedestrian areas) incorrectly identified by the algorithm, and “not detected” represents the number of road intersections (or pedestrian areas) not identified by the algorithm. Given that is the set of road intersection center points identified by the algorithm, is the set of road intersection center points in the research area manually labeled. For , if there exists such that (where is the distance tolerance and is set to 5 m), then the road intersection identified by the algorithm is marked as “correctly detected”; otherwise, it is marked as “incorrectly detected”; for the road intersection center point , if there does not exist such that , then is marked as the road intersection not identified by the algorithm (i.e., “not detected”).
In this experiment, when conducting the annotation, we overlaid the trajectory data with remote sensing images from Gaode Map. Through visual discrimination, we marked the coordinates of intersections in the map as the true intersection dataset. To make this part of the description clearer, we added a description of the method for annotating the data in the paper. The number of road intersection grid cells identified by the algorithm in this paper is 324, among which the number of correctly identified road intersection grid cells is 299, the number of incorrectly identified road intersection grid cells is 25, and the number of unrecognized road intersection grid cells is 98 (mainly located in the area with sparse trajectory data). To verify the effectiveness of the method in this paper, it was compared with the turning-based road intersection identification algorithm proposed in the literature [26] (hereinafter referred to as the MAMC algorithm) and the rasterization-based road intersection identification algorithm proposed in the literature [27] (hereinafter referred to as the KDE algorithm). The quantitative evaluation indicators of the results of different intersection identification methods are shown in Table 1.

Table 1.
Quantitative evaluation of different intersection identification algorithms.
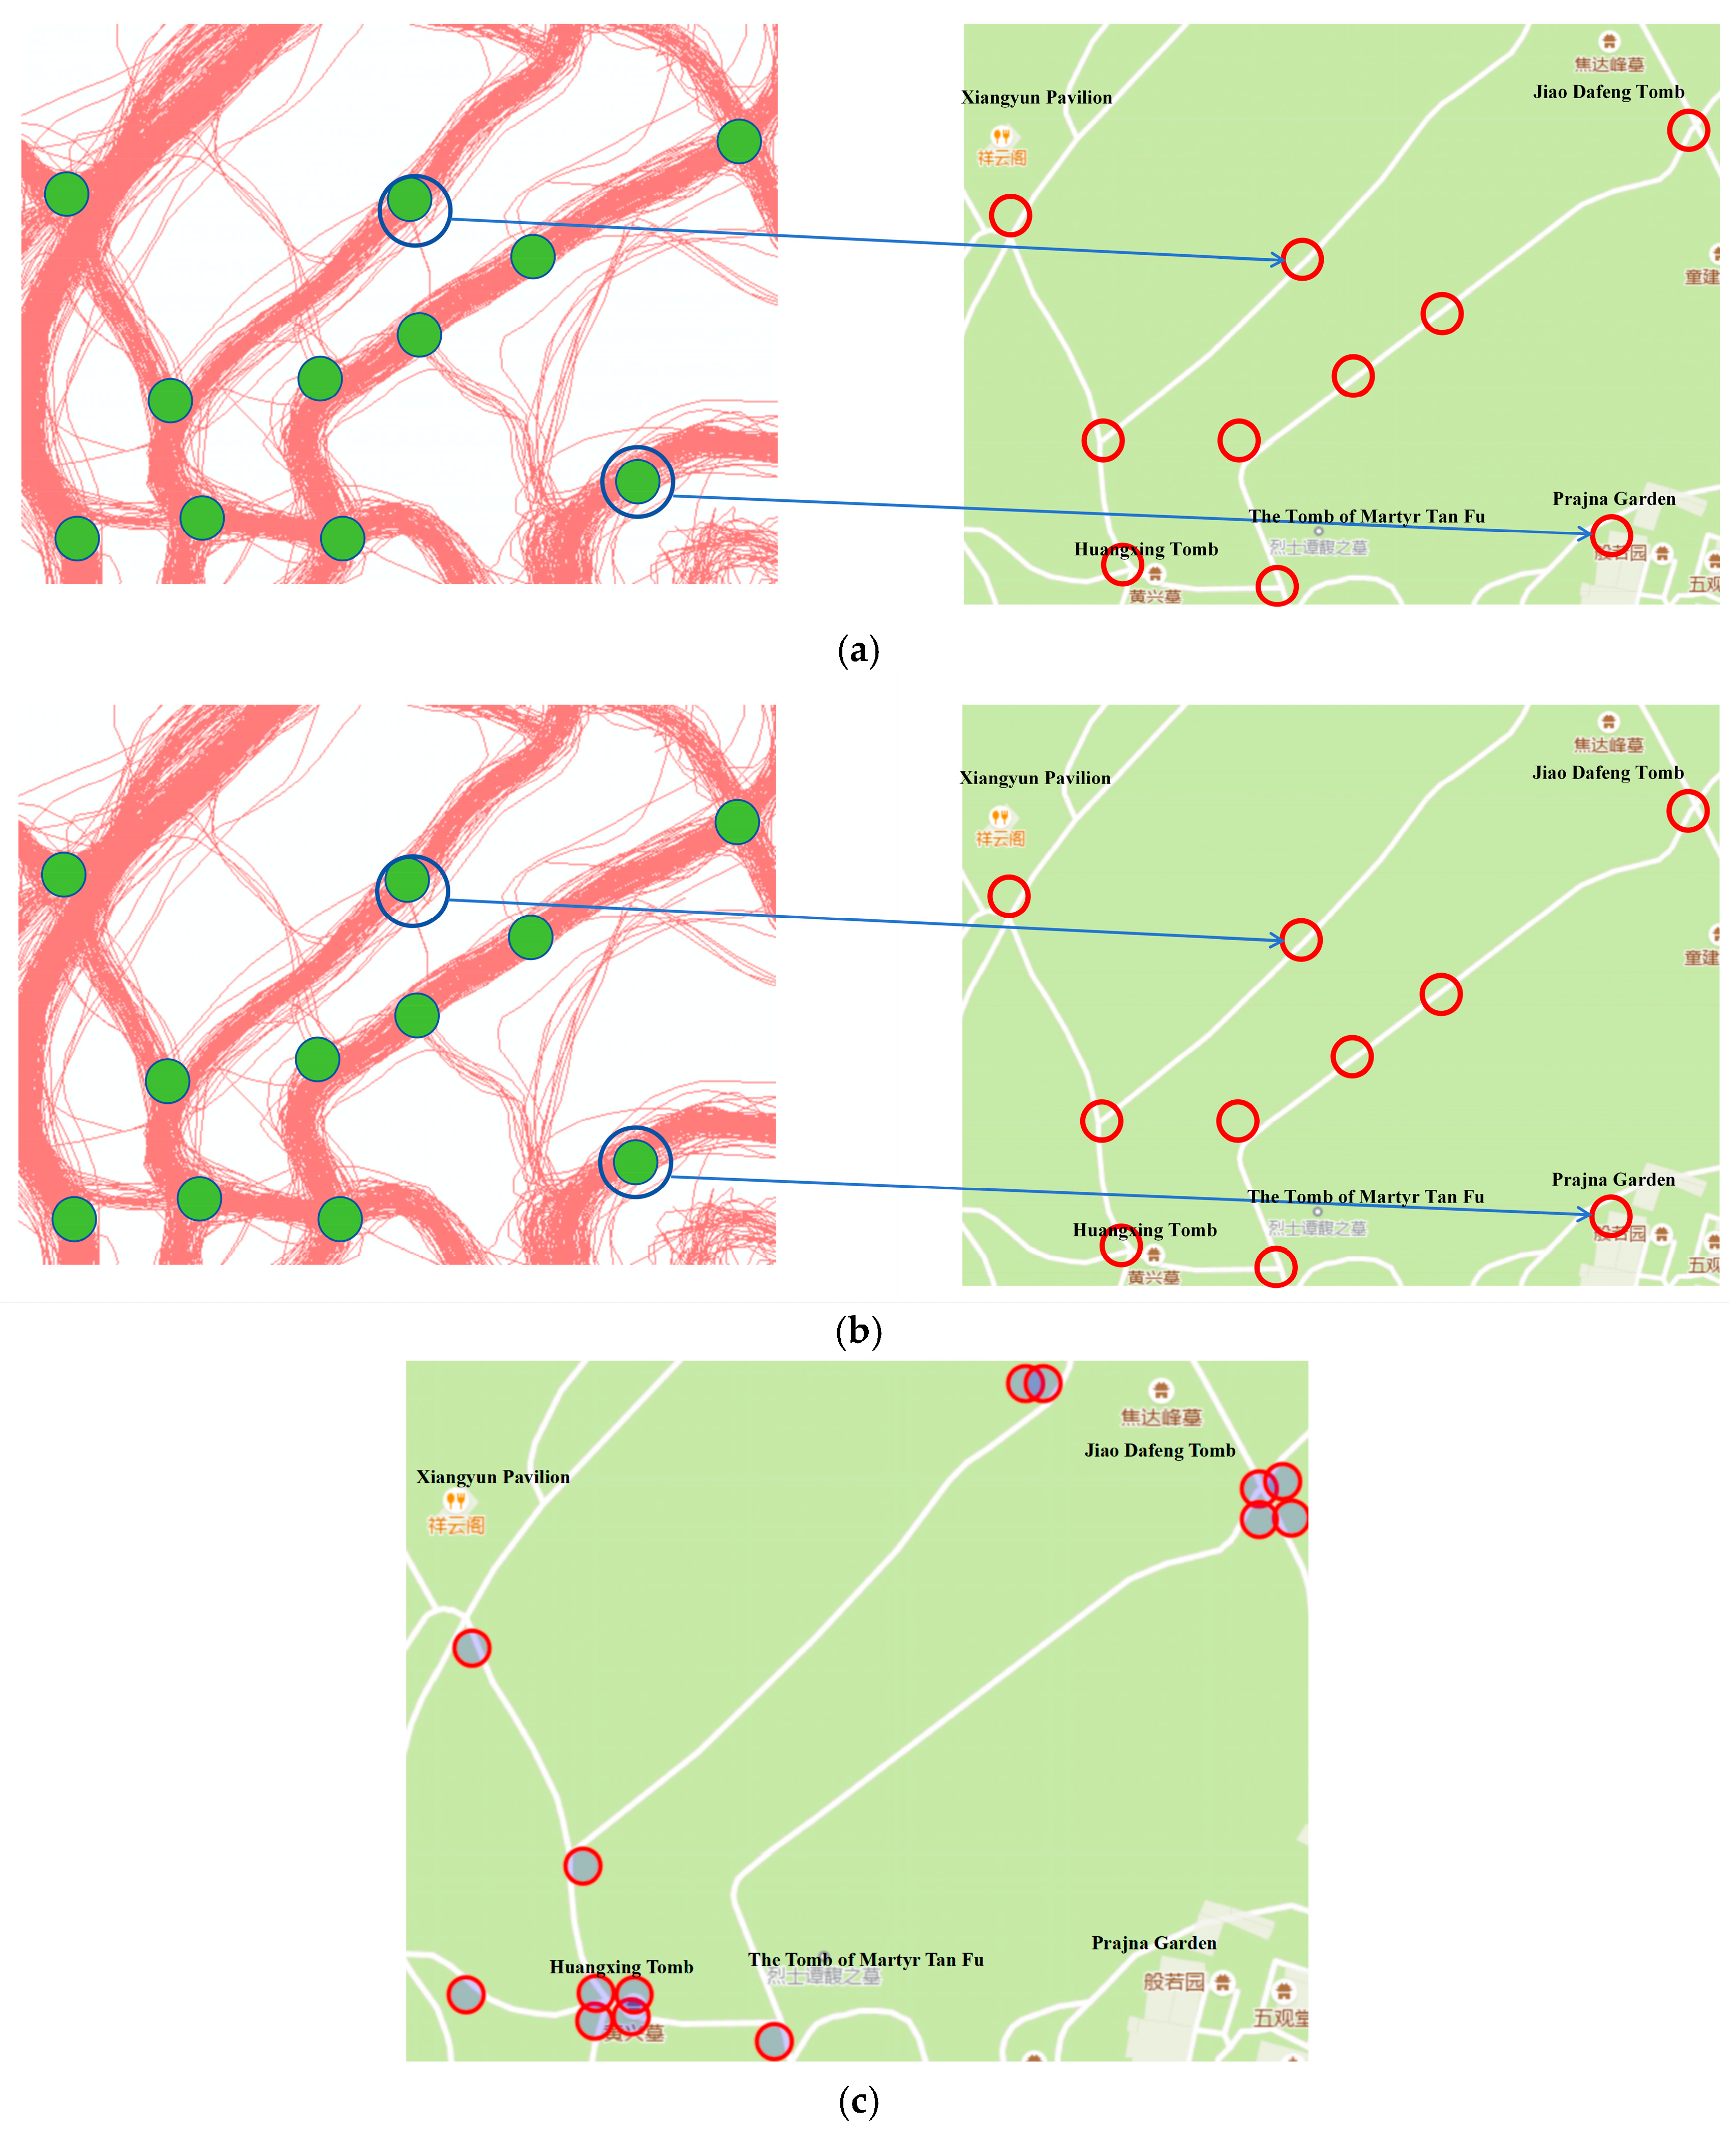
Figure 18 and Figure 19 show the road intersection identification results of the methods in this paper, the MAMC algorithm, and the KDE algorithm in the regions with uneven trajectory distribution density and the curved road section regions, respectively. It can be seen from Figure 18 that the method in this paper, the MAMC algorithm, and the KDE algorithm can all better identify the road intersections in the regions with dense trajectory data distribution. For the regions with sparse trajectory distribution, although the method in this paper may miss some road intersections in the low-density trajectory regions, it also reduces the problem of incorrect intersection identification caused by noise trajectory interference to a certain extent and ensures the accuracy of road intersection identification. Although the MAMC algorithm and the KDE algorithm have higher recall rates in identifying road intersections in outdoor scenarios and can identify road intersections in low-density regions, in outdoor scenarios, the noise trajectory interference is large, and the road complexity is higher. Compared with vehicle roads, there are more curved sections of outdoor roads. The MAMC algorithm and the KDE algorithm are likely to misidentify some curved sections with large turns as road intersection regions, as shown in Figure 19. The above reasons lead to the lower accuracy of these two algorithms.
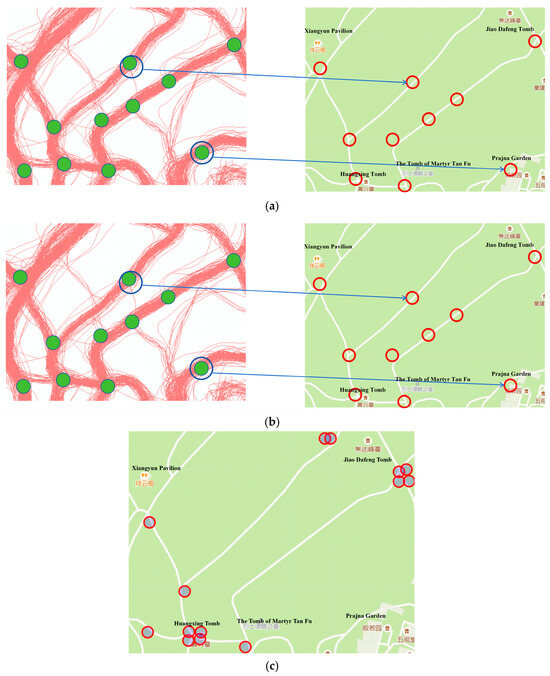
Figure 18.
The results of intersection identification in the area of uneven trajectory distribution: (a) recognition result of the MAMC algorithm; (b) recognition result of the KDE algorithm; (c) recognition result of our model.
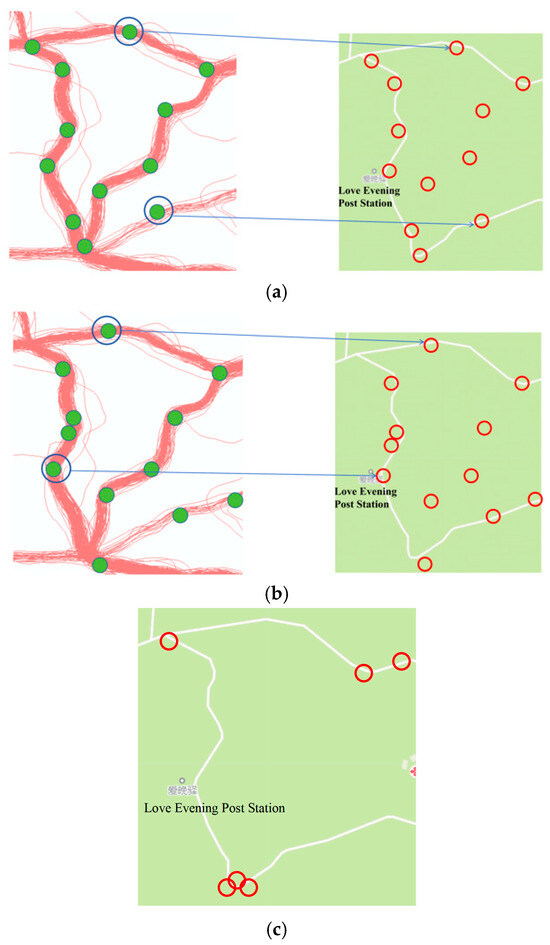
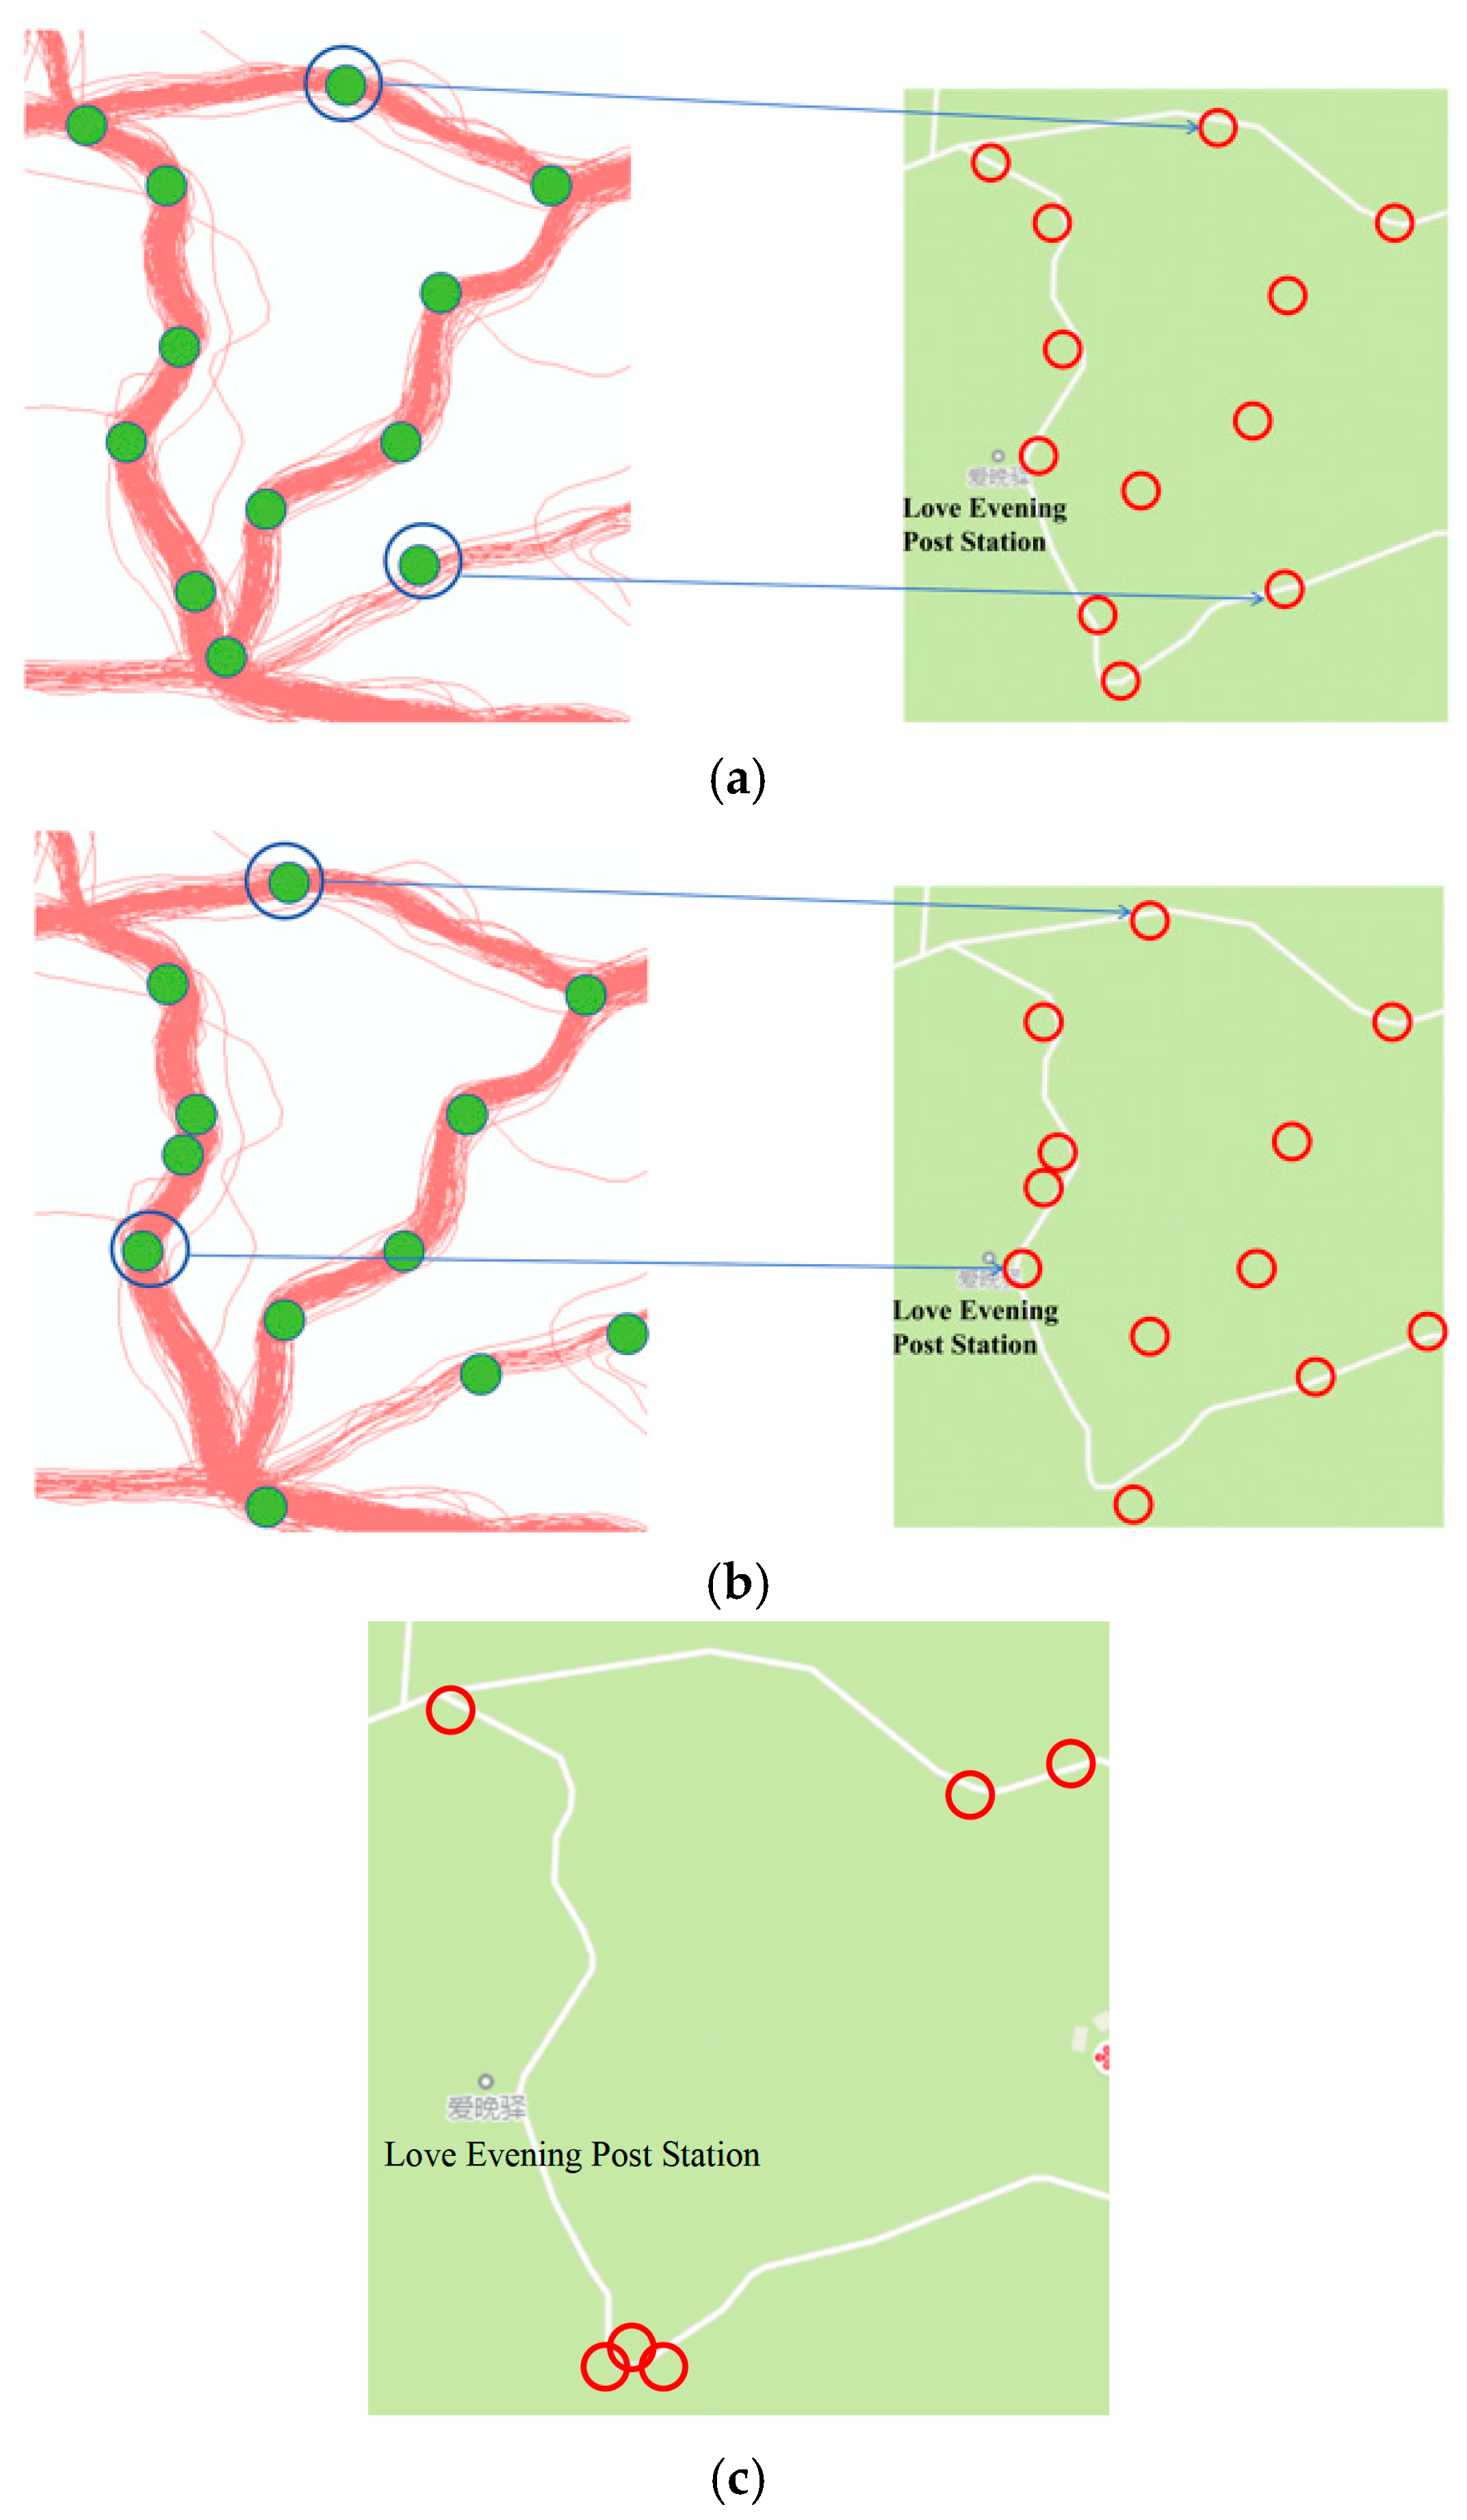
Figure 19.
The result of intersection identification in the curved section area of the road. (a) Recognition result of the MAMC algorithm; (b) recognition result of the KDE algorithm; (c) recognition result of our model.
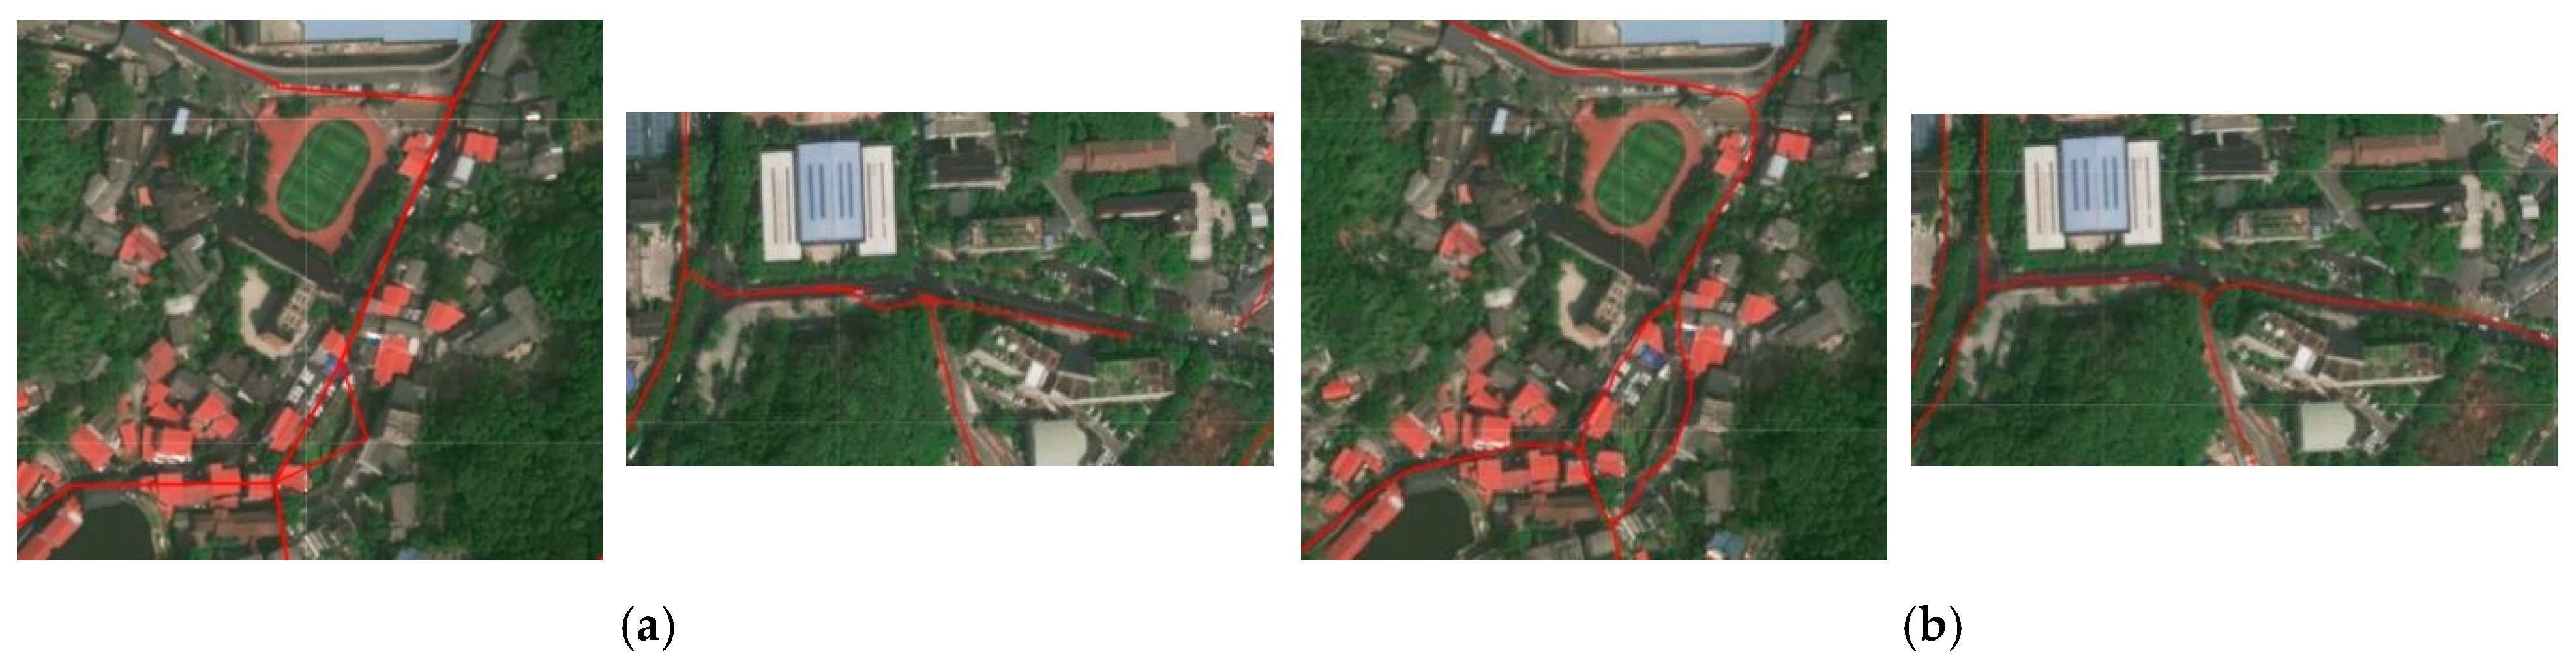
Furthermore, to verify the plane position accuracy of the road information extracted by the method in this paper, the extracted road centerlines were overlaid with Gaode Map data, Open Street Map (OSM) map data of the Yuelu Mountain area, and the remote sensing images in the non-occluded area. A total of 251 feature points (such as road center points, turning points, intersection centers, etc.) were manually labeled, and the distance deviations between the road centerlines generated by the algorithm and the manually labeled matching feature point pairs were calculated to statistically analyze the plane position accuracy of the road structure information generated by the algorithm. The results show that compared with Gaode Map and remote sensing image data, the average position deviation of the road centerlines extracted by the method in this paper is about 4.4 m, which meets the requirements of outdoor navigation applications. Figure 20 shows the overlay results of the roads extracted using the method in this paper, the classic KDE algorithm, and the remote sensing images.
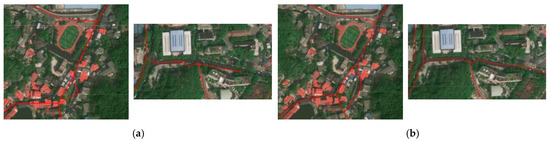
Figure 20.
Comparison of the precision of the plane position extracted using two methods (Overlay with remote sensing images): (a) Recognition results of the KDE algorithm; (b) Recognition results of our method.
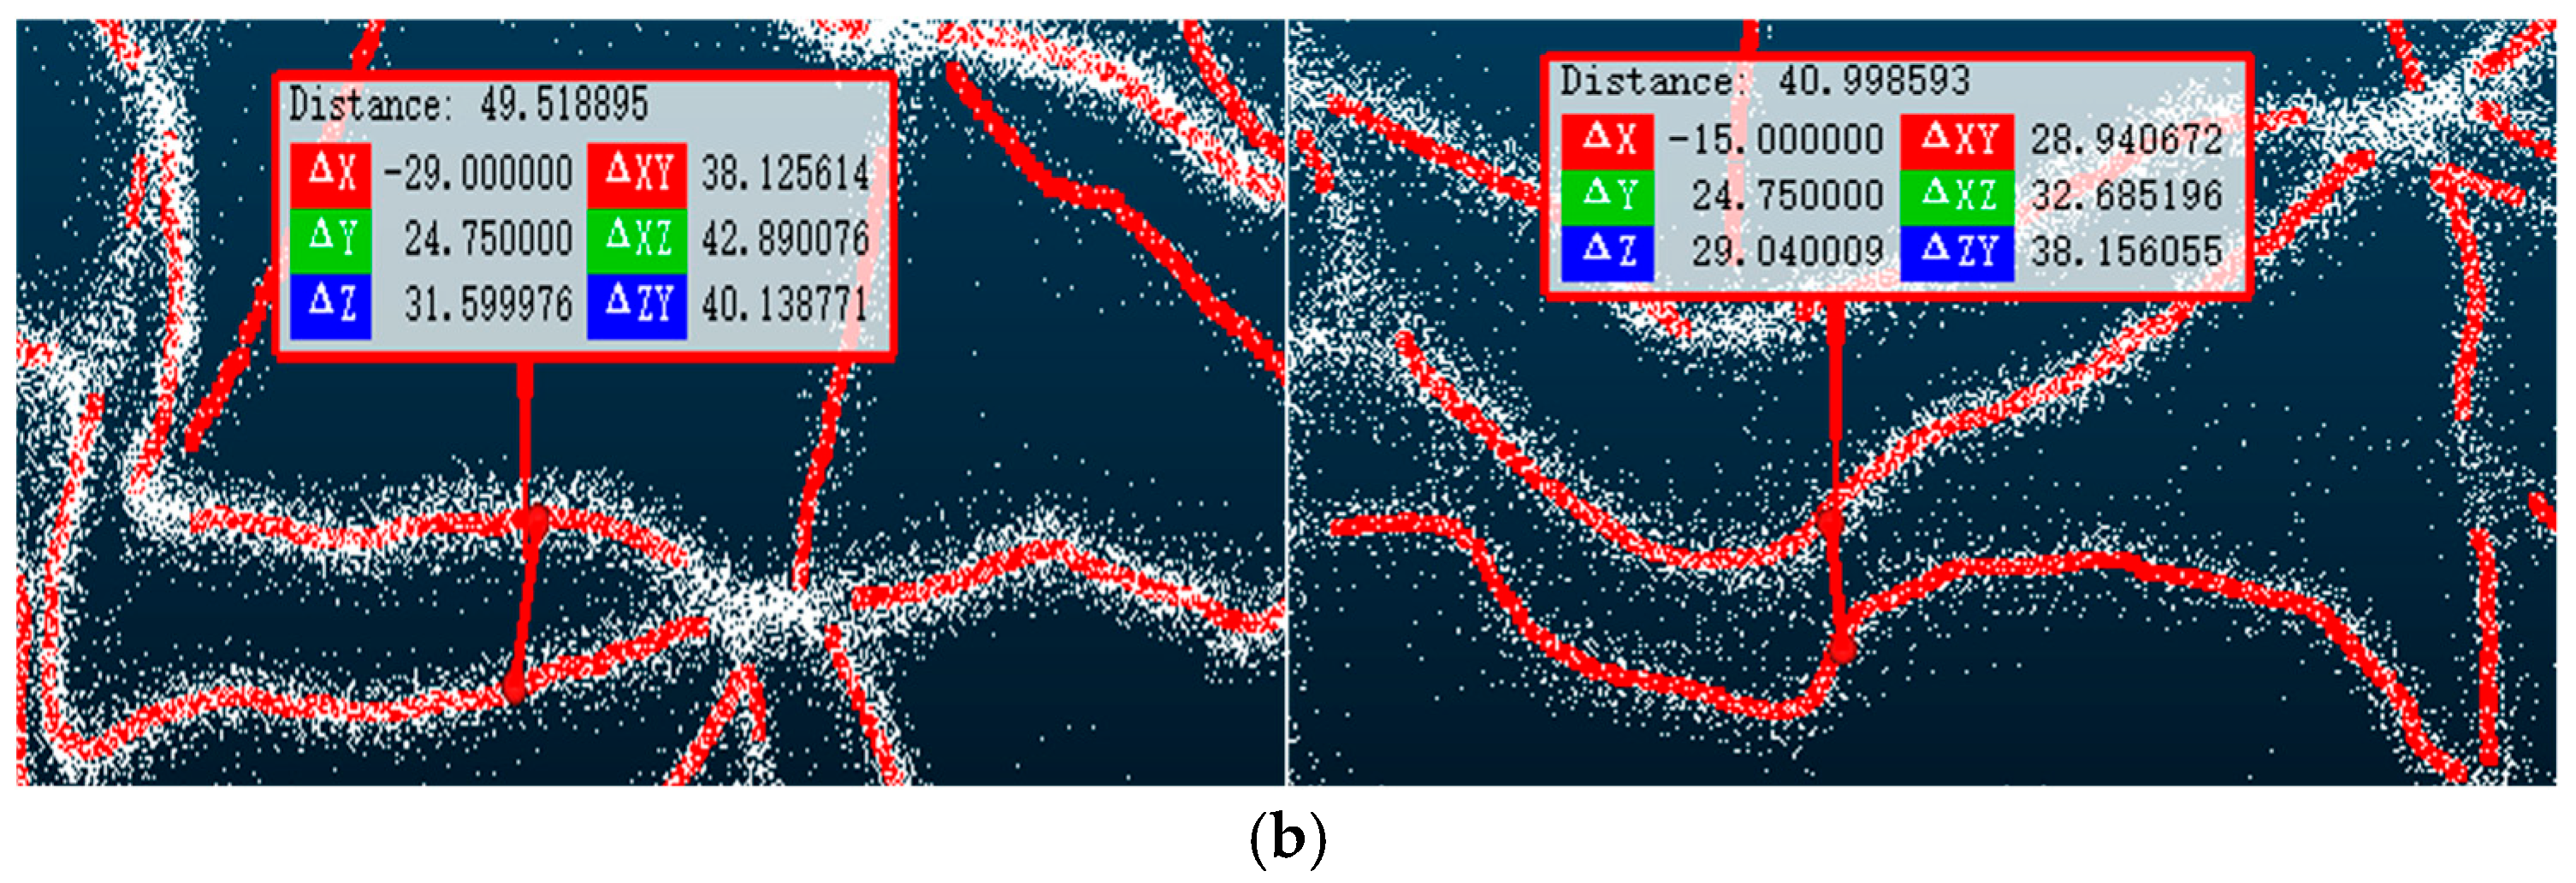
Currently, the extraction of three-dimensional road network information based on trajectory data mainly adopts a step-by-step construction strategy. That is, first, a classic two-dimensional road network extraction algorithm (such as the KDE algorithm) is used to extract the geometric structure information of the road in the two-dimensional plane. Then, the elevation information of the road in the two-dimensional plane is sampled and estimated according to the elevation information of the trajectory points to generate a three-dimensional road network. To verify the effectiveness of the three-dimensional road network construction method proposed in this paper, the classic KDE algorithm was improved in the experimental analysis. A three-dimensional road network was generated using the step-by-step construction strategy of the three-dimensional road network, and a comparative analysis was carried out with the three-dimensional road network information extracted using the method in this paper. CloudCompare (https://www.cloudcompare.org/ (accessed on 10 March 2025)) was used to perform three-dimensional visualization of the outdoor trajectory points. Figure 21 shows the road segment information in the outdoor three-dimensional road network generated by the method in this paper and the KDE algorithm. It can be found that the three-dimensional road network information extraction method based on the step-by-step construction strategy will wrongly merge some roads that are close in the plane and have no connectivity in space (the road segments shown in yellow in the figure). However, the three-dimensional road centerlines obtained using the method in this paper can better fit the three-dimensional trajectory point data (the road segments shown in red in the figure) and can extract multiple roads that are adjacent in the plane position but separated in the vertical direction.
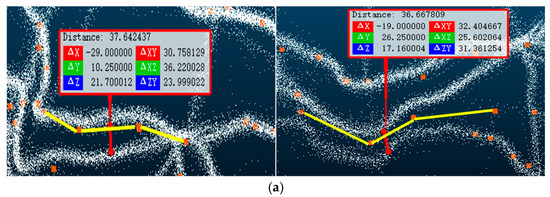
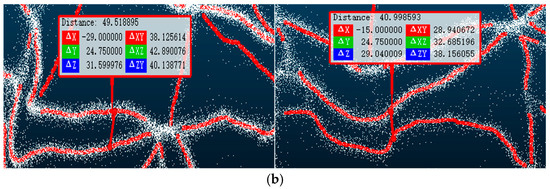
Figure 21.
Comparison of the precision of the plane position extracted using two methods: (a) 3D map construction results of the KDE algorithm; (b) 3D map construction results of our method (without showing the roads in intersections).
4. Conclusions
The rapid extraction of road network information using vehicle or pedestrian trajectory data is the key to constructing a current navigation road network map and realizing dynamic updates. Aiming at the deficiencies of existing methods in constructing outdoor three-dimensional navigation road networks, this paper utilizes multi-source data, fully summarizes the characteristics of pedestrian travel and the structure of the pedestrian road network, and fully considers the characteristics of the outdoor scene. A method for constructing a three-dimensional navigation road network map based on outdoor pedestrian trajectory data is proposed. Firstly, the quality of the three-dimensional trajectory data is improved, and the elevation quality is enhanced. Subsequently, a hierarchical construction of the outdoor three-dimensional pedestrian navigation road network is carried out using the three-dimensional trajectory data clustering method. The user hiking trajectory data of the Yuelu Mountain Scenic Area in Changsha City were used for experimental analysis. The results show that the method in this paper can generate an outdoor three-dimensional pedestrian navigation road network map with high accuracy and can solve the problems of low geometric and topological accuracy of roads in complex outdoor areas in existing methods. Compared with existing research, the main contributions of the method in this paper are as follows: (1) Currently, the preprocessing or quality improvement of trajectory data mainly focuses on two-dimensional trajectory data. In this paper, combined with the characteristics of DEM data and outdoor pedestrian trajectory data, a quality improvement method for three-dimensional pedestrian trajectory data in outdoor scenes is proposed. (2) The pedestrian navigation road network is modeled as a graph model composed of pedestrian areas, intersections, and road segments connecting these areas. A hierarchical generation method of the outdoor three-dimensional pedestrian navigation road network based on three-dimensional trajectory data clustering is proposed, which solves the problem of incorrect extraction of adjacent roads in the plane that may occur in the current three-dimensional road network distribution construction strategy and improves the accuracy and reliability of existing methods in identifying three-dimensional navigation road network information.
The proposed method in this paper relies on outdoor trajectory data and digital elevation models to extract three-dimensional road information. In some areas where trajectory data are missing, complete road information cannot be obtained. In addition, in data-sparse areas (such as rarely visited trails), the detection of road intersections may fail due to insufficient directional clustering. Future research will further integrate multi-source spatio-temporal data (such as trajectory data, remote sensing images, social media data, etc.) to enable the fine extraction and dynamic update of the geometric, topological, and semantic information of the outdoor three-dimensional navigation road network.
Author Contributions
Conceptualization, Jianbo Tang and Tianyu Zhang; methodology, Jianbo Tang and Tianyu Zhang; software, Junjie Ding and Tianyu Zhang; validation, Ke Tao and Chen Yang; investigation, Ke Tao, Chen Yang, Jianbing Xiang and Xia Ning; data curation, Junjie Ding and Tianyu Zhang; writing—original draft preparation, Jianbo Tang, Junjie Ding and Tianyu Zhang; writing—review and editing, Jianbo Tang, Junjie Ding and Tianyu Zhang; visualization, Jianbo Tang, Junjie Ding and Tianyu Zhang; supervision, Ke Tao, Chen Yang, Jianbing Xiang and Xia Ning; project administration, Jianbo Tang; funding acquisition, Jianbo Tang, Ke Tao, Chen Yang, Jianbing Xiang and Xia Ning. All authors have read and agreed to the published version of the manuscript.
Funding
This research was funded by National Key Research and Development Program of China (Grant number 2022YFB3904203), National Natural Science Foundation of China (Grant number 42271462 and 42430110), the Funds of the Science and Technology Innovation Program of Hunan Province (Grant number 2024AQ2026), the Hunan Provincial Natural Science Foundation of China (Grant number 2025JJ20038 and 2024JJ1009), Funds of Open Projects of Hunan Engineering Research Center of Geographic information security and application (Grant number HNGISA2024001), Funds of Open Projects of Hunan Geospatial Information Engineering and Technology Research Center (Grant number HNGIET2024002), and the Funds of the Key Laboratory of Target Cognition and Application Technology (Grant number 2023-CXPT-LC-005). This work was partly carried out using computing resources at the High–Performance Computing Platform of Central South University.
Data Availability Statement
The raw data supporting the conclusions of this article will be made available by the authors on request.
Conflicts of Interest
The authors declare no conflicts of interest.
Abbreviations
| 3D | Three-Dimensional |
| 2D | Two-Dimensional |
| ALOS | Advanced Land Observing Satellite |
| DBSCAN | Density-Based Spatial Clustering of Applications with Noise |
| DEM | Digital Elevation Model |
| GPS | Global Positioning System |
| GIS | Geographic Information System |
| OSM | OpenStreetMap |
| RMSE | Root Mean Square Error |
References
- Ariffin, R.N.; Zahari, R.K. Perceptions of the Urban Walking Environments. Procedia-Soc. Behav. Sci. 2013, 105, 589–597. [Google Scholar] [CrossRef]
- Farkisch, H.; Ahmadi, V.; Che-Ani, A.I. Evaluation of neighborhood center attributes on resident’s territoriality and sense of belonging a case study in Boshrooyeh, Iran. Habitat Int. 2015, 49, 56–64. [Google Scholar] [CrossRef]
- Fonseca, F.P.; Ribeiro, P.J.; Jabbari, M.; Petrova, E.; Papageorgiou, G.; Conticelli, E.; Tondelli, S.; Ramos, R.A. Smart Pedestrian Network: An Integrated Conceptual Model for Improving Walkability. In Society with Future: Smart and Liveable Cities; Lecture Notes of the Institute for Computer Sciences, Social Informatics and Telecommunications Engineering; Springer: Cham, Switzerland, 2019; pp. 125–142. [Google Scholar]
- Kasemsuppakorn, P.; Karimi, H.A. A pedestrian network construction algorithm based on multiple GPS traces. Transp. Res. Part C Emerg. Technol. 2013, 26, 285–300. [Google Scholar] [CrossRef]
- Yang, X.; Tang, L.; Ren, C.; Chen, Y.; Xie, Z.; Li, Q. Pedestrian network generation based on crowdsourced tracking data. Int. J. Geogr. Inf. Sci. 2019, 34, 1051–1074. [Google Scholar] [CrossRef]
- Weston, R.; Mota, J.C. Low Carbon Tourism Travel: Cycling, Walking and Trails. Tour. Plan. Dev. 2012, 9, 1–3. [Google Scholar] [CrossRef]
- Jabbari, M.; Fonseca, F.; Smith, G.; Conticelli, E.; Tondelli, S.; Ribeiro, P.; Ahmadi, Z.; Papageorgiou, G.N.; Ramos, R. The Pedestrian Network Concept: A Systematic Literature Review. J. Urban Mobil. 2023, 3, 100051. [Google Scholar] [CrossRef]
- Deng, M.; Luo, B.; Tang, J.B.; Yao, Z.P.; Liu, G.P.; Wen, X.; Hu, R.B.; Chai, H.; Hu, W.K. Extracting road intersections from vehicle trajectory data in the face of trace density disparity. Acta Geod. Cartogr. Sin. 2023, 52, 1000–1009. [Google Scholar]
- Zhang, C.L.; Xiang, L.G.; Li, Y.L.; Wang, W.L. Construction of navigable road network based on taxi trajectories. Acta Geod. Cartogr. Sin. 2021, 50, 1650. [Google Scholar]
- Ahmed, M.; Karagiorgou, S.; Pfoser, D.; Wenk, C. A comparison and evaluation of map construction algorithms using vehicle tracking data. Geoinformatica 2015, 19, 601–632. [Google Scholar] [CrossRef]
- Agamennoni, G.; Nieto, J.I.; Nebot, E.M. Robust Inference of Principal Road Paths for Intelligent Transportation Systems. IEEE Trans. Intell. Transp. Syst. 2011, 12, 298–308. [Google Scholar] [CrossRef]
- Edelkamp, S.; Schrodl, S. Route planning and map inference with global positioning traces. In Computer Science in Perspective; Springer: New York, NY, USA, 2003; Volume 2598, pp. 128–151. [Google Scholar]
- Shi, W.; Shen, S.; Liu, Y. Automatic generation of road network map from massive GPS, vehicle trajectories. In Proceedings of the 12th International IEEE Conference on Intelligent Transportation Systems, St. Louis, MO, USA, 4–7 October 2009; pp. 1–6. [Google Scholar]
- Huang, J.C.; Deng, M.; Zhang, Y.F.; Liu, H.M. Complex road intersection modelling based on low-frequency GPS track data. Int. Arch. Photogramm. 2017, XLII-2/W7, 23–29. [Google Scholar] [CrossRef]
- Deng, M.; Huang, J.C.; Zhang, Y.F.; Liu, H.M.; Tang, L.L.; Tang, J.B.; Yang, X. Generating urban road intersection models from low-frequency GPS trajectory data. Int. J. Geogr. Inf. Sci. 2018, 32, 2337–2361. [Google Scholar] [CrossRef]
- Wan, Z.J.; Li, L.Y.; Yang, M.; Zhou, X.D. Decision tree model for extracting road intersection feature from vehicle trajectory data. Acta Geod. Cartogr. Sin. 2019, 48, 1391–1403. [Google Scholar]
- Yao, Z.P.; Peng, C.; Tang, J.B.; Liu, G.P.; Yang, X.X.; Liu, H.M.; Deng, M. An adaptive road centerline extraction method for different trajectory data scenarios based on combinatorial optimization. Acta Geod. Cartogr. Sin. 2024, 53, 379–390. [Google Scholar]
- Ahmed, M.; Wenk, C. Constructing street networks from GPS trajectories. In Proceedings of the European Symposium on Algorithms, Ljubljana, Slovenia, 10–12 September 2012; pp. 60–71. [Google Scholar]
- He, S.; Bastani, F.; Abbar, S.; Alizadeh, M.; Balakrishnan, H.; Chawla, S.; Madden, S. RoadRunner: Improving the precision of road network inference from GPS trajectories. In Proceedings of the 26th ACM SIGSPATIAL International Conference on Advances in Geographic Information Systems (SIGSPATIAL ’18), Seattle, WA, USA, 6–9 November 2018; Association for Computing Machinery: New York, NY, USA, 2018; pp. 3–12. [Google Scholar]
- Zhao, Y.; Wang, G.; Yang, J.; Li, T.; Li, Z. AU3-GAN: A Method for Extracting Roads from Historical Maps Based on an Attention Generative Adversarial Network. J. Geovisualization Spat. Anal. 2024, 8, 26. [Google Scholar] [CrossRef]
- Xu, Y.; Shi, Z.; Xie, X.; Chen, Z.; Xie, Z. Residual Channel Attention Fusion Network for Road Extraction Based on Remote Sensing Images and GPS Trajectories. IEEE J. Sel. Top. Appl. Earth Obs. Remote Sens. 2024, 17, 8358–8369. [Google Scholar] [CrossRef]
- Wang, H.; Wu, Y.; Han, X.; Xu, M.L.; Chen, W.Z. Automatic generation of large-scale 3D road networks based on GIS data. Comput. Graph. 2021, 96, 71–81. [Google Scholar] [CrossRef]
- Cao, L.; Krumm, J. From GPS traces to a routable road map. In Proceedings of the 17th ACM SIGSPATIAL International Conference on Advances in Geographic Information Systems, Seattle, WA, USA, 4–6 November 2009; pp. 3–12. [Google Scholar]
- Ester, M.; Kriegel, H.-P.; Sander, J.; Xu, X. A Density-Based Algorithm for Discovering Clusters in Large Spatial Databases with Noise; Institute for Computer Science, University of Munich: Munich, Germany, 1996; pp. 226–231. [Google Scholar]
- Adrián, H.C.; Zanón, B.B.; Alfonso, S.P.; Doležel, P. Comparison of Geospatial Trajectory Clustering and Feature Trajectory Clustering for Public Transportation Trip Data. In Hybrid Artificial Intelligence Systems; Springer: Cham, Switzerland, 2023; pp. 60–71. [Google Scholar]
- Lyu, H.; Pfoser, D.; Sheng, Y. Movement-aware map construction. Int. J. Geogr. Inf. Sci. 2021, 35, 1065–1093. [Google Scholar] [CrossRef]
- Biagioni, J.; Eriksson, J. Map inference in the face of noise and disparity. In Proceedings of the ACM 20th International Conference on Advances in Geographic Information Systems, Redondo Beach, CA, USA, 6–9 November 2012; pp. 79–88. [Google Scholar]


Disclaimer/Publisher’s Note: The statements, opinions and data contained in all publications are solely those of the individual author(s) and contributor(s) and not of MDPI and/or the editor(s). MDPI and/or the editor(s) disclaim responsibility for any injury to people or property resulting from any ideas, methods, instructions or products referred to in the content. |
© 2025 by the authors. Published by MDPI on behalf of the International Society for Photogrammetry and Remote Sensing. Licensee MDPI, Basel, Switzerland. This article is an open access article distributed under the terms and conditions of the Creative Commons Attribution (CC BY) license (https://creativecommons.org/licenses/by/4.0/).